Investigation and Mitigation of Insulated Joint Electrical Failure: A Guide (2025)
Chapter: Appendix D: System Technical Descriptions

APPENDIX D
System Technical Descriptions
Contents
Chapter D-1 Purpose and Background
Chapter D-2 Train Control Track Circuits
Chapter D-3 DC Traction Power Systems
Basic DC Traction Power Systems
Modeling Traction Power Systems
Chapter D-5 Rail Bonding and Connections
TPNR Bonding/Cable Connections
Onboard Power and Return Distribution
Chapter D-7 Electrical Resistance in the Track
Chapter D-9 DC Electric Arc Welding
Diagnosis of IJ Arcing Based on Principles of Arc Welding
Chapter D-1 Purpose and Background
Purpose
One objective of the TRB TCRP Project D-20, “Investigation and Mitigation of Insulated Joint Electrical Failure,” was to diagnose insulated joint (IJ) electrical failures and determine the best mitigation. Electrified railways involve numerous subsystems that must work in concert for efficient train operations. IJ arcing can be an indication of issues with these various systems or how they are interacting with each other. This appendix provides details of some of the various systems and how they relate to each other, to provide users of this guide with the background needed to diagnose their unique IJ arcing issues and determine the best mitigations for their unique situation.
Background
IJs are special rail splices that mechanically connect rail ends and electrically isolate the connected rails. The electrical separation in rails provided by IJs is required for the train control (signaling) systems that govern train operations and prevent conflicts in the movements of trains. IJs are also used to isolate traction power negative return (TPNR) in adjacent track segments. Different devices and strategies used to allow TPNR to bypass the IJs should still provide electrical isolation between the rail ends required for the train control systems.
Electrified railways experiencing the IJ arcing covered in this study distribute the electric traction power as direct current (DC) using either contact (third) rail or overhead contact wire/catenary (OHC) systems. Some properties have trains that use alternating-current (AC) traction motors. On these trains, the DC power collected from the traction power system is converted to AC power onboard the trains to power the AC traction motors that drive the trains. Any power drawn by trains from a particular traction power substation (TPSS) must be returned to that same TPSS. Traction power is returned to TPSSs primarily using the running rails of the tracks, in addition to cables and bonding (cable connections). This return circuit is called TPNR.
TPNR is not the same as an electrical earth ground; it is a separate electrical circuit. Electrical potential difference exists between the TPNR and earth, and the difference in electrical energy can be significant at tens of volts and thousands of amps or more. TPNR systems are electrically isolated from earth ground to control stray currents that can damage the rail and adjacent electrically conductive infrastructure.
After the introduction of new vehicle fleets with AC traction motors, some DC electric railways noted IJ failures due to electrical arcing. Electrical arcing is not normal in electrified railways and is indicative of other underlying issues. Typically, IJ arcing and associated rail damage are caused by symptoms of other issues that create excessive TPNR electrical potential differences at the rails joined by the IJs, by a mechanical or insulation failure in the IJ assemblies. Where arcing occurs at IJs, the running rails, IJs, train control systems, and equipment on trains can be damaged, and the impacts are further compounded by delays to train operations caused by the arcing damage. While IJ arcing can occur on electrified railways with AC power distribution systems, the mitigation efforts are very different from those for DC systems and are outside the scope of this work.
Chapter D-2 Train Control Track Circuits
Track circuits have been supporting different safety and operational roles for railroad signaling since the early 1900s. Early track circuits were used mainly to indicate track occupancy of the track ahead of the train to the train crew. In its simplest form, a track circuit is made up of a track
block, defined as the rail between a set of IJs, a power source, and a relay connected to the signal power source and track signals. Figure D-1 and Figure D-2 show examples of what a track block would look like and the basic components within a track circuit. Track circuits use the running rails to complete the circuit.
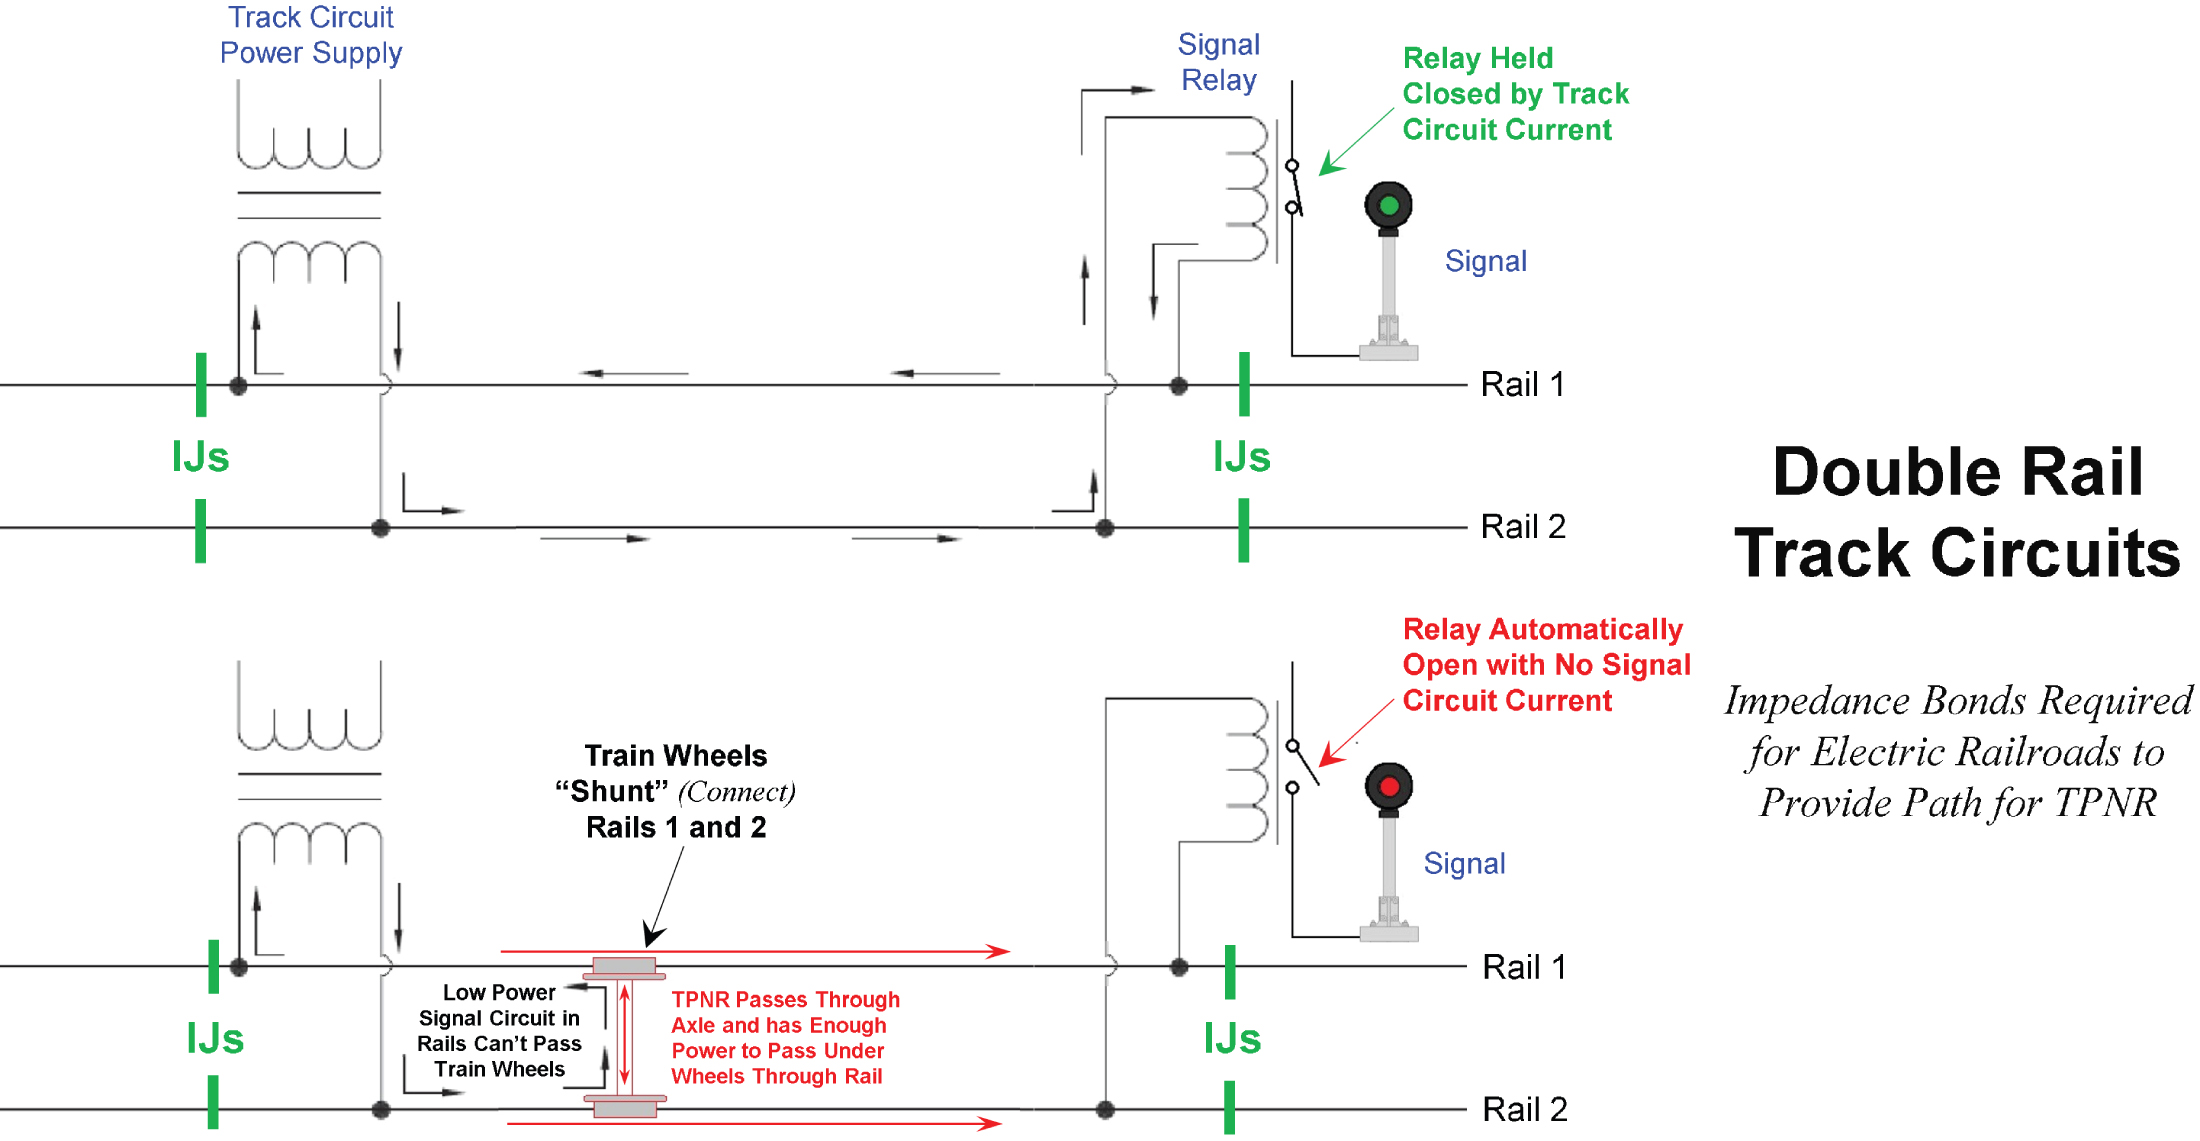
Long Description.
The illustration shows two tracks with rails marked as rail 1 and rail 2. The track circuit power supply is on the left, while a signal relay with the relay held closed by track circuit current is on the right. The TPNR is continuous along the bottom rail (Rail 2). At the bottom track, the train wheels shunt (connect) rails 1 and 2, and the relay automatically opens with no signal circuit current.
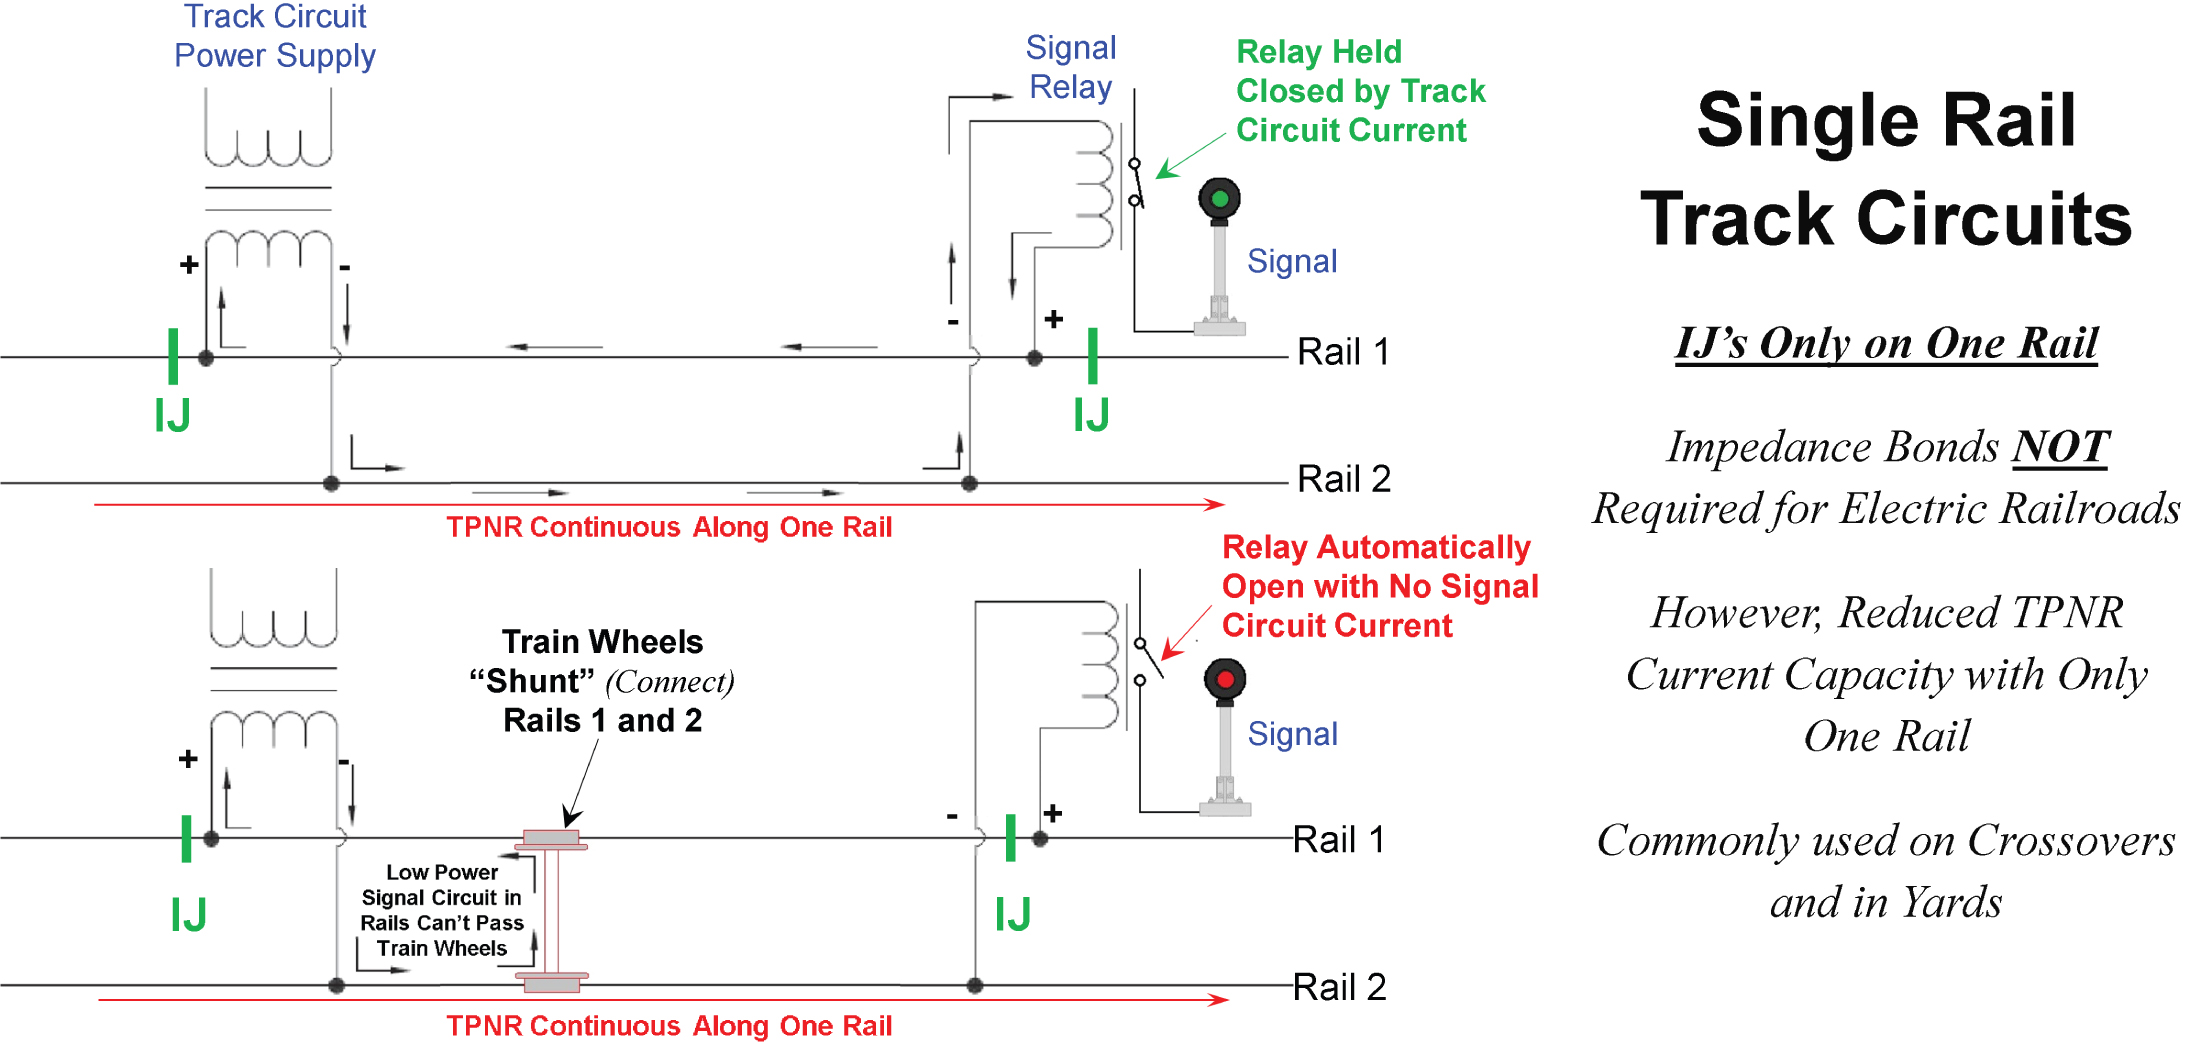
Long Description.
The illustration shows two tracks with rails marked as rail 1 and rail 2. The track circuit power supply is on the left, while a signal relay with the relay held closed by track circuit current is on the right. The TPNR is continuous along the bottom rail (Rail 2). In the bottom track, the train wheels shunt (connect) rails 1 and 2, and the relay automatically opens with no signal circuit current.
By detecting the absence of the signal within the track block, track circuits can detect occupancy of a track block that is isolated by IJs on each end of the block. The absence of the signal could be due to a train shunting the rail, a broken rail within the block, a loss of power from the track circuit, failure of the IJs, or a loss of connection between the signaling equipment and the rail. Railroad signaling is implemented in a failsafe manner such that absence of a signal in the track circuit will result in the display of a red, or a dark, signal. The display of a more permissive signal aspect is dependent on receiving a signal from the track circuit.
Track circuits can also be tied to switches, hazard detectors, movable bridges, and more, to display signals that convey an upcoming train route or display a stop signal when a hazard is detected or a switch position in front of the train is unknown.
With communication-based train control (CBTC) systems, track circuits are not required. Train position and route information can be determined without the need for track circuits. CBTC systems monitor switch positions, hazard detectors, movable bridges, other wayside features, and the location and status of trains using the Global Positioning System. However, track circuits can not only detect which track circuits are occupied by trains but also identify some (but not all) broken rails. Where CBTC is implemented, a reliable alternative method to detect broken rails may be required.
For more details on train control track circuits and train control systems, reference the American Railway Engineering and Maintenance-of-Way Association Communications and Signals Manual (AREMA 2025b), Railroad Signaling (Soloman 2003), and Automatic Train Control in Rapid Transit (U.S. Congress, Office of Technology Assessment 1976).
Chapter D-3 DC Traction Power Systems
Basic DC Traction Power Systems
On DC electrified railways, AC power is received from the local power grid. This power is commonly provided to the electric railway TPSSs as three-phase AC electricity at very high voltages (e.g., 110,000V). The railway electrical TPSSs step this current down to voltage used (typically 650V to 1,500V) and rectify the AC to DC. Full-wave rectification is typically used to provide more stable DC power (see Figure D-3). Transmission of electricity is more efficient at high voltages than at lower voltages. Some electrified railways will also distribute AC electricity separately along its right-of-way between the feed locations from the local power grid to accommodate TPSSs where grid feeds are not available and to provide a backup source if power from one of the grid feeds is lost. For more information on railroad traction power system design reference: AREMA C&S Manual (AREMA 2025b), AREMA MRE (AREMA 2025a), Railroad

Long Description.
The vertical axis for voltage has markings as negative square root 3 V subscript peak, negative V subscript peak, 0, V subscript peak, and square root 3 V subscript peak. The horizontal axis represents time. Three sinusoidal curves depict the 3-phase AC input. A rising and falling curve at the top depicts rectified DC output.
Electrification and the Electric Locomotive (Mason 1923), and Electrical Railway Transportation Systems (Brenna, Foiadelli, and Zaninelli 2018). No correlation between the type of rectification used and the occurrence of IJ arcing was found.
The DC voltages provided along the right-of-way (via OHC or third rail) are less efficient, limiting the transmission distances. TPSSs must be placed close enough to limit any voltage drop that can occur over distance or from expected power loads between TPSSs. On mainline tracks, each electrical section is typically double fed with two TPSSs feeding each section, one at each end. These double feeds provide additional power and backup power if there is a failure at one of the TPSSs (see Figure D-4).
Basic TPNR
The return circuit (TPNR) for the traction power system is typically carried through the running rails. Since the rails are already required to support the train, they are considered conductors of convenience. The TPNR circuits in the running rail are made more complex since the running rails are also shared with the train control track circuits.
Impedance bonds are used to allow the TPNR to bypass the IJs needed for the train control system and balance the current flow between the two rails. Cross bonds are used to balance the TPNR current between adjacent tracks. Additional bonding is used to provide an electrical path around track components that do not provide a reliable electrical path (e.g., frogs and switches). Each device creates resistance in the TPNR circuit, resulting in imbalances between adjacent rails and tracks and at the rail ends at IJs. If the running rails and electrical connections have sufficient capacity, the imbalances will be minimized. However, if they have insufficient capacity for the loads being applied, the differences in potential can become excessive enough to allow arcing to occur at IJs (see Figure D-5 through Figure D-7).
Modeling Traction Power Systems
The traction power system on electrified railways does not provide unlimited power. The design of the traction power system is primarily based on the loads the system needs to support. The design of the traction power system will be significantly different if short lightweight trains are

Long Description.
The illustration shows two tracks with rails marked as running rails and with a cross bond between the tracks. The running rails carry both traction power negative return (TPNR) and train control track circuits. A traction power substation is at each end of the track. A line at the top above the top track is marked a third rail or catenary. A line at the bottom below the bottom track is marked third rail or catenary. The single track circuit and impedance bond are along the tracks. Three bonds marked along the track are A Bond, B Bond, and C Bond.

Long Description.
The illustration shows two tracks marked track 1 and track 2 with rails marked rail 1, rail 2, rail 3, and rail 4. The text at the top reads, IJ arcing is directly related to TPNR imbalances and difference in potential between the rail ends when a train passes over an IJ. The rails are coded with different colors, and the text reads, each color represents running rail segments with a possible difference in TPNR electrical potential.

Long Description.
The illustration shows two tracks with a crossover. The text at the top reads, IJ arcing is directly related to TPNR imbalances and difference in potential between the rail ends when a train passes over an IJ. The rails are coded with different colors, and the text reads, each color represents running rail segments with a possible difference in TPNR electrical potential.

Long Description.
The illustration shows a track with rails marked rail 1 and rail 2. An insulated rail joint is in the middle with a meter to measure the potential difference installed at the joint. The rails are coded with different colors, and the text reads, each color represents running rail segments with a possible difference in TPNR electrical potential. The text reads, significant difference in electrical potential can generate sparks as wheels pass over IJ. Destructive arcing occurs with sufficient energy (amperes) to melt the rail.
used than if the same system uses longer and heavier cars. Traction power design is complex, and there are many factors that must be considered to ensure the system can supply the electrical energy required for the expected loads, including, but not limited to the following:
- Vehicle weight
- Vehicle horsepower
- Train consist lengths (number of cars per train)
- Train acceleration rates
- Train density (number of trains in a given area, at any point in time)
- Number of tracks
- Station locations
- Track grades
- Track curvature
- Maximum track design speeds
- Locations of speed restricted areas and more
These items, and many more factors that must be considered in the design of the traction power system and cannot be considered separately, are all interrelated. If the requirements change for one item, other factors are affected. For example, if a new station is added, the loads on the traction power system increase because the trains must accelerate out of the station, and, therefore, require more power. If that same station is adjacent to steep ascending grades, even more power is needed to accelerate the train up the grade from the station stop.
Sophisticated computer software capable of modeling the unique power loads found on the transits and electrified railways with high power electrical systems exists (Hetherington and White 2007; Kulworawanichpong 2015). The level of sophistication in some of these models includes “what if” capabilities that also include planned and future train schedules, intermittent loads from special events, or when the trains fall out of the planned schedules (e.g., train bunching due to delays or extra special event trains).
Most traction power system design drawings only detail the power supply (TPSS, TPSSs to track, and third rail/OHC) and assume the track has unlimited capacity for the TPNR, relying on assumed values of resistance per linear unit of trackway. Other software models the TPNR system as the complex system that it is, showing each component (e.g., rail segments, each cable, connection) as a separate node on a micro level that allows analysis of each component [see Figure D-8 and Figure D-9 (Jacob 2024)]. Modeling and designing the TPNR system can prevent IJ arcing and be used to determine the root causes of IJ arcing on existing systems. Further recommended research that will support improved modeling is detailed in Appendix F.
Chapter D-4 Impedance Bonds
For AC or DC traction powered railways, the power is provided to the train from TPSSs supplying current to the train using OHC or third rail. Electrified railways use the running rails as the main path for the return circuit to the TPSS. If a railway has continuous welded rail or bonded rail, the return current has a low impedance path back to the TPSSs, and the rails can be cross-bonded to support the even distribution of the return current evenly between the running rails.
In areas where a railway has both signaled track circuits and an AC or DC traction powered system, the traction power return circuit does not have a direct path back to the TPSS due to the use of IJs that isolate the rails between track circuits along the path needed for the return current. Bonding around the IJs to allow the return current a path through the rail could introduce issues with the signaling system not having a complete circuit within a signal block and cause signal blocks to show occupied when no trains are present or even worse, unoccupied when a train is present based on a track signal for an adjacent block.

Long Description.
The illustration shows two tracks marked track 1 and track 2. Each track has four lines marked in sequence from top to bottom as parallel feeder, overhead catenary, left rail, and right rail. A fifth line in track 2 at the bottom is marked earth ground. Each track has many points along the rails marked as OCS, RL, and RR.

Source: Jacob 2024.
Impedance bonds are used at IJs locations to provide a return current path through the IJ that adds impedance to the current. Measured in ohms, impedance is made up of pure resistance and reactive resistance and can be defined as the measure of the opposition that a circuit presents to a current when voltage is applied. Resistors have the same effect on both AC and DC current, and the voltage drop across the resistor is equal to the magnitude of the current multiplied by the resistance. Reactive resistance is introduced to a circuit by adding capacitive and/or inductive components to the circuit; it also adds resistance to a circuit based on the circuitʼs frequency. Using the properties of reactive resistance, the impedance of a circuit can be selected to add low impedance at certain frequencies and high impedance at other frequencies.
While track circuits are typically 100 Hz or greater, the return current used in electrified railways is typically 50–60 Hz for AC power and ∼0 Hz for DC power. Because DC power does not have a change in current, the reactive components of an impedance bond do not have any effect on the return current, and the resistance seen by the DC current comes only from the pure resistance components. Impedance bonds can be tuned so the total resistance for traction return power can be in the fractions of an ohm while the total resistance for the frequencies used by the track circuit can be higher. This tuning results in track circuit signal attenuation through the impedance bond that is high enough to keep the track blocks isolated from one another while allowing the traction power return current a low impedance path through the IJs (see Figure D-10 and Figure D-11).
Chapter D-5 Rail Bonding and Connections
TPNR Bonding/Cable Connections
TPNR cables are connected using a variety of connection types. A cableʼs current carrying capacity is determined by its size, the conductor materials, and the stranding. The capacity of the connector must meet or exceed the capacity of the cable it connects, or unnecessary resistance will be created. Each component and its connections can have differences in resistance and current carrying capacities. These differences can generate imbalances in the TPNR system that can lead to IJ arcing.
Types of Connections
A variety of connection types are used for TPNR cables. Some electrified railways standardized the connection types to reduce the number of parts that need to be maintained in stock and the tools required for field staff. In any given track segment, there can be hundreds of bonds and

Long Description.
The illustration shows a track with rails marked rail 1 and rail 2. An insulated rail joint is in the middle with a center tap and magnetic core on the left and right. The TPNR and signal circuits can’t pass through IJs. The text reads, Rail 1 and Rail 2 train control circuits cannot pass through the magnetic core or center tap.

electrical connections that can affect the TPNR system. Interlockings and special trackwork will significantly increase the number of cables and connections. The advantages and disadvantages of the various types are outside the scope of this guide, but resources that provide additional information are available (Reed, House, and Davis 2008; Reiff, Hawken, and Davis 2011; Sun et al. 2004; Parsons Brinckerhoff, Inc., Metro Tech Consulting Services, Engineering & Architecture, P.C., Track Guy Consultants, and Wilson, Ihrig, & Associates, Inc. 2012; Korkmaz 2024; AREMA 2025a; AREMA 2025b).
The simplest of bonds can have multiple subcomponents. Figure D-12 shows examples of bonds for rail joints. Each bond has three separate components, one connection at each rail end and the bond cable. Poor performance of any one of the subcomponents of the bond can have negative impacts on the TPNR system. More complex components can include a significant number of connections, including crimp connections, bolted connections, cables, and more. Figure D-13 shows an impedance bond with 53 different connections in view. Any loose, corroded, or broken connections could impact the performance of the TPNR system. Figure D-14 through Figure D-17 provide additional examples of TPNR bonding.
Chapter D-6 On-Track Vehicles
AC Traction Motors
In the past, DC traction motors were considered the only technically feasible option for electric trains. Electrified railways where AC power was distributed along the right-of-way typically used OHC to invert the power to DC onboard the trains to power the DC traction motors. Recent


technological advances now allow the use of AC traction motors to power trains. Solid state controls on the vehicles are used to invert the DC power supplied to the trains (OHC or third rail) to AC (see Figure D-18; Wikipedia 2025a). Additionally, these control systems can dynamically vary the frequency of the AC power provided to the traction motors to improve performance.
Compared to DC traction motors, AC traction motors provide the following benefits:
- Improved adhesion
- Lower operating costs
- Reduced maintenance
- Improved reliability
- Energy savings
- Smoother acceleration
- Enhanced regenerative braking capabilities

Long Description.
The vertical axis is labeled negative volts at the bottom and positive volts at the top. The horizontal axis is labeled times. A set of vertical bands above and below the horizontal axis depicts pulsed direct current (DC), and a sinusoidal curve through these bands depicts the resulting alternating current.
A key benefit of AC traction motors is their provision for increased adhesion, which allows more pulling power per pound of vehicle weight. For more information on AC traction motors see the following: Reed, House, and Davis 2008; Parsons Brinkerhoff, Inc., Metro Tech Consulting Services, Engineering & Architecture, P.C., Track Guy Consultants, and Wilson, Ihrig, & Associates, Inc. 2012; and Korkmaz 2024.
Onboard Power and Return Distribution
There are a variety of strategies that can be used to collect and distribute electrical power on electric trains and electric multiple units (EMUs). Power collection and distribution on trains is integral to the design of the traction power system, including TPNR. The layout of IJs and the locations of IJs in reference to propulsion power segments must be integrated into the way vehicles collect and return the power. Without this integration, the power a train receives from a TPSS could have no engineered path for its return to the originating TPSS, which can have negative impacts on the overall system (e.g., poor vehicle performance, stray currents, IJ arcing). Figure D-19 through Figure D-22 provide examples of different traction power system distribution configurations.
Any power supplied by a TPSS must be returned to that same TPSS. The TPNR return paths should be planned and engineered. If the onboard distribution systems are not coordinated with the design and layout of the distribution segments (OHC/third-rail sectionalization) and TPNR

Long Description.
The illustration shows two cars along the track with each set of wheels connected to an overhead traction power supply. The line for traction power negative return is at the bottom.

Long Description.
The illustration shows two cars along the track with wheels of each car connected to an overhead traction power supply. The line for traction power negative return is at the bottom.
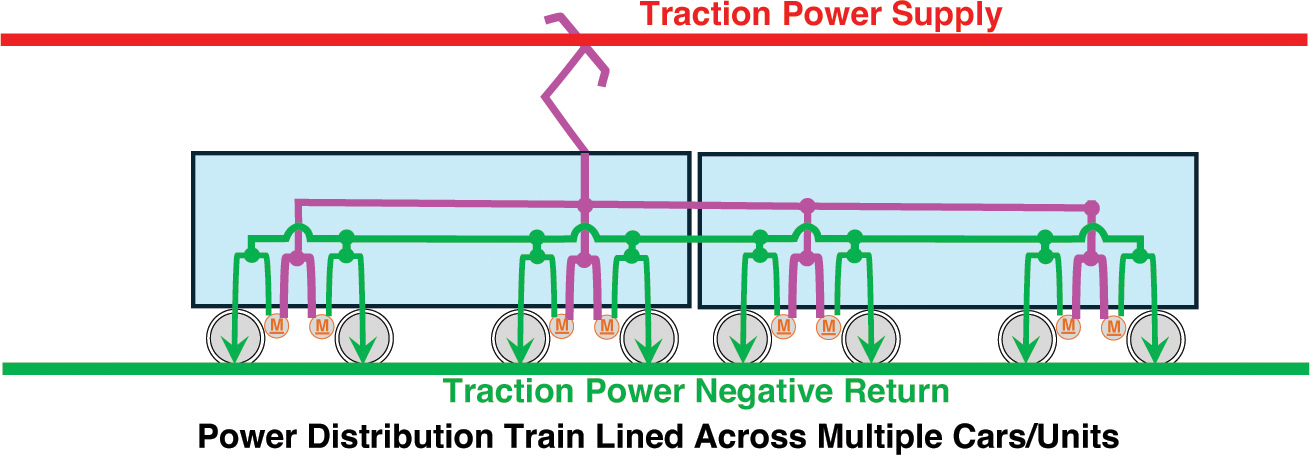
Long Description.
The illustration shows two cars along the track with wheels of each car connected to a common line, which is then connected to an overhead traction power supply. The line for traction power negative return is at the bottom.

Long Description.
The illustration shows two cars along the track with wheels of each car connected to an overhead traction power supply. The line for traction power negative return is at the bottom.
in the trackway, the TPNR may be returned to the TPSS using unplanned pathways or unplanned paths that have a high resistance. Where the TPNR path is divided by IJs, and any alternate return path has too much resistance, arcing may occur as the train passes over the IJ as the TPNR attempts to return to the originating TPSS. When investigating IJ arcing issues, the power and TPNR distribution configuration on the trains should be considered and reviewed for its possible contribution to the IJ arcing issue. Additional research is recommended to further investigate this issue (see Appendix F).
Arcing Damage to Vehicles
When IJ arcing occurs, the wheels act as a switch that connects and disconnects the rail ends as they pass, initiating the arcing. Damage similar to that seen on the rail can also be seen on the wheels. The damage to the train wheels differs from the damage found on the rail ends—wheel damage occurs randomly while the rail ends at IJs are exposed to repeated damage in the same
place as arcing events reoccur with repeated train passes. The wheels, however, are exposed to the same metallurgical damage the arcing inflicts on the IJ rail ends. When indications of IJ arcing are identified in the field, the vehicle maintenance team should be alerted, so it can scrutinize the wheels for any possible damage, particularly wheels on the last axle of the passing trains.
In low-level events, it is likely that any visual signs of the arcing event are worn away from the tread of the wheels while the underlying metallurgical damage may remain. If high-level destructive IJ arcing occurs, secondary arc flash damage to the underside of the vehicle may be present and may aid in identifying affected vehicles. The secondary damage may include metal splatters and areas darkened by the heat and smoke generated by the event. Blown fuses or other damage to sensitive onboard electronic equipment may also be present (see Figure D-23).
TPNR Axle Slip Rings
While the electrical power is gathered using third-rail collector shoes, pantographs, or trolley poles, the TPNR is returned to the track through the wheels. On electric transit vehicles, slip-ring systems are used to provide a reliable electrical path between the wheels, trucks, and car body.

Long Description.
Each photo highlights the damage caused to the underside of the vehicle. The burn marks and damage marks to different parts are visible in these photos.
Without this system, the TPNR could travel through the bearings and other car components and result in arcing damage due to the unreliable connections (see Figure D-24).
Bearing Damage from Arcing
Excessive electrical potential between the rail ends at IJs can also damage wheel and axle bearings on equipment not designed to operate on electrified railways. Electric trains have slip-ring systems that provide a good electrical path that bypasses the bearings and truck assemblies. Other vehicles, such as foreign freight cars (standard cars that do not normally operate on electrified railways), maintenance equipment, hi-rail vehicles, and more, can experience damage when passing over IJs that have a significant difference in electrical potential (see Figure D-25). Further research is recommended on this issue (see Appendix F).
On many electrified railways, the TPNR is interconnected throughout wide areas and may be shared between multiple TPSSs. Electrical potential from the TPNR can exist in the running

Long Description.
The photo on the left has an arrow pointing to a metal cover. The arrow is marked axle slip ring cover. The photo on the right depicts a view of the rotating axle ring (cover and brushes removed), has slip ring brushes marked.

Long Description.
The photo on the left shows a cylindrical part with damaged edges. The caption reads, Figure 1.9, pitting, resulting from electric current passing through the bearing. Bearing parts affected must be rejected, Rule 1.15.12. The photo on the right shows an enlarged view of the edge. The caption reads, Figure 1.10, fluting or corrugation, resulting from electric current passing through a rotating bearing. Bearing parts affected must be rejected, Rule 1.15.12.
rails even if trains are not operating on nearby tracks. If the traction power is turned off for maintenance work, TPNR current can be present in the running rails from trains operating in other areas. If the TPNR for different segments is separated by IJs, the TPNR from the different segments can be electrically connected as vehicles pass over the IJs, bridging the TPNR between the different segments. Maintenance or other vehicles used on electrified railways, including the portions of the maintenance equipment that contact the running rails when in work mode, should have the wheels and bearings insulated, or the vehicles should be equipped to handle possible TPNR electrical loads that may occur.
Chapter D-7 Electrical Resistance in the Track
Rail Electrical Resistance
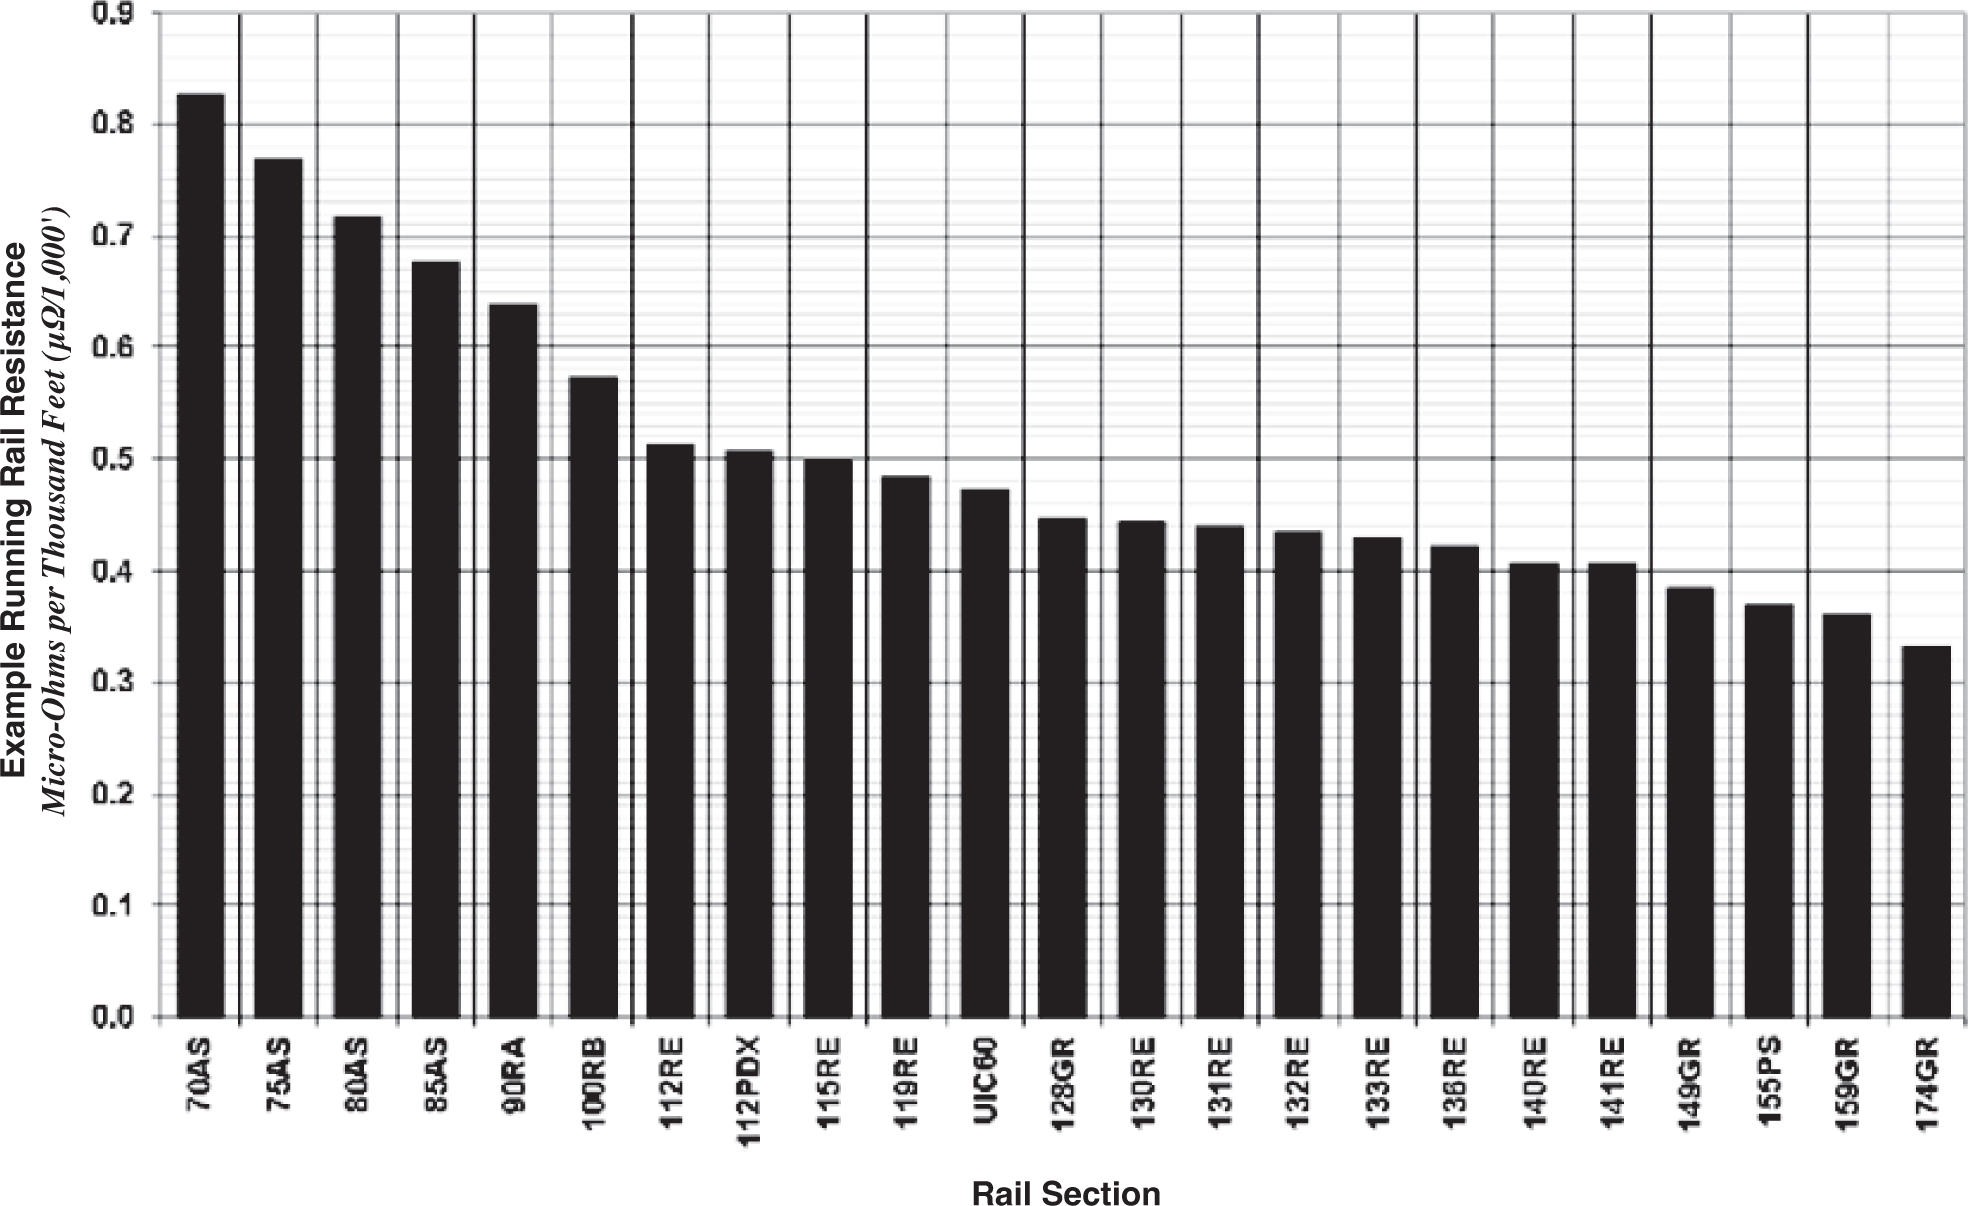
Running rails are used as an electrical conductor by the TPNR systems and the train control systems. Those who design electrical circuits must know the electrical properties of the running rail. The rail resistance is proportional to the resistivity of the rail steel material divided by the cross-sectional area of the rail. For any given rail steel, the larger the rail, the less resistance it will have. Figure D-26 shows a comparison of resistance values per foot of rail using an assumed resistance value of 0.203 microohms per yard (μΩ/yd) or 0.222 microohms per meter (μΩ/m).
The resistance values shown in Figure D-26 are for illustrative purposes only and should not be used for any calculations. The actual rail resistance values are more complex and can be affected by the manufacturing processes, rail temperature, rail metallurgy, rail joints (and type of rail joint bonding used), type of rail welds, and more. While these values appear to be extremely small, the rail resistance affects the flow of TPNR current and, if not accounted for, can lead to differences in electrical potentials that can lead to IJ arcing. Additional research is suggested
Long Description.
The vertical axis, for example, running rail resistance, micro-ohms per thousand feet, ranges from 0.0 to 0.9 in increments of 0.1. The horizontal axis for the rail section lists 23 different categories. The data is as follows. 70 AS, 0.83. 75 AS, 0.77. 80 AS, 0.72. 85 AS, 0.68. 90 RA, 0.64. 100 RB, 0.58. 112 RE, 0.51. 112 PDX, 0.505. 115 RE, 0.5. 119 RE, 0.48. UIC 60, 0.47. 128 GR, 0.45. 130 GR, 0.45. 131 GR, 0.45. 132 RE, 0.44. 133 RE, 0.43. 136 RE, 0.42. 140 RE, 0.41. 141 RE, 0.41. 149 GR, 0.39. 155 PS, 0.37. 159 GR, 0.36. 174 GR, 0.34.
on this subject in Appendix F. For more information related to the electrical properties of rail, reference “Measurement of Current Flowing Through a Rail with the Use of Ohmʼs Method: Determination of the Impedance of a Rail” (Kolář, Bojko, and Hrbáč 2013; see Appendix H).
Track Electrical Resistance
The running rails act as conductors for the TPNR and train control signal circuits, and they are electrically isolated from earth ground by the track. The rail fasteners, ties, ballast, subgrade, and more, provide electrical insulation that prevents leakage (stray currents) of the TPNR to earth ground. The electrical properties of the overall track structure can be affected by the track components and can change with temperature and moisture. Fouled (dirty) and wet (poorly drained) ballast can conduct electricity better than clean dry ballast—ballast materials that have a high electrical resistance and fasteners that include better insulation can improve the electrical performance of the overall track structure. Recommendations for further research on this subject are provided in Appendix F. When modeling the TPNR system, the actual electrical properties of the track should be taken into consideration.
When interviewed, one railroad group noted an increase in arcing issues after older track with poorly insulated fasteners and fouled ballast was replaced with new track and clean ballast. While other changes that could also lead to arcing were implemented, the groupʼs perspective was that the old track was likely allowing the TPNR to leak from the track to earth ground (stray currents) and find alternative paths back to the TPSS. The new track provided much better electrical isolation; the TPNR was forced to travel through the design pathways (running rails, bonding cables, and more); and the electrical load likely increased, possibly contributing to IJ arcing (see Figure D-27 through Figure D-29). For more detailed information about track resistance and stray current control, reference TCRP Research Report 212: Stray Current Control of Direct Current-Powered Rail Transit Systems: A Guidebook (Flounders and Memon 2020) and “Analysis of Rail Potential and Stray Currents in a Direct-Current Transit System” (Tzeng and Lee 2010).
Chapter D-8 Arc Theory
Electric Arcs
A spark or an arc between two electrical contacts is caused by the creation of plasma between the two contacts. Plasma is an ionized gas that burns between the two contacts. Certain conditions need to exist for the gas between the two contacts to be ionized. Without a gap between the two contacts, the current will be able to flow through the contacts as though it were a solid conductor;
Long Description.
The photos show parallel tracks with IJs on the rails.

Long Description.
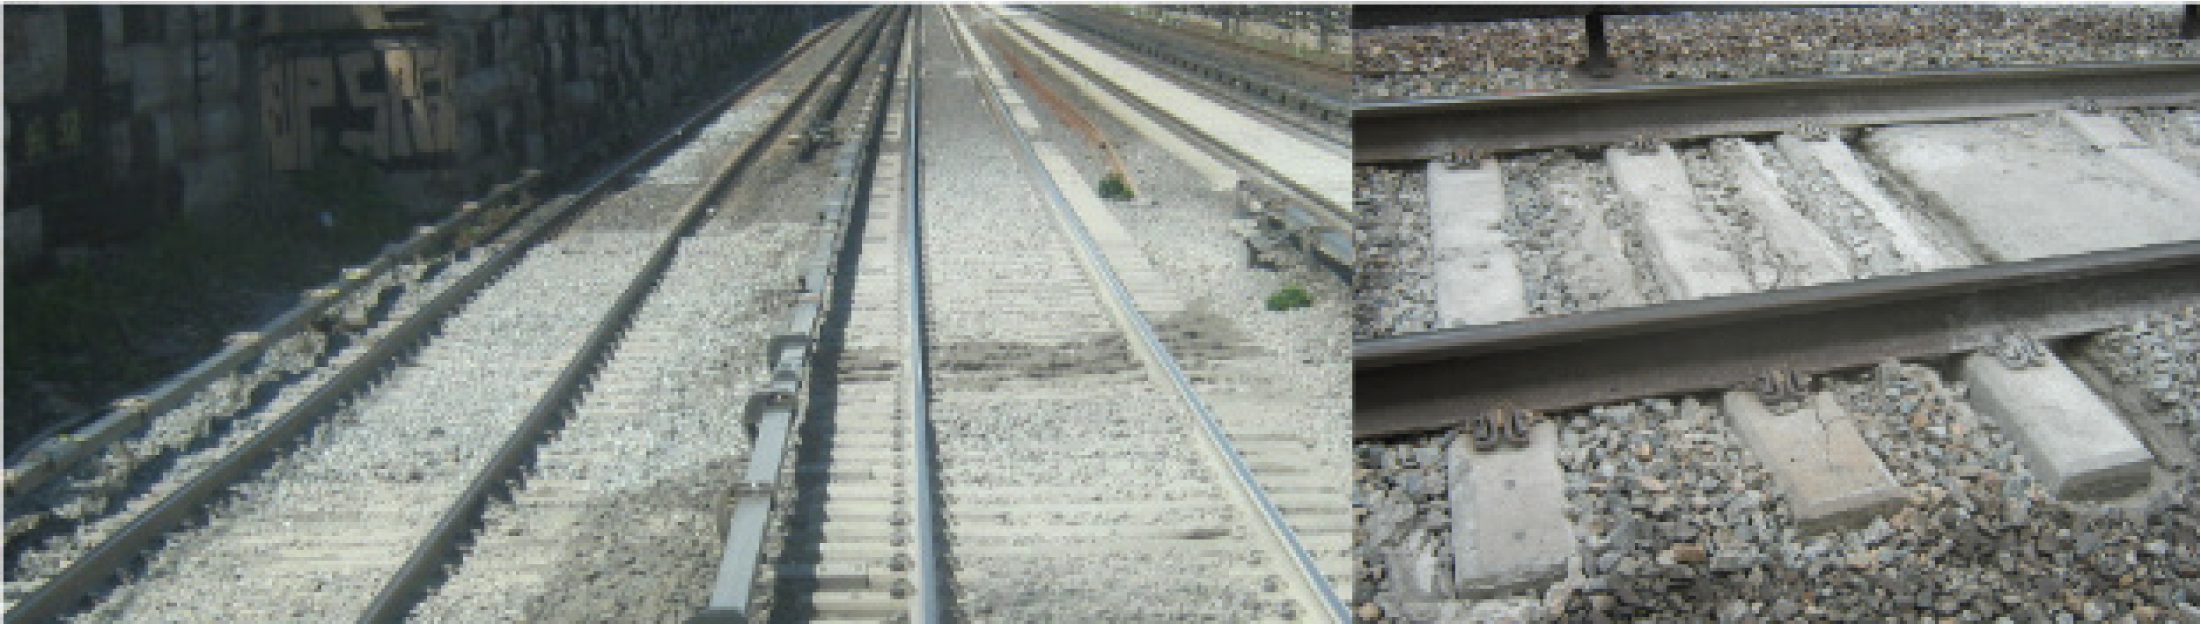
The photo shows the insulation joint on a track with parts marked as spikes with insulated coating, insulated bushing, and insulating pad between the tie plate and the tie.

a gap between the contacts is necessary for a spark or an arc to be produced. Once the contacts are separated by a gap, there will be a cathode (−) region and an anode (+) region. The cathode contact needs to provide the initial electrons needed to fuel the ionization process within the gap, but if the source of electrons is terminated, there is no potential for an arc to be created. There also needs to be a voltage differential between the cathode and the anode to attract the electrons to the anode. An electric field is created by the voltage differential over the distance between the gap, and the electron, being negatively charged, will be attracted to the anode.
Townsend Avalanche
Figure D-30 details the cascading sequence of events that occur within an arc. As the electrons move toward the anode, it gains energy before it collides with gas molecules and gas atoms within the gap. Because the energy of the electrons is initially low, they bounce off the gas molecules in what is called an elastic collision (Timsit 2017). In this case, because of the electron mass being much less than the gas, the electronsʼ energy loss is close to zero. The electrons gain additional

Long Description.
The illustration shows cathode (negative) on the left and anode (positive) on the right. The negatively charged electrons move away from the cathode, and the positively charged electrons move toward the cathode. Similarly, the negatively charged electrons move toward the anode, and the positively charged ions move away from the anode. The negatively charged electrons collide with the neutral (zero) charge gas (air) molecules.
energy as they move through the gap before the next collision with other gas molecules, and as the electrons gain energy, the collisions with the gas molecules become inelastic (Timsit 2017). These inelastic collisions can separate the electrons from the gas atoms, which frees the electrons and the positively charged ions (an atom that has a positive charge due to the loss of electrons). This process is repeated with each subsequent collision, resulting in even more free electrons that can collide with other gas molecules and positively charged ions. The first collision results in two free electrons and one positive ion, and this number doubles with each separate set of collisions. This exponential growth of electrons is termed the Townsend avalanche (Timsit 2017). Similar avalanching processes are what drive lightning bolts (Dwyer and Uman 2014).
Current is defined as the flow of electrons. This flow will fuel the increase in current through the gap. The electrons reaching the anode will be equal to the electrons emitted from the cathode plus the electrons created during the collisions with the gas molecules and atoms through the gap. When these electrons collide with the anode, positively charged particles will be released from the anode. Then, the positive ions created during these collisions will collide with the cathode resulting in additional electrons being emitted.
The arc volt-ampere characteristics over the gap determine the voltage and the current ranges needed to form an arc over the gap. If there is lower current across the gap, then there needs to be a higher voltage differential to support the creation of an arc. The inverse is true as well, if there is a high current across the gap, then a lower voltage may result in the creation of an arc. For DC
circuits, once an arc is established and stable, the only way to extinguish the arc is to reduce the current supply at the cathode or increase the arc voltage to be greater than the system voltage. The arc voltage can be increased to lengthen the arc by increasing the gap between the contacts. Additional information on electrical arcs, arc theory, and mechanics, can be found in the following: The Mechanism of the Electric Spark (Loeb and Meek 1941), The Electric Arc (Somerville 1959), Electric Contacts: Theory and Application, 4th Edition (Holm 2013), Electrical Contacts: Principles and Applications, Second Edition (Timsit 2017), and Electrical Contacts: Scientific Fundamentals (Timsit 2013).
Chapter D-9 DC Electric Arc Welding
Arc Welding
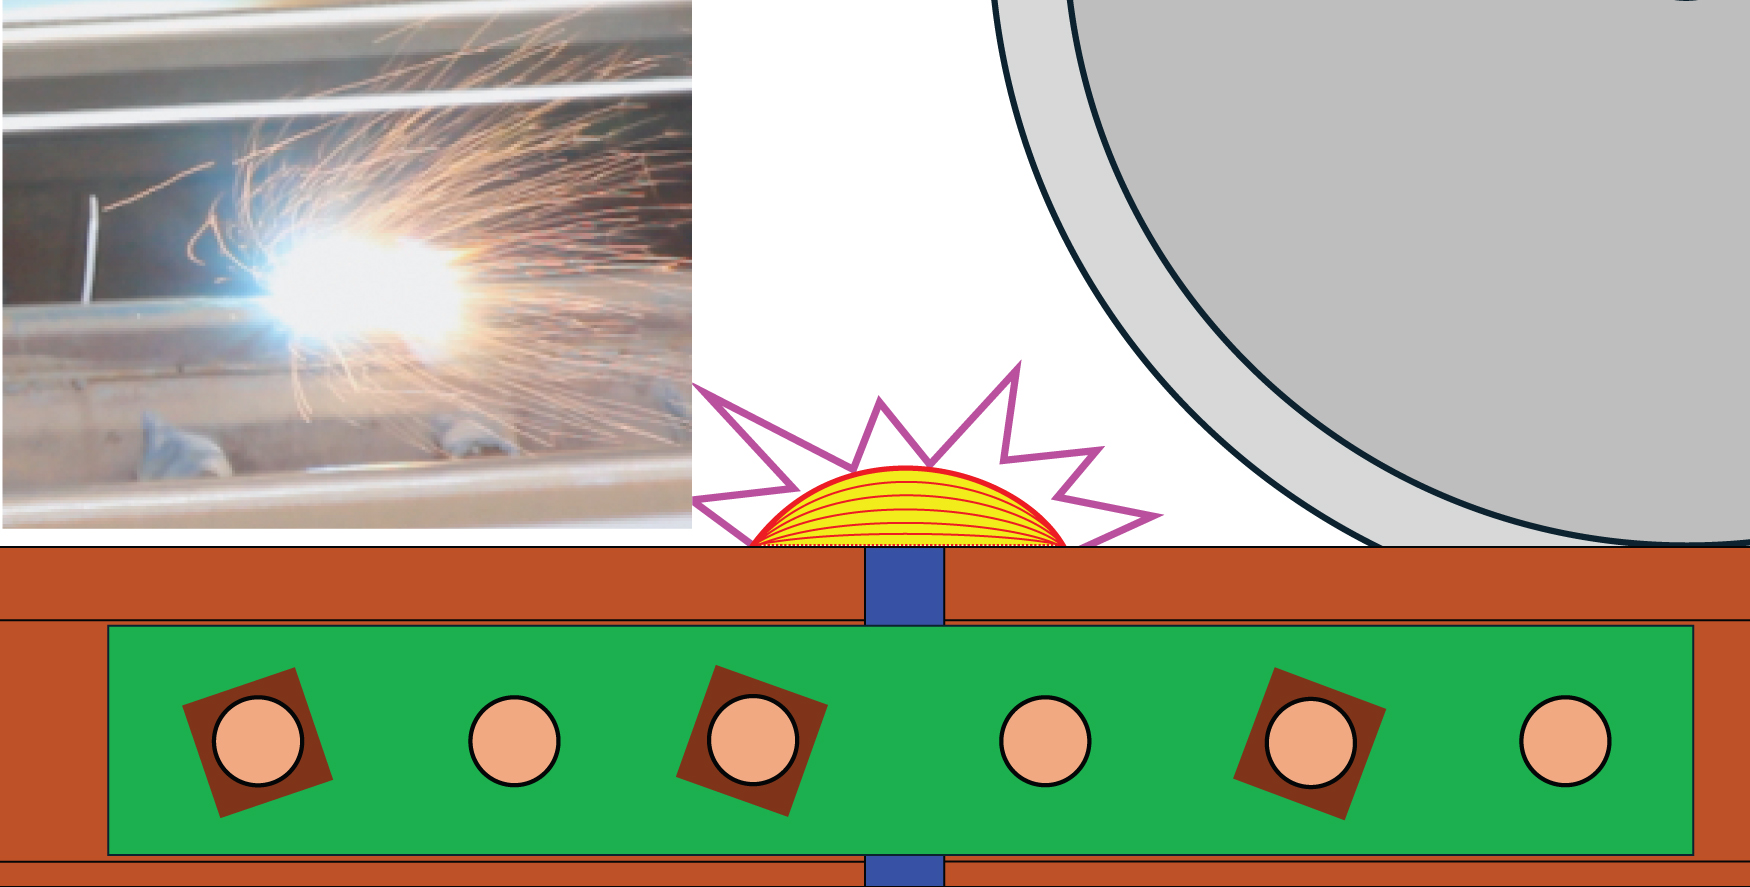
Arc welding is a process that uses a carefully engineered and controlled process to fuse metals together with electrical energy. Various methods and practices are used to add metals; control metal flow, heat, and arc plasma stream; and prevent metallurgical damage to the pieces being joined. IJ arcing has some corollary to arc welding; however, IJ arcing is an uncontrolled welding process that can damage wheels, rails, and the IJs. The burning, melting, heat, and transient electrical spikes that occur during uncontrolled arcing events can also cause peripheral damage to other equipment.
During an IJ arcing event, most of the heat (∼66 percent) is generated on the positive (anode), with less (∼33 percent) on the cathode side, and is characterized by deeper penetration. With the additional heat, more metal is melted on the positive side (anode) that flows toward and is deposited on the negative side (cathode) (see Figure D-31). The polarity shown in Figure D-31 is assumed for illustrative purposes, and the polarity can be opposite. More details on what is physically occurring within the arc are provided in the previous chapter. For more information about arc welding practice and theory see Arc Welding Handbook (Holslag 1924), Arc Welding Manual GEB-69 (General Electric Company 1929), Technical Manual TM 5-805-7, Welding Design, Procedures and Inspection (U.S. Department of the Army 1985), and Introduction to the Physical Metallurgy of Welding (Easterling 1992).
IJ Arcing and Arc Welding
Rail ends at IJs do not spontaneously arc; the arcing is initiated by the wheels on a passing train. Since current flow has yet to be established, arcing does not occur on the leading edge of the wheel as it initially connects the two rail ends, even with a difference in electrical potential. If there is

Long Description.
The illustration shows a track with cathode (negative) on the left and anode (positive) on the right, with a meter to measure the potential difference in the middle. The cathode is marked less heat (approx 33 percent), deeper penetration, and metal deposited. The traction power substation (TPSS) is above the cathode, and a connection from the cathode to the substation is marked TPNR cables from the rail to the substation. A cable from the substation to the car on the right end is marked traction power feed (third rail slash OHC). The anode is marked more heat (approx 66 percent), less penetration, and metal loss. The exchange of charged particles is depicted through plasma in the middle. Metal flow is from the anode to the cathode, and heat flow is from the cathode to the anode. The negatively charged electrons move from cathode to anode, and the positively charged ions move from anode to cathode.
sufficient voltage between the rail ends combined with sufficient amperage, passing train wheels will “strike the arc,” initiating the event (see Figure D-32). Where there is low voltage and low amperage, the event will quickly end with a small spark (see Figure D-33).
In most cases as the wheel moves away from the rail end, the gap increases, and the arc will be extinguished. If there is a large enough current flow through the arc as the wheel passes, the arc can be transferred to the adjacent rail joined by the IJ. At this point, the current is now flowing between the rail ends, and the wheel is no longer involved. The arc can continue until the amperage reduces to the point where the arc can no longer be sustained. Typically, the current is supplied by the train that initiated the arcing. The rail-to-rail arcing will stop as soon as the train either reduces the load or the train moves to a location on the track that provides a better electrical path back to the TPSS that is providing the power (see Figure D-34 and Figure D-35).
Diagnosis of IJ Arcing Based on Principles of Arc Welding
Where indications of IJ arcing are found, the principles of arc welding may be used to diagnose what is occurring within the TPNR system when an event occurs. This diagnosis can help determine the direction of the train and the direction of the current flow as well as identify the TPSS that provided the energy to drive the arcing event(s) (see Figure D-36 through Figure D-39).

Long Description.
The illustration shows an insulated rail joint joining the trailing end on the left and the leading rail on the right with an insulated end post in between them. The direction of movement is to the right. The sparking at the insulated end post and overhead cable is marked arc is struck between the wheel and rail, when contact between the trailing rail and wheel is broken.

Source: Steven Abramopaulos, HNTB.


Long Description.
The photo shows the unrelated chipping on the right end depicting the direction of movement to the right as indicated by arcing on the trailing rail end. The right end is marked negative, and the left part is marked positive, and the text reads, pitting (metal loss) indicates the trailing rail end is anode.
Long Description.
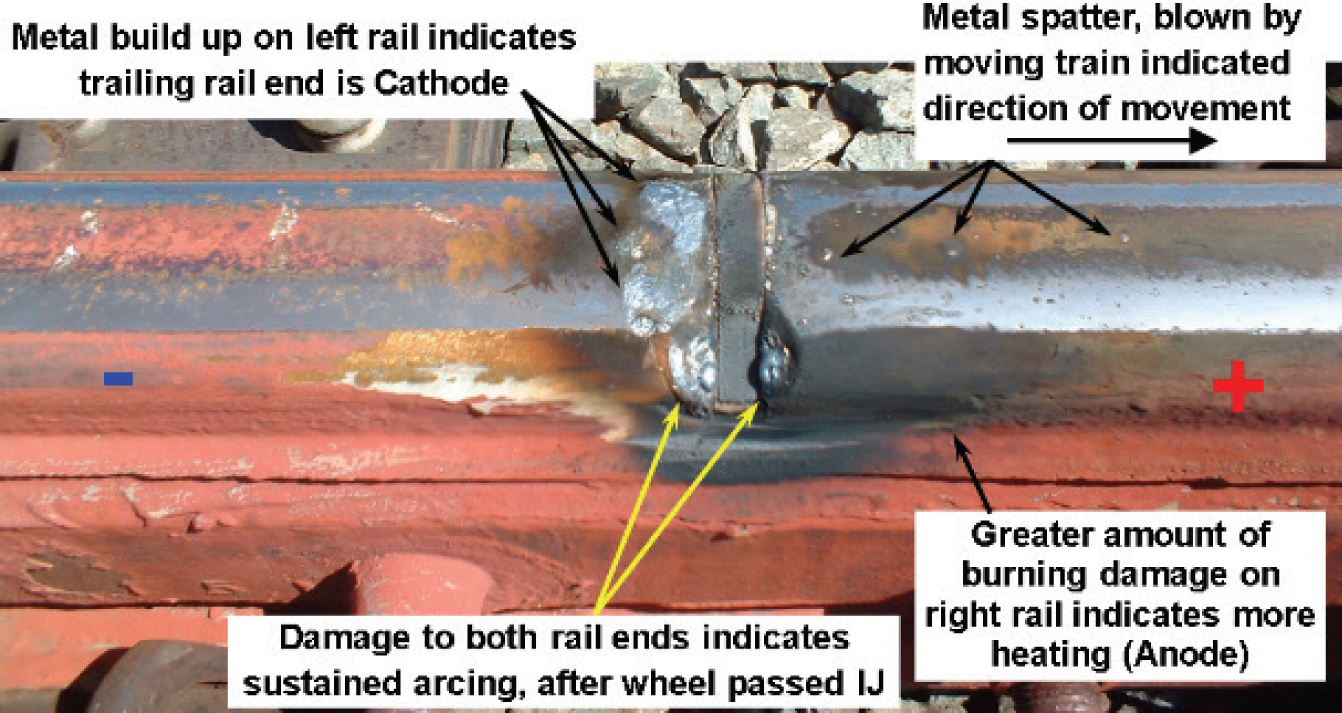
The photo shows a rail joint with burn and damage marks. The part on the left is marked negative, and the part on the right is marked positive. The joint is marked as follows. Metal buildup on the left rail indicates the trailing rail end is cathode. Metal spatter, blown by a moving train, indicated the direction of movement to the right. The greater amount of burning damage on the right rail indicates more heating (anode). Damage to both rail ends indicates sustained arcing, after the wheel passed IJ.

Long Description.
Each photo shows a rail joint with burn and damage marks. The part on the left is marked positive, and the part on the right is marked negative. The photo on the left has damage marks at the end of the left rail, marked as metal buildup, indicating the left rail is cathode. The text at the bottom reads, direction of movement indicated to the right by arcing on trailing rail end. The photo on the right has damage marks at the end of the right rail marked as pitting (metal loss), indicating the left rail is the anode. The text at the bottom reads, direction of movement indicated to the left by arcing on the trailing rail end.

Long Description.
The photo on the left shows a rail joint with extensive damage on each end. The text reads, in extreme events, the direction of train movement and TPNR polarity may not be discernible because of the amount of damage. The right photo shows a rail joint with damage on each end highlighted. The text reads, signs of sparking on both rail ends indicate arcing is occurring for train movements in both directions.
Chapter D-10 IJ End-Post Thickness
Wheel–Rail Contact Patch
“Research and Analysis on Contact Resistance of Wheel and Insulated Rail Joint in High-Speed Railway Stations” (Li et al. 2023) reviews the impact of changing the gap of an IJ (IJ end-post thickness). The research examines the wheel–rail contact patch (Figure D-40) and the resistance between the two rail ends as the wheel transitions across the IJ gap. The wheel–rail contact surface area changes with wheel load, thereby increasing with weight.
The actual shape of the wheel–rail contact patch is very complex, and in some cases, there can be two separate contact patches between a single wheel and the rail. The actual wheel–rail contact resistance is far more complex than what is illustrated here. The wheel–rail resistance is influenced by the wheel–rail interaction and contamination (e.g., dirt, grease, rust), wheel diameter, wheel and rail wear, wheel and rail surface roughness, temperature, humidity, and more,

in addition to just the weight on the wheel. A simplified circular contact patch, without other contributing factors, is used for the examples shown for illustrative purposes.
“Research and Analysis on Contact Resistance of Wheel and Insulated Rail Joint in High-Speed Railway Stations” (Li et al. 2023) indicates that the radius of the wheel–rail contact patch for a wheel load of 9.9 tons is approximately 0.22 inch, and the radius of the wheel–rail contact patch for a wheel load of 29.8 tons is approximately 0.33 inch. The maximum point when the center of the wheel–rail contact patch is at the center of the IJ is illustrated in Figure D-41 and Figure D-42. The article by Li et al. (2023) outlines the wheel–rail contact patches used for these figures.
The resistance between the wheel and rail approaches zero with an increased surface area (contact patch) between the wheel and rail surfaces. The resistance will grow to infinity (open circuit) as the surface area is reduced (e.g., as the trailing rail and wheel separate).
The article by Li et al. (2023) states that as the length of the gap of an IJ approaches the diameter of the wheel–rail contact patch, the resistance between the wheel and rail increases as the wheel transitions across the IJ gap. As the wheel transitions across the IJ gap, the wheel–rail contact surface area shrinks on the trailing rail of the IJ, with the smallest surface area located where the wheel–rail contact patch is centered at the IJ gap. On the leading rail, the surface area of the contact patch increases as the wheel continues to transition across the IJ gap. If the IJ gap increases to be larger than the diameter of the wheel–rail contact patch, there will be a period where there is no wheel–rail contact (see Figure D-43).
The article by Li et al. (2023) indicates that as the surface area between the wheel–rail contact shrinks, the contact resistance between the wheel–rail connection increases and the current flowing between the two is concentrated in the smaller contact area. The potential to establish an arc between the wheel and rail grows as the wheel–rail contact resistance and the current density in the contact patch grow due to the wheel–rail contact surface area decreasing as the wheel leaves the trailing rail.
Arc Interruption at IJs
For DC circuits, after an arc is established, it needs to be interrupted by driving the DC current to zero. This can be achieved by terminating the current coming from the power source or by raising the arc voltage to reach the system voltage, which will drive the current flowing in the system to zero (Timsit 2017). The arc voltage can be increased by lengthening the arc or by cooling the arc using arc chutes or breakers. In the case of an arc generated between the wheel and rail as the wheel transitions onto an IJ, the arc length increases as the wheel continues down the rail. The arc length can grow only to the length of the IJ gap; then, if not extinguished, the arc will transition from between the trailing rail and wheel to continue between the trailing and leading rails at the IJ (see Figure D-34 and Figure D-35). Mitigations that will support arc interruption can include the following:
- Maintaining the gap between rail ends at IJs.
- Ensuring rail ends are properly maintained at IJs (see Appendix A).
- Reducing the difference in electrical potential and current flow between the rail ends at IJs.
- Exploring the possibility of increasing the IJ gap to support driving the arc voltage higher than the system voltage.
- There can be a delicate balance regarding the size of the IJ gap. A larger gap can support extinguishing an arc but can also result in an arc being established between the wheel and the rail more often.


Long Description.
The vertical axis represents resistance, and the horizontal axis represents distance. A horizontal line above the horizontal axis is marked with wheel-rail contact resistance with no IJ. The graph shows four bell-shaped curves with peaks along the vertical line marked the centerline of the gap. The outermost curve has a broken peak, and the gap between the broken parts is marked as a gap width larger than the contact patch. The upward sloping part of the inner curves is marked when IJ gap is less than the contact patch, wheel-rail contact resistance increases with the size of the gap. The upward sloping part of the outermost curve is marked when IJ gap is greater than the contact patch, wheel-rail contact resistance increases to infinity as the wheel rolls off the trailing rail. The downward sloping part of the outermost curve is marked when IJ gap is greater than the contact patch, wheel-rail contact resistance decreases from infinity as the wheel rolls on the leading rail.


