Ramp Safety Practices: Update (2026)
Chapter: 3 Survey Results

CHAPTER 3
Survey Results
This chapter presents the results of the surveys on ramp safety practices used by airports. Three different surveys were conducted to collect information on current safety practices, staff training, and human factors related to ramp safety. An initial survey was sent to airport managers at airports classified as primary airports by the NPIAS. Follow-up online surveys were then sent to GSPs and airline staff identified by the airports and distributed through appropriate TRB technical committees. The surveys for the airport operators, GSPs, and airline safety personnel are provided in Appendices A, B, and C respectively. Appendix C can be found at nationalacademies.org/publications by searching for ACRP Synthesis 143.
The surveys did not provide formal definitions within the survey questions for terms such as ramp, apron, employee, badged personnel, and training. Respondents interpreted the terms according to their own professional experiences and organizational contexts. This decision was made so as to capture how concepts are applied in practice, rather than constraining responses to a predetermined framework. The data reflects the different perspectives and operational realities across airports, offering insights that might be missed if strict definitions had been imposed. This chapter presents the quantitative results of the surveys, while the full survey results for each survey are provided in Appendices E, F, and G respectively. Appendix G can be found at nationalacademies.org/publications by searching for ACRP Synthesis 143.
Overview
The authors contacted 320 airports to participate in the survey and received 79 responses. Table 1 lists, by airport type, the number of surveys sent and the number of surveys completed. Most respondents were from non-hub airports (49 of the 79 responses). The percentage of survey responses is consistent across the classifications—small and non-hub airports returned more surveys but the percentage of completed surveys by hub type was consistent. The number of survey respondents by FAA region indicates how responses from across the United States reflect the different perspectives and environments of the respondents (e.g., winter ramp safety concerns that some airports located in the south may not experience.) Responses by FAA region were as follows: Alaska (1), Central (4), Eastern (10), Great Lakes (14), New England (3), Northwest Mountain (15), Southern (14), Southwest (12), and Western Pacific (6). Respondents were not required to answer each question, making the response variable for each question for analysis.
Seven surveys were completed by GSPs and results are presented along with the airport findings in this chapter. Only one survey response from an airline was received, potentially due to concerns about disclosing proprietary company information and sharing sensitive operational details. The airline responses are not analyzed herein, but the responses can be found in Appendix G at nationalacademies.org/publications by searching for ACRP Synthesis 143.
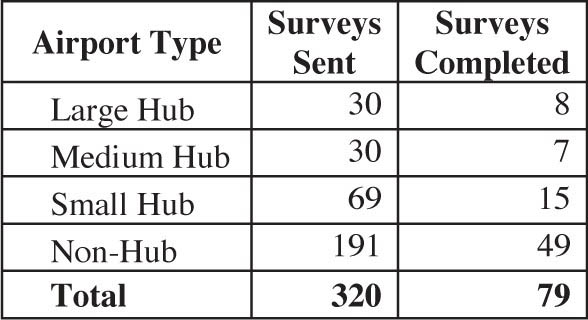
Long Description.
The column headers of the table are airport type, surveys sent, and surveys completed. The data given in the table row-wise are as follows: Row 1: Large hub: 30, 8. Row 2: Medium hub: 30, 7. Row 3: Small hub: 69, 15. Row 4: Non-hub: 191, 49. Row 5: Total: 320, 79.
Most respondents to the airport survey were airport managers and directors (66 respondents), with the remaining being other airport executives and airport safety personnel. Respondents were asked how many badged employees work in the air operations area (AOA). Figure 1 shows the range of badged personnel working in the AOA at the airports, with most respondents having 5 to 24.
Safety Training
Safety training programs implemented at airports for GSPs, including both on-ramp personnel (e.g., fueling, baggage handling, aircraft handling, and ground vehicle movement) and on-aircraft personnel (e.g., passenger handling, lavatory servicing, and water service and catering operations), are presented in this section. The survey sought to assess the extent, frequency, and oversight of safety training required by airports for individuals operating in ramp and airside environments. A wide-ranging set of questions was used to understand not only whether airports require initial and refresher safety training, but how often these training courses occur, who delivers them, and whether they are standardized per tenant or service provider.
Multiple questions in the surveys addressed the implementation and structure of safety training programs with a focus on safety training and meetings with tenants, airport safety meeting and training frequency, safety training providers, and refresher training. In addition to safety training requirements, questions were also included to assess enforcement and oversight measures (e.g., whether airports issue fines for safety violations, whether they require external audits through programs such as the IATA Safety Audit for Ground Operations (ISAGO) or through insurance agencies, and whether safety inspections are conducted regularly on the ramp or in baggage make-up areas).
Respondents indicating that their airports provide safety meetings or training were also asked about the frequency of these sessions (e.g., monthly, quarterly, and annually) and who is responsible for conducting them (e.g., airport safety staff, tenant organizations, and third-party providers). For those reporting required refresher training, the survey further investigated how frequently this training is conducted.
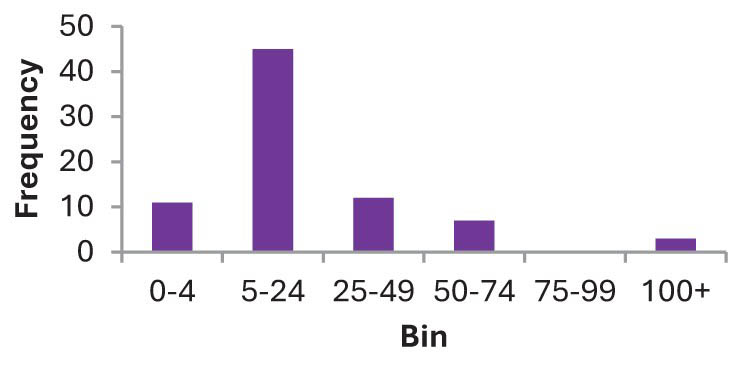
Long Description.
The horizontal axis represents bin values ranging from 0 to 4 to 100 plus in irregular increments. The vertical axis represents frequency ranging from 0 to 50 in increments of 10. The data given in the bar graph are estimated as follows: 0 to 4: 11, 5 to 24: 45, 25 to 49: 12, 50 to 74: 7, 75 to 99: 0, 100 plus: 3.
Additionally, the survey asked whether refresher training is required for ground service staff and whether this applies to both on-ramp and on-aircraft personnel. The survey explored whether airports conduct regular ramp/apron safety meetings with tenants, require airside safety training [excluding airport movement area (AMA) or AOA driving programs] and if they perform periodic reviews of tenant safety training programs as part of lease or license agreements.
The responses to these questions provide valuable insight into current practices, frequency of training efforts, tenant engagement, and the level of regulatory oversight present at participating airports. The results are organized and presented to identify trends, common practices, and areas for potential improvement in ramp safety training protocols.
Safety Training and Meetings with Tenants
The responses for safety training show that training and requirements for airside safety training programs for tenants vary. Highlights from the airport survey follow:
- 38 out of 79 airports indicated their airports conduct regular ramp safety meetings.
- 32 out of 79 airports require airside safety training for tenants.
- 34 out of 79 airports require refresher safety training for tenants.
- 17 out of 79 airports review tenant safety programs.
- 49 out of 79 airports conduct ramp safety inspections.
- 29 out of 79 airports issue fines.
- 9 out of 79 airports require an external audit of tenant programs.
Figure 2 shows responses from airports for safety violations, external auditing of GSPs, and safety inspections of the ramp area. At some airports, the respondents indicated that reviews are conducted only for specific high-risk operational activities (e.g., aircraft towing). One airport response noted that, although they ensure each tenant has an Injury and Illness Prevention Program on file, they do not review the contents of the program—only that it exists and is current. Other comments include airports relying on alternative enforcement actions to address noncompliance, including suspending badges or revoking access until retraining has been completed, providing written notices of violation, and issuing formal warnings. One airport imposes fines only if the issues identified in the written notice are not resolved within a specified timeframe. Specific responses for “other” are found in Appendix E. Five out of seven GSP respondents reported providing training to their employees with four of those five GSP respondents reporting having training more than once every year.
Airport Safety Meeting and Training Frequency
Figure 3 shows the frequency of safety training and meetings by airport hub classification. Across all hub categories, monthly safety meetings and training sessions are the most common. Four of the five responding medium hub airports reported conducting these activities monthly. Greater variation appears among smaller airport classifications, with three small hub airports reporting that they hold meetings or training sessions quarterly, and four non-hub airports also reported conducting quarterly meetings. One non-hub airport respondent noted that training is conducted “annually or biannually depending on the airport workers.” A respondent from a small hub added that the airportʼs “SMS status is briefed quarterly at tenant meetings and all employees receive safety orientation as part of badge and refresher training.”
Safety Training Providers
The airport responses to safety training revealed a relationship between airport size and the entity responsible for delivering training. The data indicates that training responsibilities shift in
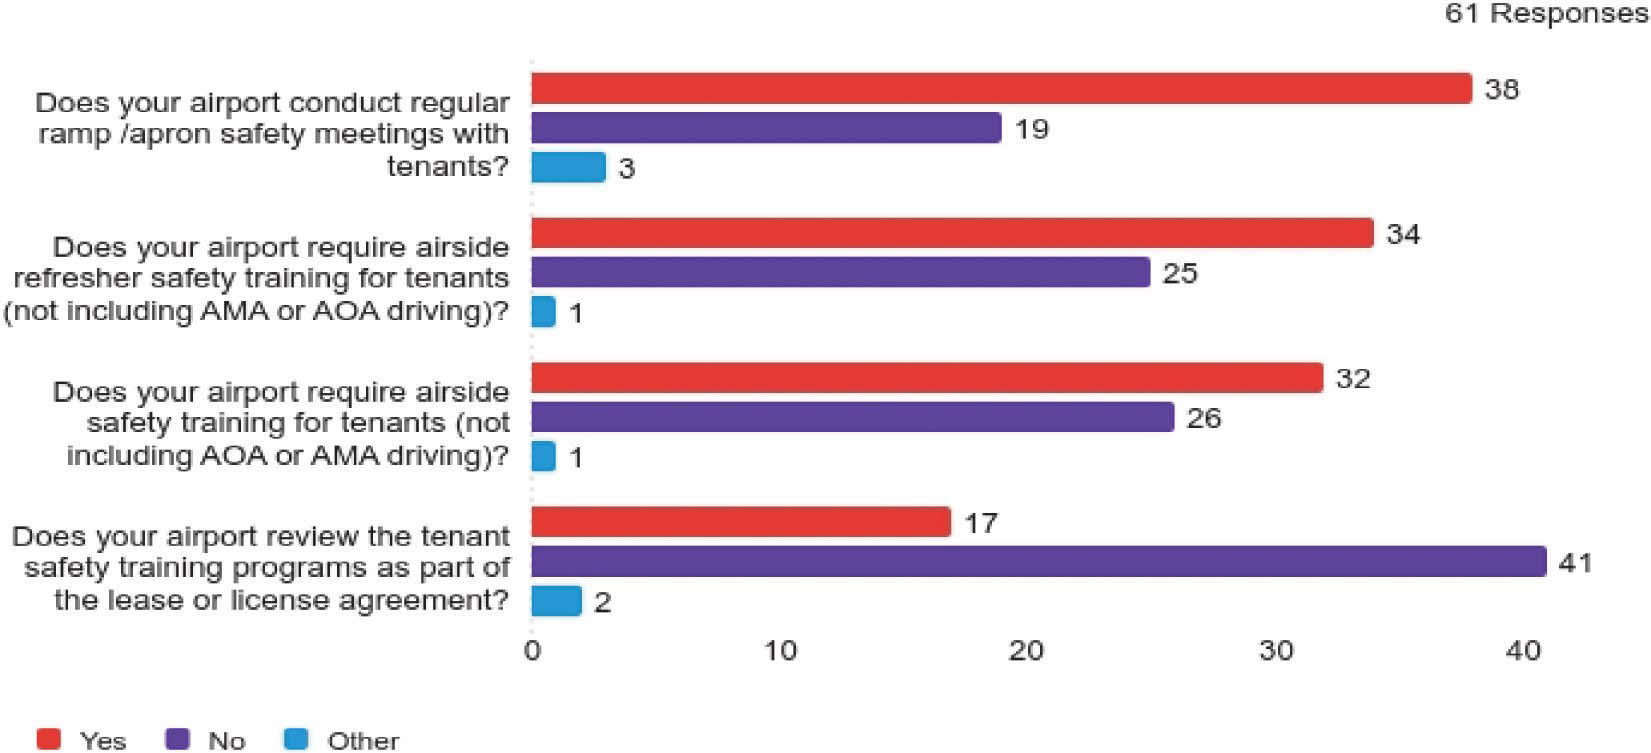
Long Description.
The horizontal axis ranges from 0 to 40 in increments of 10. The vertical axis presents the following survey questions: Does your airport conduct regular ramp/apron safety meetings with tenants? Does your airport require airside refresher safety training for tenants (not including AMA or AOA driving)? Does your airport require airside safety training for tenants (not including AOA or AMA driving)? Does your airport review the tenant safety training programs as part of the lease or license agreement? Red indicates yes, violet indicates no, and blue indicates other. The data given in the graph for the 61 responses are as follows: Does your airport conduct regular ramp/apron safety meetings with tenants? Yes: 38, no: 19, other: 3. Does your airport require airside refresher safety training for tenants (not including AMA or AOA driving)? Yes: 34, no: 25, other: 1. Does your airport require airside safety training for tenants (not including AOA or AMA driving)? Yes: 32, no: 26, other: 1. Does your airport review the tenant safety training programs as part of the lease or license agreement? Yes: 17, no: 41, other: 2.

Long Description.
The horizontal axis ranges from 0 to 50 in increments of 10. The vertical axis presents the following survey questions: Does your airport issue fines for safety violations? Does your airport require an external audit of ground service providers through programs such, ellipsis. Does your airport conduct safety inspections on the ramp or in baggage make-up areas? Red indicates yes, violet indicates no, and blue indicates other. The data given in the graph are as follows: Does your airport issue fines for safety violations? Yes: 29, no: 26, other: 6. Does your airport require an external audit of ground service providers through programs such, ellipsis. Yes: 9, no: 51, other: 1. Does your airport conduct safety inspections on the ramp or in baggage make-up areas? Yes: 49, no: 11, other: 1.
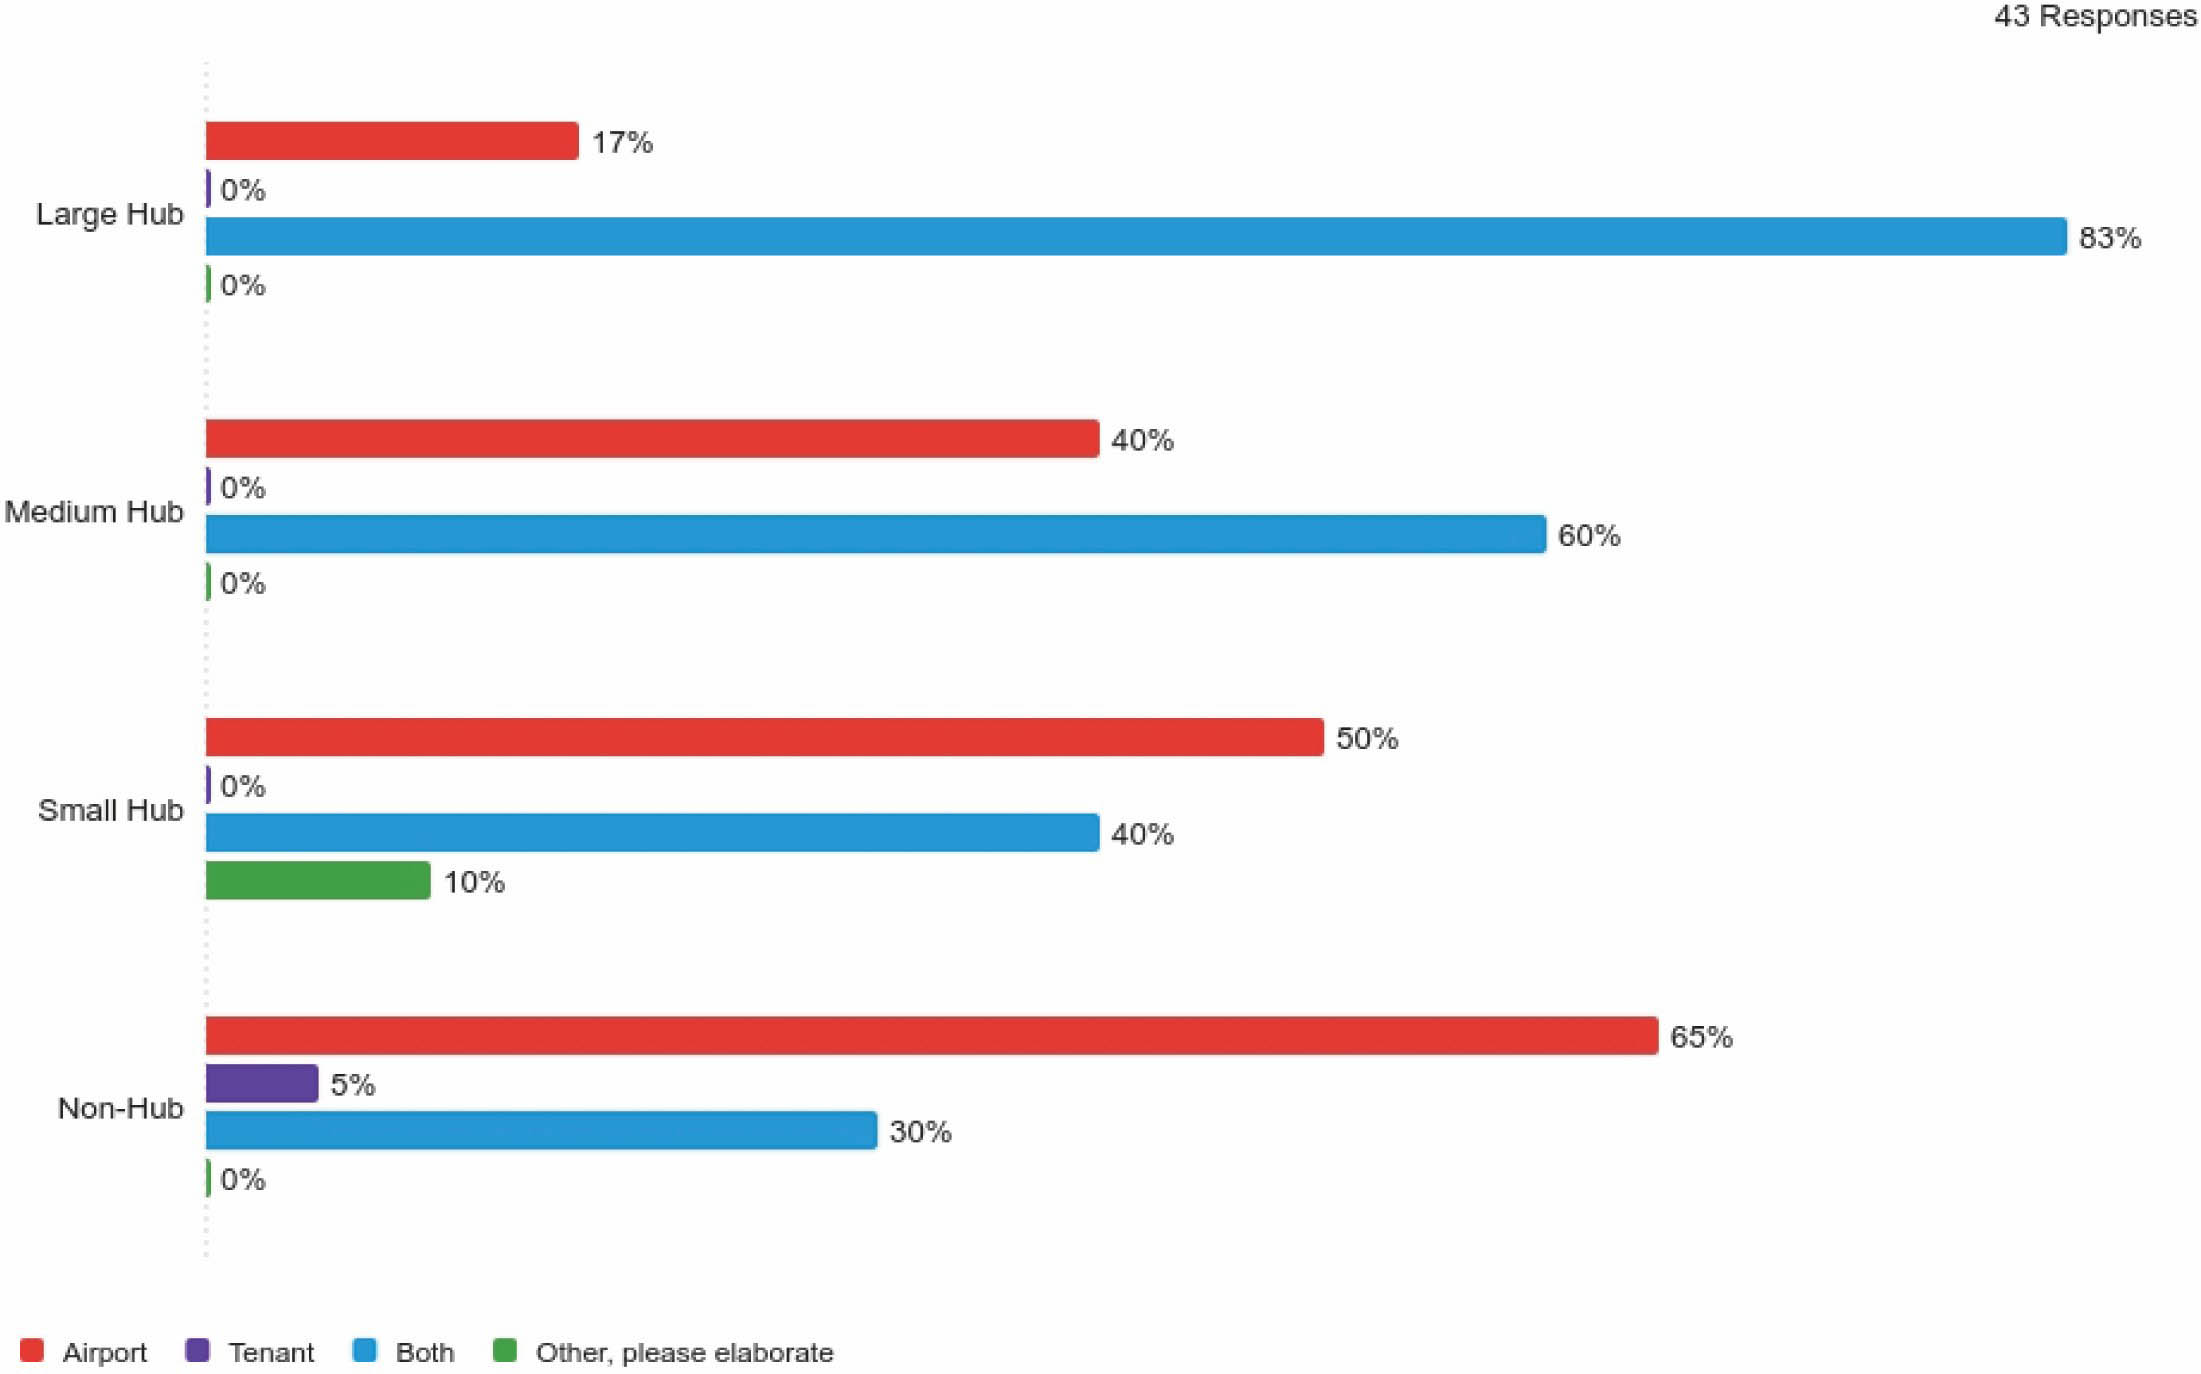
response to the size classification of the airport, with variations in whether training is provided solely by the airport, solely by tenants, or as a joint effort of the airports and tenants (see Figure 4).
Among the large hub respondents, only one indicated that the airport is the primary provider of training while five responded that the airport and tenants are jointly responsible for conducting training. For medium hubs, there is more variation. Two medium hub airports reported that the airport provides training and three other medium hub respondents stated that training responsibilities are shared between the airport and tenant.
Small hub responses vary as well—five respondents responded that the airport provides the training while four indicated that training is a joint effort of the airport and tenants. One small hub respondent noted that training is delivered through a computer-based platform that is not controlled by the airport or tenants. In the case of non-hub airports, 13 reported that the airport provides the training; 1 stated that training is provided by the tenant; and 6 reported a joint training approach involving both the airport and tenant.
Overall, the data illustrates how the distribution of training responsibilities varies across airport classifications. As an airportʼs size increases and the expected number of ramp personnel increases, the responsibility of safety training shifts from only the airport to joint responsibility with the tenants.
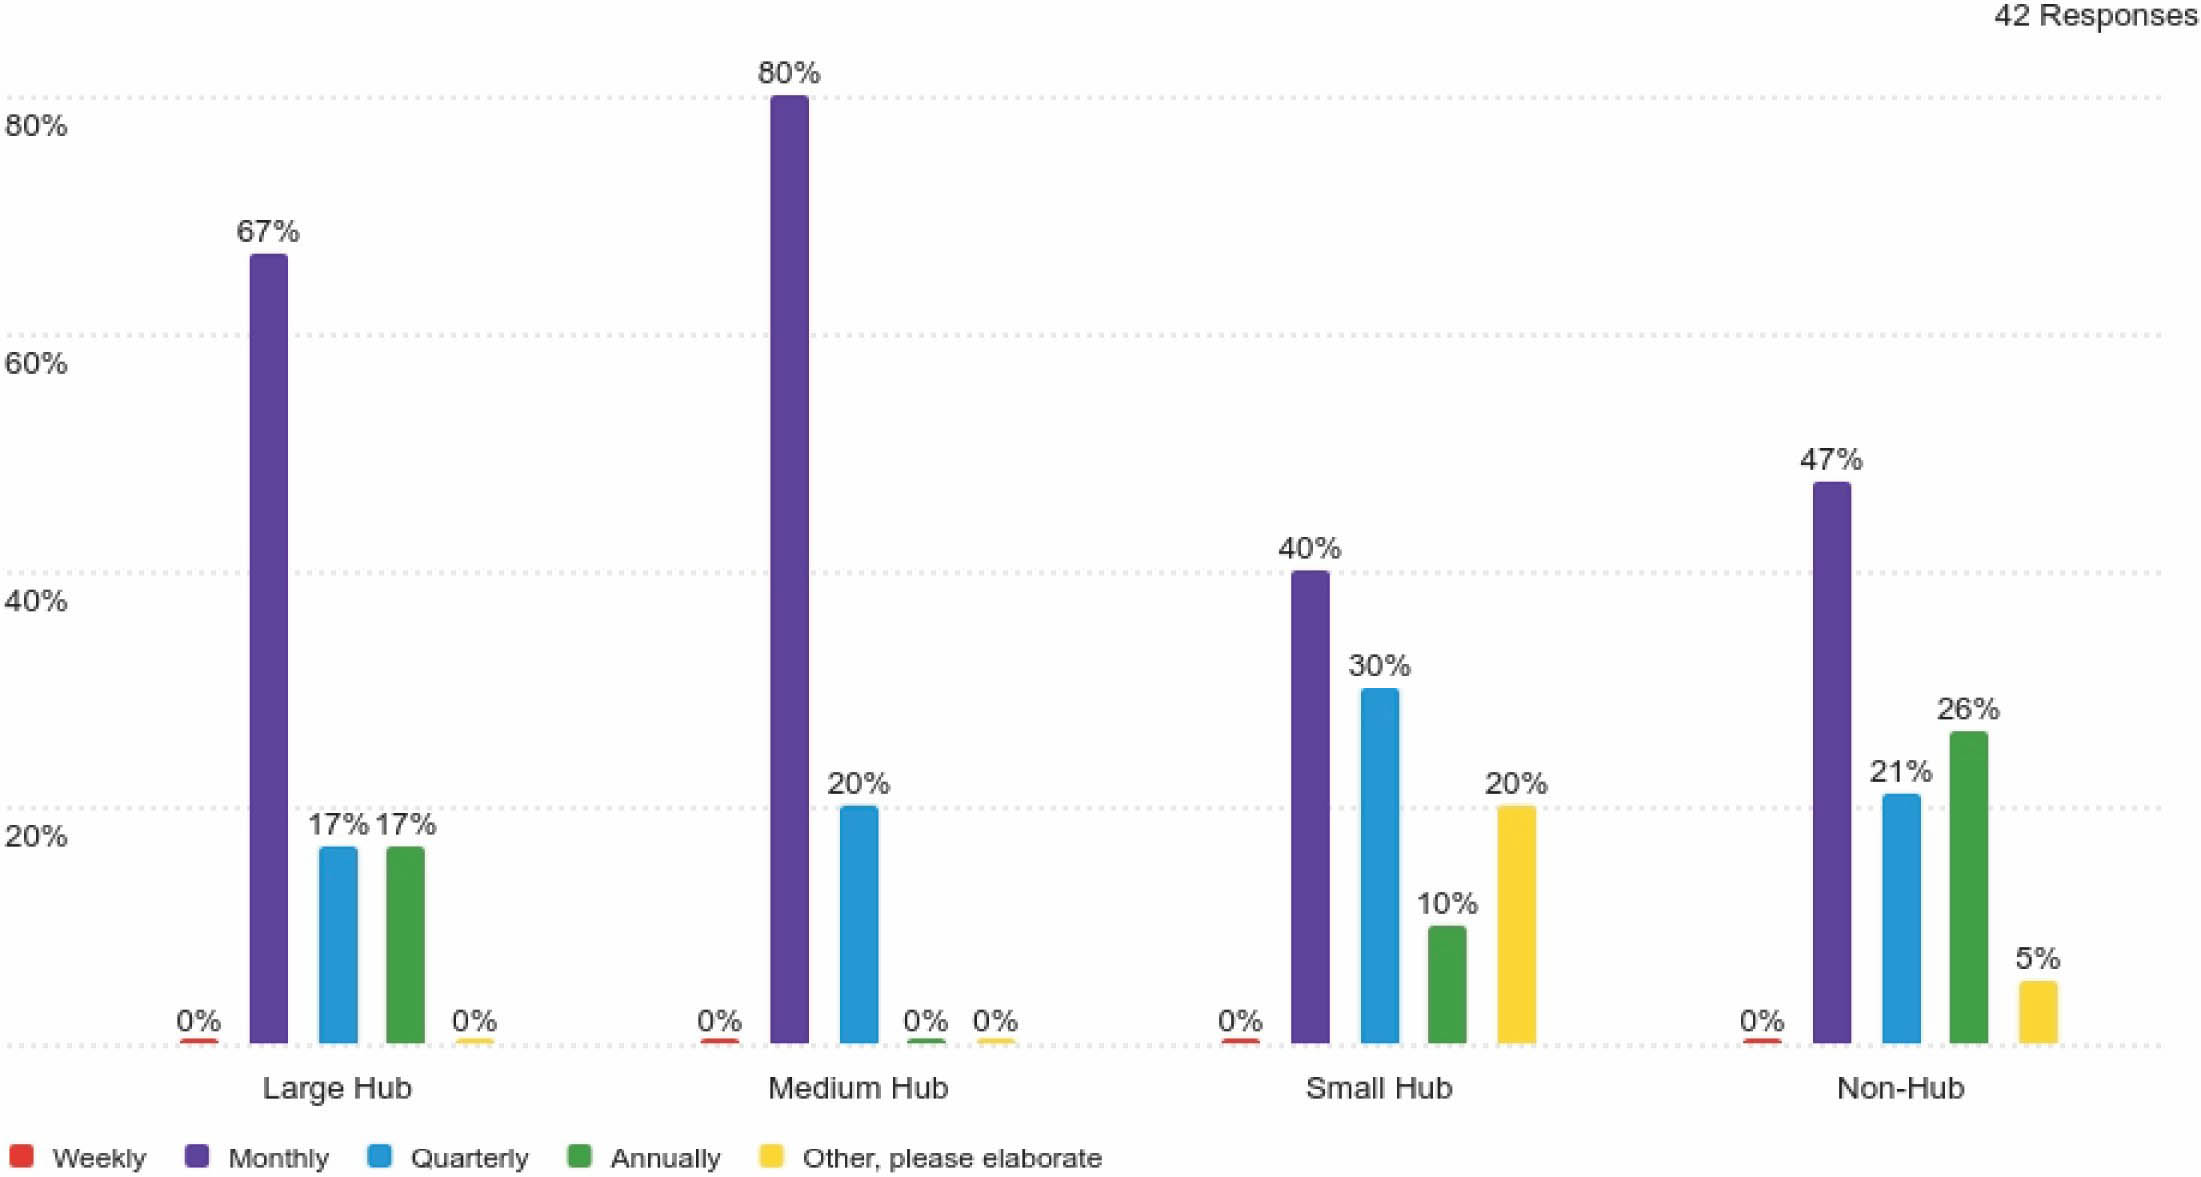
Long Description.
The horizontal axis presents the following categories: large hub, medium hub, small hub, and non-hub. The vertical axis ranges from 20 to 80 percent in increments of 20. Red indicates weekly, violet indicates monthly, blue indicates quarterly, green indicates annually, and yellow indicates other (please elaborate). The data given in the graph are as follows: Large hub: Red: 0 percent, violet: 67 percent, blue: 17 percent, green: 17 percent, yellow: 0 percent. Medium hub: Red: 0 percent, Violet: 80 percent, Blue: 20 percent, Green: 0 percent, Yellow: 0 percent. Small hub: Red: 0 percent, Violet: 40 percent, Blue: 30 percent, Green: 10 percent, Yellow: 20 percent. Non-hub: Red: 0 percent, Violet: 47 percent, Blue: 21 percent, Green: 26 percent, Yellow: 5 percent, 42 responses.
Long Description.
The horizontal bar graph presents the following hub types: large hub, medium hub, small hub, and non-hub. Red indicates airport, violet indicates tenant, blue indicates both, and green indicates other, please elaborate. The data provided are as follows: Large hub: Red: 17 percent, violet: 0 percent, blue: 83 percent, green: 0 percent. Medium hub: Red: 40 percent, violet: 0 percent, blue: 60 percent, green: 0 percent. Small hub: Red: 50 percent, violet: 0 percent, blue: 40 percent, green: 10 percent. Non-hub: Red: 65 percent, violet: 5 percent, blue: 30 percent, green: 0 percent, 43 responses.
Refresher Training
The survey results reveal that most airports require annual refresher training—33 airports (77%) have refresher safety training more than once a year. However, depending on airport size and classification, there are variations (Figure 5).
Small hubs and non-hubs were the only airport categories to report that refresher training is required more than once per year, though this was relatively uncommon, with one respondent from each category. Several small hubs provided more detailed responses. One small hub stated that refresher training occurs “every two years.” Another reported, “Once a year for movement area badges. Every two years for all others,” indicating a tiered approach, depending on the type of operational access. A third specified, “Currently as required per Part 139 for fueling/handling hazardous materials.” Among non-hub airports, one noted a 2-year training cycle, similar to the small hub responses.
In contrast, larger airports showed a different trend with two respondents from large hubs and one from medium hubs reporting that refresher training is required less than once a year. Four respondents from large hubs and four respondents from medium hubs stated that annual refresher training is required.
Figure 6 shows the methods of refresher training for ground service staff. Survey responses reveal that in-classroom training is the least commonly used method for on-ramp personnel. Although classroom sessions play a role in some training programs, they are not preferred at most airports.
The most frequently reported method that airports use to train service providers (33 out of 43 respondents) was during general orientation. Other commonly methods include video training, online training, and rules and regulations review. In contrast, classroom training and hands-on/supervised training were the least commonly used, selected by 18 and 17 (of the 43) respondents respectively. For on-aircraft personnel, the leading training methods were online training

Long Description.
The horizontal bar graph presents the following hub types: large hub, medium hub, small hub, and non-hub. Red indicates more than once a year, violet indicates once a year, blue indicates less than once a year, and green indicates other, please elaborate. The data given in the graph are as follows: Large hub: Red: 0 percent, violet: 67 percent, blue: 33 percent, green: 0 percent. Medium hub: Red: 0 percent, violet: 80 percent, blue: 20 percent, green: 0 percent. Small hub: Red: 10 percent, violet: 60 percent, blue: 0 percent, green: 30 percent. Non-hub: Red: 5 percent, violet: 85 percent, blue: 0 percent, green: 10 percent.

Long Description.
The horizontal axis ranges from 0 to 30 in increments of 5. The vertical axis consists of general orientation, hands-on / supervised, video training, classroom training, online training, rules and regulation review, and other, please describe. Red indicates all service providers, violet indicates on-ramp personnel, and blue indicates on-aircraft personnel. The data given in the graph are as follows: General orientation: Red: 33, violet: 15, blue: 6. Hands-on / supervised: Red: 17, violet: 13, blue: 5. Video training: Red: 29, violet: 14, blue: 4. Classroom training: Red: 18, violet: 12, blue 5. Online training: Red 29, violet: 16, blue: 7. Rules and regulation review: Red: 29, violet: 15, blue: 6. Other, please describe: Red: 3, violet: 2, blue: 0.
(7 respondents) and general orientation (6 respondents). Similarly, for on-ramp personnel, the top training methods by airports were online training (16 airports), rules and regulations review (15 airports), and general orientation (15 airports). The least used method in this group was also classroom training (12 respondents).
GSP responses on training mirrored those of airports, with the most frequent training being general safety orientation and ramp operations, followed by OSHA training, push back, driving, marshalling, and communication (phraseology). Five of seven GSPs use in-person instructional (classroom) and on-the-job/hands-on training, with two of the seven using virtual/computer-based corporate training.
Responses from GSPs on training types, from most-to-least frequent (# responses):
- General safety orientation (5)
- Ramp operations (5)
- OSHA training (4)
- Push back (3)
- Driving (3)
- Marshalling (3)
- Communication (phraseology) (2)
Human Factors Considerations
In addressing the physical, cognitive, and social influences on worker safety, human factors plays a critical role in ensuring a safe, efficient working environment. The survey aimed to assess how airports recognize and incorporate human factors into their safety programs, along with the strategies airports use to foster a strong safety culture among ramp personnel. The survey included questions about specific human factors challenges that airports may consider when
developing safety programs and policies. These challenges were personnel awareness of surroundings, task-related distractions, weather conditions, miscommunication among workers, non-verbal communication challenges, fatigue, stress, cultural differences affecting communication, task responsibilities, vehicle and equipment design, automation, improper use of PPE, lack of standardized procedures, non-enforcement of safety rules, cell phone use, and overall safety enforcement.
Respondents were asked to indicate whether their airport explicitly addresses these factors in ramp safety programs, policies, and operational guidelines and how frequently such factors are considered. Beyond identifying human factors risks, the survey was designed to capture how airports actively engage ramp workers in fostering a culture of safety. Participants were asked whether their airports use specific strategies (e.g., modeling safe behavior by management and supervisors, ensuring visible leadership presence on the ramp, conducting focus groups, providing regular safety training, empowering employees in safety matters, and offering ongoing education and training).
Frequency of Human Factors Considerations
Figure 7 indicates that the most frequently considered human factors in airport programs, policies, guidelines, and operations are (1) awareness of personal surroundings (49 always or frequently), (2) weather (45 always or frequently), and (3) workers being distracted by their tasks (41 always or frequently). The three factors most frequently mentioned appear to be prioritized across airport safety initiatives, reflecting a focus on situational awareness and environmental conditions that directly affect personnel performance on the ramp.
Several other human factors were also reported by most airports as being regularly considered, with similar frequencies across respondents:
- Cell phone use (35 always or frequently)
- Miscommunication between ramp workers and others (32 always or frequently)
- Responsibility of tasks (34 always or frequently)
- Standardization of procedures (37 always or frequently)
- Worker fatigue (32 always or frequently)
- Vehicle and equipment design (25 always or frequently)
- Worker stress (29 always or frequently)
The least considered human factors among respondents for both airports and GSPs were automation of equipment (21 rarely or never) and cultural differences resulting in communication difficulties (22 rarely or never).
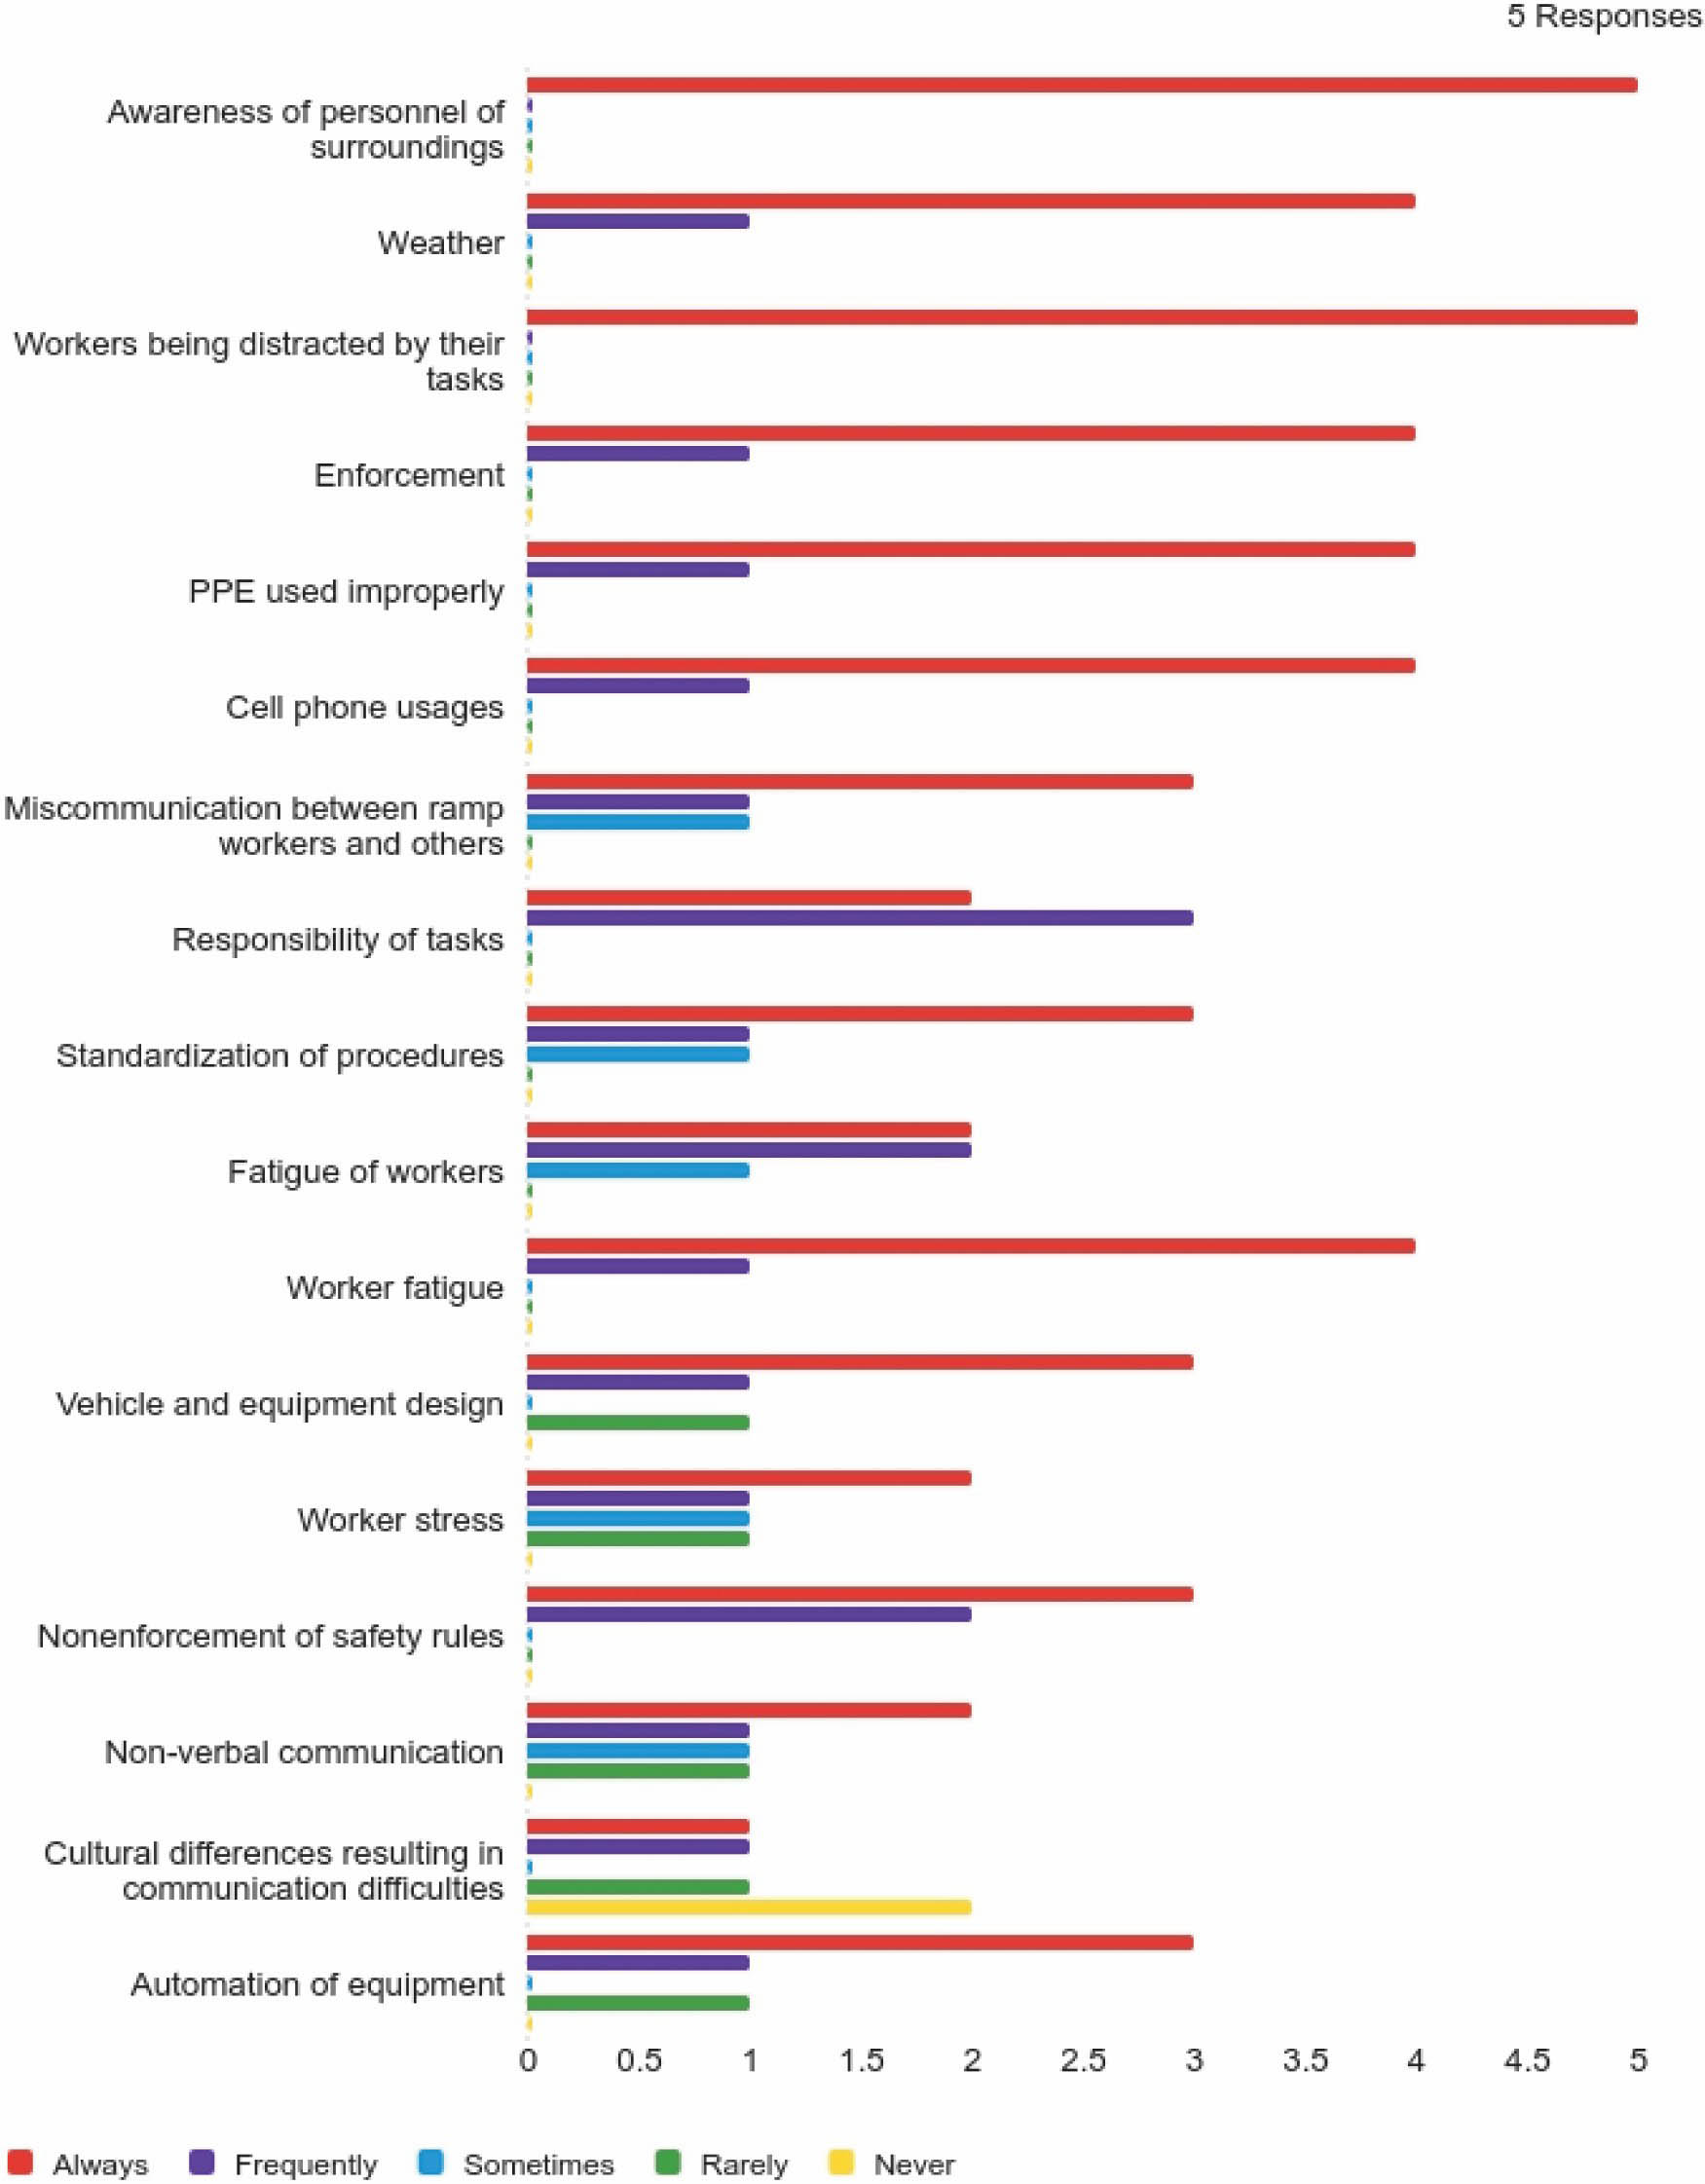
For GSPs (Figure 8) the most frequently considered factors are awareness of personal surroundings (5 always) and workers being distracted by their tasks (5 always). Additional human factors reported as being regularly considered were weather, enforcement, PPE used improperly, cell phone use, and worker fatigue (4 always). Five out of the seven respondents indicated these factors as always or frequently being considered.
Strategies to Engage Ramp Workers in a Safety Culture
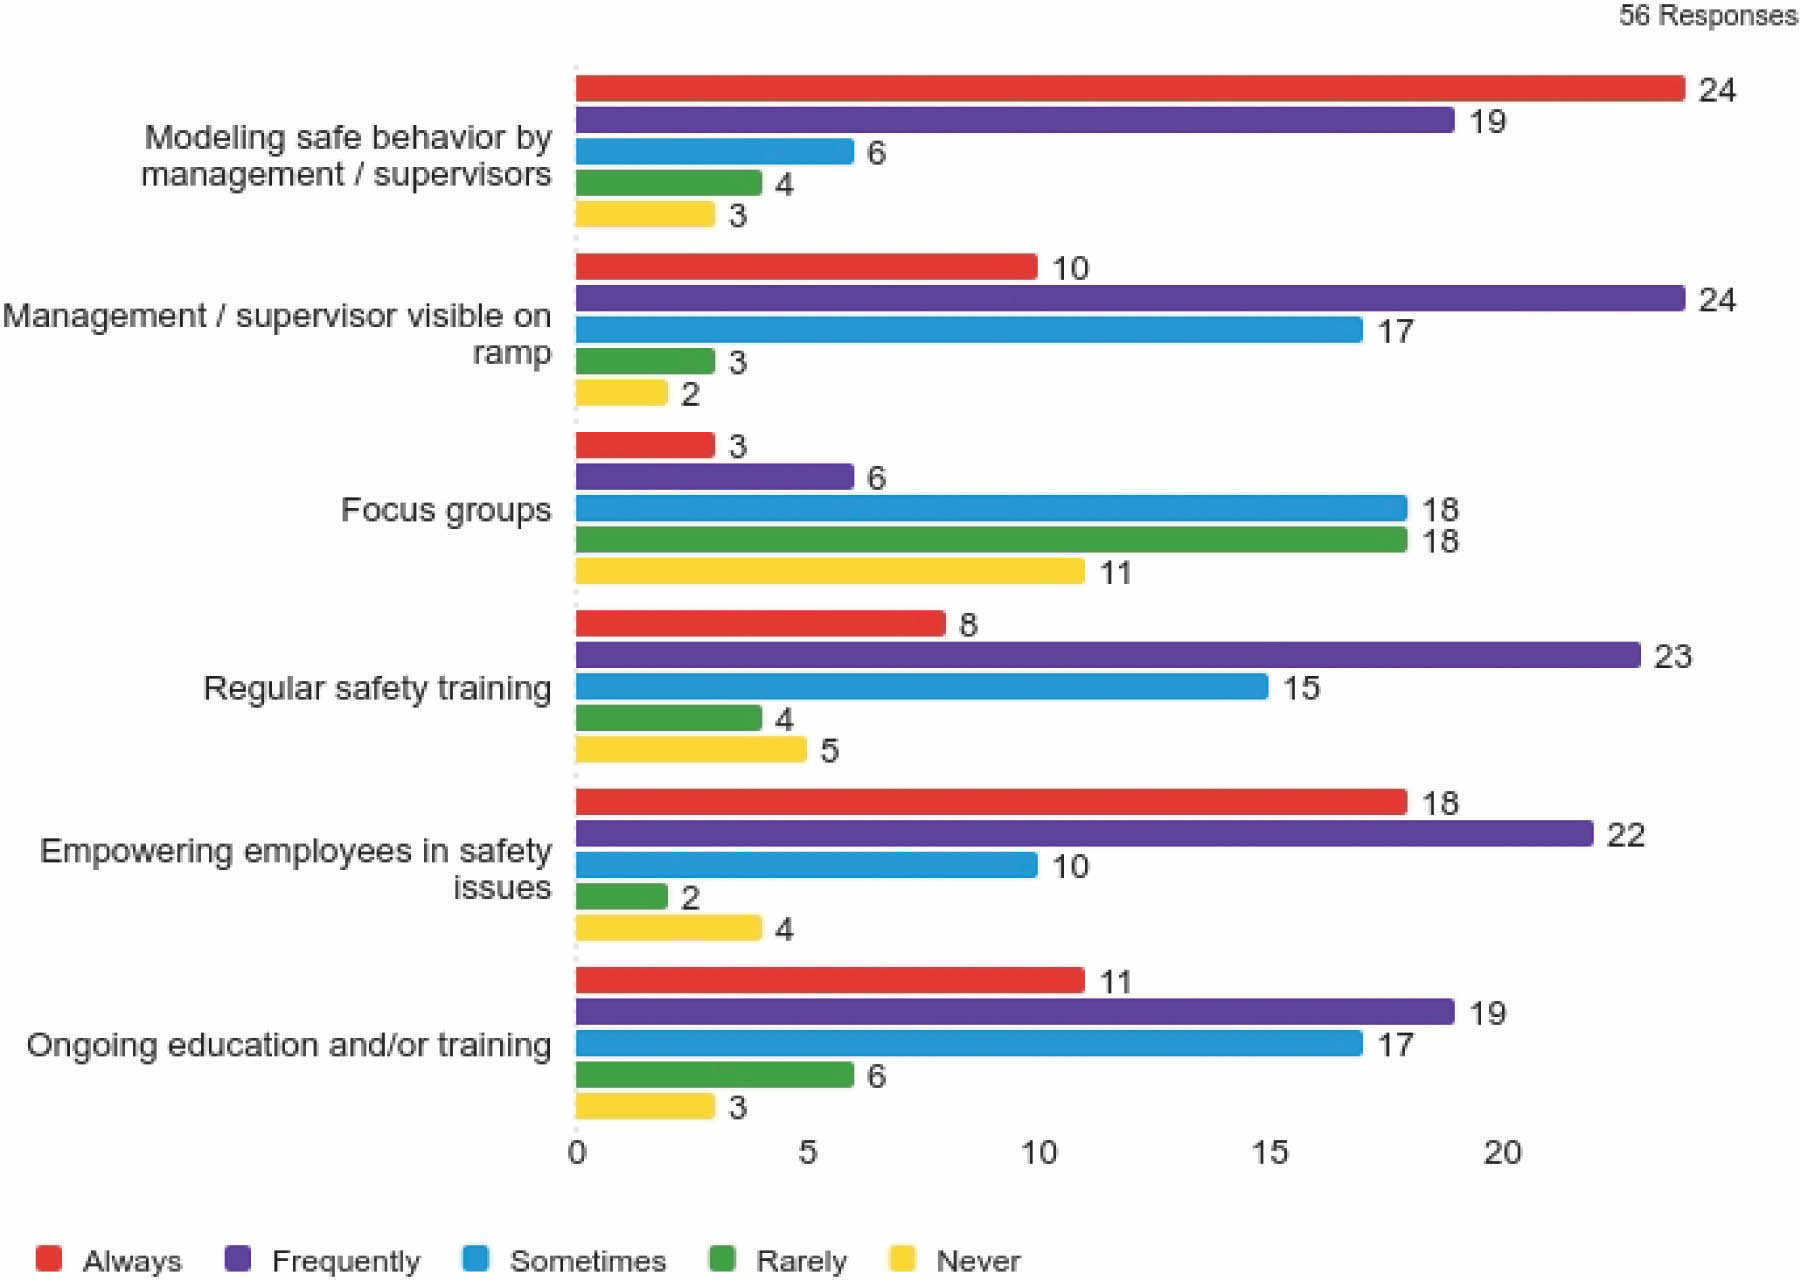
Figure 9 shows the strategies airports use to engage ramp workers in a safety culture. Survey respondents indicated that the strategy airports use most widely is to have managers and supervisors modeling safe behavior and practices. Out of 56 respondents, 24 reported that this strategy

Long Description.
The horizontal axis ranges from 0 to 35 in increments of 5. The vertical axis lists awareness of personnel of surroundings, weather, workers being distracted by their tasks, enforcement, PPE used improperly, cell phone usage, miscommunication between ramp workers and others, responsibility of tasks, standardization of procedures, fatigue of workers, worker fatigue, vehicle and equipment design, worker stress, nonenforcement of safety rules, non-verbal communication, cultural differences resulting in communication difficulties, and automation of equipment. Red indicates always, violet indicates frequently, blue indicates sometimes, green indicates rarely, and yellow indicates never. The data given in the graph are estimated as follows: Awareness of personnel of surroundings: Red: 38, violet: 12, blue: 6, green: 1, yellow: 0. Weather: Red: 28, violet: 17, blue: 7, green: 3, yellow: 0. Workers being distracted by their tasks: Red: 25, violet: 16, blue: 12, green: 1, yellow: 2. Enforcement: Red: 12, violet: 19, blue: 9, green: 5, yellow: 1. PPE used improperly: Red: 22, violet: 15, blue: 11, green: 6, yellow: 2. Cell phone usage: Red: 22, violet: 14, blue: 13, green: 5, yellow: 3. Miscommunication between ramp workers and others: Red: 20, violet: 13, blue: 11, green: 7, yellow: 4. Responsibility of tasks: Red: 18, violet: 16, blue: 12, green: 5, yellow: 4. Standardization of procedures: Red: 18, violet: 17, blue: 13, green: 2, yellow: 1. Fatigue of workers: Red: 17, violet: 14, blue: 13, green: 7, yellow: 4. Worker fatigue: Red: 16, violet: 14, blue: 13, green: 7, yellow: 5. Vehicle and equipment design: Red: 15, violet: 9, blue: 14, green: 8, yellow: 5. Worker stress: Red: 14, violet: 13, blue: 14, green: 6, yellow: 4. Nonenforcement of safety rules: Red: 13, violet: 17, blue: 12, green: 6, yellow: 3. Non-verbal communication: Red: 13, violet: 9, blue: 15, green: 9, yellow: 3. Cultural differences resulting in communication difficulties: Red: 8, violet: 5, blue: 16, green: 13, yellow: 6. Automation of equipment: Red: 7, violet: 8, blue: 18, green: 10, yellow: 17.
Long Description.
The horizontal axis ranges from 0 to 5 in increments of 0.5. The vertical axis lists awareness of personnel of surroundings, weather, workers being distracted by their tasks, enforcement, PPE used improperly, cell phone usage, miscommunication between ramp workers and others, responsibility of tasks, standardization of procedures, fatigue of workers, worker fatigue, vehicle and equipment design, worker stress, nonenforcement of safety rules, non-verbal communication, cultural differences resulting in communication difficulties, and automation of equipment. Red indicates always, violet indicates frequently, blue indicates sometimes, green indicates rarely, and yellow indicates never. The data given in the graph are estimated as follows: Awareness of personnel of surroundings: Red: 5, violet: 0, blue: 0, green: 0, yellow: 0. Weather: Red: 4, violet: 1, blue: 0, green: 0, yellow: 0. Workers being distracted by their tasks: Red: 5, violet: 0, blue: 0, green: 0, yellow: 0. Enforcement: Red: 4, violet: 1, blue: 0, green: 0, yellow: 0. PPE used improperly: Red: 4, violet: 1, blue: 0, green: 0, yellow: 0. Cell phone usages: Red: 4, violet: 1, blue: 0, green: 0, yellow: 0. Miscommunication between ramp workers and others: Red: 3, violet: 1, blue: 1, green: 0, yellow: 0. Responsibility of tasks: Red: 2, violet: 3, blue: 0, green: 0, yellow: 0. Standardization of procedures: Red: 3, violet: 1, blue: 1, green: 0, yellow: 0. Fatigue of workers: Red: 2, violet: 2, blue: 1, green: 0, yellow: 0. Worker fatigue: Red: 4, violet: 1, blue: 0, green: 0, yellow: 0. Vehicle and equipment design: Red: 3, violet: 1, blue: 0, green: 1, yellow: 0. Worker stress: Red: 2, violet: 1, blue: 1, green: 1, yellow: 0. Nonenforcement of safety rules: Red: 3, violet: 2, blue: 0, green: 0, yellow: 0. Non-verbal communication: Red: 2, violet: 1, blue: 1, green: 1, yellow: 0. Cultural differences resulting in communication difficulties: Red: 1, violet: 1, blue: 0, green: 1, yellow: 2. Automation of equipment: Red: 3, violet: 1, blue: 0, green: 1, yellow: 0.
Long Description.
The horizontal axis ranges from 0 to 20 in increments of 5. The vertical axis lists modeling safe behavior by management / supervisors, management / supervisor visible on ramp, focus groups, regular safety training, empowering employees in safety issues, and ongoing education and or training. Red indicates always, violet indicates frequently, blue indicates sometimes, green indicates rarely, and yellow indicates never. The data given in the graph are as follows: Modeling safe behaviour by management / supervisors: Red: 24, violet: 19, blue: 6, green: 4, yellow: 3. Management / supervisor visible on ramp: Red: 10, violet: 24, blue: 17, green: 3, yellow: 2. Focus groups: Red: 3, violet: 6, blue: 18, green: 18, yellow: 11. Regular safety training: Red: 8, violet: 23, blue: 15, green: 4, yellow: 5. Empowering employees in safety issues: Red: 18, violet: 22, blue: 10, green: 2, yellow: 4. Ongoing education and or training: Red: 11, violet: 19, blue: 17, green: 6, yellow: 3.
is always used at their airport and another 19 indicated it is frequently used. Closely following are the strategies of (1) maintaining management/supervisor visibility on the ramp and (2) conducting regular safety training (34 and 31 out of 56 respondents, respectively) stating that these approaches are always or frequently employed. These strategies help reinforce a consistent presence of leadership and continuous learning in daily operations. The least commonly used strategy was focus groups, with nine respondents stating that they always or frequently use them.
Overall, airports and GSPs reported the following strategies (Figure 10) were all commonly used: modeling safe behavior by management and supervisors, management/supervisor visibility on the ramp, regular safety training, empowering employees in safety issues, and ongoing education and/or training. Most responses ranged from “sometimes” to “always.”
Communication Methods for Reinforcing Safety Culture
This section presents survey findings about the communication methods airports use to promote and reinforce a culture of safety among airport employees and GSPs. Effective communication, where all individuals working in ramp areas are consistently informed, aware of expectations, and engaged in proactive safety practices, is a cornerstone of any successful safety program.
The survey examined how frequently various communication channels are used to convey the importance of safety culture. Respondents were asked to indicate how often their airport uses specific methods (e.g., emails, in-person or virtual meetings, training sessions, published guidelines, regular reminders, internal websites, and physical signage) to engage both airport staff and tenant operators. These methods are vital tools for delivering consistent messaging, maintaining awareness, and reinforcing safety expectations across diverse teams and work environments.

Long Description.
The horizontal axis ranges from 0 to 4 in increments of 1. The vertical axis lists modeling safe behavior by management / supervisors, management / supervisor visible on ramp, regular safety training, empowering employees in safety issues, and ongoing education and or training. Red indicates always, violet indicates frequently, blue indicates sometimes, green indicates rarely, and yellow indicates never. The data given in the graph are estimated as follows: Modeling safe behaviour by management / supervisors: Red: 4, violet: 1, blue: 0, green: 0, yellow: 0. Management / supervisor visible on ramp: Red: 3, violet: 2, blue: 0, green: 0, yellow: 0. Regular safety training: Red: 4, violet: 1, blue: 0, green: 0, yellow: 0. Empowering employees in safety issues: Red: 4, violet: 1, blue: 0, green: 0, yellow: 0. Ongoing education and or training: Red: 3, violet: 2, blue: 0, green: 0, yellow: 0.
Additionally, the survey explored the formal mechanisms airports use to communicate specific safety concerns to airlines and GSPs. This question sought to identify whether structured systems or protocols exist to ensure that critical safety information is shared effectively and addressed in a timely manner. The responses to these questions indicate how airports manage communication across organizational boundaries and indicate the methods used most, the consistency of communication efforts, and opportunities to improve safety-related messaging between airport authorities and the broader ramp and tenant workforce.
Methods to Assess Safety Trends
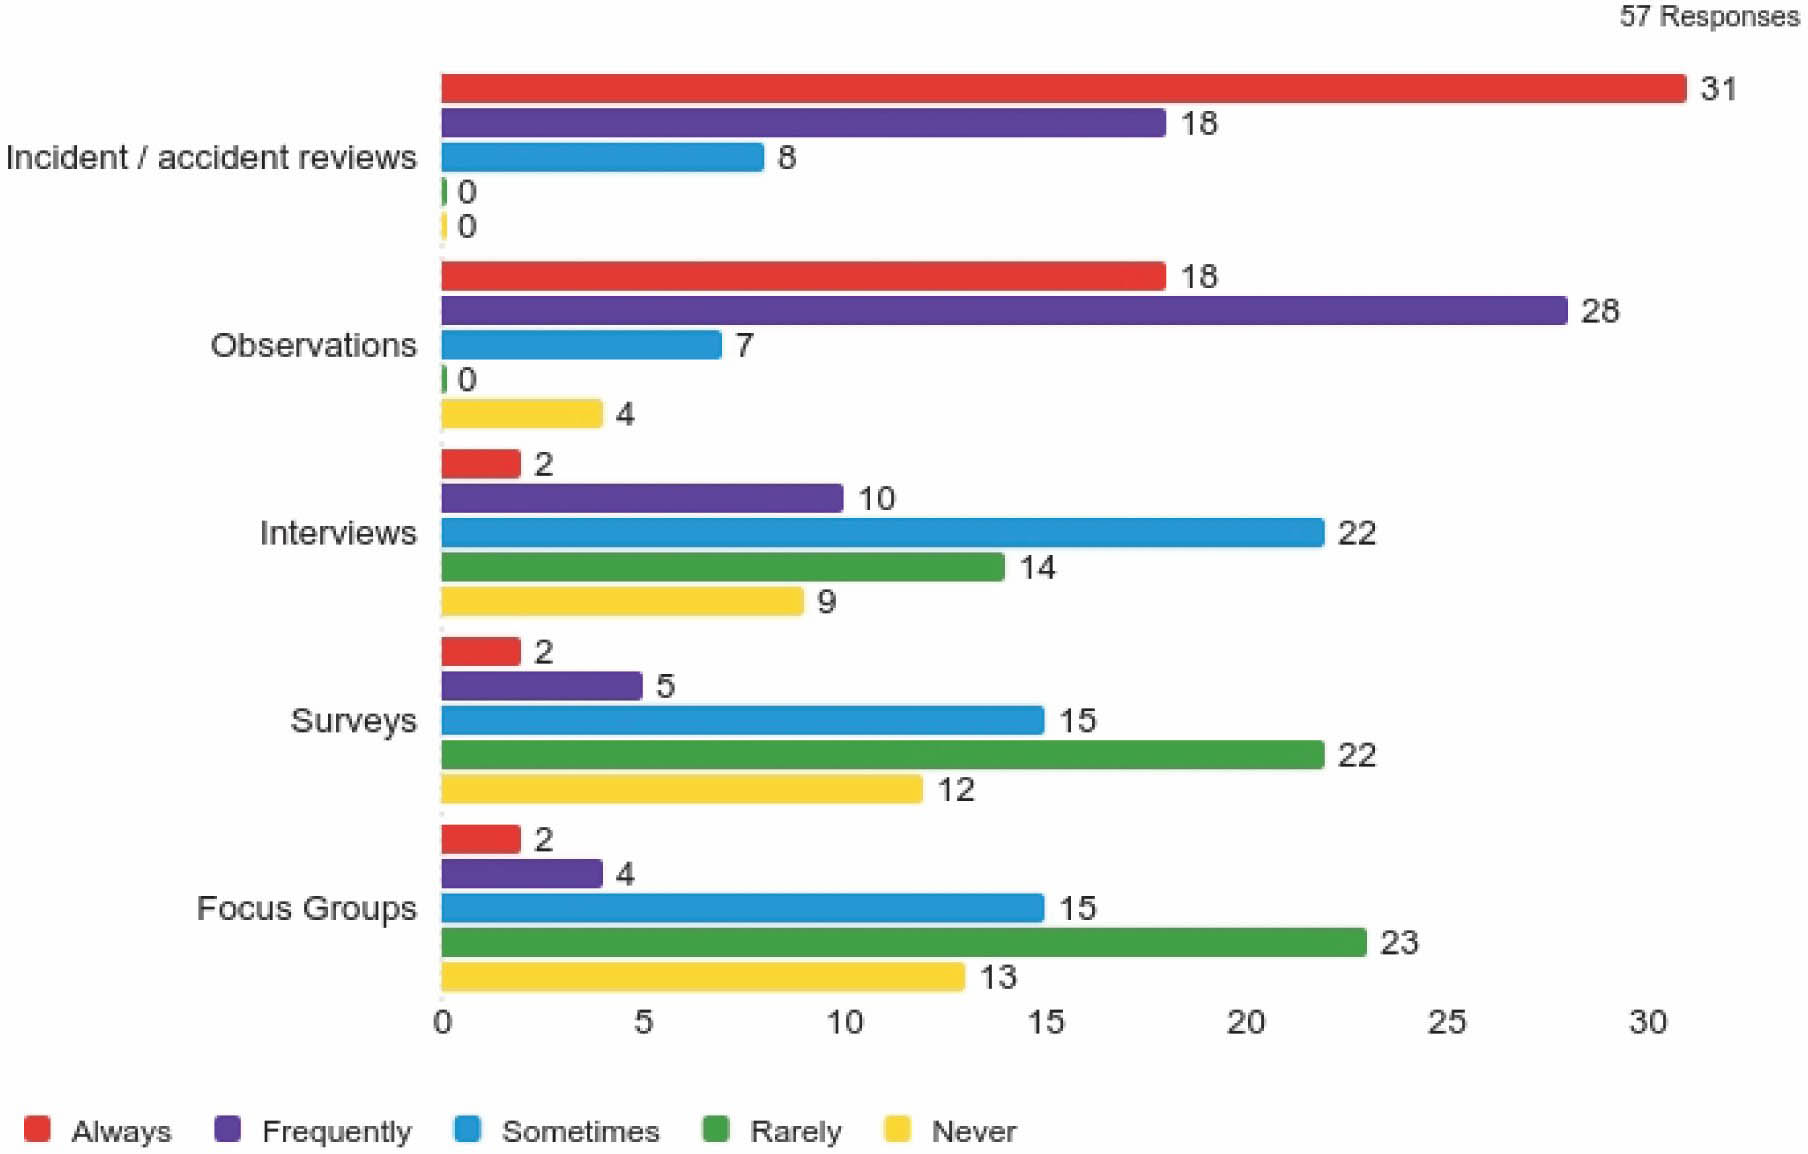
Survey responses indicate that the most widely used method for assessing ramp safety and identifying safety trends is the use of incident/accident reviews (Figure 11). Out of 57 responses, 31 reported that respondents always use this method and another 18 reported they frequently rely on it. No airports indicated that they rarely or never use incident or accident reviews. The second most frequently used method is direct observation. Out of the 57 responses, 18 airports reported they always use observational methods to monitor safety and another 28 indicated they frequently use such methods.
Surveys, interviews, and focus groups are significantly less common as tools for assessing safety trends. Out of 57 respondents, only 2 reported that they always use surveys, interviews, and/or focus groups. Most responses for these methods fell within the “sometimes,” “rarely,” or “never” categories.
Overall, the data shows a preference for incident review and on-site observation approaches rather than surveys, interviews, and focus groups.
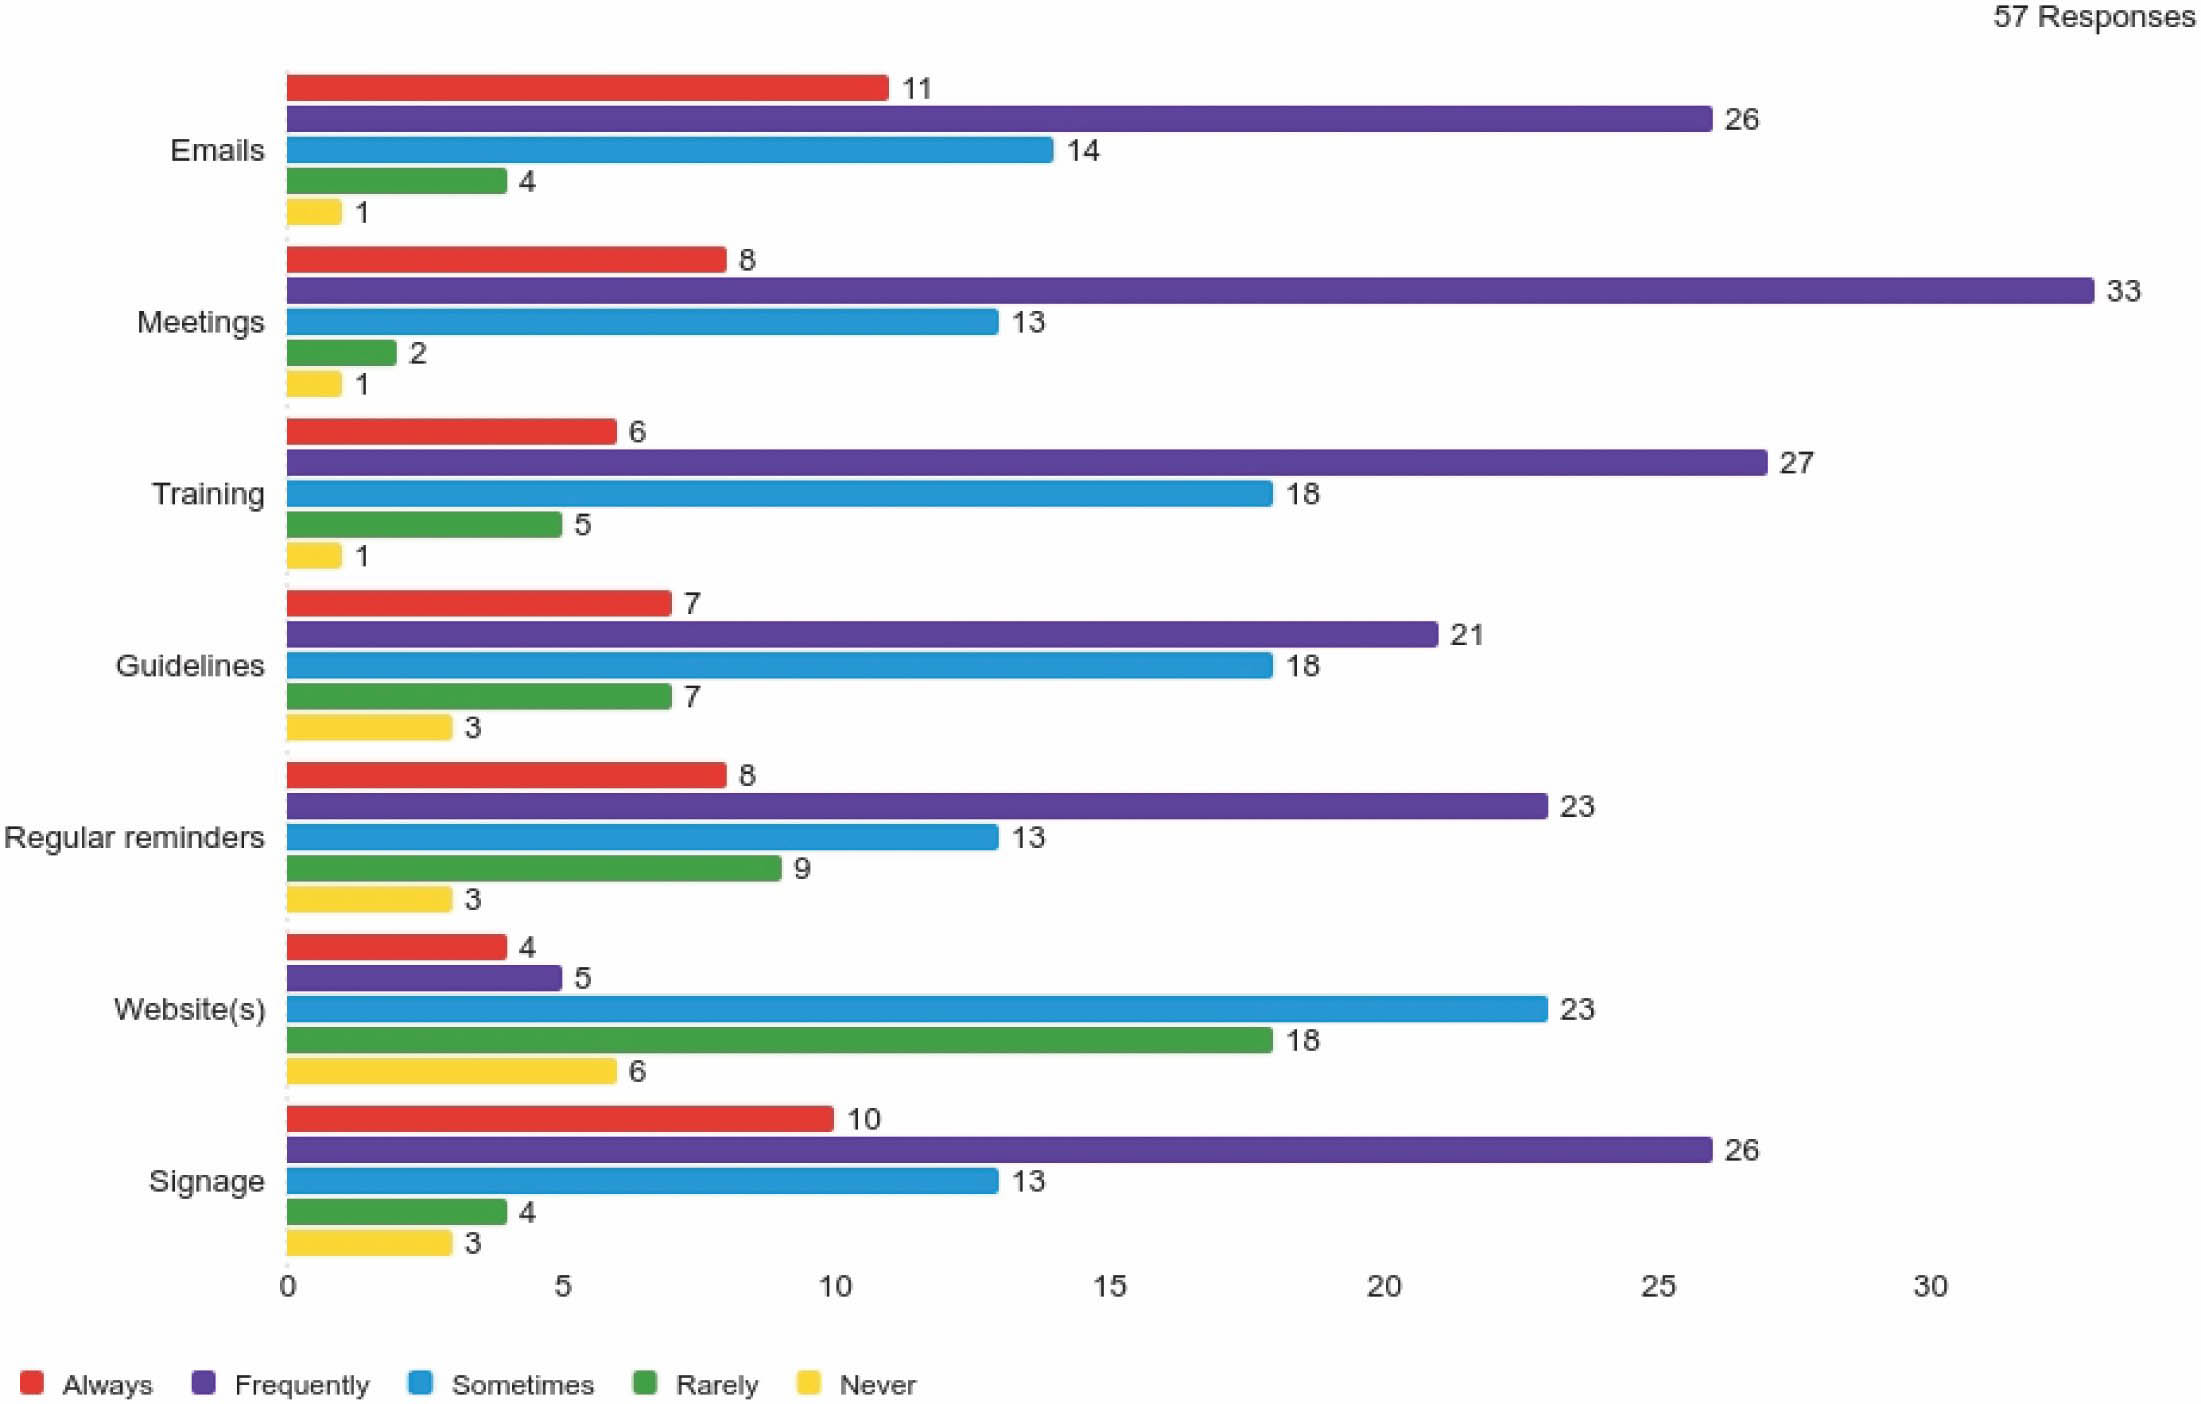
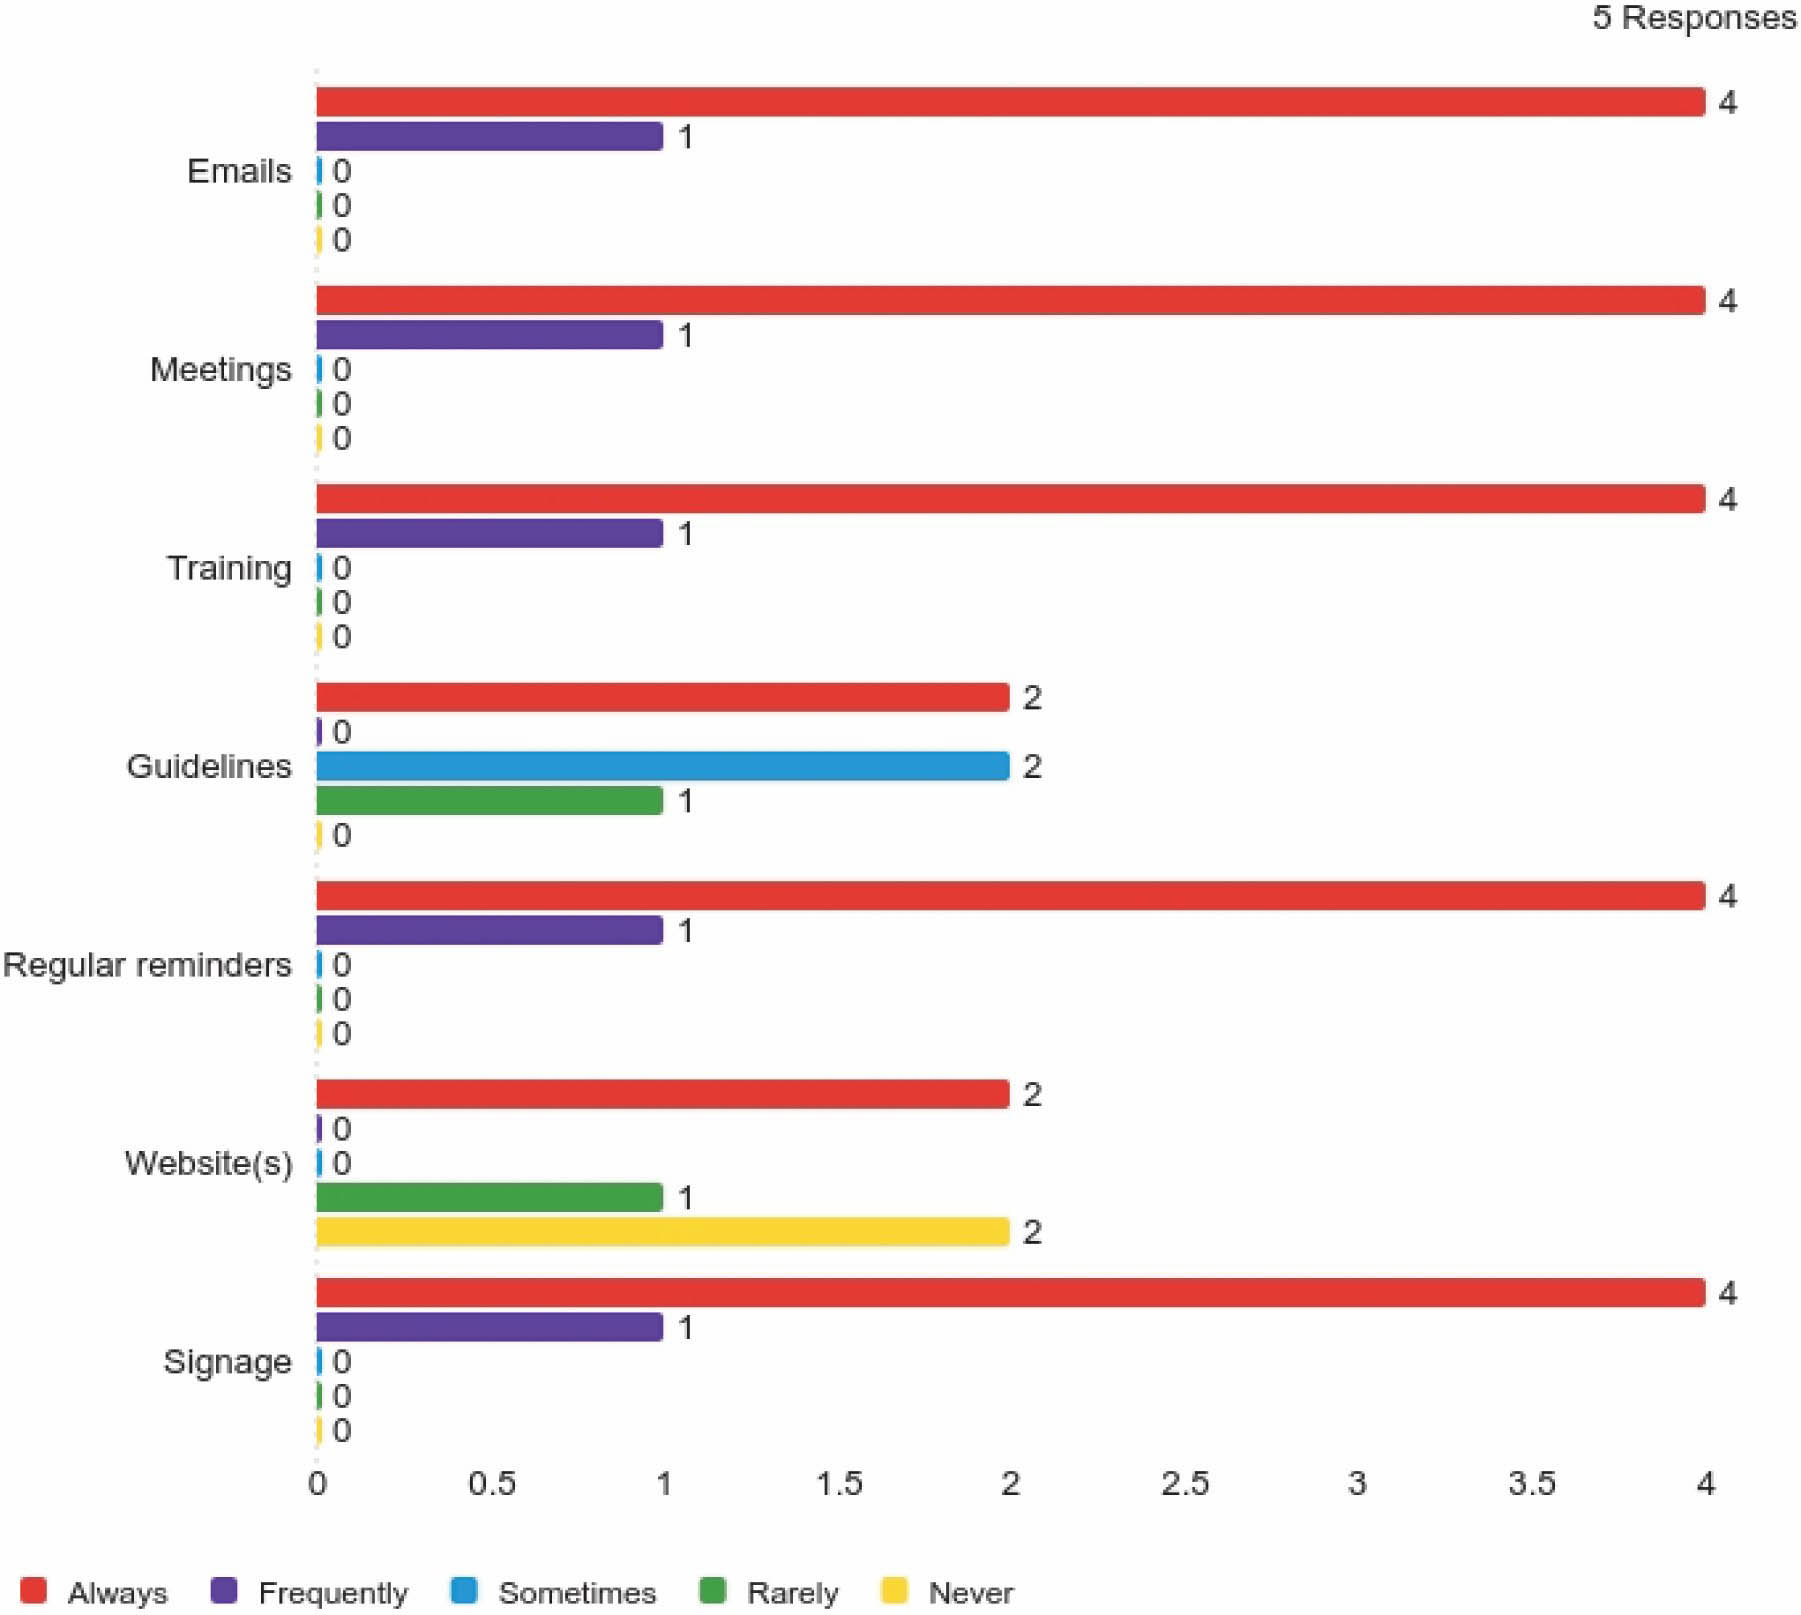
The results from the airports and GSPs on frequency and methods of communication (Figures 12 and 13) provide insight into the communication strategies airports use to convey safety information to their employees. Among the methods identified, email emerged as the most used channel that is “always” used. Specifically, 11 of 57 airport respondents indicated that they “always” use email to communicate safety-related information and 26 of the 57 reported using it “frequently.” All five
Long Description.
The horizontal axis ranges from 0 to 30 in increments of 5. The vertical axis lists incident / accident reviews, observations, interviews, surveys, and focus groups. Red indicates always, violet indicates frequently, blue indicates sometimes, green indicates rarely, and yellow indicates never. The data given in the graph are as follows: Incident / accident reviews: Red: 31, violet: 18, blue: 8, green: 0, yellow: 0. Observations: Red: 18, violet: 28, blue: 7, green: 0, yellow: 4. Interviews: Red: 2, violet: 10, blue: 22, green: 14, yellow: 9. Surveys: Red: 2, violet: 5, blue: 15, green: 22, yellow: 12. Focus Groups: Red: 2, violet: 4, blue: 15, green: 23, yellow: 13.
Long Description.
The horizontal axis ranges from 0 to 30 in increments of 5. The vertical axis lists emails, meetings, training, guidelines, regular reminders, website(s), and signage. Red indicates always, violet indicates frequently, blue indicates sometimes, green indicates rarely, and yellow indicates never. The data given in the graph are as follows: Emails: Red: 11, violet: 26, blue: 14, green: 4, yellow: 1. Meetings: Red: 8, violet: 33, blue: 13, green: 2, yellow: 1. Training: Red: 6, violet: 27, blue: 18, green: 5, yellow: 1. Guidelines: Red: 7, violet: 21, blue: 18, green: 7, yellow: 3. Regular reminders: Red: 8, violet: 23, blue: 13, green: 9, yellow: 3. Website(s): Red: 4, violet: 5, blue: 23, green: 18, yellow: 6. Signage: Red: 10, violet: 26, blue: 13, green: 4, yellow: 3.
Long Description.
The horizontal axis ranges from 0 to 4 in increments of 0.5. The vertical axis lists emails, meetings, training, guidelines, regular reminders, website(s), and signage. Red indicates always, violet indicates frequently, blue indicates sometimes, green indicates rarely, and yellow indicates never. The data given in the graph are as follows: Emails: Red: 4, violet: 1, blue: 0, green: 0, yellow: 0. Meetings: Red: 4, violet: 1, blue: 0, green: 0, yellow: 0. Training: Red: 4, violet: 1, blue: 0, green: 0, yellow: 0. Guidelines: Red: 2, violet: 0, blue: 2, green: 1, yellow: 0. Regular reminders: Red: 4, violet: 1, blue: 0, green: 0, yellow: 0. Website(s): Red: 2, violet: 0, blue: 0, green: 1, yellow: 2. Signage: Red: 4, violet: 1, blue: 0, green: 0, yellow: 0.
GSPs use email at some level. In-person methods (e.g., meetings and training) also play a large role. Out of 57 airports, 41 reported that they always or frequently use meetings and 33 said they always or frequently use training to communicate updates to safety protocols and other important information. Other methods (e.g., guidelines, regular reminders, and signage) are used always or frequently by most respondents. Websites were the least used method—12 airports reported they rarely or never use this approach. Overall, the survey indicates that airports and GSPs rely heavily on frequent and varied communication methods, particularly emails, meetings, and training, to ensure that employees remain informed and engaged in airport safety practices.
Performance Measures
This section presents survey results on how airports track and evaluate safety performance on the ramp. Establishing meaningful performance measures is essential for monitoring the effectiveness of safety programs, identifying areas for improvement, and promoting accountability in airport staff and tenant operators. By collecting and analyzing safety-related data, airports can make informed decisions that enhance safety outcomes, reduce incidents, and support a proactive safety culture.
The survey asked whether airports currently collect any formal metrics on safety performance. For those that do, a follow-up question asked respondents to identify which specific performance indicators are being tracked. These indicators reflect a mix of metrics (e.g., injury rates, near misses, unsafe acts, number of safety audits conducted, number of training sessions delivered, employee training completion rates, safety observations, participation in safety initiatives, regulation violations, trends in safety-related incidents, and safety-related costs [such as workersʼ compensation claims, insurance premiums, and accident-related expenses]).
The responses provide insight into how airports are quantifying safety efforts, the types of metrics being prioritized, and the level of commitment to data-driven safety management. This section highlights current practices, identifies potential gaps in measurement, and offers a foundation for benchmarking and continuous improvement in ramp safety performance.
Performance Measures by Hub Type
The survey results show how the collection of safety performance measures varies by airport size (Figure 14). Six responding large hub airports reported collecting safety-related performance data. The share declines with airport size: three medium hub airports, seven small hub airports, and eight non-hub airports reported collecting these measures. Among GSP respondents, two of the seven indicated that they collect safety performance measures.
This data suggests that airport size and scale of operations may influence the emphasis placed on performance monitoring. Larger airports may be subject to more regulatory requirements and may have more resources available to implement structured safety performance programs. Smaller airports, particularly non-hubs, may have limited staff capacity, budget, or infrastructure, that affects the ability of these airports to collect and analyze safety performance data routinely.
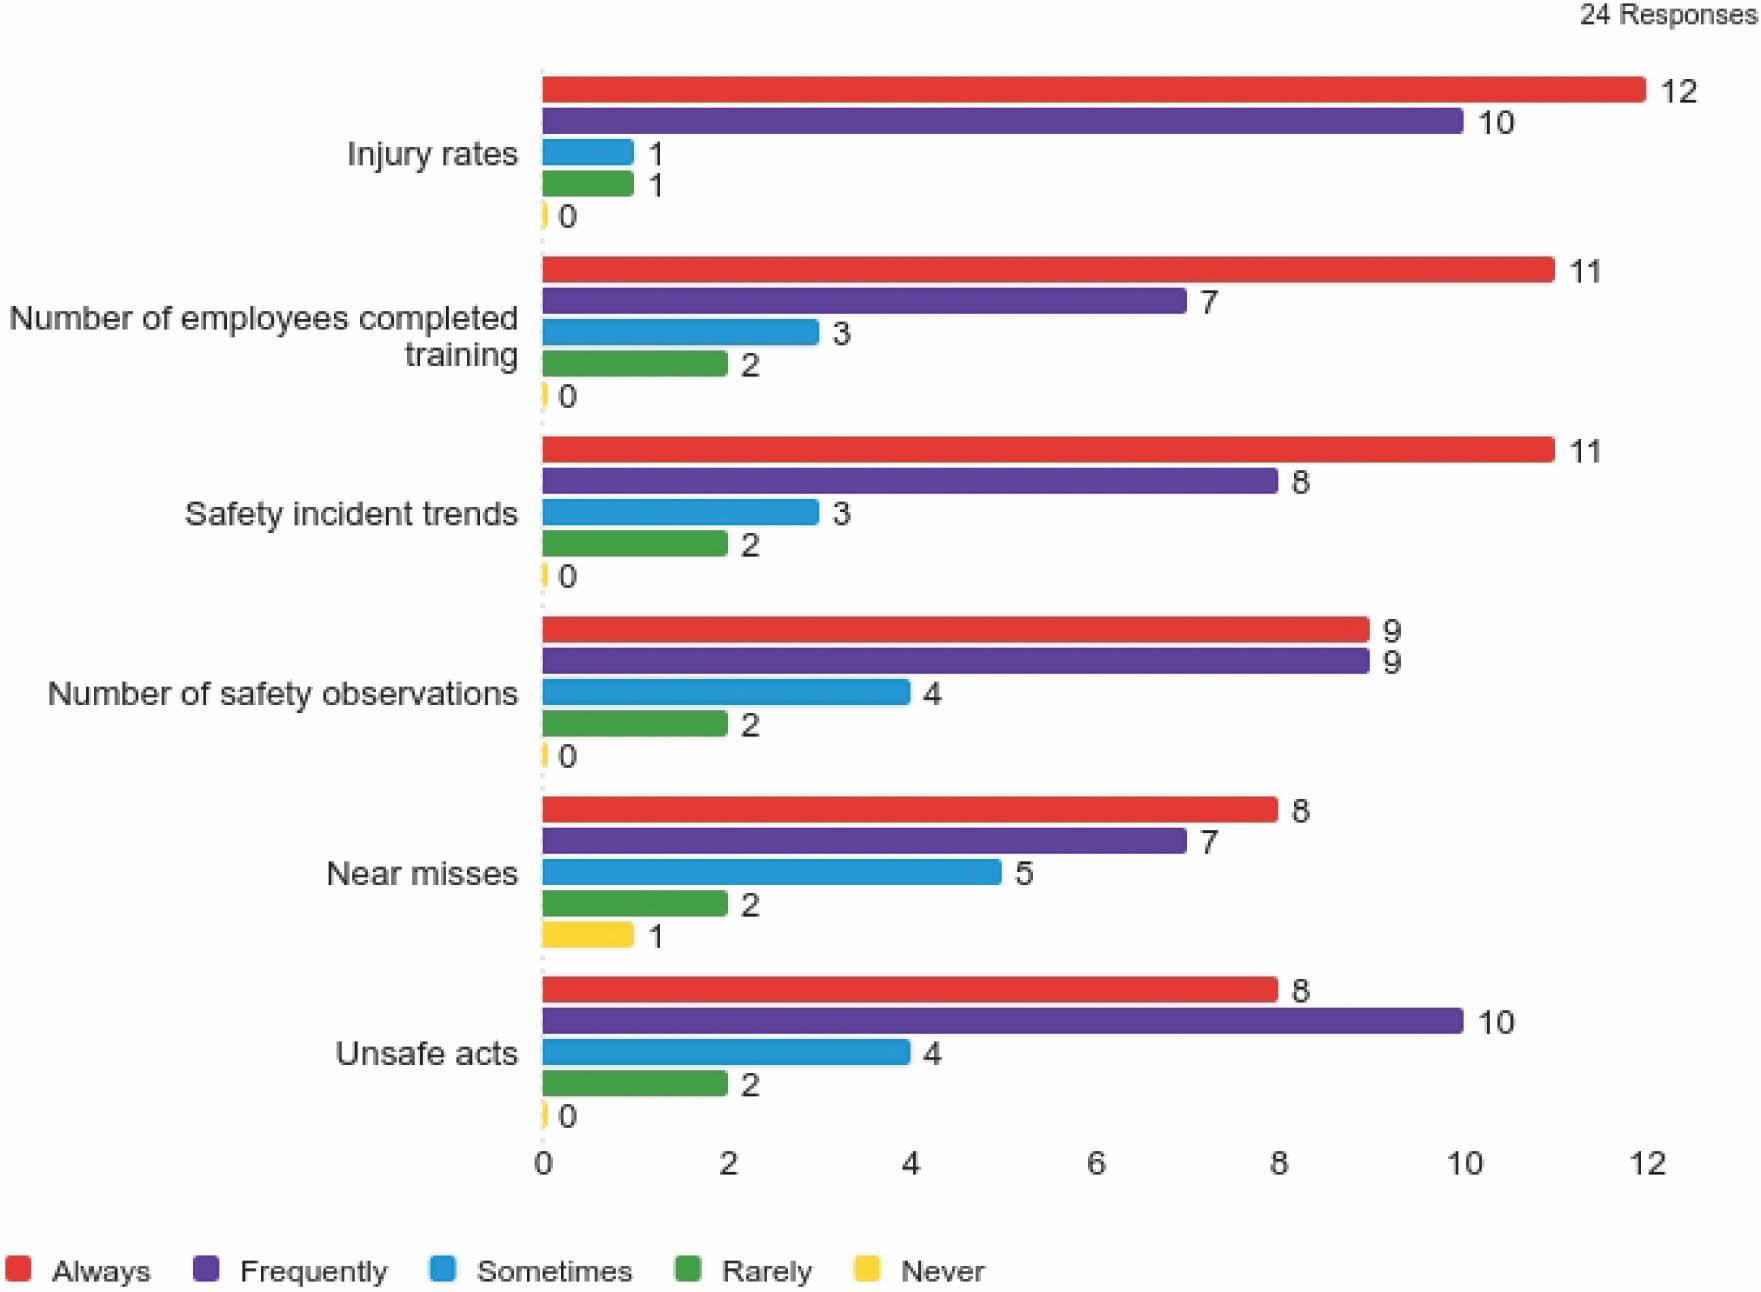
The survey results indicate that certain safety performance measures consistently are prioritized across responding airports as shown in Figure 15. Twelve respondents reported that they always collect data on injury rates and eleven respondents monitored the number of employees who have completed training and safety incident trends. These measures appear to be foundational metrics that airports rely on to monitor and improve their safety programs.

Long Description.
The horizontal axis shows the following categories: large hub, medium hub, small hub, and non-hub. The vertical axis ranges from 20 to 80 percent in increments of 20. Red indicates yes, violet indicates no. The data given in the graph are as follows: Large hub: Yes: 75 percent, no: 25 percent. Medium hub: Yes: 50 percent, no: 50 percent. Small hub: Yes: 54 percent, no: 46 percent. Non-hub: Yes: 29 percent, no: 71 percent.
Long Description.
The horizontal axis ranges from 0 to 12 in increments of 2. The vertical axis lists injury rates, the number of employees who completed training, safety incident trends, the number of safety observations, near misses, and unsafe acts. Red indicates always, violet indicates frequently, blue indicates sometimes, green indicates rarely, and yellow indicates never. The data given in the graph are as follows: Injury rates: Red: 12, violet: 10, blue: 1, green: 1, yellow: 0. Number of employees completed training: Red: 11, violet: 7, blue: 3, green: 2, yellow: 0. Safety incident trends: Red: 11, violet: 8, blue: 3, green: 2, yellow: 0. Number of safety observations: Red: 9, violet: 9, blue: 4, green: 2, yellow: 0. Near misses: Red: 8, violet: 7, blue: 5, green: 2, yellow: 1. Unsafe acts: Red: 8, violet: 10, blue: 4, green: 2, yellow: 0.

Long Description.
The horizontal axis ranges from 0 to 10 in increments of 2. The vertical axis lists the number of training sessions, number of regulation violations, participation in safety initiatives, number of safety audits, safety-related costs (like worker comp claims, insurance premiums, accident costs), and employee health measures. Red indicates always, violet indicates frequently, blue indicates sometimes, green indicates rarely, and yellow indicates never. The data given in the graph are as follows: Number of training sessions: Red: 8, violet: 8, blue: 6, green: 2, yellow: 0. Number of regulation violations: Red: 7, violet: 11, blue: 3, green: 3, yellow: 0. Participation in safety initiatives: Red: 7, violet: 7, blue: 8, green: 1, yellow: 1. Number of safety audits: Red: 6, violet: 6, blue: 8, green: 4, yellow: 0. Safety related costs (like worker comp claims, insurance premiums, accident costs): Red: 5, violet: 7, blue: 6, green: 4, yellow: 2. Employee health measures: Red: 4, violet: 10, blue: 5, green: 5, yellow: 0.
In addition, some airports reported that they always or frequently collect data on other key safety indicators, including number of regulation violations (18 airports), near misses (13 airports), unsafe acts (18 airports), number of training sessions conducted (16 airports), and number of regulation violations (18 airports).
However, some safety-related parameters still receive responses indicating that they are never collected. These include safety-related costs (e.g., workersʼ compensation, insurance premiums, accident-related expenses), near misses, and participation in safety initiatives.
No airports reported not collecting a wide range of safety performance measures, which suggests a generally proactive and safety-conscious culture among the respondents. Although some parameters (e.g., safety-related costs, near misses, and the number of training sessions) received a small number of “never” responses, most participating airports indicated that they regularly collect some form of safety-related data. This trend indicates a strong recognition of the value of data-driven safety management practices.


