Census Data Field Guide for Transportation Applications (2025)
Chapter: 10 COVID-19 and Its Implications

CHAPTER 10
COVID-19 and Its Implications
On December 31, 2019, the government in Wuhan, China, confirmed that health authorities were treating cases of COVID-19. Days later, researchers in China identified a new virus that had infected dozens of people in Asia. At the time, there was no evidence that the virus was readily being spread by humans. Health officials in China said they were monitoring it to prevent the outbreak from developing into something more severe. On January 20, 2020, the first confirmed case in the United States appeared in the state of Washington, where a man in his thirties developed symptoms after returning from a trip to Wuhan.
On February 29, 2020, the authorities announced that a patient near Seattle had died from the coronavirus, in what was believed at the time to be the first coronavirus death in the United States. In fact, two people had died earlier, although their COVID-19 diagnoses were not discovered until months later. On March 3, 2020, U.S. officials approved widespread testing. The United States had reported more than 32 million cases and more than 575,000 deaths by the end of May 2021. Figure 10.1 shows the number of new cases of COVID-19 from February 2020 through March 2023. While COVID-19 cases peaked at various times in the fall of 2020 and 2021, the peak number of cases was reported in Jan 2022. Since then, there has been a steady decline in the number of cases as the pace of vaccinations and herd immunity picked up.
In May of 2023, the U.S. Department of Health and Human Services officially declared the end of the COVID-19 public health emergency. However, the 3-year pandemic had a major impact on travel behavior, which continued to be present through the end of 2023. Changes in travel included changes in total travel, a shift to work from home for a large segment of the population, and major decreases in transit use, among others.
The pandemic impacted overall employment trends, but the impact on different segments of the population and the economy was uneven. Certain industries, like leisure and hospitality, were severely impacted by the pandemic, with a 28.8-percent decrease in employment from January 2020 to February 2021, as compared to an 8.8-percent decrease in overall employment during the same period (Figure 10.2).
This led to a K-shaped recovery, in which higher-income households recovered more fully than lower-income households. From a transportation perspective, lower-income households were more likely to include workers who did not have the option to work from home and were dependent on transit. Although these workers depended on transit, starting in January 2020, transit was facing ridership headwinds, showing a severe decrease in ridership (Figure 10.3). Any cuts in public transportation services as a potential response to the drop in ridership disproportionately affected low-income workers who rely on a reliable transit system to access their workplace.
Given these trends, the Census must provide information on a timely basis to help users of census data obtain a perspective on the short- and long-term impacts of the pandemic. Toward
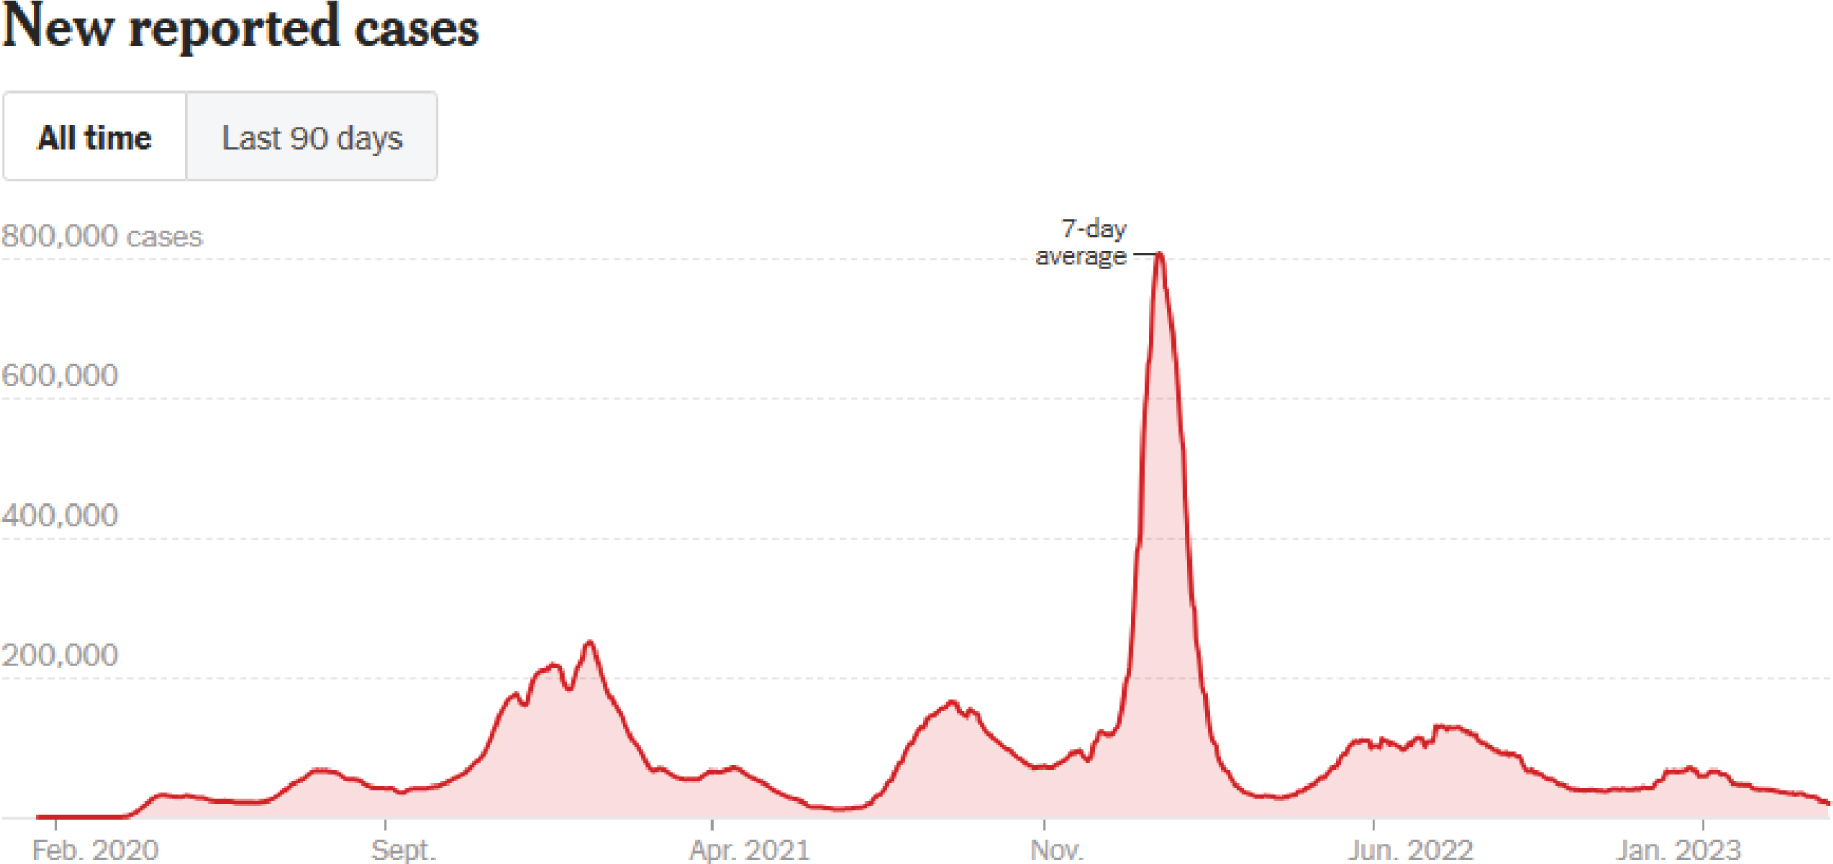
Source: https://www.nytimes.com/interactive/2021/us/covid-cases.html (accessed Nov 10, 2024).
Long Description.
The screenshot displays the number of new reported COVID-19 cases in the United States over time. The horizontal axis spans from February 2020 to January 2023. The vertical axis ranges from 0 to 800,000 cases. A curve shows the 7-day average of new cases. The curve shows several peaks, with the largest peak occurring around early 2022 where the 7-day average reaches its highest point, close to 800,000 cases. Smaller peaks appear around mid and late 2020, early and mid 2021, and mid 2022. A shaded area under the curve marks the volume of reported cases.
that end, the Census Bureau has been conducting Household Pulse Surveys since April 2020. The Household Pulse Survey is a 20-minute online survey studying how the COVID-19 pandemic has impacted households across the country from a social and economic perspective. The survey asks questions about how the ongoing crisis has affected education, employment, food security, health, housing, social security benefits, household spending, consumer spending associated with stimulus payments, intention to receive a COVID-19 vaccination, and transportation.
All these questions are particularly relevant to users of this field guide since the survey can provide an authoritative resource for understanding, on an ongoing basis, the pandemic and its impacts on transportation, housing, and other public infrastructure. The Household Pulse surveys show that there was an 8-percent increase from August 2020 to March 2021 in the percentage of households where at least one adult had substituted some or all of their typical in-person work for telework because of the COVID-19 pandemic (Figure 10.4). The work-from-home trend has continued following the end of the pandemic, and as of December 2023, a large percentage of employees work from home at least part of the work week.
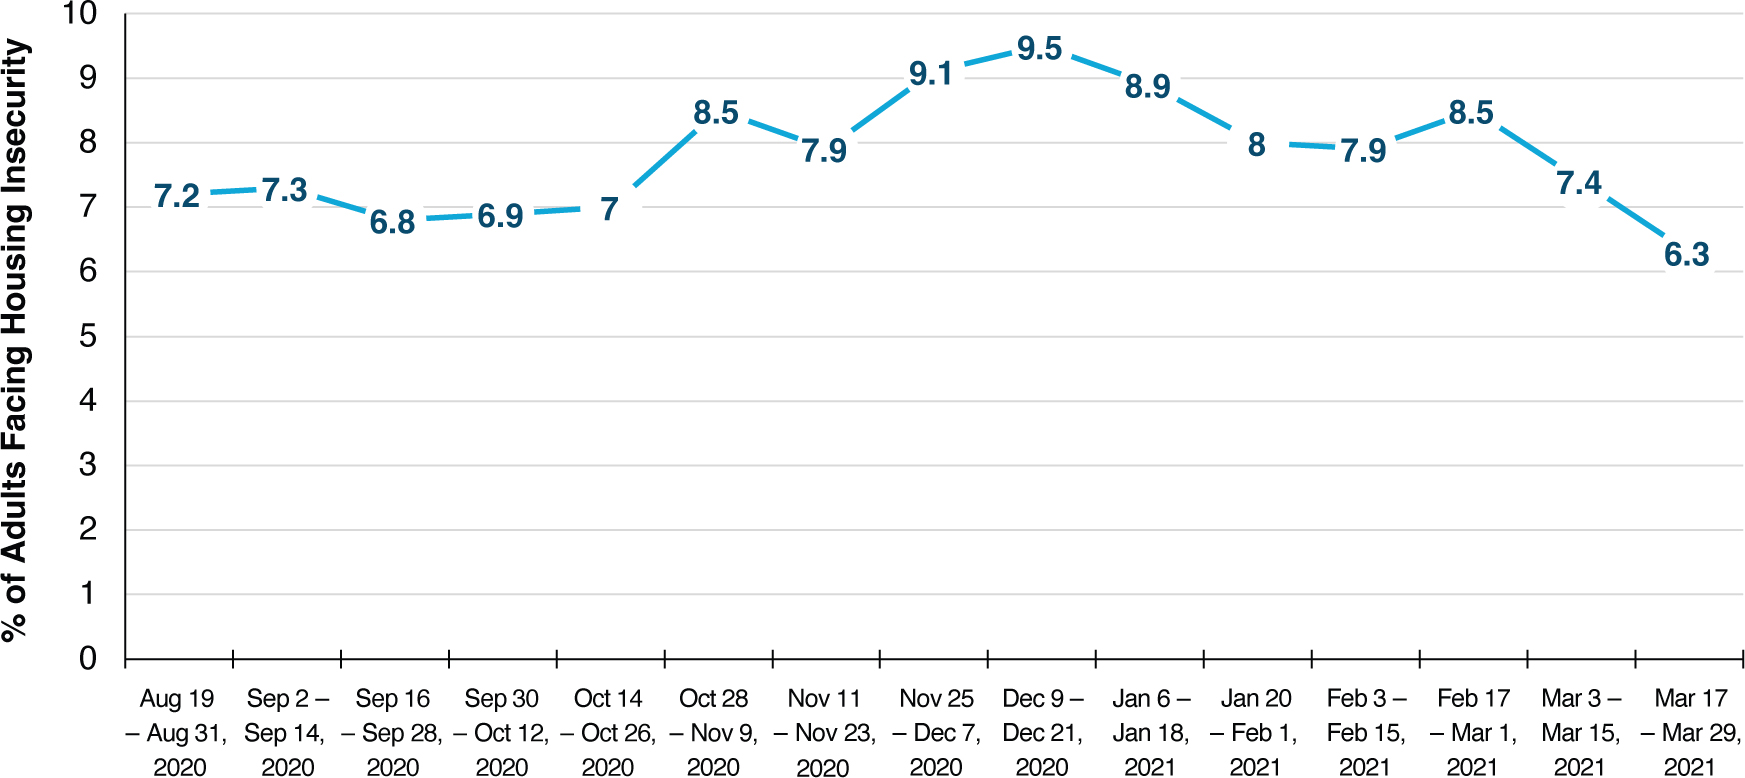
From a housing insecurity point of view, the Household Pulse surveys show a 13-percent decrease in the percentage of adults who are not current on rent or mortgage payments and who have little or no confidence that their household can pay next monthʼs rent or mortgage on time (Figure 10.5). Given the outsized impact of the pandemic on American life both in the short term and potentially in the longer term, it is critical for the field guide to reflect how census data can be used to improve our understanding of the impacts of the COVID-19 pandemic and any future pandemic on travel behavior.
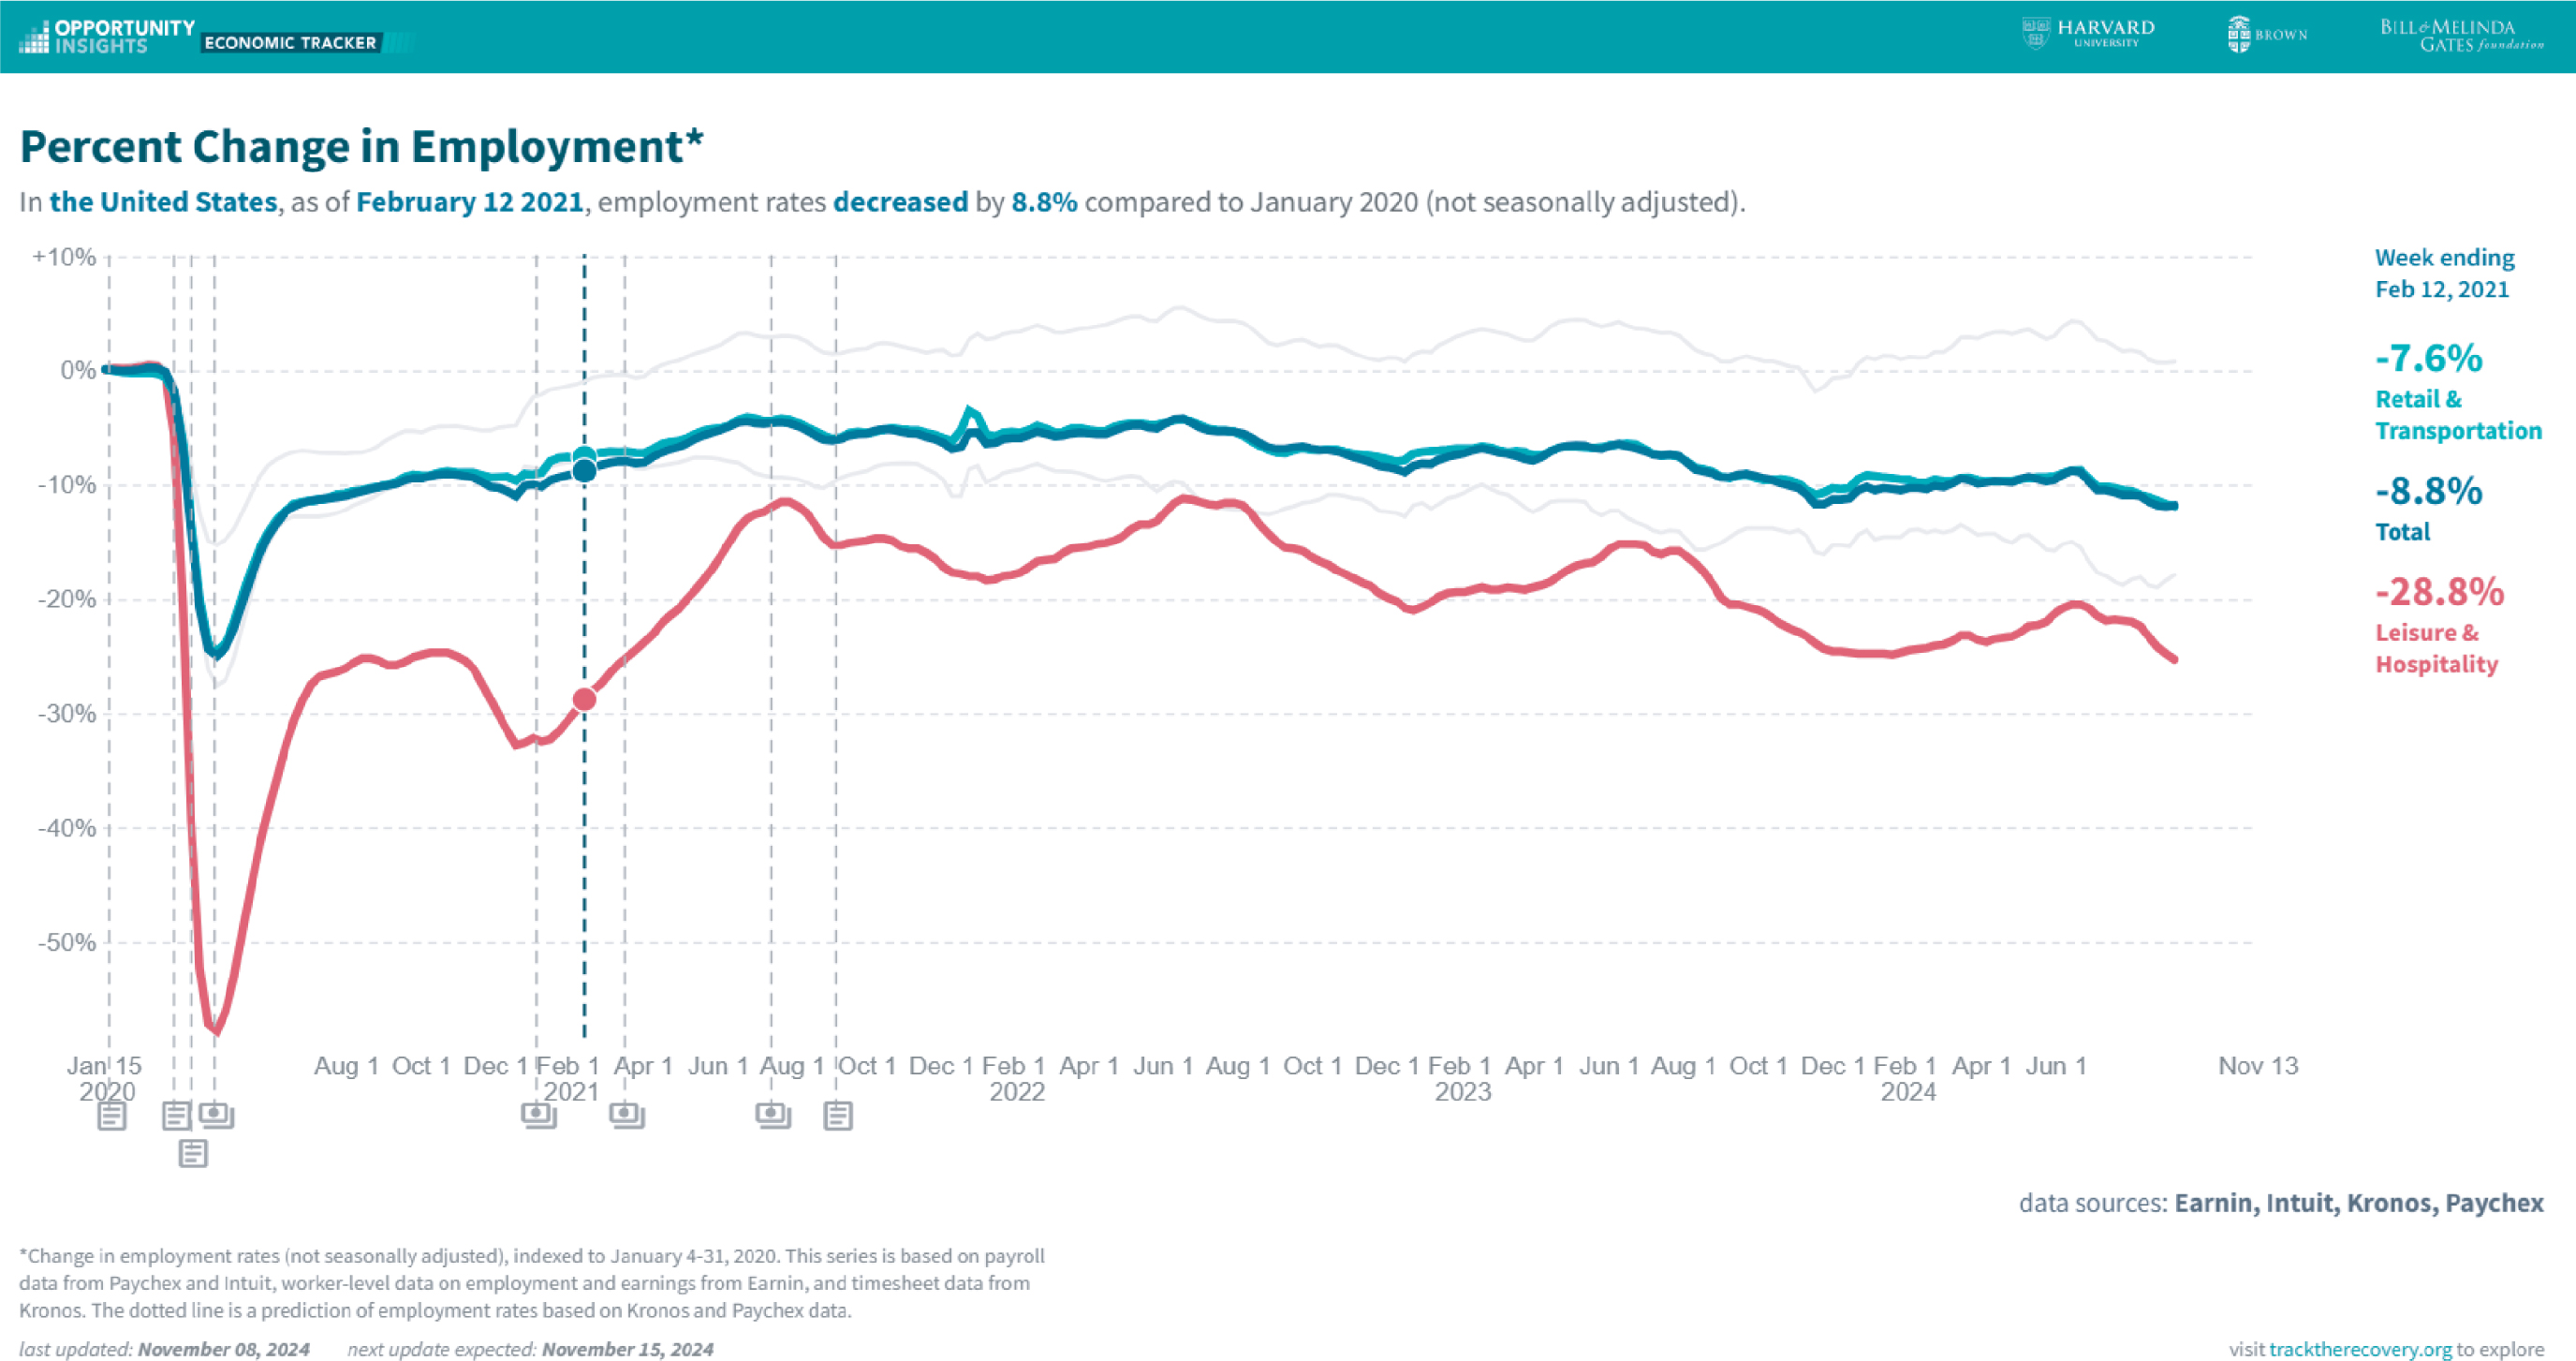
Source: https://www.tracktherecovery.org/
Long Description.
The chart presents the percent change in employment across selected industries in the United States from January 2020 to November 2024. The horizontal axis spans dates from January 2020 through November 2024, and the vertical axis ranges from negative 60 percent to positive 10 percent. Three separate trend lines represent retail and transportation, leisure and hospitality and total employment. Employment declined sharply in early 2020, with leisure and hospitality showing the largest drop. All industries show varied recovery patterns over time. By February 2021, employment in retail and transportation decreased by 7.6 percent, total employment decreased by 8.8 percent, and leisure and hospitality decreased by 28.8 percent compared to January 2020. Data sources include Earnin, Intuit, Kronos, and Paychex. The chart also includes vertical dashed lines marking certain time intervals.
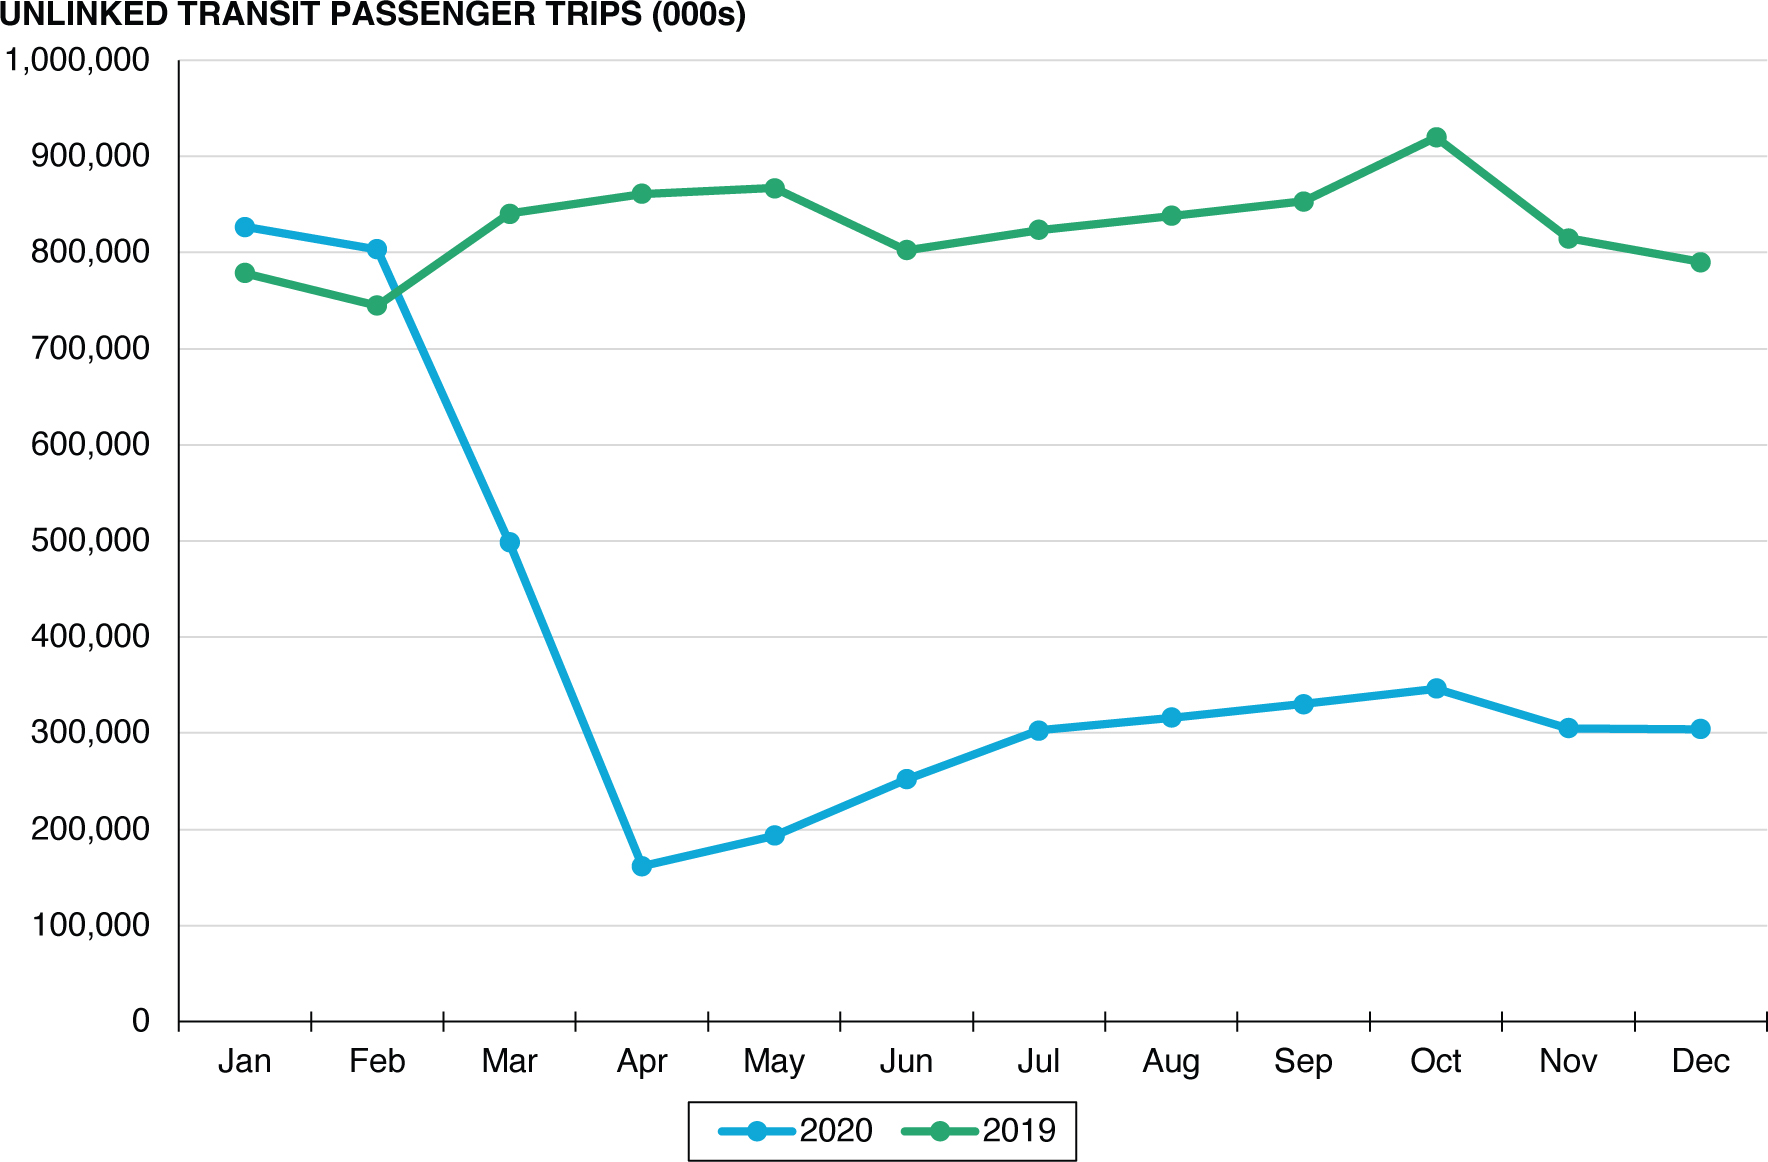
Source: https://www.apta.com/wp-content/uploads/2020-Q4-Ridership-APTA.pdf.
Long Description.
The chart displays monthly unlinked transit passenger trips in thousands for the years 2019 and 2020. The horizontal axis represents months from January to December. The vertical axis ranges from 0 to 10,000,000 trips. In 2019, transit trips remain steady throughout the year, ranging between about 7,500,000 and 9,000,000. In 2020, trips begin at similar levels in January and February but show a sharp decline in March and reach the lowest point in April, around 1,500,000. A gradual increase follows from May through September, peaking in October at slightly above 3,000,000, before dipping slightly again in November and December. The chart highlights the sharp decline in 2020 transit ridership compared to 2019, especially during the early months of the COVID-19 pandemic.
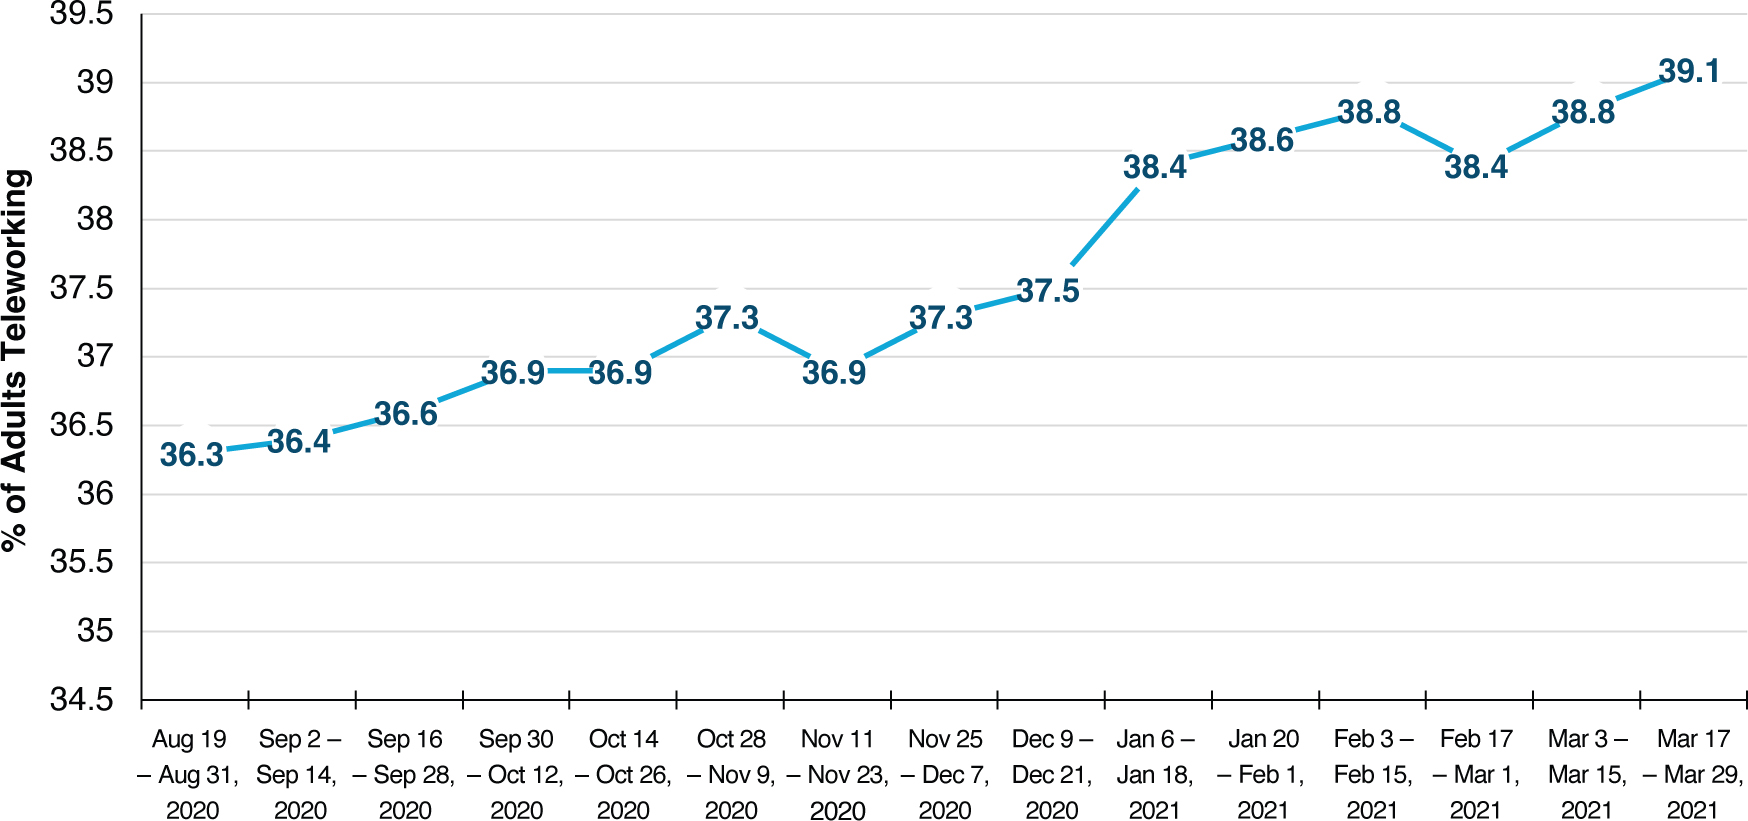
Source: U.S. Census Bureau Household Pulse Survey.
Long Description.
The chart presents the percentage of adults teleworking over time. The horizontal axis shows dates from August 31, 2020 to March 29, 2021, marked in weekly or biweekly intervals. The vertical axis ranges from 34.5 percent to 39.5 percent. The data points start at 36.3 percent in late August 2020 and rise steadily over time. The percent increases to 36.9 percent by late October, reaches 37.5 percent in mid-December, and continues climbing into 2021. The values peak at 39.1 percent in mid-March 2021. The chart shows a consistent upward trend in teleworking among adults during this period.
Source: U.S. Census Bureau Household Pulse Survey.
Long Description.
The chart presents the percent of adults reporting housing insecurity over time. The horizontal axis covers dates from August 31, 2020 to March 29, 2021, labeled in biweekly intervals. The vertical axis ranges from 0 to 10 percent. The data begins at 7.2 percent in late August 2020, slightly rises to 7.3 percent, decreases to 6.8 percent in mid-September, and then rises to 6.9 percent and 7.0 percent through October. A sharp increase occurs in early November to 8.5 percent and peaks at 9.5 percent in early December. The percentage gradually declines through early 2021, dropping to 8.9 percent in late December, to 8.0 percent in January, 7.4 percent in mid-March, and reaching the lowest point of 6.3 percent at the end of March 2021. The chart reflects fluctuations in housing insecurity among adults during the COVID-19 pandemic period.


