Census Data Field Guide for Transportation Applications (2025)
Chapter: 14 Scenario: Understanding Nationwide Demographic Trends

CHAPTER 14
Scenario: Understanding Nationwide Demographic Trends
14.1 Overview
This scenario shows a step-by-step approach to accessing the ACTS program website, setting up an account, accessing the appropriate tables, and then downloading the tables of interest. R code is provided to allow the interested analyst to replicate or repurpose the code for their own needs.
14.2 Background
Emily Planner is an entry-level planner who has recently joined Transport Departmentʼs Office of Planning, Environment, and Realty (OPER). On the first week of Emilyʼs job, her supervisor tells her that OPER is working on gathering data to address historical inequities. The supervisor asks Emily to gather information about demographic trends in the nation. She was also asked to create a handy visual that would provide decision-makers with a snapshot of these trends at a macro level.
After her supervisor hands over this assignment, Emily, having attended training offered by AASHTO, recalls that the CTPP has this information readily available, and she can download the data quickly and develop the desired visual.
14.3 Analysis
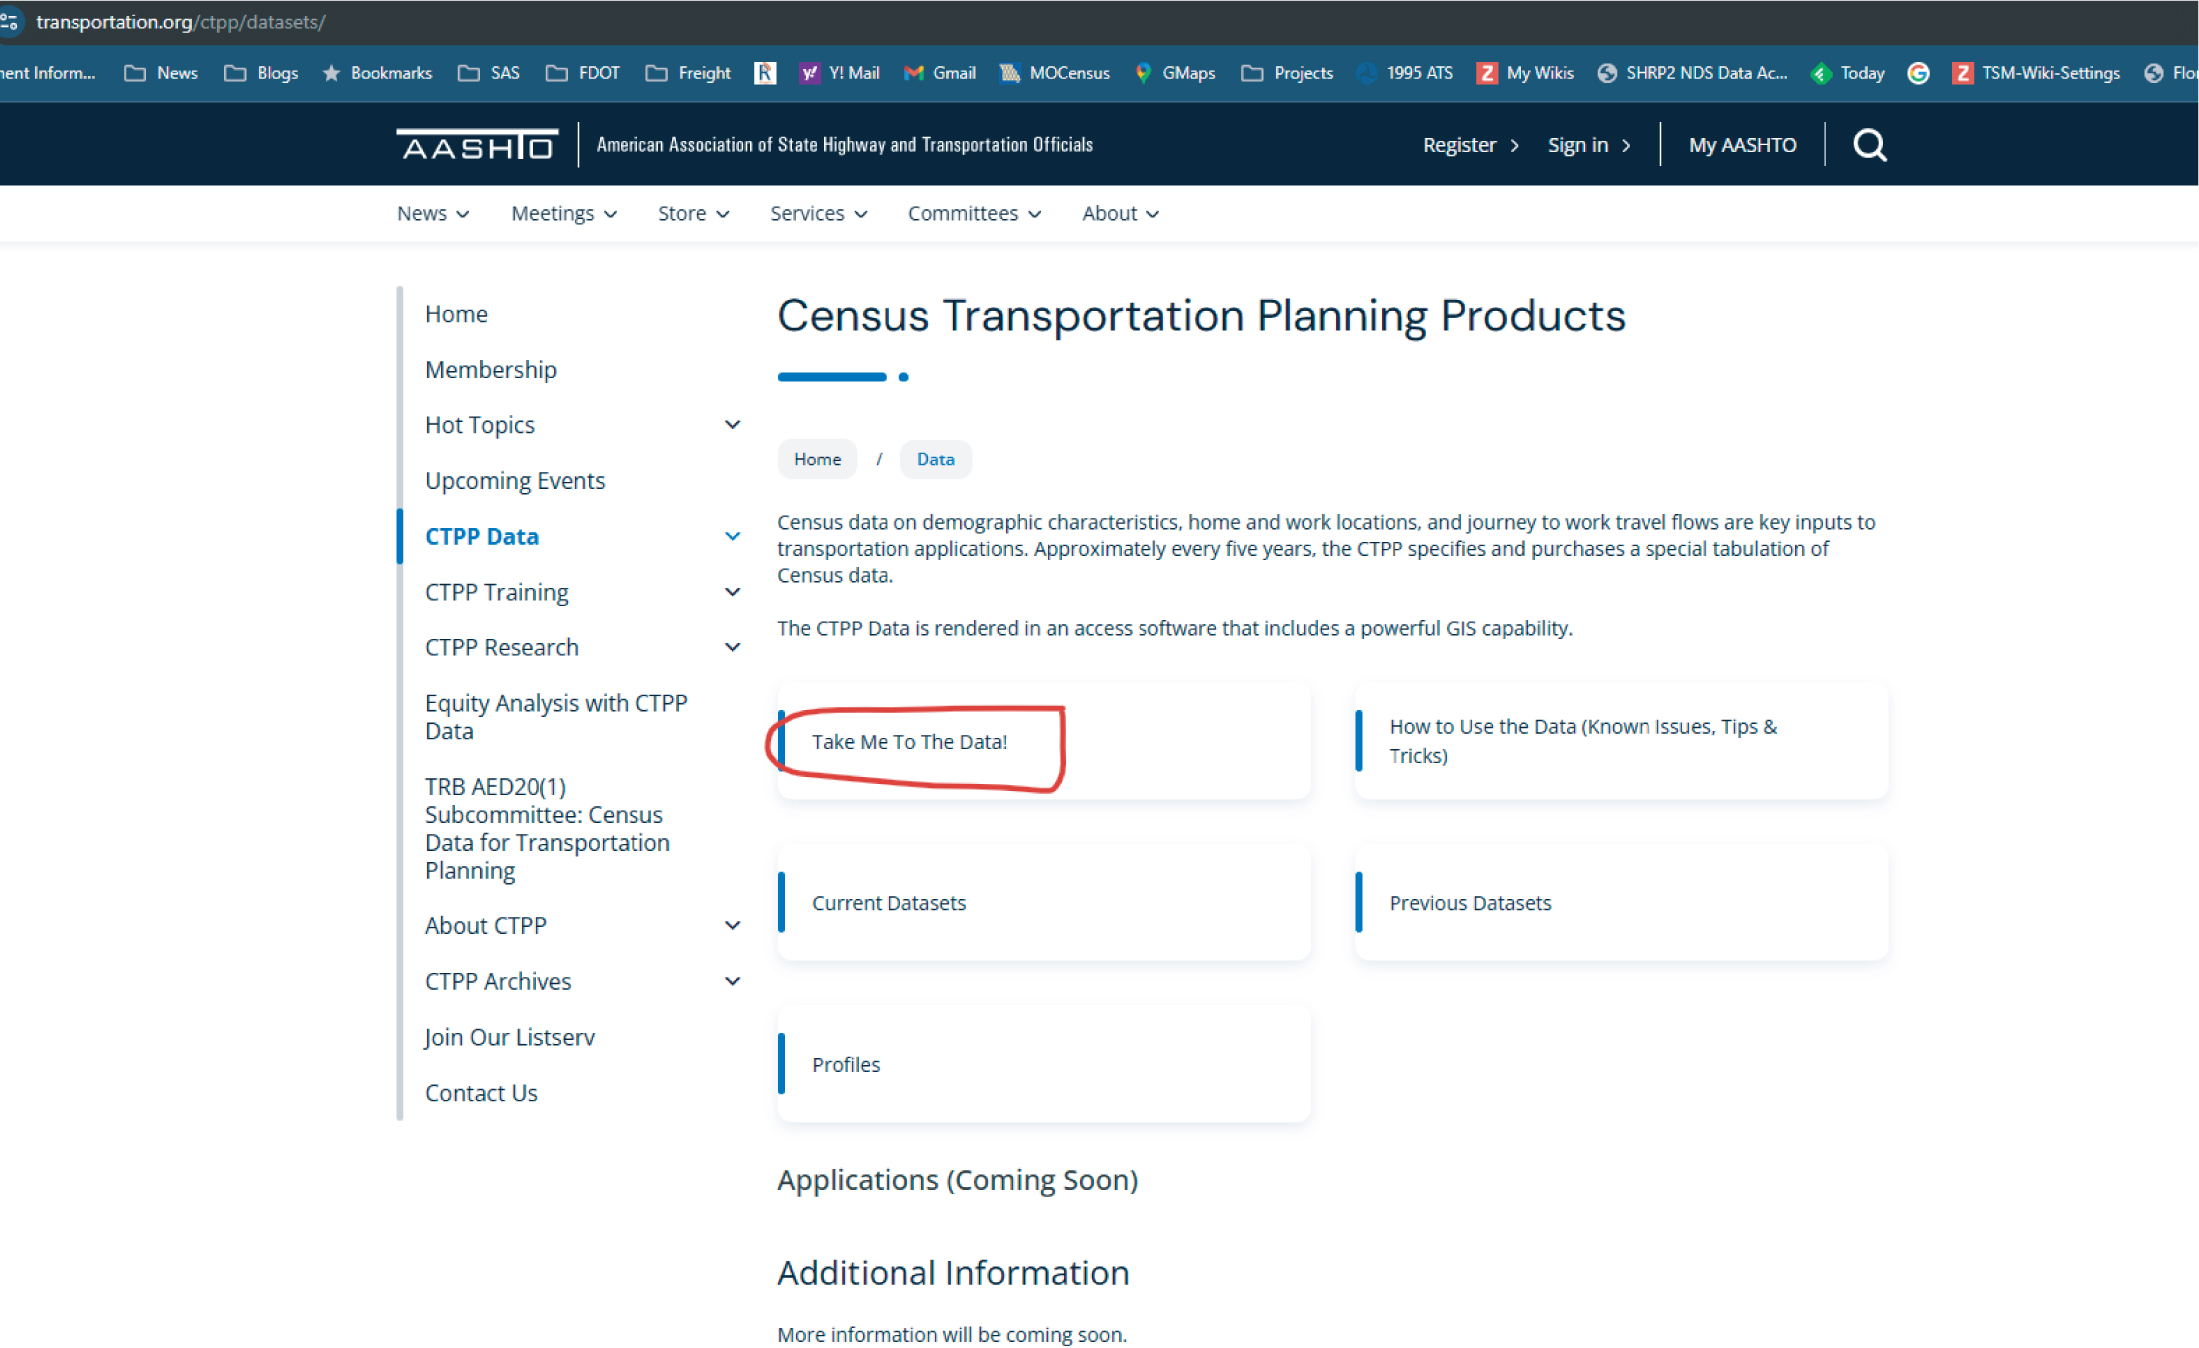
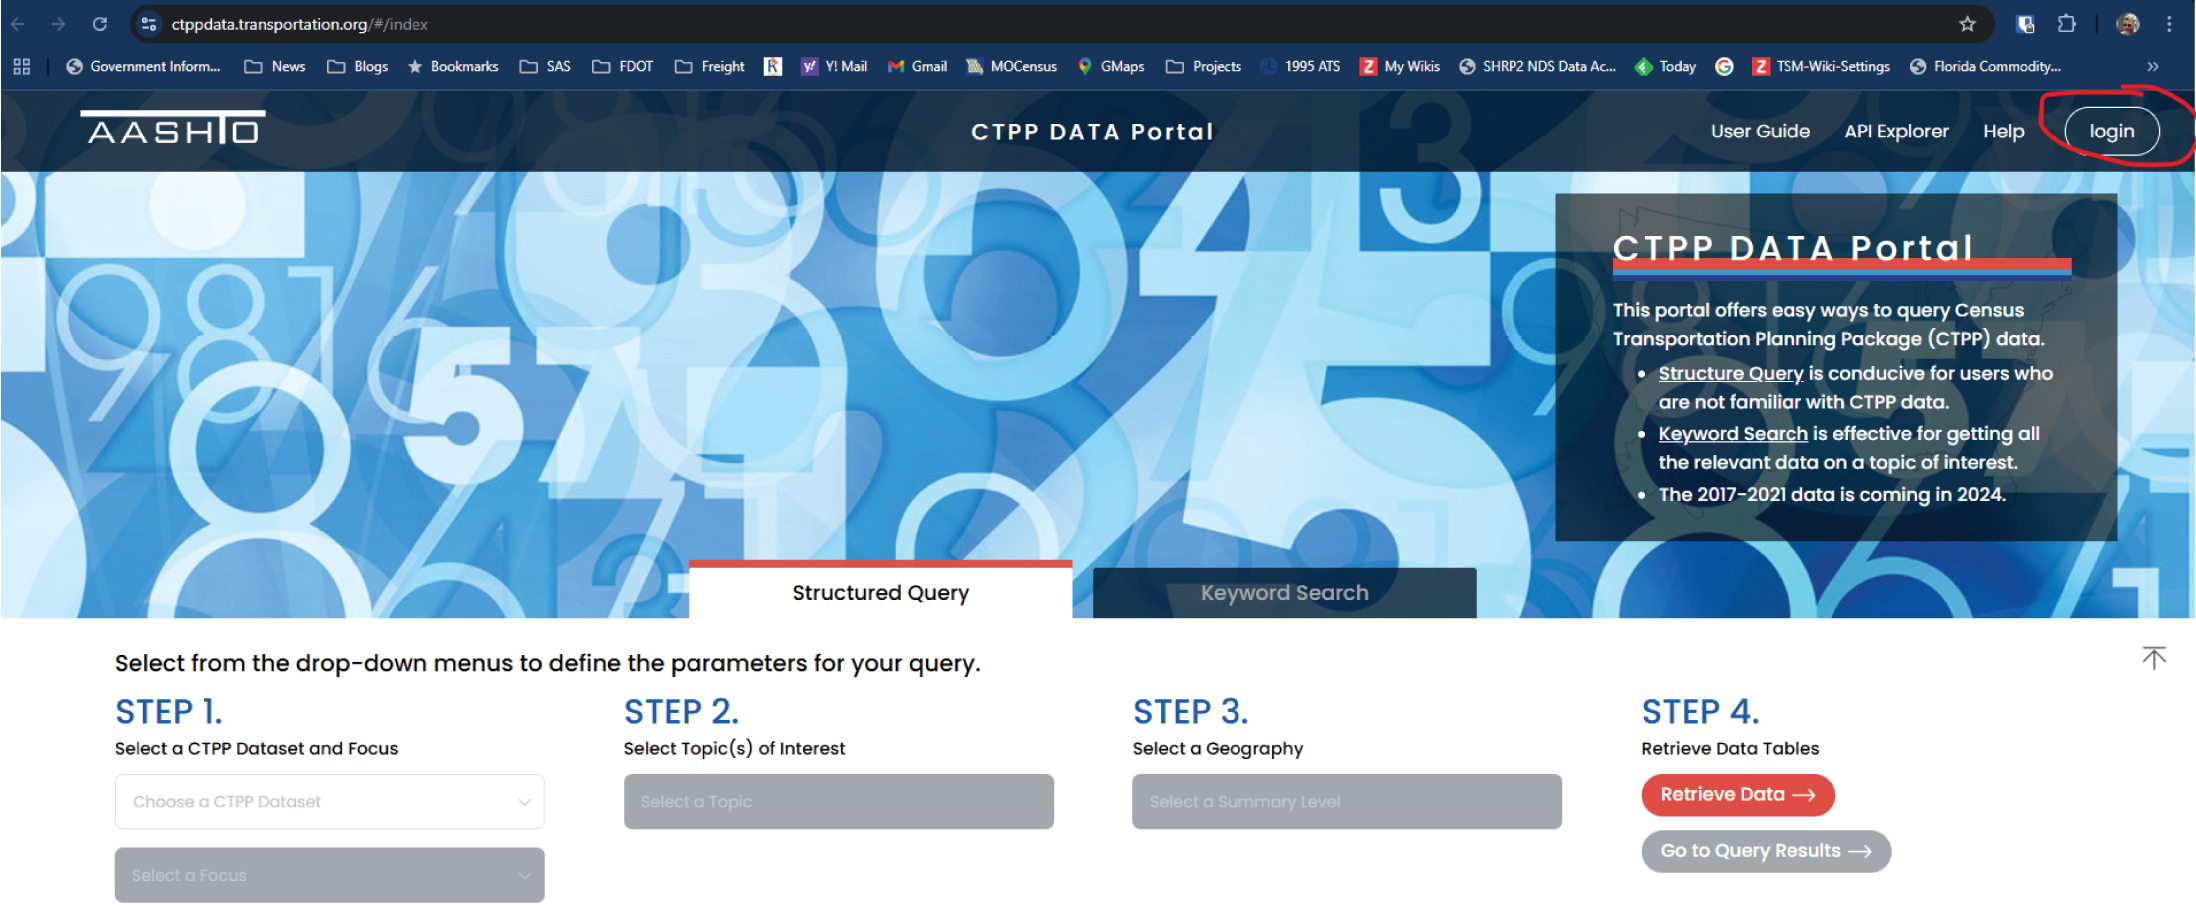
The first thing that Emily does is access the ACTS program website (transportation.org/ctpp/) and navigate to the CTPP data (Figure 14.1 and Figure 14.2). Knowing that she might be asked to retrieve this and other information on a regular basis, Emily decides to create an account on the ACTS program page to store her data calls and have them available on a regular basis (Figure 14.3).
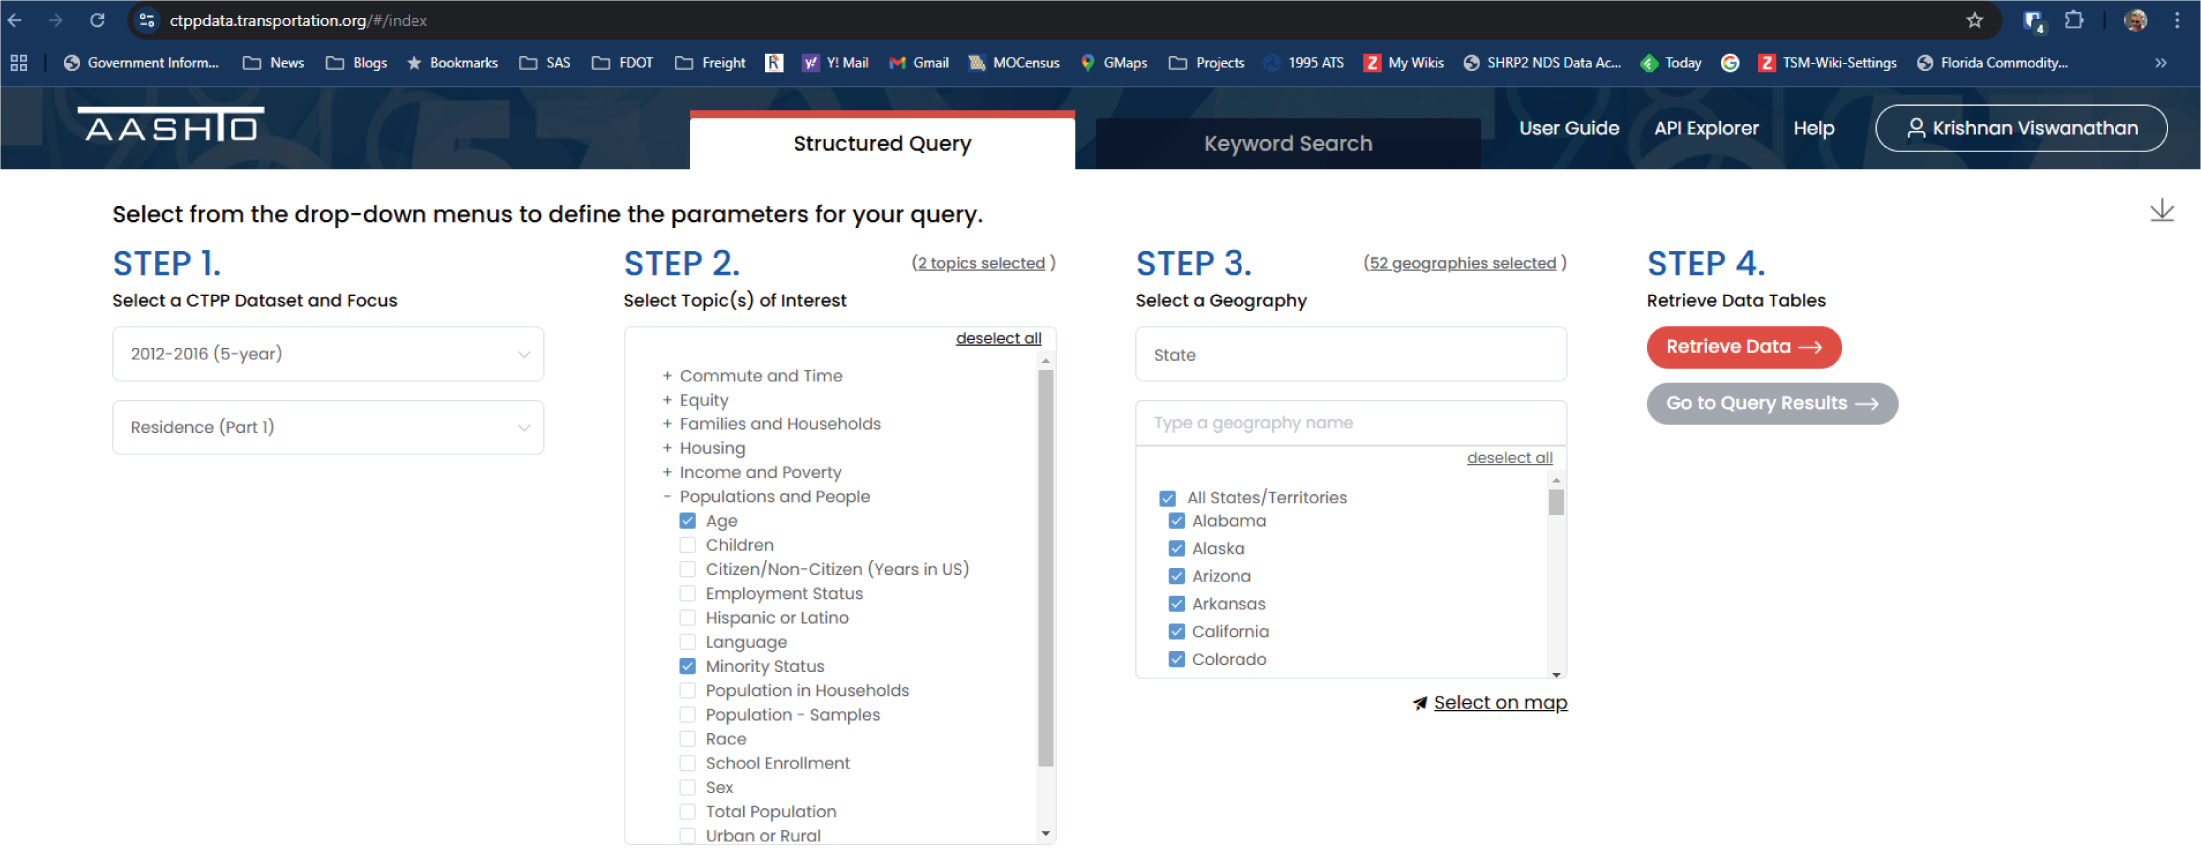
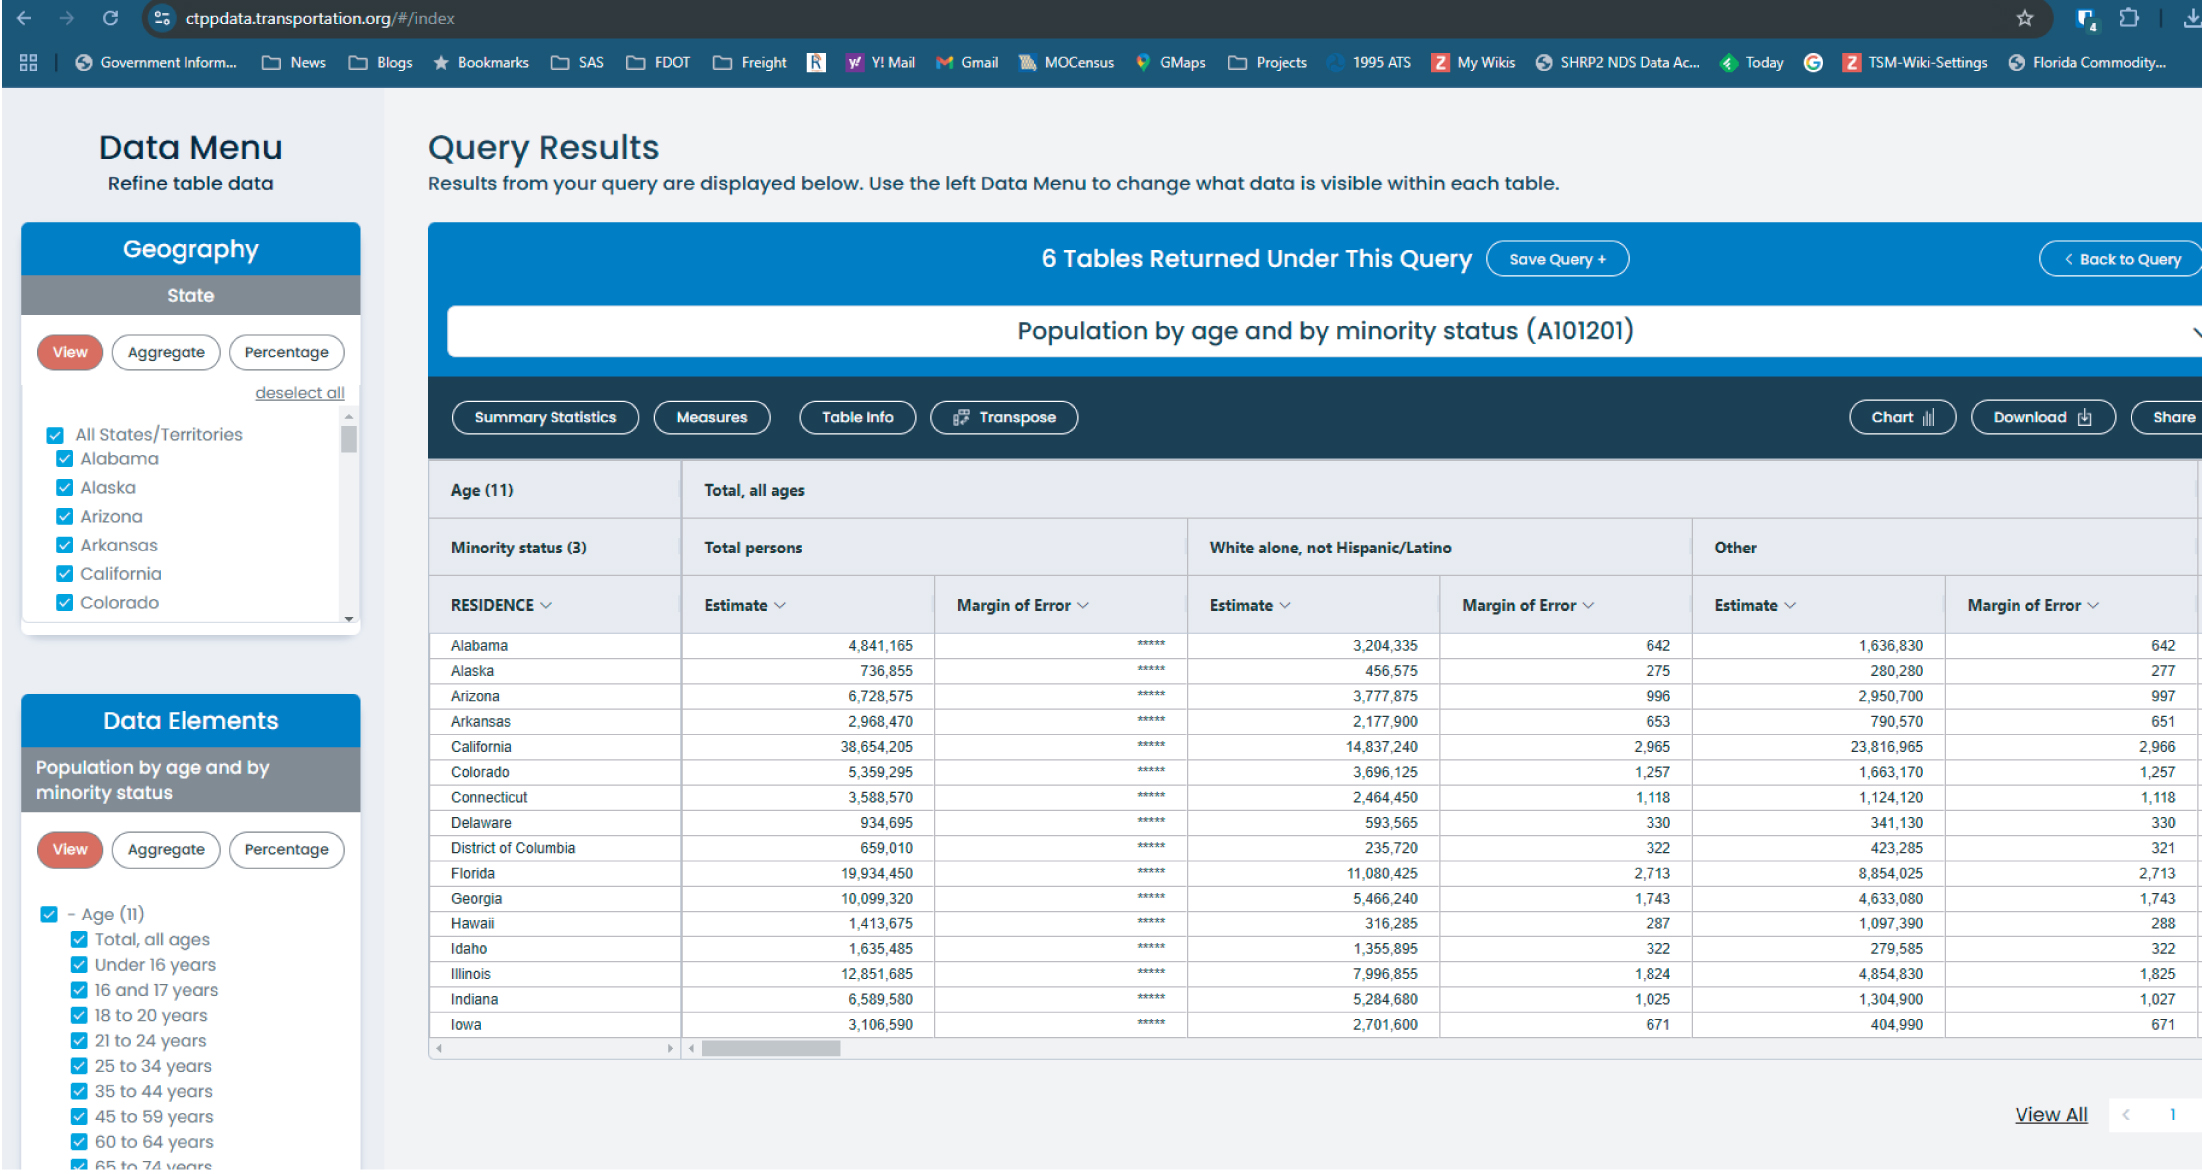
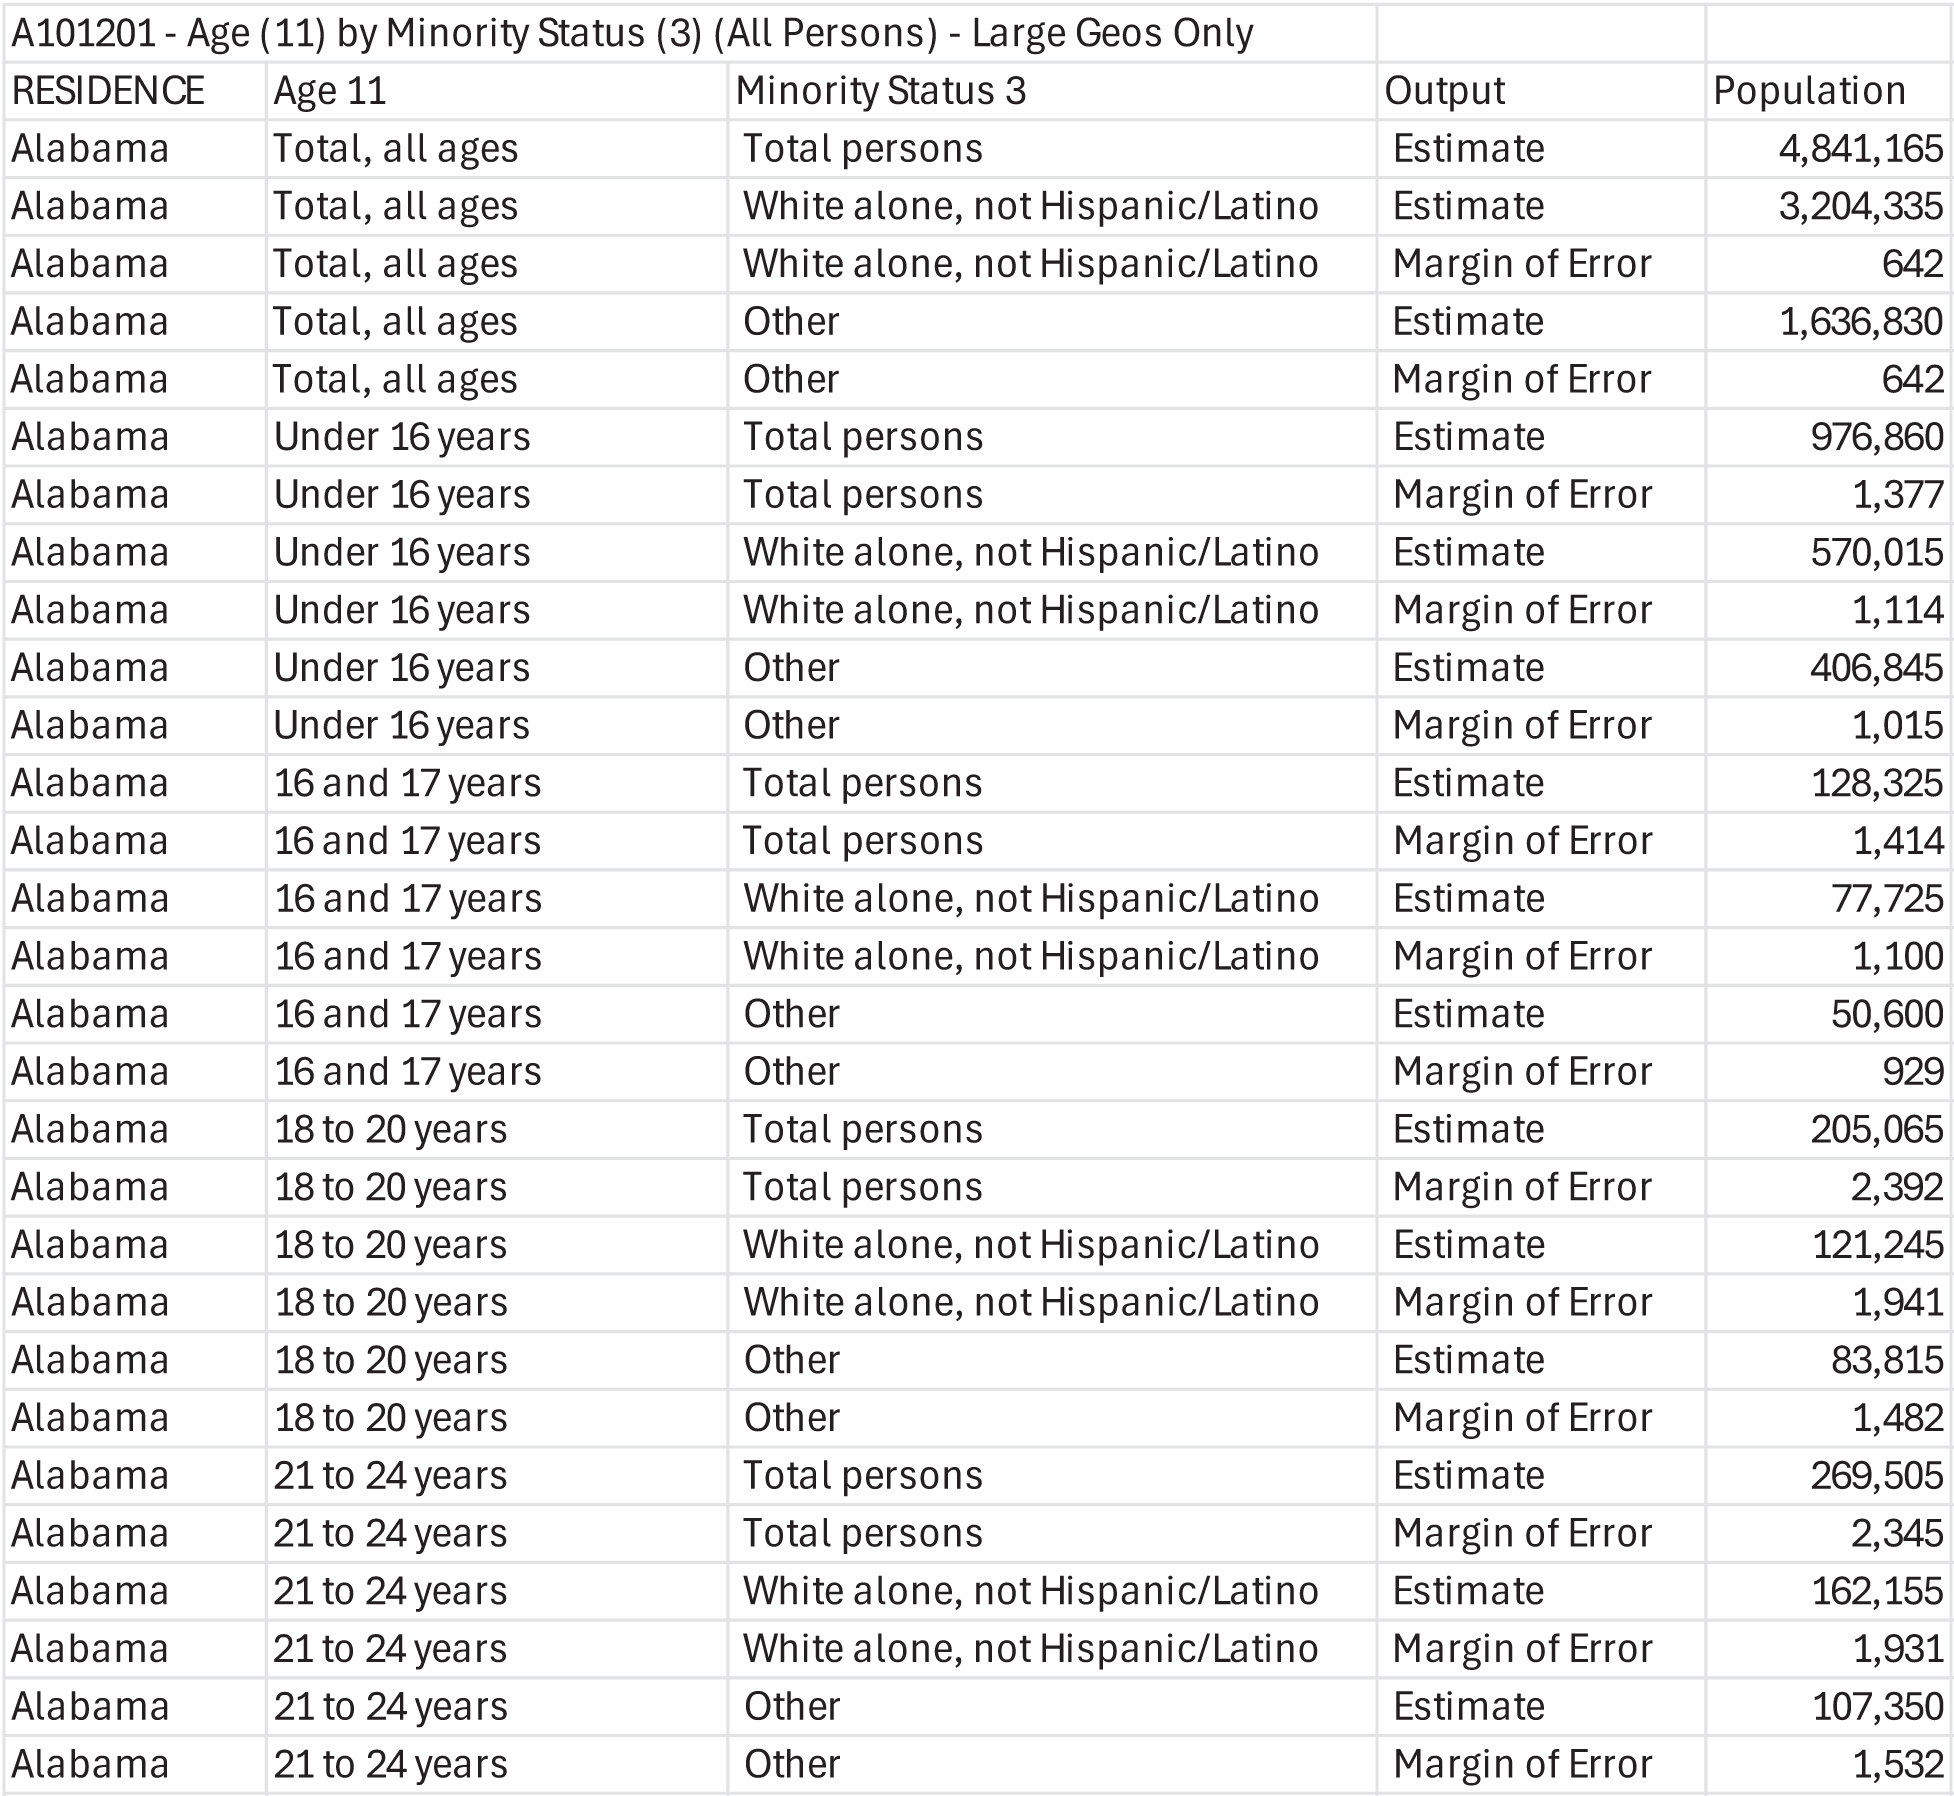
She then selects the 2012–2016 Part 1—Residence tables and from this list selects Table A101201—Age (11) by Minority Status (3) (All Persons). She notes that this information is available only at large geographies (the data are available only at the state, county, minor civil division, place, PUMA/POWPUMA, MSA levels). This level of geography is sufficient for the purposes of her analysis, and she decides that this is the table she will use for her analysis (Figure 14.4) and proceeds to download it as a CSV file (see Figure 14.5). The resulting dataset is shown in Figure 14.6.
Having downloaded the dataset, Emily proceeds to create the visual requested by her supervisor. She decides that a population pyramid for all states would be a useful visual for decision-makers. To create this visual, Emily undertakes the steps that follow.

Source: ACTS. https://transportation.org/ctpp/datasets/
Long Description.
The top-level page of the CTPP Data section of the ACTS website with the title Census Transportation Planning Products; the left sidebar has a vertical navigation menu with sections such as Home, CTPP Data, CTPP Training, CTPP Research, Equity Analysis with CTPP Data, and more; the main section includes a brief description explaining that the CTPP provides demographic and travel flow data for transportation planning, updated every five years, and rendered in access software with GIS capability; six large buttons labeled Take Me To The Data, How to Use the Data, Current Datasets, Previous Datasets, Profiles, and an Applications Coming Soon section are visible; a note under Additional Information says more information will be coming soon.
Source: ACTS. https://transportation.org/ctpp/datasets/
Long Description.
The top-level page of the CTPP Data section of the ACTS website with the title Census Transportation Planning Products; the left menu lists sections including CTPP Data, CTPP Training, and CTPP Research; the main section describes CTPP as providing demographic and travel data for transportation planning based on Census data; six buttons appear in the center labeled Take Me To The Data, How to Use the Data, Current Datasets, Previous Datasets, Profiles, and Applications Coming Soon; the Take Me To The Data button is highlighted. Additional information is noted at the bottom with a message saying more information will be coming soon.
Source: ACTS. https://ctppdata.transportation.org/#/index
Long Description.
The CTPP Data Portal homepage with a background of large transparent numbers and a section header titled Structured Query; four steps for querying data appear in the lower section: Step 1 is to select a CTPP dataset and focus, Step 2 is to select topics of interest, Step 3 is to select a geography, and Step 4 is to retrieve data tables using the Retrieve Data button or Go to Query Results. A panel on the right explains the portal’s purpose and notes that the 2017 to 2021 data release is expected in 2024. The login button is located in the upper right corner and is circled for emphasis.
Source: ACTS. https://ctppdata.transportation.org/#/index
Long Description.
The Structured Query interface on the CTPP Data Portal is organized into four steps; Step 1 has dropdown menus with selected values 2012 to 2016 for dataset and Residence Part 1 for focus; Step 2 has a scrollable list of topics of interest under categories like Commute and Time, Equity, Income and Poverty, and Populations and People with subtopics such as Age, Language, Minority Status, and Race, with two topics already selected, Age and Minority Status; Step 3 has a geography selection section with All States and individual states like Alabama, Alaska, Arizona, Arkansas, California, and Colorado selected; Step 4 on the far right includes two buttons labeled Retrieve Data and Go to Query Results for accessing the selected tables.
Source: ACTS. https://ctppdata.transportation.org/#/index
Long Description.
The CTPP Data Portal shows query results for population by age and by minority status labeled A 1 0 1 2 0 1. Under Data Menu on the left, in the section Geography, All States and Territories is selected. In the section Data Elements, Age is selected. The table in the center shows total population, white alone not Hispanic or Latino, and other, with estimates and margin of error for each listed by state. States include Alabama with 4,841,165 total persons, and Georgia with 10,099,220 total persons. Margin of error values are displayed where available. The page includes buttons labeled Summary Statistics, Measures, Table Info, Transpose, Chart, Download, and Share above the table. A bar confirms that 6 tables were returned under this query, with options to save the query or go back.
Source: ACTS.
Long Description.
The table has 6 columns and 29 rows. The column headers include residence, age 11, minority status 3, output, and population and are under the heading A101201: Age 11 by Minority Status 3 All Persons, Large Geos Only. The row details are as follows. Row 1: Alabama; Total, all ages; Total persons; Estimate; 4,841,165. Row 2: Alabama; Total, all ages; White alone, not Hispanic or Latino; Estimate; 3,204,335. Row 3: Alabama; Total, all ages; White alone, not Hispanic or Latino; Margin of Error; 642. Row 4: Alabama; Total, all ages; Other; Estimate; 1,636,830. Row 5: Alabama; Total, all ages; Other; Margin of Error; 642. Row 6: Alabama; Under 16 years; Total persons; Estimate; 976,860. Row 7: Alabama; Under 16 years; Total persons; Margin of Error; 1,377. Row 8: Alabama; Under 16 years; White alone, not Hispanic or Latino; Estimate; 570,015. Row 9: Alabama; Under 16 years; White alone, not Hispanic or Latino; Margin of Error; 1,114. Row 10: Alabama; Under 16 years; Other; Estimate; 406,845. Row 11: Alabama; Under 16 years; Other; Margin of Error; 1,015. Row 12: Alabama; 16 and 17 years; Total persons; Estimate; 128,325. Row 13: Alabama; 16 and 17 years; Total persons; Margin of Error; 1,414. Row 14: Alabama; 16 and 17 years; White alone, not Hispanic or Latino; Estimate; 77,725. Row 15: Alabama; 16 and 17 years; White alone, not Hispanic or Latino; Margin of Error; 1,100. Row 16: Alabama; 16 and 17 years; Other; Estimate; 50,600. Row 17: Alabama; 16 and 17 years; Other; Margin of Error; 929. Row 18: Alabama; 18 to 20 years; Total persons; Estimate; 205,065. Row 19: Alabama; 18 to 20 years; Total persons; Margin of Error; 2,392. Row 20: Alabama; 18 to 20 years; White alone, not Hispanic or Latino; Estimate; 121,245. Row 21: Alabama; 18 to 20 years; White alone, not Hispanic or Latino; Margin of Error; 1,941. Row 22: Alabama; 18 to 20 years; Other; Estimate; 83,815. Row 23: Alabama; 18 to 20 years; Other; Margin of Error; 1,482. Row 24: Alabama; 21 to 24 years; Total persons; Estimate; 269,505. Row 25: Alabama; 21 to 24 years; Total persons; Margin of Error; 2,345. Row 26: Alabama; 21 to 24 years; White alone, not Hispanic or Latino; Estimate; 162,155. Row 27: Alabama; 21 to 24 years; White alone, not Hispanic or Latino; Margin of Error; 1,931. Row 28: Alabama; 21 to 24 years; Other; Estimate; 107,350. Row 29: Alabama; 21 to 24 years; Other; Margin of Error; 1,532.
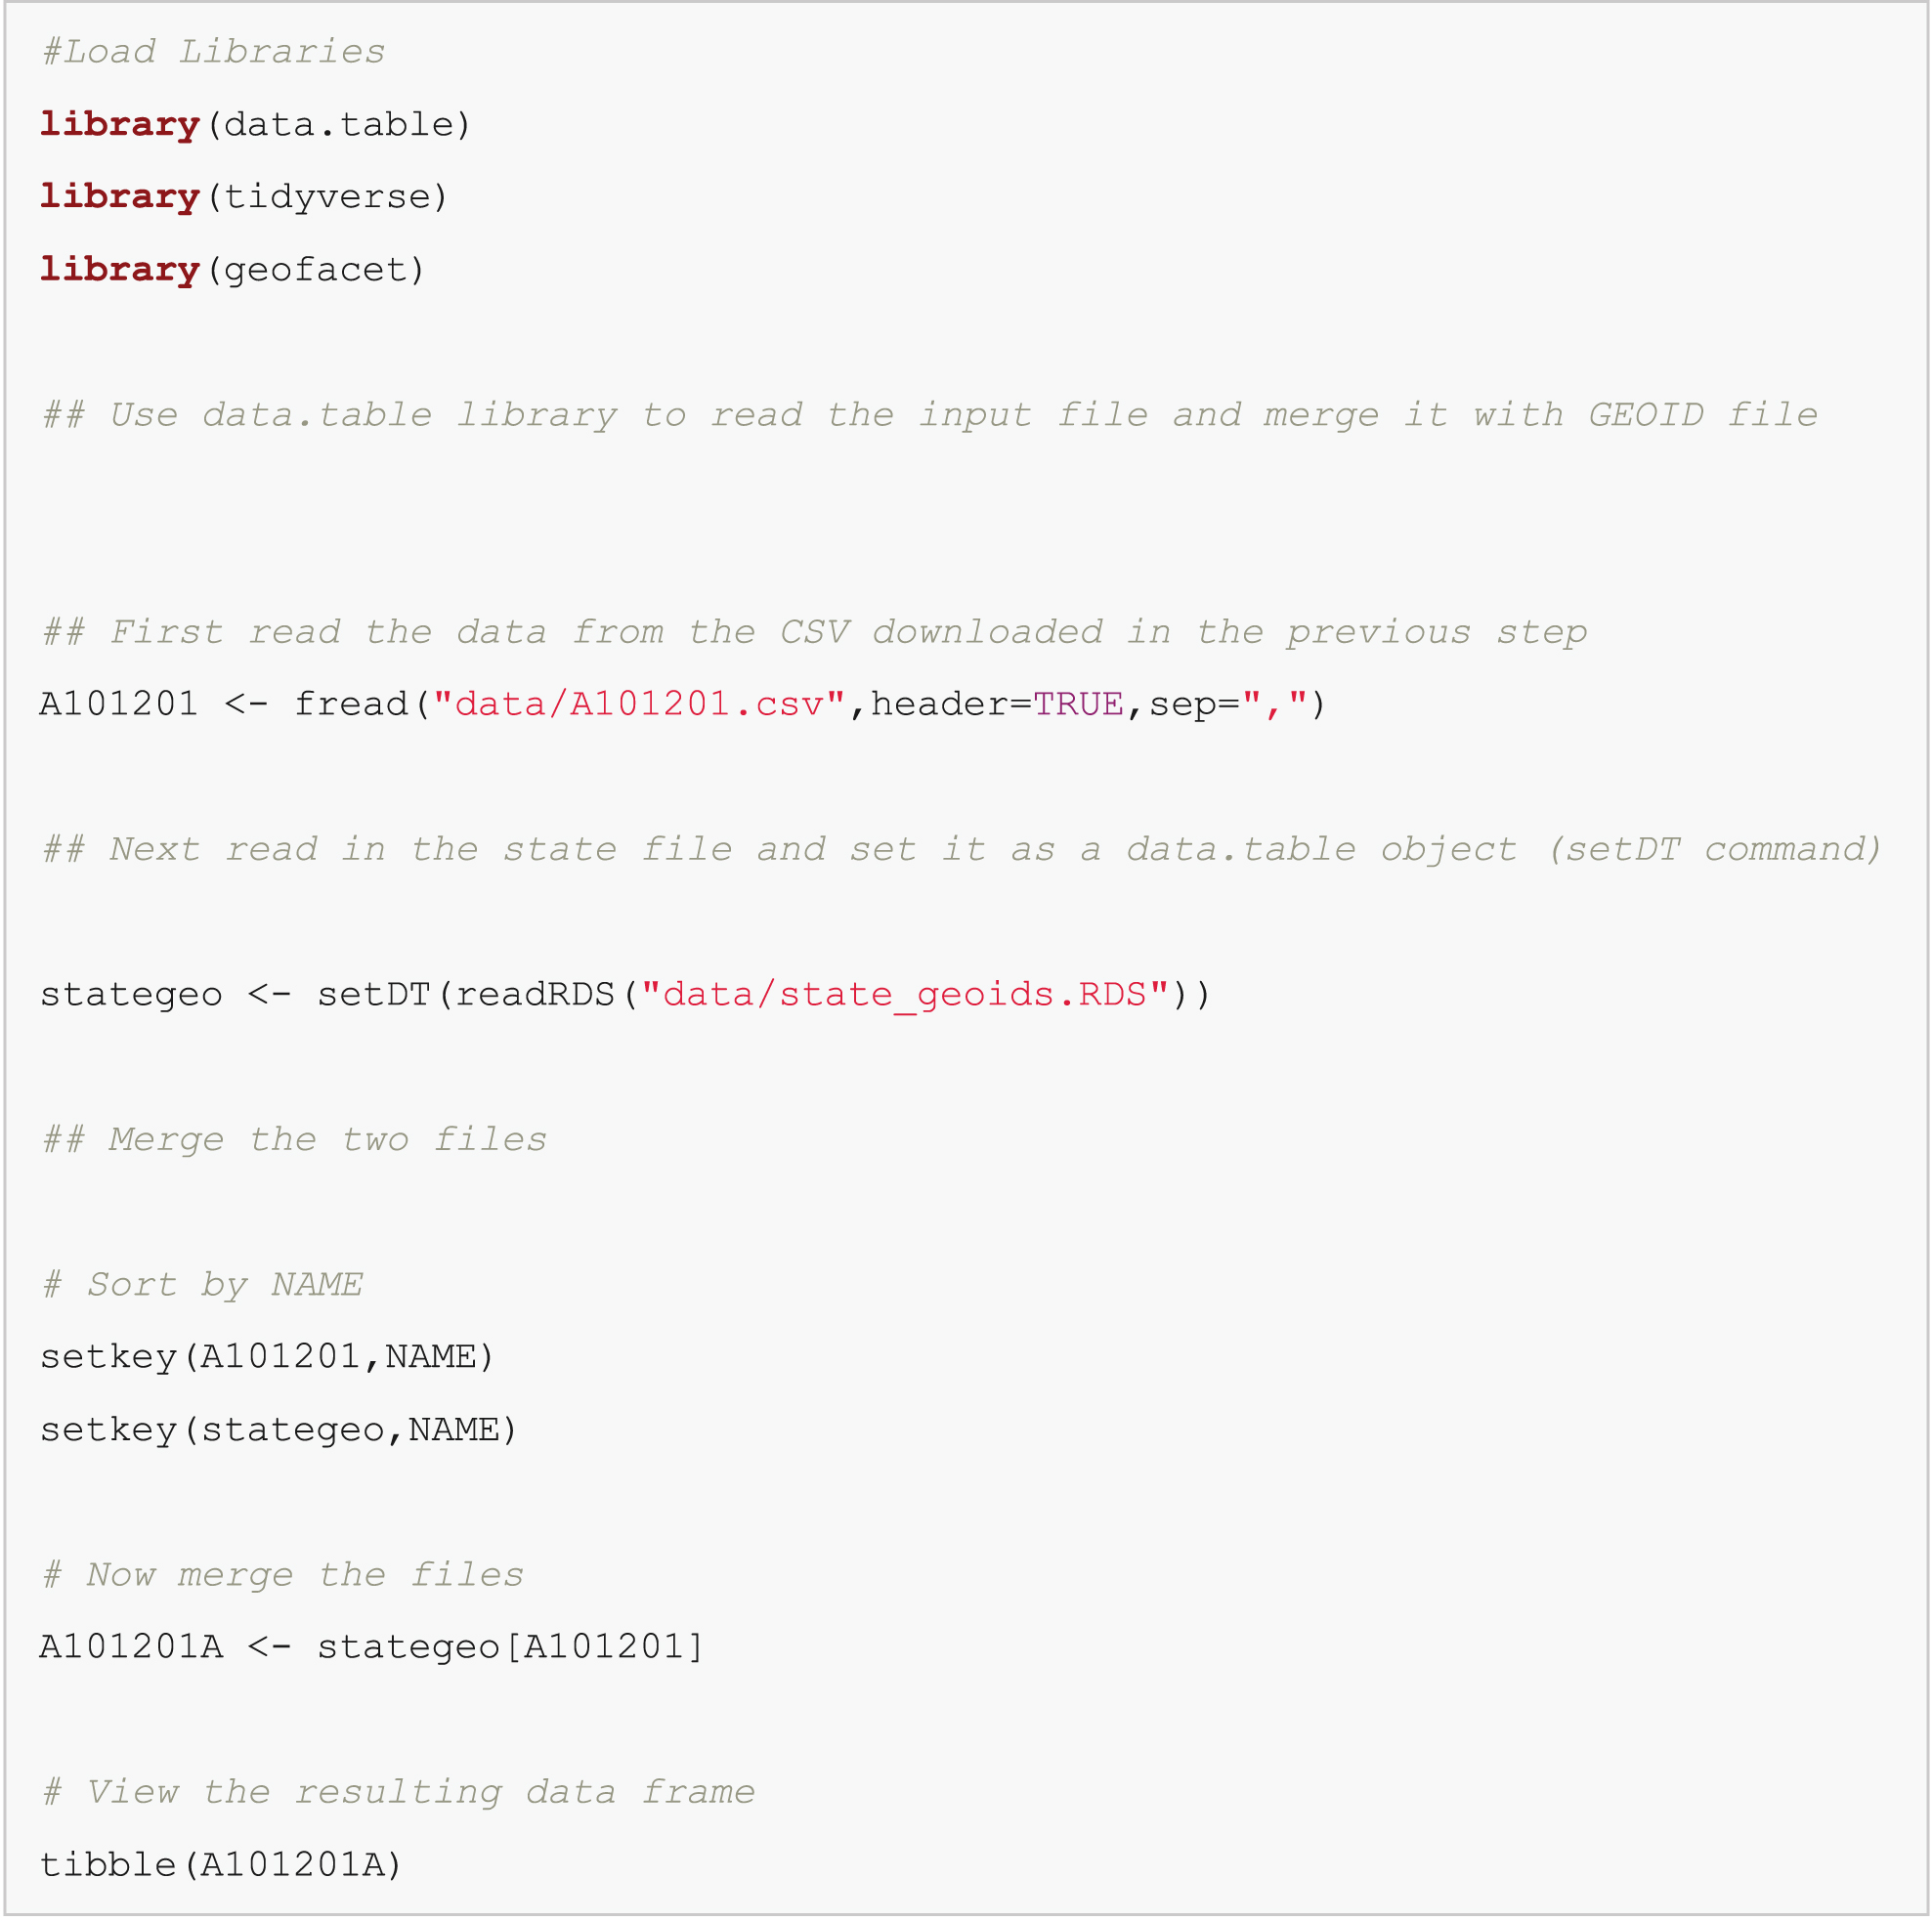
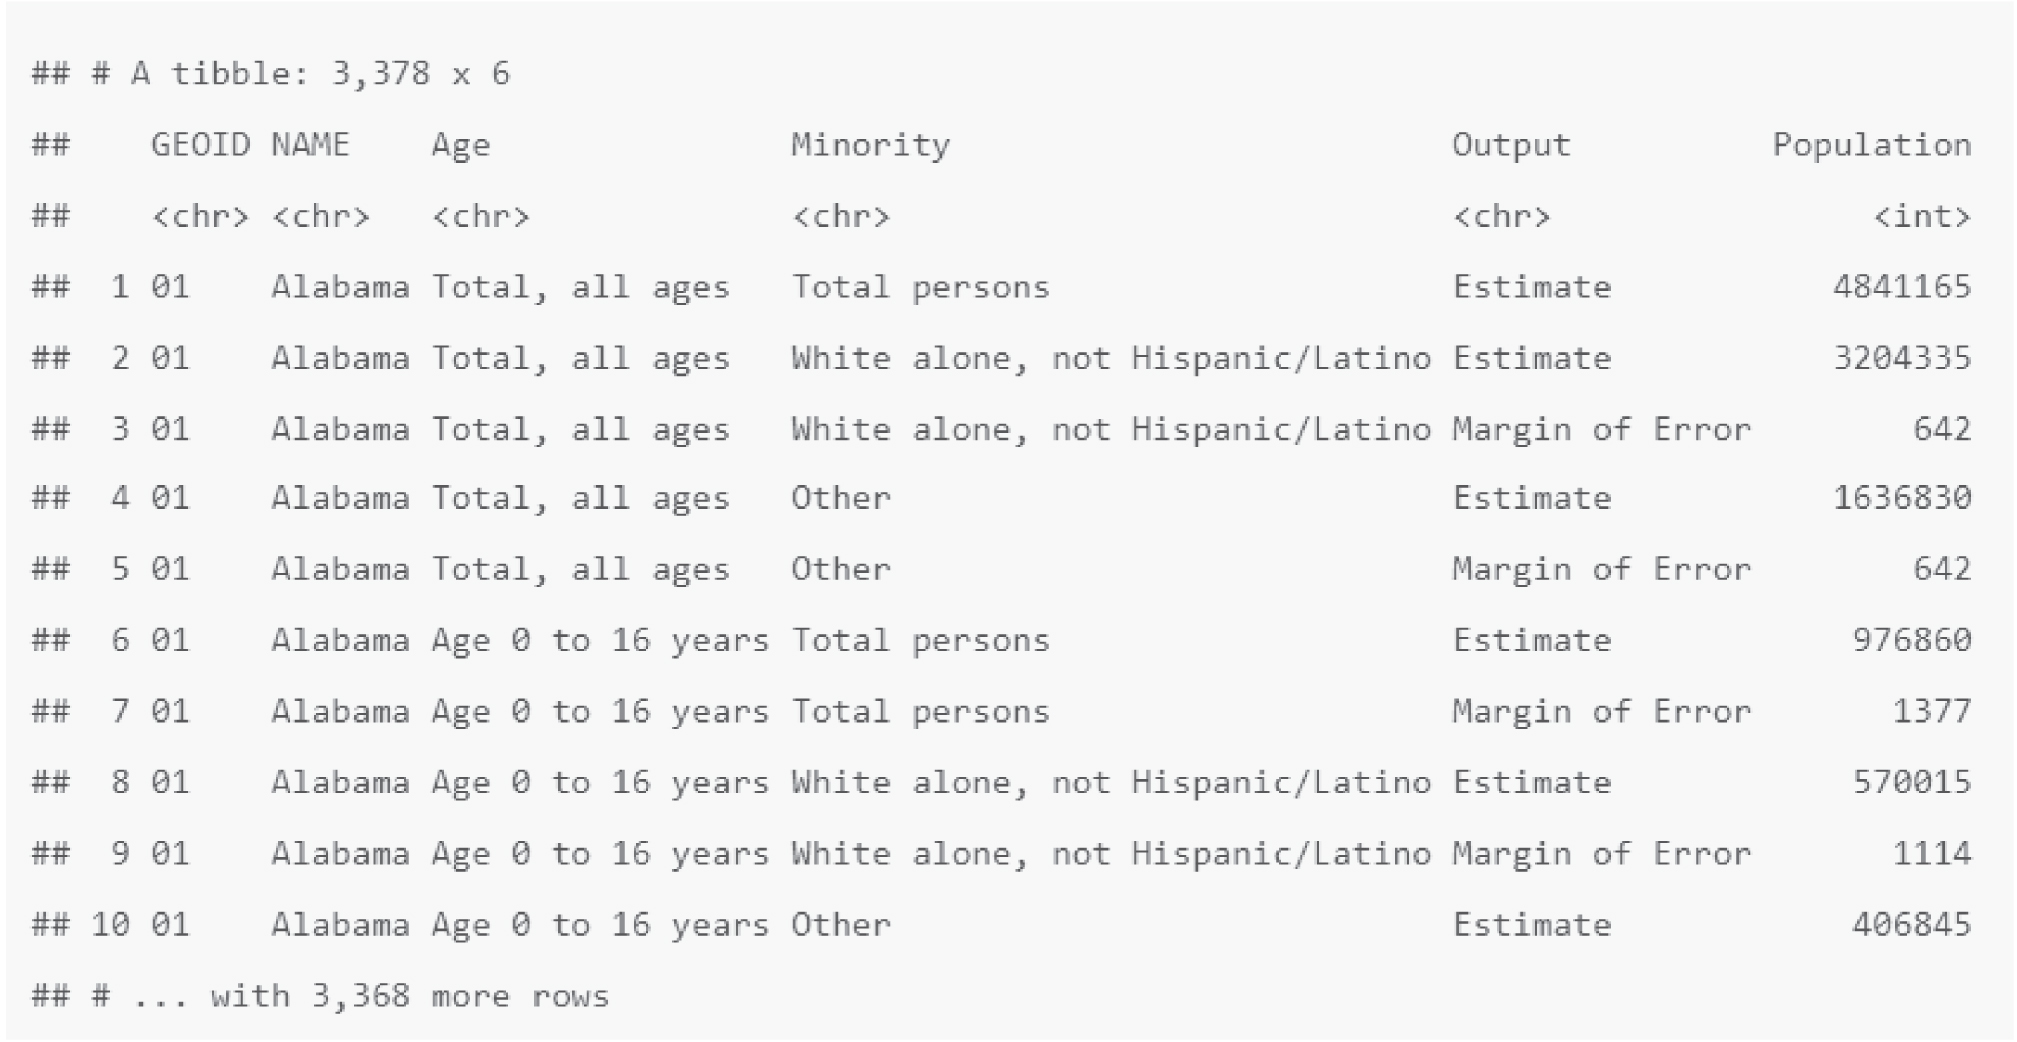
The data downloaded from the ACTS program website does not have census geography references handy. Therefore, Emily decides to map the geographic identifier (GEOID) to the data table downloaded from the ACTS program site. Emily writes some R code to map the GEOID to the data table (Figure 14.7) and checks the merged data (Figure 14.8) to see if the result is correct.
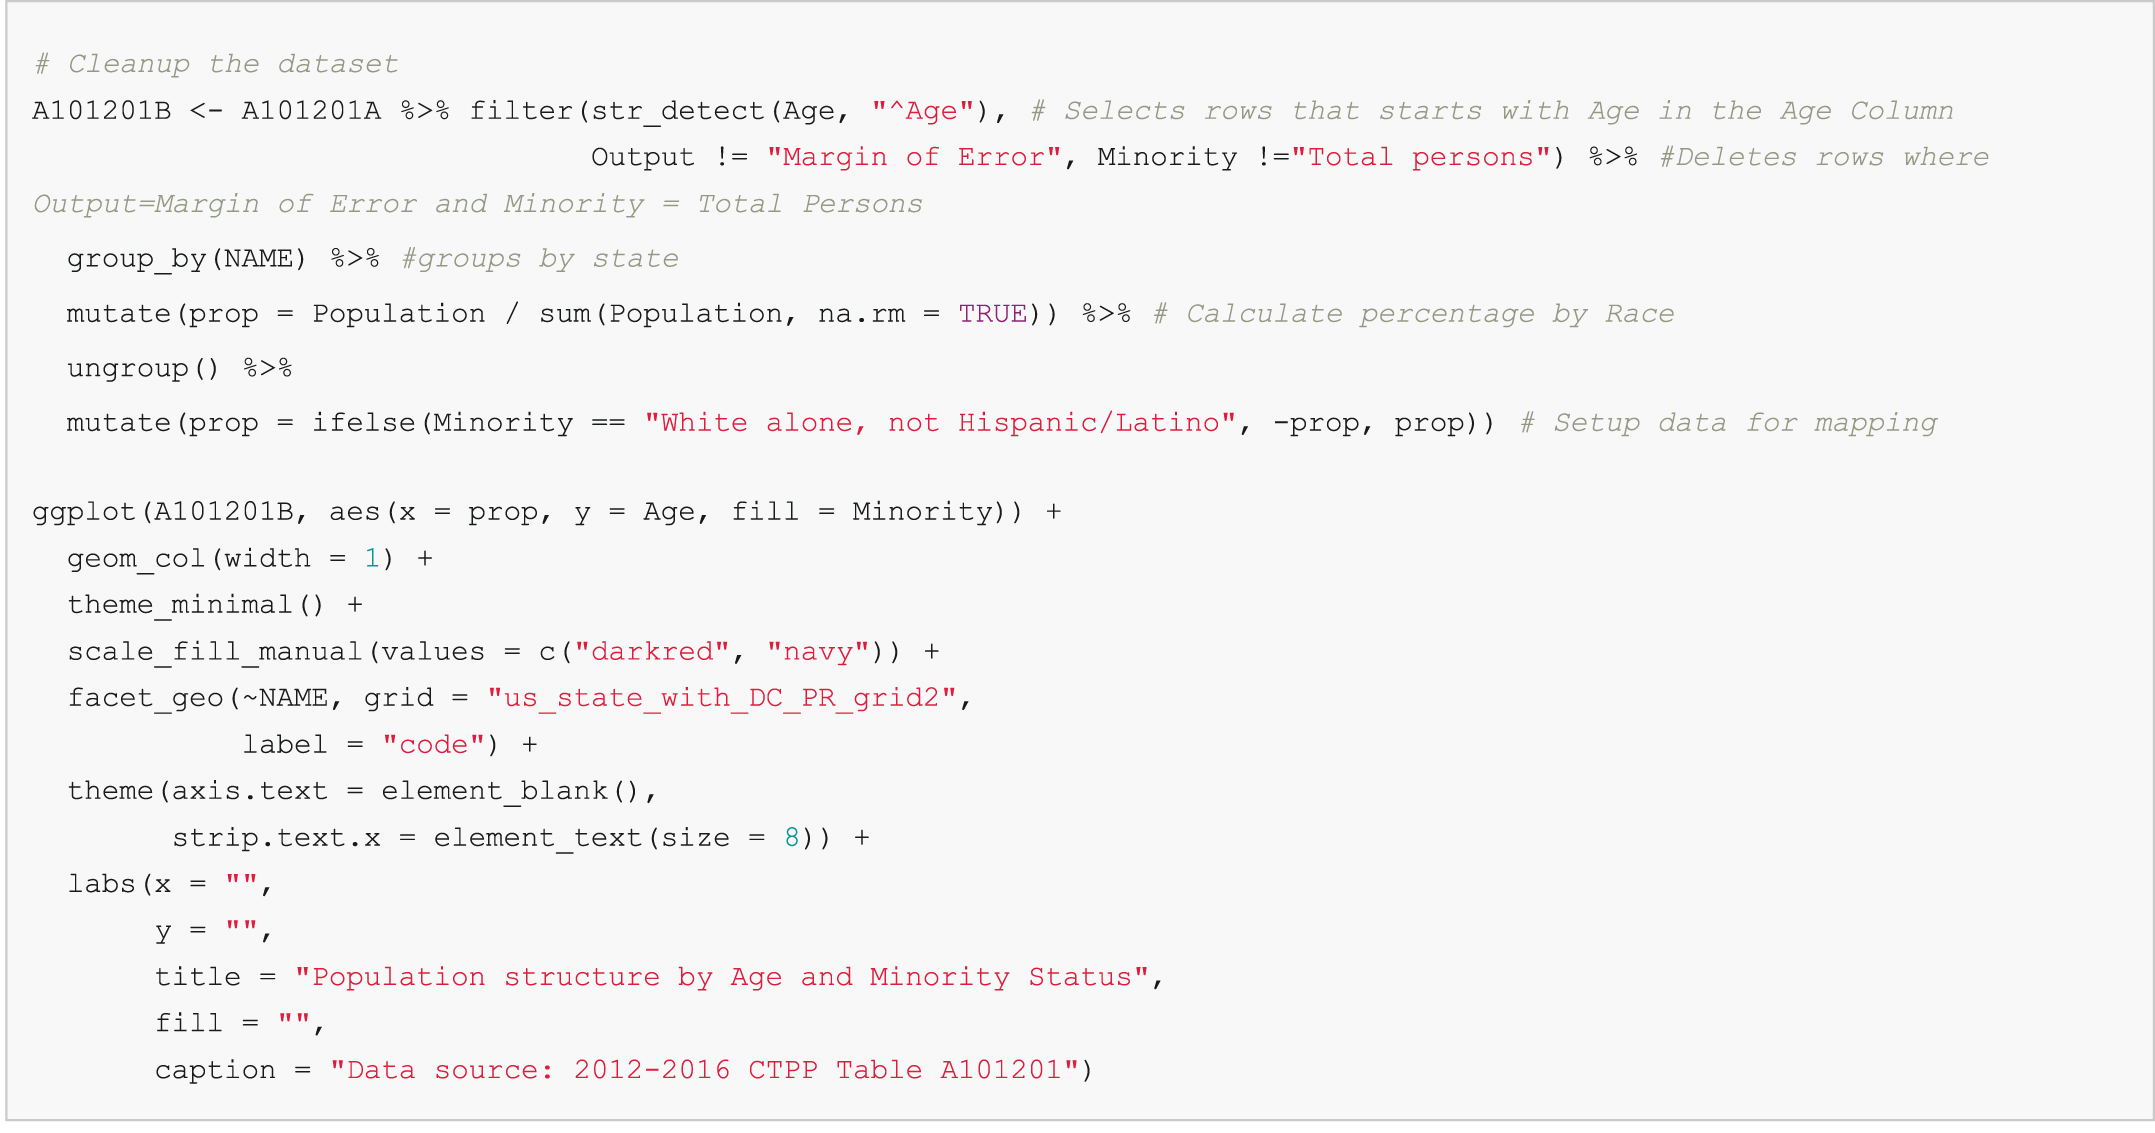
Emily then cleans up the resulting dataset (Figure 14.9) and creates the population structure by age, minority status, and state visual (Figure 14.10). After Emilyʼs supervisor reviews the materials, Figure 14.10 is shared within OPER.
Note: An electronic version of the R code used in the scenarios described in this report is available on the National Academies Press website (nap.nationalacademies.org) in the Resources section of the catalog page for NCHRP Research Report 1108: Census Data Field Guide for Transportation Applications.
Long Description.
#Load Libraries
library(data.table)
library(tidyverse)
library(geofacet)
## Use data.table library to read the input file and merge it with GEOID file
## First read the data from the CSV downloaded in the previous step
A101201 <- f read("data/A101201.c s v",header=TRUE,sep=",")
## Next read in the state file and set it as a data.table object (setD T command)
stategeo <- set D T(readR D S("data/state_geoids.R D S"))
## Merge the two files
# Sort by NAME
setkey(A101201,NAME)
setkey(stategeo,NAME)
# Now merge the files
A101201A <- stategeo[A101201]
# View the resulting data frame
tibble(A101201A)
Long Description.
Text at the top of the graphic says A tibble 3,378 by 6. Material in tabular format follows with columns labeled GEOID, NAME, Age, Minority, Output, and Population. An unnmubered row shows <c h r> under the GEOID, NAME, Age, Minority and Output and <i n t> under Population. Ten numbered rows follow. Row 1: 01; Alabama; total, all ages; total persons; estimate: 4841165. Row 2: 01; Alabama; total, all ages; White alone, not Hispanic or Latino; estimate; 3204335. Row 3: 01; Alabama; total, all ages; White alone, not Hispanic or Latino; margin of error; 642. Row 4: 01; Alabama; total, all ages; other; estimate; 1636830. Row 5: 01; Alabama; total, all ages; other; margin of Error; 642. Row 6: 01; Alabama; age 0 to 16 years; total persons; estimate; 976860. Row 7: 01; Alabama; age 0 to 16 years; total persons; margin of error; 1377. Row 8: 01; Alabama; age 0 to 16 years; White alone, not Hispanic or Latino; estimate; 570015; Row 9: 01; Alabama; age 0 to 16 years; White alone, not Hispanic or Latino; margin of error; 1114. Row 10: 01; Alabama; age 0 to 16 years; other; Estimate; 406845.
Note: An electronic version of the R code used in the scenarios described in this report is available on the National Academies Press website (nap.nationalacademies.org) in the Resources section of the catalog page for NCHRP Research Report 1108: Census Data Field Guide for Transportation Applications.
Long Description.
# Cleanup the dataset
A101201B <- A101201A %>% filter(s t r_detect(Age, "^Age"), # Selects rows that starts with Age in the Age Column
Output != "Margin of Error", Minority !="Total persons") %>% #Deletes rows where Output=Margin of Error and Minority = Total Persons
group_by(NAME) %>% #groups by state
mutate(prop = Population / sum(Population, n a.r m = TRUE)) %>% # Calculate percentage by Race
ungroup() %>%
mutate(prop = ifelse(Minority == "White alone, not Hispanic/Latino", -prop, prop)) # Setup data for mapping
g g plot(A101201B, a e s(x = prop, y = Age, fill = Minority)) +
g e o m_ c o l(width = 1) +
theme_minimal() +
scale_fill_manual(values = c("darkred", "navy")) +
facet_geo(~NAME, grid = "u s_state_with_D C_P R_grid2",
label = "code") +
theme(axis.text = element_blank(),
strip.text.x = element_text(size = 8)) +
labs(x = "",
y = "",
title = "Population structure by Age and Minority Status",
fill = "",
caption = "Data source: 2012-2016 CTPP Table A101201")
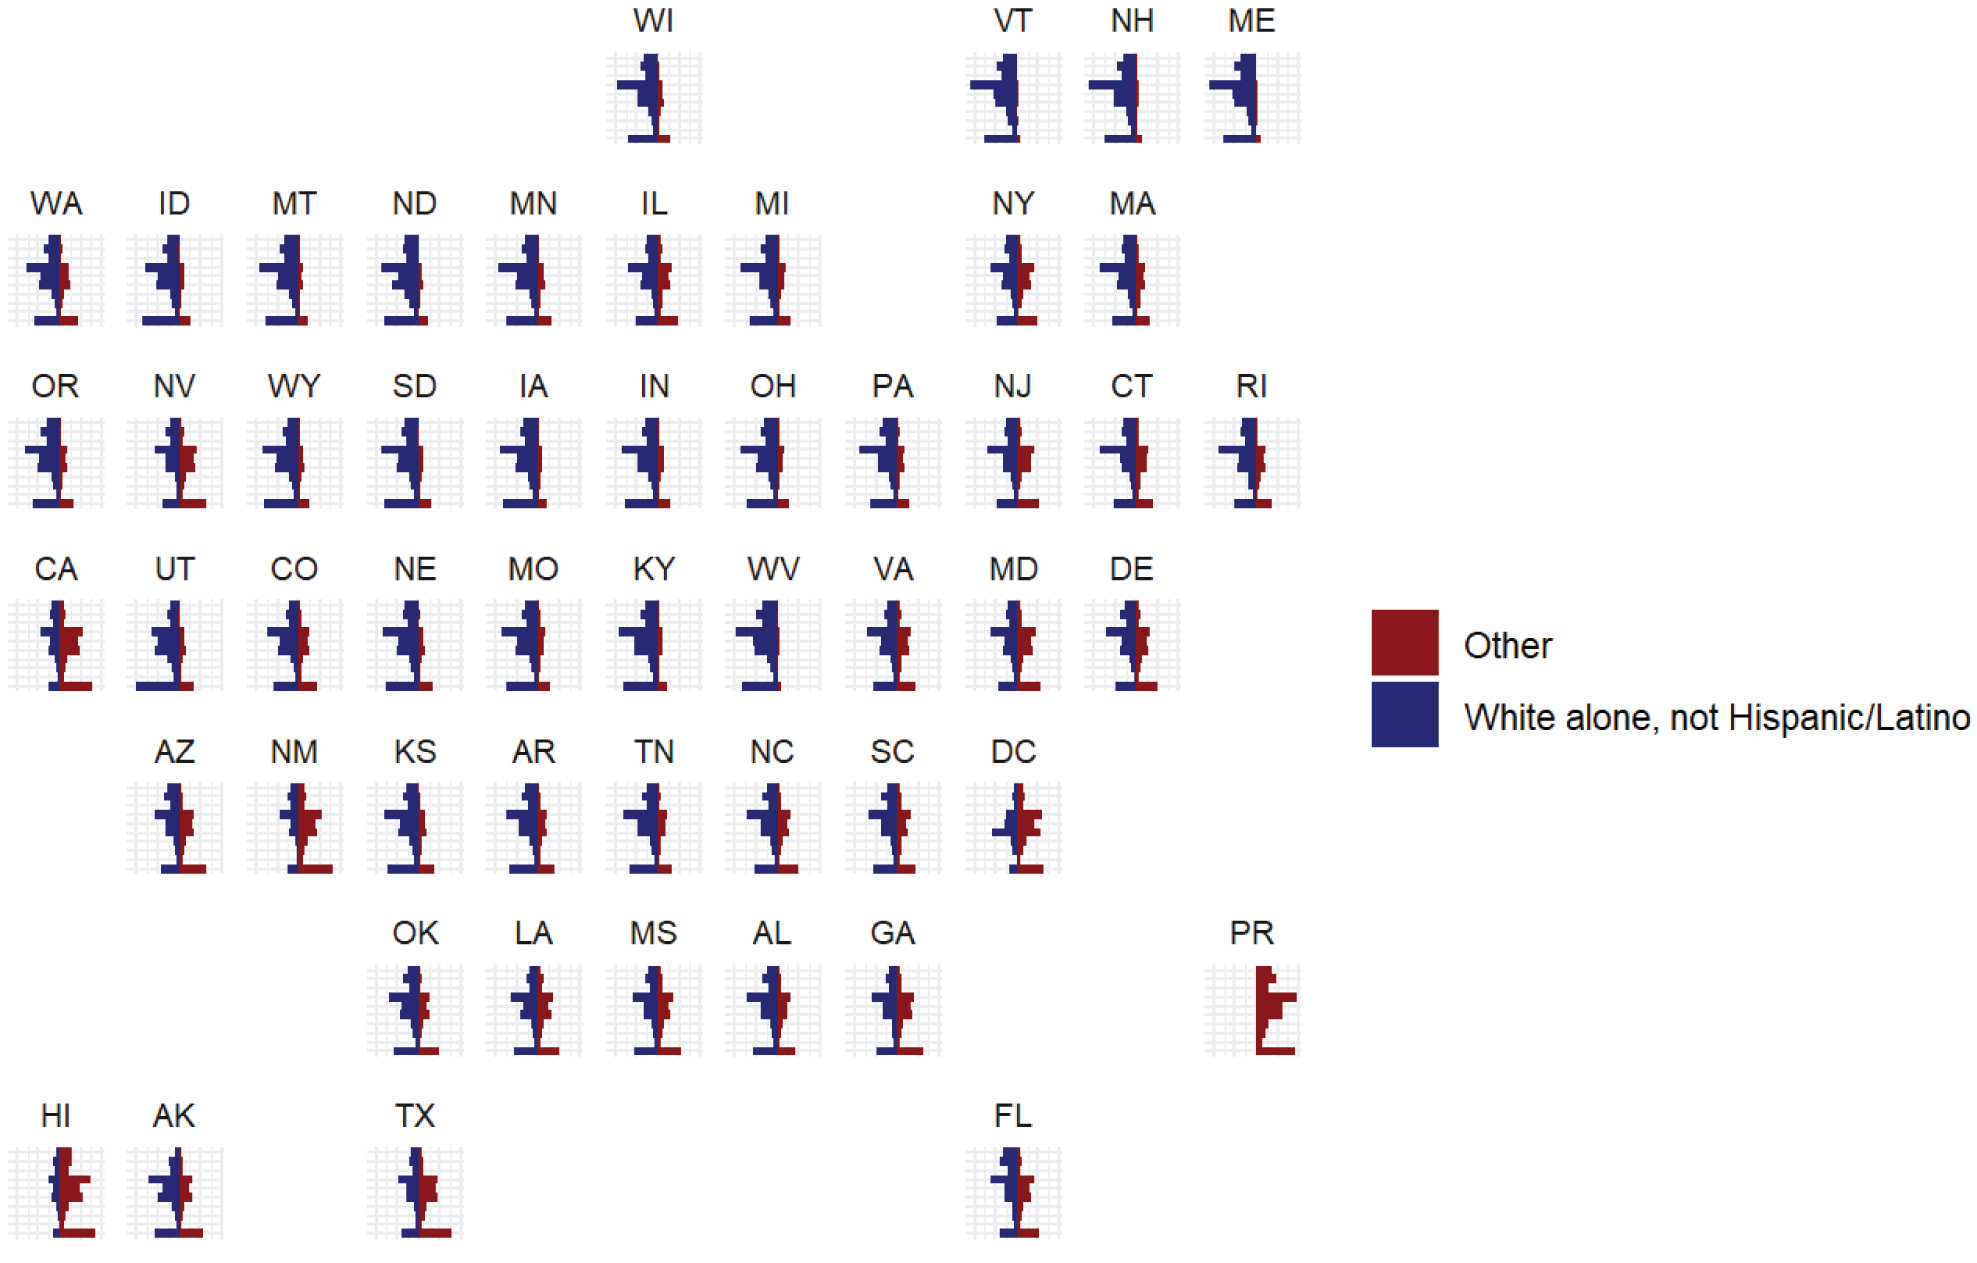
Data source: 2012-2016 CTPP Table A101201
Long Description.
The grid of small bar charts, each representing one US state and labeled with the state abbreviation; each chart contains mirrored vertical bars comparing two groups labeled as Other and White alone not Hispanic or Latino, with Other on the left and White alone not Hispanic or Latino on the right; bars represent different age groups and the horizontal axis reflects proportional population share; the source at the bottom reads Data source colon 2012 to 2016 CTPP Table A 1 0 1 2 0 1.


