Census Data Field Guide for Transportation Applications (2025)
Chapter: Summary

SUMMARY
Census Data Field Guide for Transportation Applications
The central role that transportation plays in the U.S. economy is reflected in this quote from the National Surface Transportation Policy and Revenue Study Commission (2007):
The American economy works, in large measure, because shippers, manufacturers, and service providers have a transportation system that provides many ways to access labor and move raw materials and finished products. Individuals are able to travel to workplaces, shopping, educational institutions, recreation, medical care, and other locations critical to their quality of life.
An efficient and well-performing transportation system contributes significantly to the nationʼs economy, facilitating the movement of people and goods. In recent years, emerging trends that have rapidly transformed the transportation field include
- Autonomous vehicles (passenger and freight),
- Pervasive connectivity (vehicle to vehicle, vehicle to infrastructure, and person to infrastructure),
- Micromobility (shared bikes and shared scooters),
- Sensing technologies (such as cameras, speed monitors, and air quality sensors),
- Mobile applications (for facilitating mobility and multimodal travel), and
- Data (large streams of data, analytics, and visualization).
The changes brought about by technology and the smartphone revolution have had important impacts on online shopping and individual travel for shopping purposes. Together with the emergence of transportation network companies, technology and smartphones have changed the way people live, work, shop, and play, with profound implications for transportation investment, policy, and operational decisions. One example of this change is the decrease in the proportion of licensed drivers among the 55-and-under age cohort in 2014 as compared to 1983 (Sivak and Schoettle 2016).
These changes in travel behavior need to be measured accurately to ensure that policy decisions happen in a data-driven context. However, collecting data on travel behavior is becoming more challenging and is hampered by low survey response rates and high rates of survey attrition. Therefore, it is critical to integrate different sources of travel behavior data to provide estimates in a consistent, reliable, and sustainable manner.
An FHWA report on data availability and gaps in understanding travel behavior highlights the need for data fusion techniques to overcome these gaps (Tawfik and Zohdy 2017). Census data, even in this age of big data, offer tremendous value and insights to help overcome the gaps in data availability identified by FHWA. The various data products released by the Census Bureau and its extensions provide information and insights that will help in making data-driven policy decisions to address changes in travel behavior.
Transportation agencies are facing significant challenges in preparing for and responding to changes in travel behavior because of increasing financial and technical constraints. Additionally, upcoming changes in the way that the Census Bureau releases data now and its plans to incorporate differential privacy make it vital that transportation analysts understand how to use Census Bureau data, the implications of data suppression, and how skewed results can prevent meaningful analysis. All these changes call for the development of a resource that is practical and relevant and that encourages both new entrants to the profession and experienced professionals to apply various Census Bureau data products to solve transportation problems. This research was motivated by the need to develop resources that could help a wide range of agencies, including FHWA, state departments of transportation (DOTs), transit operators, and metropolitan planning organizations (MPOs). The resources developed in this research can be used to evaluate the strengths and weaknesses of census data products as well as to guide users on how to best use these data in their own right or in conjunction with other data sources.
This research focused mainly on the following data sources released by the Census Bureau:
- American Community Survey (ACS),
- AASHTO Census Transportation Solutions (ACTS) program [formerly known as Census Transportation Planning Products (CTPP)],
- Public Use Microdata Sample (PUMS), and
- Longitudinal Employer-Household Dynamics (LEHD) program.
The research also discusses other data sources, such as FHWAʼs National Household Travel Survey (NHTS) and the Bureau of Labor Statistics (BLS) American Time Use Survey (ATUS). Table S.1 shows the various data sources discussed in this report, the date they were first administered, response rates (where available), and frequency of collection/release.
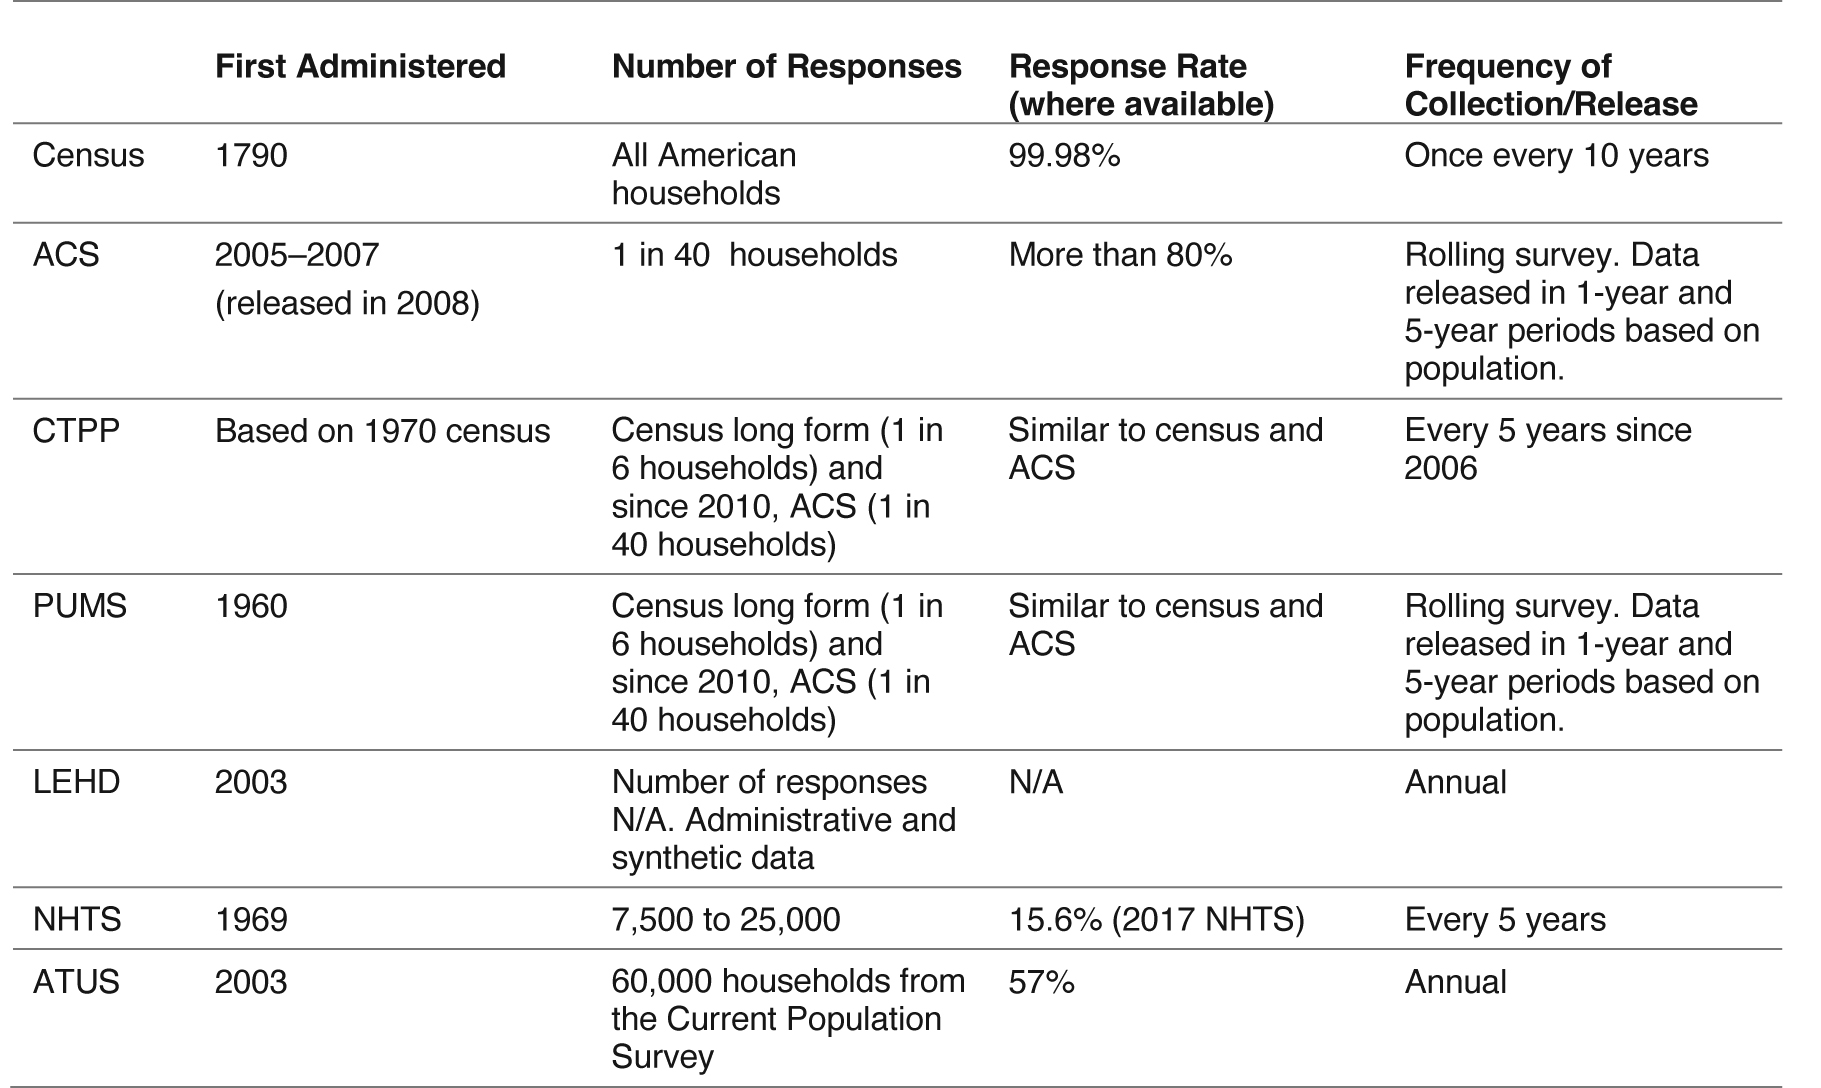
Long Description.
The table lists seven data sources with five columns. The first column is First Administered. The second column is Number of Responses. The third column is Response Rate, where available. The fourth column is Frequency of Collection or Release. The census is first administered in 1790, includes all American households, has a response rate of 99.98 percent, and is collected once every 10 years. ACS was first administered from 2005 to 2007 and released in 2008, includes 1 in 40 households, has a response rate of more than 80 percent, and is a rolling survey with data released in 1-year and 5-year periods based on population. CTPP is based on the 1970 census, includes the long form in 1 in 6 households, and since 2010, ACS in 1 in 40 households, has a response rate similar to census and ACS, and has been collected every 5 years since 2006. PUMS was first administered in 1960, includes the long form in 1 in 6 households and since 2010 ACS in 1 in 40 households, has a response rate similar to Census and ACS, and is a rolling survey with 1-year and 5-year data releases based on population. LEHD was first administered in 2003, has no number of responses available, uses administrative and synthetic data, has no available response rate, and is collected annually. NHTS was first administered in 1969, includes 7.500 to 25.000 responses, had a response rate of 15.6 percent in 2017, and is collected every 5 years. ATUS was first administered in 2003, includes 60,000 households from the Current Population Survey, has a response rate of 57 percent, and is collected annually.
Uses of Census Data
The research team conducted a literature review of studies using census data and grouped them into two types. The first type of study employs census-related data sources as the primary data source and the primary variable of interest is compiled using a census-related data source. The second type of study employs census-related data sources as a secondary data source to augment analysis of research-driven data compiled from other sources. In this type of study, the breadth of research areas covered is wider than in the first type of study. Specifically, researchers rely on CTPP or ACS data to generate buffer- or neighborhood-level information to model various transportation-system-related variables. For example, CTPP variables, such as the commuting mode share and/or median household income at a census tract level, are employed to analyze transportation safety variables such as crash frequency (see Yasmin et al. 2018, Yasmin and Eluru 2018).
Figures S.1 and S.2 provide an overview of the distribution of topic areas in the two types of studies discussed in the literature review. Studies focused on the areas of commuting patterns and travel behavior were the most numerous first type of study (in which census data are the primary data source). Studies focused on the topic areas of policy analysis and travel behavior were the most numerous second type of study (in which census data are a secondary source). The literature review shows that census data are used for a broad range of subjects from built environment and accessibility to travel behavior analysis to survey methods and research.
Scenarios
The goal of this research was to provide analysts with tools to use census data as part of their daily workflow. The research team developed a series of scenarios that show the use of census data for survey weighting, understanding gaps in transit, and developing tools for transportation planners to employ in understanding demographic trends and employment.
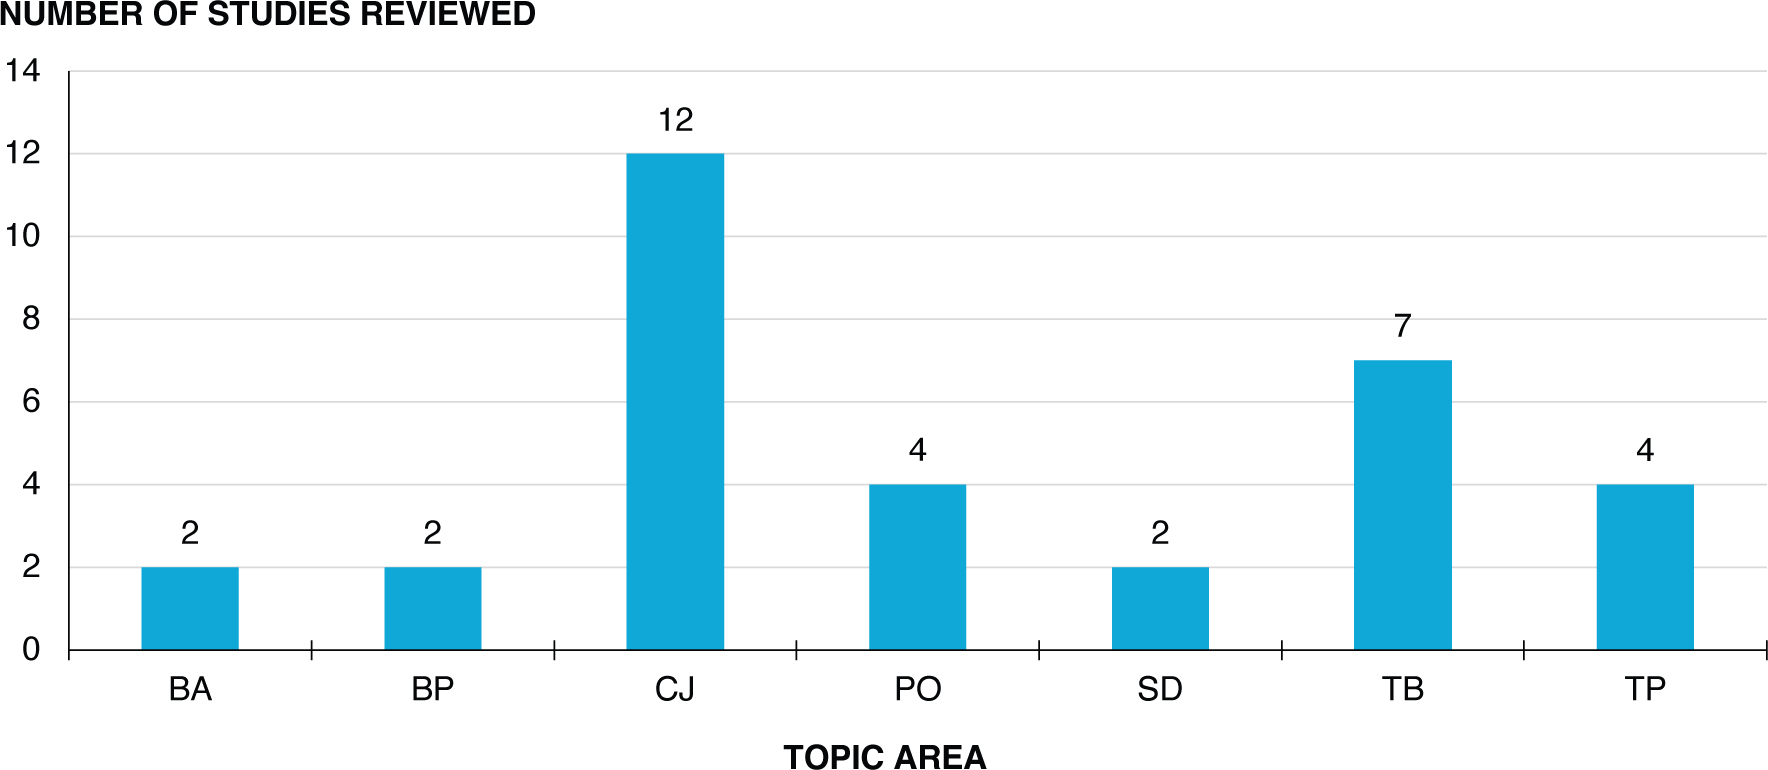
BA – Built Environment/Accessibility; BP – Bicycle and Pedestrian; CJ – Commuting Patterns/Job-Housing; PO – Policy Analysis; SD – Survey, Data, and Research Methods; TB – Travel Behavior Analysis; TP – Transit Planning
Long Description.
The vertical bar chart lists the number of reviewed studies that use census data as the primary data source across seven topic areas. Built Environment and Accessibility has 2 studies. Bicycle and Pedestrian has 2 studies.Commuting Patterns and Job-Housing has 12 studies. Policy Analysis has 4 studies. Survey, Data, and Research Methods has 2 studies. Travel Behavior Analysis has 7 studies. Transit Planning has 4 studies.
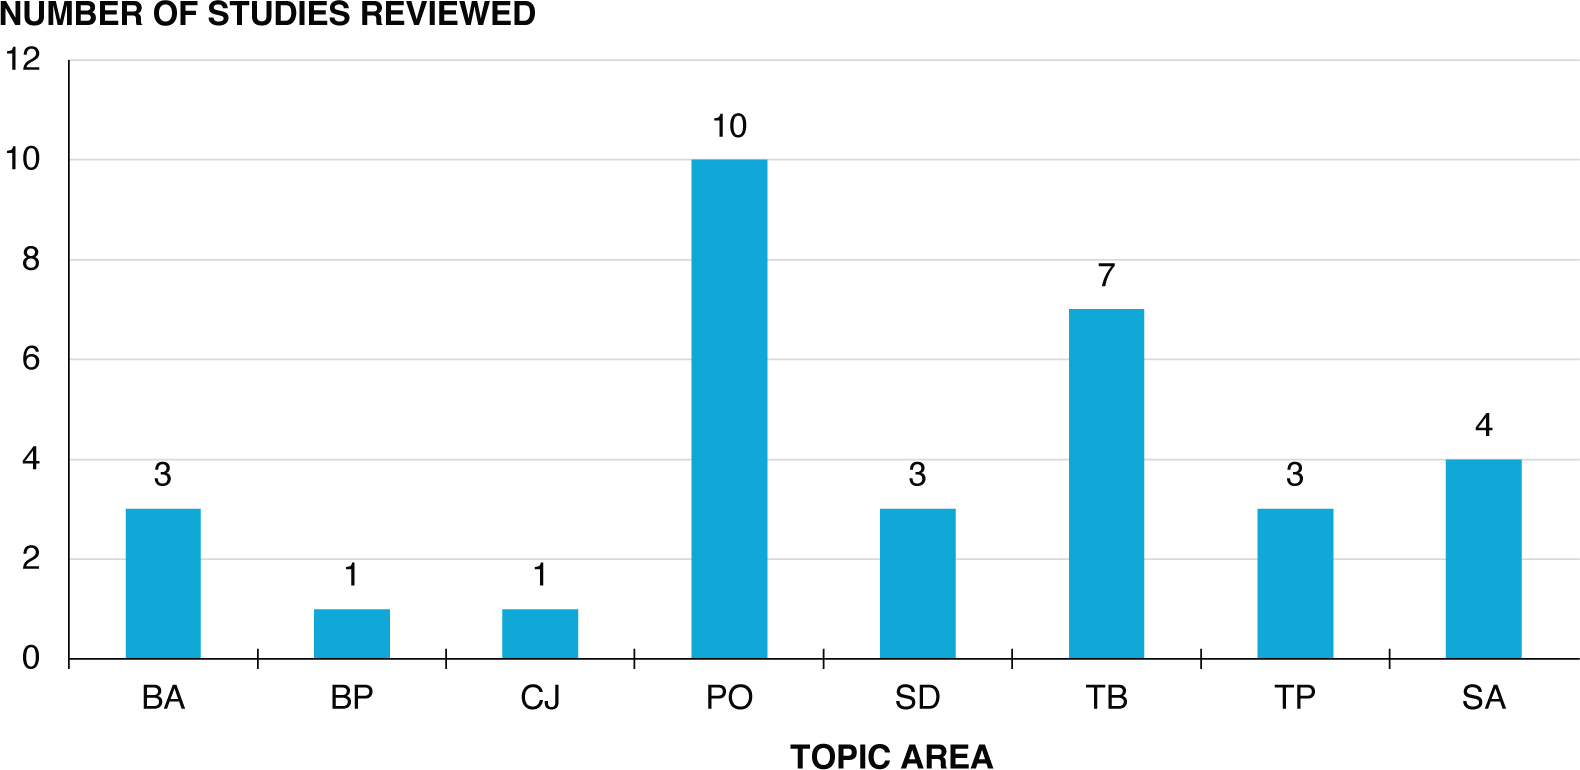
BA – Built Environment/Accessibility; BP – Bicycle and Pedestrian; CJ – Commuting Patterns/Job-Housing; PO – Policy Analysis; SD – Survey, Data, and Research Methods; TB – Travel Behavior Analysis; TP – Transit Planning; SA – Safety Analysis
Long Description.
The vertical bar chart lists the number of reviewed studies that use census data as a secondary data source across eight topic areas. Built Environment and Accessibility has 3 studies. Bicycle and Pedestrian has 1 study. Commuting Patterns and Job-Housing has 1 study. Policy Analysis has 10 studies. Survey, Data, and Research Methods has 3 studies. Travel Behavior has 7 studies. Transit Planning has 3 studies. Safety Analysis has 4 studies.
The scenarios also demonstrate how these tools can be used to analyze census data for travel model validation.
This report also discusses the implications of COVID-19, the resulting census pulse surveys, and the data relevance to transportation. Finally, the report provides practitioners with resources and guidelines for using census data.
Changes to Census Data Collection
Reduced response rates, concerns about nonresponse bias, the need to reduce respondent burden and produce high-quality data, and an increased ability to merge large-scale private data with census data to overcome privacy protections have spurred the Census Bureau to consider using administrative data and synthetic data. While administrative data can be more precise in their quality and can potentially mitigate respondent burden, some researchers have concerns about the quality and validity of the data underlying synthetic data and how practitioner use will be affected.
The Census Bureau is researching a new, fully synthetic data product to explore whether this would produce more accurate data by correcting for known sources of error and potentially allowing for more tabulations at lower levels of geography while maintaining respondentsʼ privacy. The Census Bureau expects that a multiyear process will be needed to research alternatives to the ACS in an era of declining survey response rates. Figure S.3 shows current and future access to ACS microdata.
Report Organization
This report is organized into 19 chapters. The history of the Census is discussed in Chapter 1, followed by a discussion of the ACS in Chapter 2. Chapter 3 outlines the features of ACTS, which was formerly known as CTPP. Chapter 4 focuses on PUMS, and Chapter 5 discusses the LEHD program. Chapter 6 is devoted to the NHTS and the ATUS.
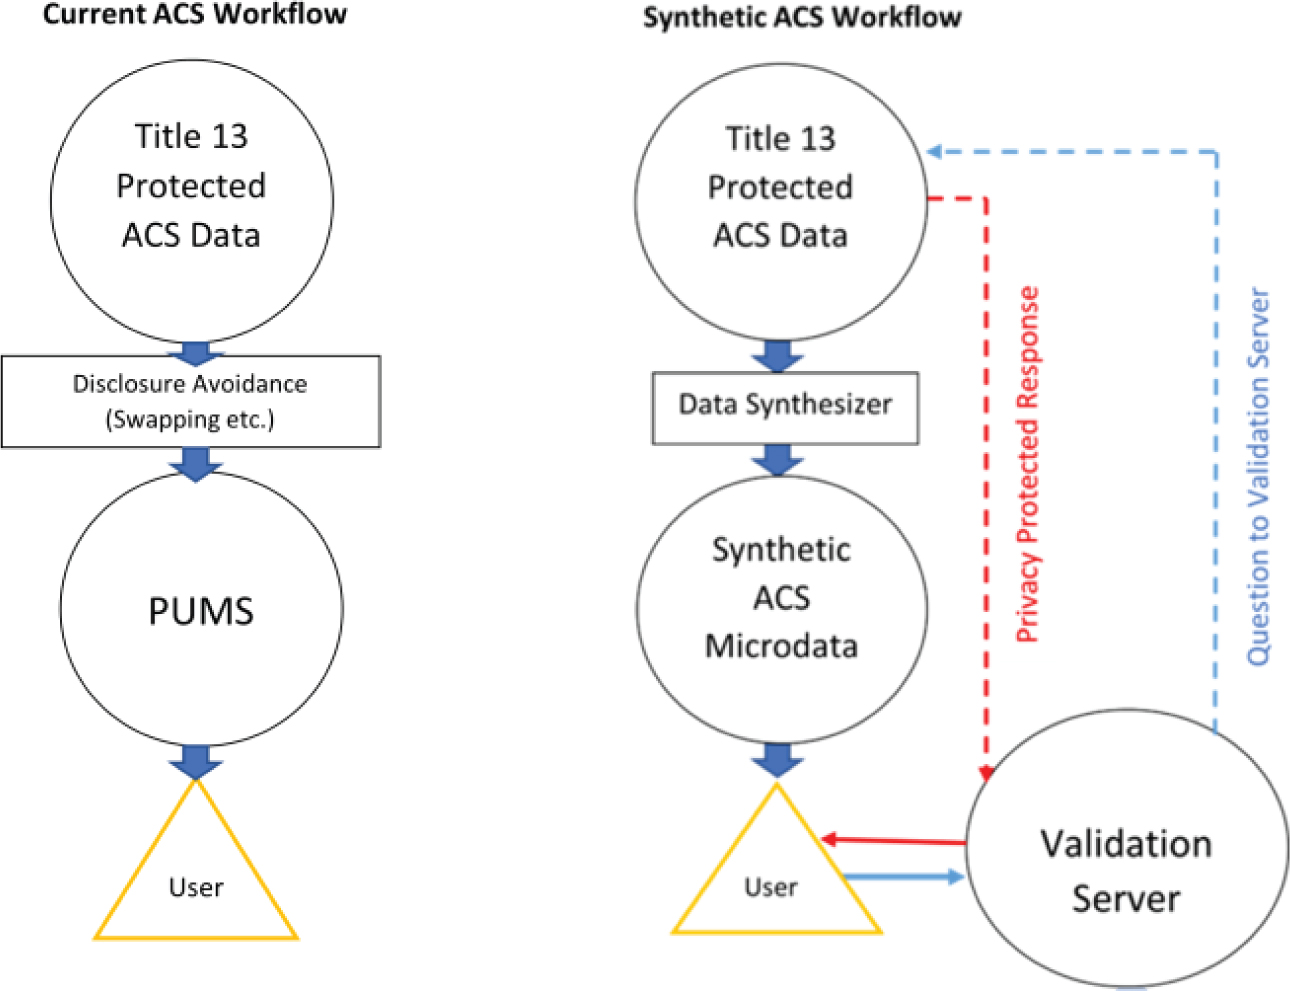
Source: Reynolds and Vink 2023.
Long Description.
The diagram compares two workflows for access to ACS microdata. On the left, the current ACS workflow starts with Title 13 Protected ACS Data. It moves to Disclosure Avoidance with steps like swapping. Then it flows into PUMS. Finally, the data reaches the user. On the right, the synthetic ACS workflow also starts with Title 13 Protected ACS Data. The next step is the Data Synthesizer. This produces Synthetic ACS Microdata. This data is sent to the user. The user can send queries to a Validation Server. The server responds with a privacy protected response. The validation server is only present in the synthetic workflow. Both workflows end with access to data by the user.
Chapter 7 focuses on differential privacy and its implications for data products used by transportation planners and modelers. Chapter 8 discusses the various uses of census data and provides an extensive literature review of past research using census data as a key source to support policy questions.
Chapter 9 describes a workshop conducted at the TRB Annual Meeting in January 2020 to solicit input from transportation practitioners on what was wanted in a field guide to using census data. Chapter 10 discusses the COVID-19 crisis and its impacts on the availability and use of census data for transportation and other industries. Chapter 11 presents a detailed framework and an annotated outline of the field guide.
Chapters 12 through 18 provide seven detailed scenarios that rely on census-related data sources and provide practical “how to” advice to practitioners on maximizing the value and usefulness of census data. In addition to step-by-step instructions and screenshots, the code and programs that were used to extract and analyze census data are also provided. The report concludes with Chapter 19, which discusses calculators and training resources that are available to practitioners to help them maximize the value of census data.


