Census Data Field Guide for Transportation Applications (2025)
Chapter: 4 Public Use Microdata Sample

CHAPTER 4
Public Use Microdata Sample
The Census Bureau provides data summaries and tabulations from its large-scale data collection efforts, such as the decennial census and the ACS. These data are available as single-variable tables at different prespecified geographic levels as described at data.census.gov.
To allow data users to explore relationships between variables that the Census Bureau may not have anticipated, the Bureau began providing Public Use Microdata Sample (PUMS) data in the mid-twentieth century. PUMS data are a sample of the actual confidential records of individuals and housing units from the decennial census or ACS responses, which have been subjected to disclosure protection. In NCHRP Synthesis 434, Tierney discusses how PUMS data are used by state DOTs and MPOs in their analyses (Tierney 2012). The key advantage of PUMS data is that users can investigate relationships between variables and develop cross tabulations that are not available in the standard tabulations provided by the Census Bureau. This allows for a wider range of analyses, such as examining the characteristics of specific subpopulations or investigating multivariable relationships through larger n-way tables or population simulation.
The Census Bureau provides PUMS data files for the year 2000 census (a 5-percent sample and a 1-percent sample) and the ACS (annual 1-year files with 1 percent of housing unit records and group quarters residents, as well as 5-year files combining successive 1-year files). Although the PUMS data from the ACS and the decennial census long form are similar in principle, there are important differences due to the conceptual differences in the data collection efforts.
Figure 4.1 shows the difference between the ACS and PUMS data.
Due to confidentiality protections and the fact that PUMS files are based on only about two-thirds of the ACS sample, estimates using the ACS PUMS may differ from estimates provided through the ACS Summary File or other published Census Bureau tables and profiles. You can verify that you have correctly accessed and tabulated data from the ACS PUMS file by replicating the values presented in “PUMS Estimates for User Verification” in the PUMS Technical Documentation (www.census.gov/programs-surveys/acs /technical-documentation/pums/documentation.html).
4.1 Disclosure Avoidance
Because the microdata represent complete records of actual individual census data responses and the law requires the Census Bureau to protect the confidentiality of respondents, the Census Bureau takes several precautions to preserve data confidentiality when publishing PUMS data (U.S. Census Bureau 2020b). These precautions include the following measures also discussed in the study by Tierney (2012):
- Using only 1 to 5 percent of the full ACS sample to create the PUMS.
- Excluding information that can expose personally identifying information to identify a specific housing unit, group quarters unit, or person.
- “Swapping” (or exchanging) a small number of records with similar records from neighboring areas.
- Top-coding or bottom-coding answers to selected variables. Top-coding and bottom-coding involve truncating extreme values for certain variables.
- Limiting the geographic areas that can be identified in the PUMS. Data are available for the nation, regions, divisions, states, and Public Use Microdata Areas (PUMAs).
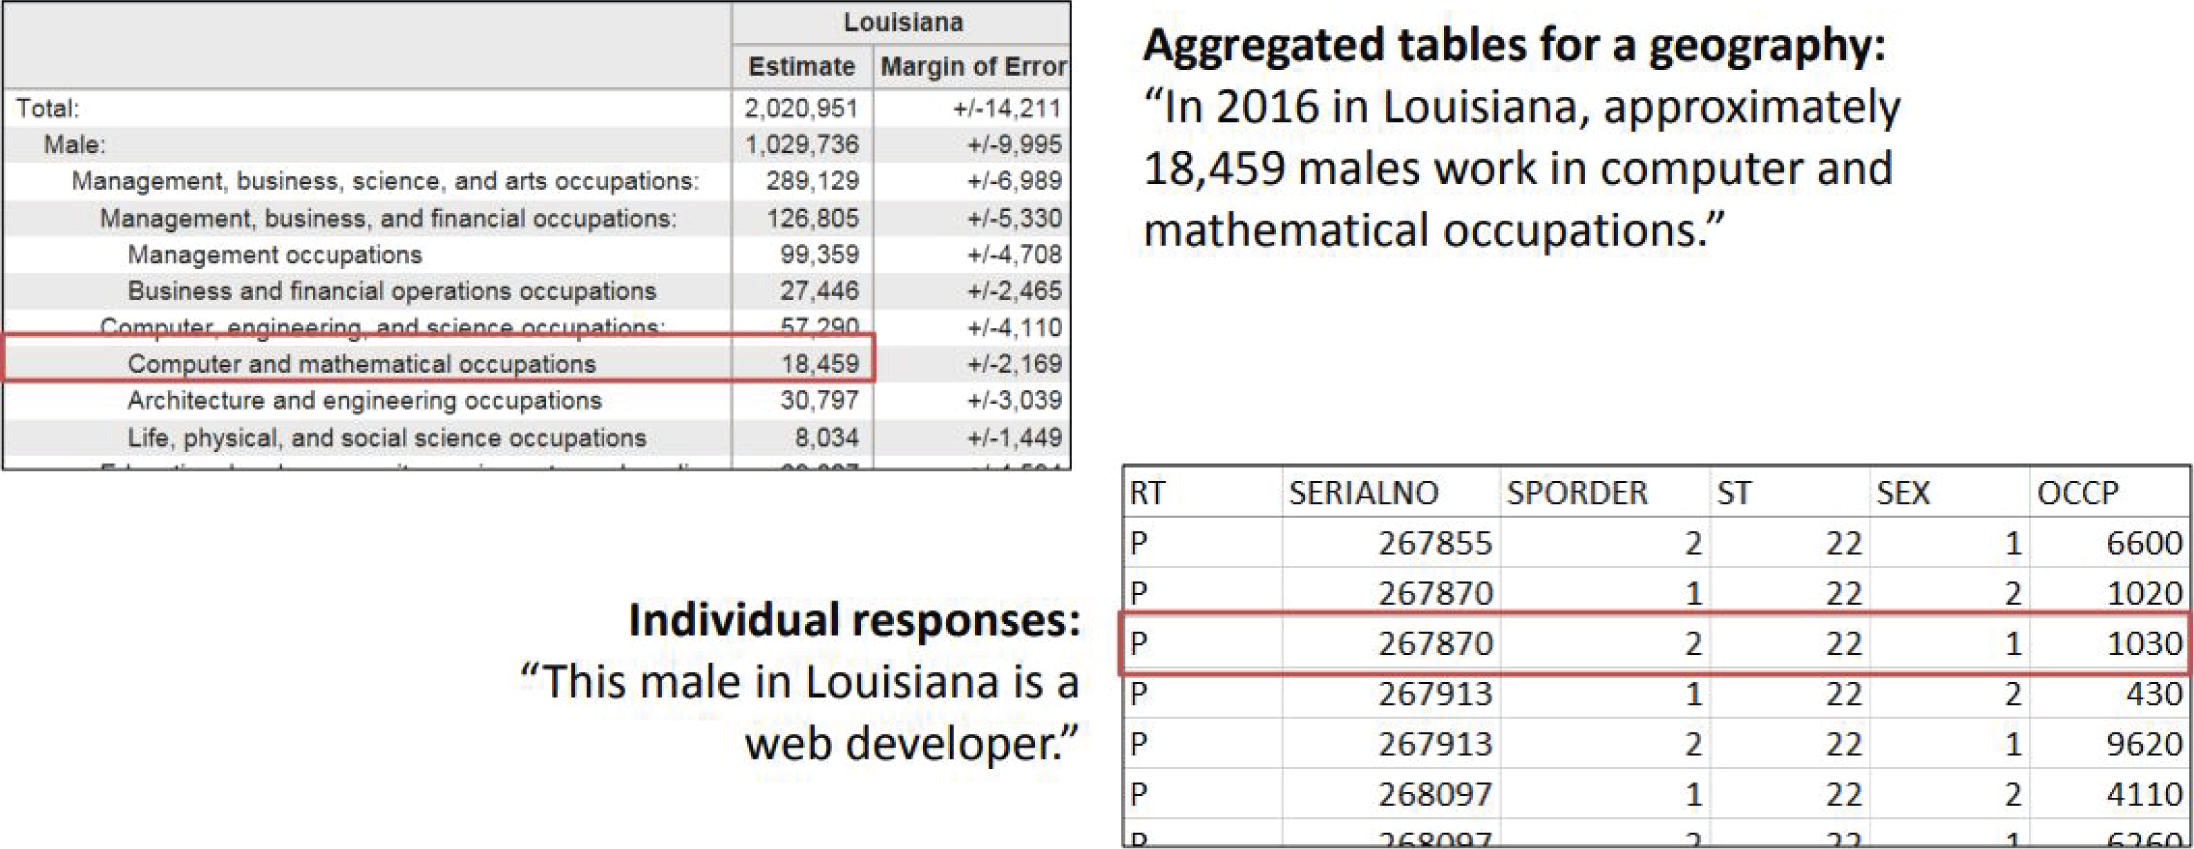
Source: Weister 2018.
Long Description.
The graphic compares American Community Survey aggregate data and Public Use Microdata Sample individual data using information from Louisiana in 2015. On the top left, an aggregated table lists estimated counts and margin of error for males in various occupations, including computer and mathematical occupations. It states that about 18,459 males work in computer and mathematical occupations. On the bottom right, individual response records show person-level data such as serial number, sex, and occupation codes. One record indicates that a male in Louisiana is a web developer. It includes the highlighted data, with the serial number 267870, sex 1, and occupation code 1030. The example highlights that aggregate tables summarize data by category for a geography, while PUMS includes specific information from individual responses.
4.2 PUMS Geography
The material in this section is reproduced from the Census Bureau publication Understanding and Using the American Community Survey Public Use Microdata Sample Files: What Data Users Need to Know (U.S. Census Bureau 2020b).
In the PUMS files, PUMAs are identified by a five-digit code. However, the five-digit codes are not unique across states. State identifiers must be used in conjunction with PUMA codes when working with data for multiple states.
The nation, regions, divisions, states, and Public Use Microdata Areas, or PUMAs, are the only geographic areas identified in PUMS. PUMAs are geographic areas defined specifically for the dissemination of PUMS data from the decennial census, ACS, and Puerto Rico Community Survey. In the PUMS files, PUMAs are identified by a five-digit code. However, the five-digit codes are not unique across states. State identifiers must be used in conjunction with PUMA codes when working with data for multiple states.
PUMA boundaries are defined using three main criteria
- Each PUMA must have a population of 100,000 or more at the time of delineation, and that population threshold must be maintained throughout the decade. Areas that are experiencing substantial population decline at the time of delineation (or where decline is anticipated) are delineated to include a population greater than 100,000 persons. If the population falls substantially below 100,000 in a given PUMA, the Census Bureau may combine that PUMA with one or more adjacent PUMAs to ensure data confidentiality.
- PUMAs are based only on aggregations of counties and census tracts and cannot cross state boundaries.
- The building blocks for PUMAs must be contiguous—or share a common border—unless the features of the counties or census tracts used as building blocks are noncontiguous (for example, islands). As long as population criteria are met, one county may be designated as a PUMA. Contiguous census tracts may be aggregated to create a PUMA, as can two or more contiguous counties. Tract-based PUMAs may cross county boundaries, provided each PUMA-county part meets a minimum population of 2,400.
In addition to the required criteria, the Census Bureau strongly encourages the State Data Centers (SDCs) to incorporate the following guidelines in their PUMA definitions:
- Wherever possible, each PUMA should comprise an area either entirely inside or entirely outside metropolitan or micropolitan statistical areas.
- Decennial census place definitions, decennial census urban/rural definitions, and local knowledge should inform PUMA delineations.
- PUMAs should not contain more than 200,000 people, unless identified as an area that is likely to undergo substantial population decline over the decade.
- PUMAs should avoid unnecessarily splitting American Indian reservations (AIRs) and/or off reservation trust lands (ORTLs) and separating American Indian populations particularly if large numbers of American Indians are included within all parts of the split AIRs/ORTLs.
Counties with large populations are typically subdivided into multiple PUMAs, while PUMAs in more rural areas comprise two or more adjacent counties.
Source: U.S. Census Bureau 2020b.
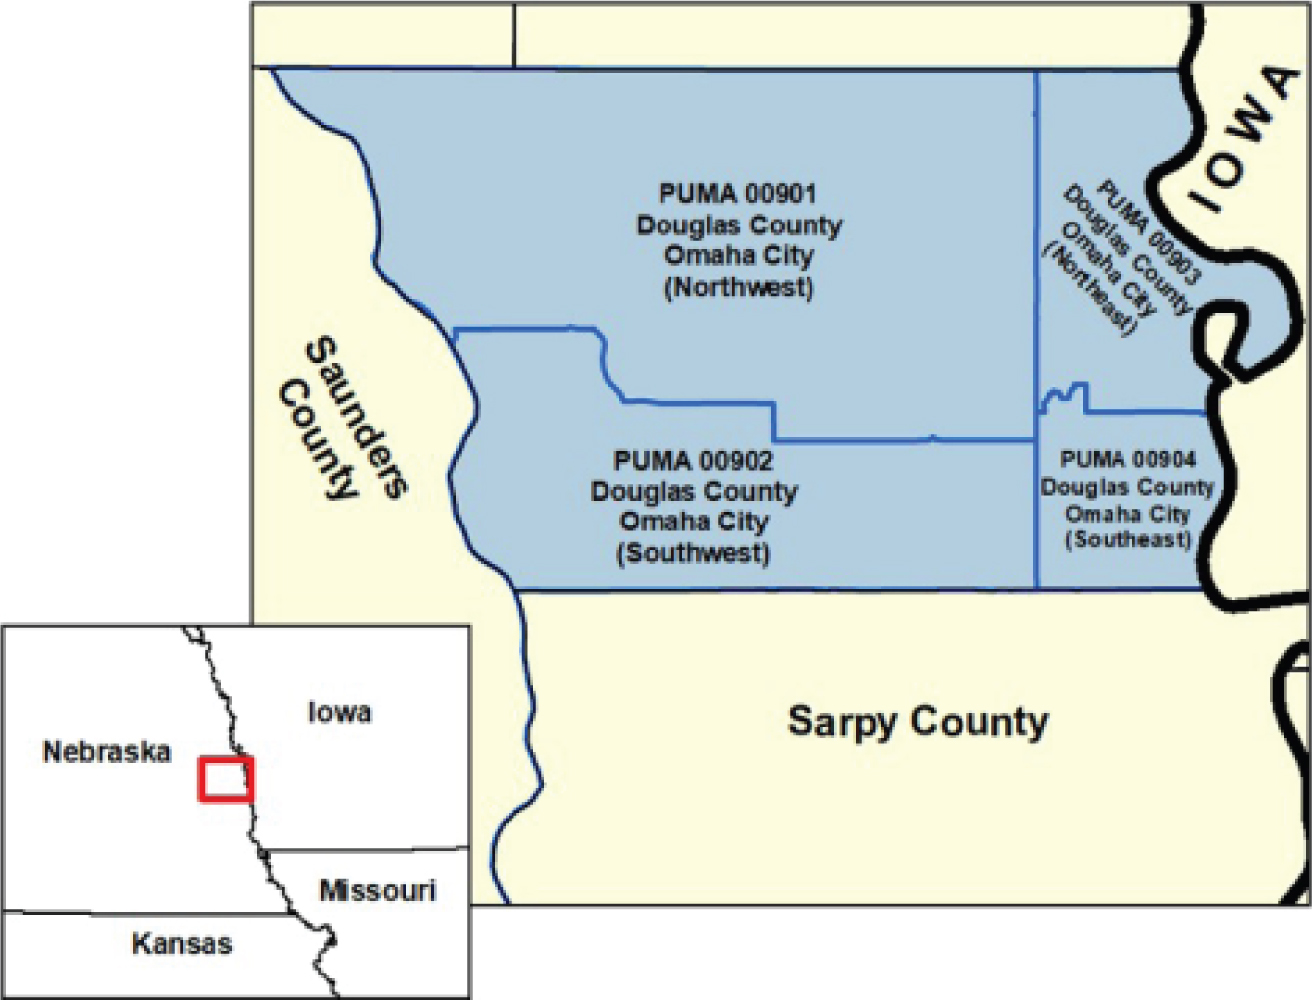
Long Description.
The map outlines four Public Use Microdata Areas in Douglas County, Nebraska. Each PUMA is labeled with a code and city direction. PUMA 0 0 9 0 1 covers Omaha City Northwest. PUMA 0 0 9 0 2 covers Omaha City Southwest. PUMA 0 0 9 0 3 covers Omaha City Northeast. PUMA 0 0 9 0 4 covers Omaha City Southeast. The map shows boundaries with Saunders County to the west, Sarpy County to the south, and Iowa to the east. An inset in the lower left marks the location of Douglas County within Nebraska, near the borders of Iowa, Kansas, and Missouri.
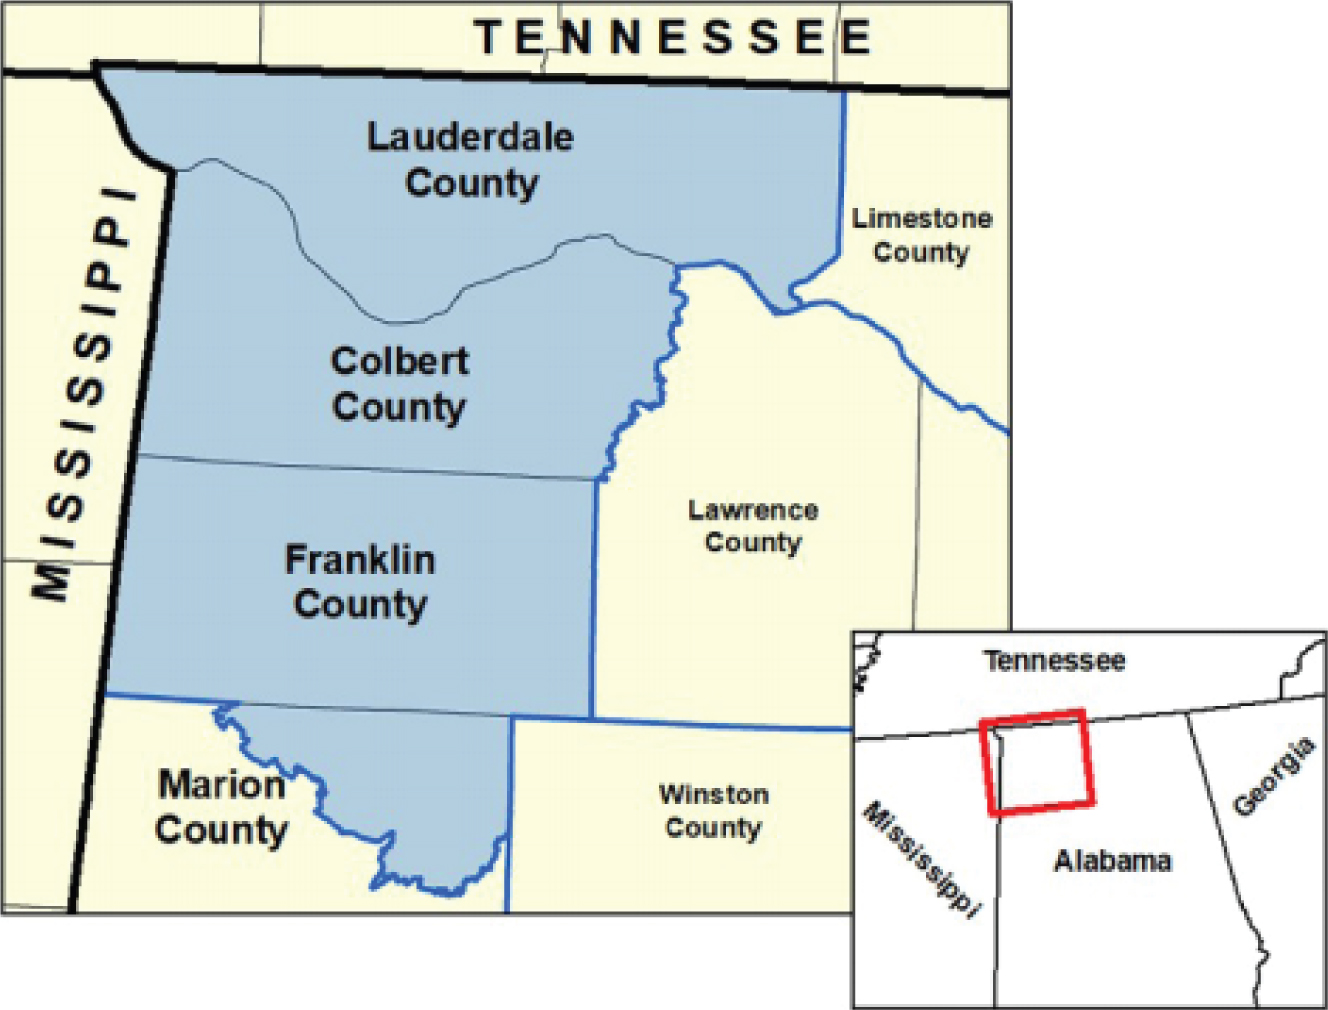
According to Understanding and Using the American Community Survey Public Use Microdata Sample Files: What Data Users Need to Know, Figure 4.2 shows “four PUMAs located within Douglas County, Nebraska.” Figure 4.3 shows “a single PUMA in Alabama (PUMA 00100) that spans four counties. Three of these counties (Colbert, Franklin, and Lauderdale) are fully contained within the PUMA, while one county (Marion) is only partially contained within the PUMA” (U.S. Census Bureau 2020b).
Source: U.S. Census Bureau 2020b.
Long Description.
The map outlines Alabama Public Use Microdata Area 0 0 1 0 0. It includes Lauderdale County, Colbert County, Franklin County, and the northeast part of Marion County. The PUMA area is shaded. Neighboring counties such as Limestone, Lawrence, Winston, and the rest of Marion are not shaded. State borders are shown with Mississippi to the west and Tennessee to the north. An inset in the bottom right highlights the location of the PUMA within Alabama and its position near Mississippi and Tennessee.
Understanding and Using the American Community Survey Public Use Microdata Sample Files: What Data Users Need to Know (U.S. Census Bureau 2020b) also discusses how information on place of work and migration can be used by transportation planners to study primary work location and changes in residential location:
Place of work (POW) PUMAs and Migration (MIG) PUMAs are used in the publication of ACS PUMS files to provide data on place of work, in- and out-migration flows, and demographic characteristics of workers and migrants. POWPUMAs identify the location of a respondentʼs primary place of work, while MIGPUMAs identify a respondentʼs place of residence one year ago.
POWPUMAs and MIGPUMAs follow the same sets of boundaries and codes but are not always aligned with standard PUMAs. Because POWPUMAs/MIGPUMAs are county-based, they may contain multiple standard PUMAs that have been aggregated together to create larger areas in order to protect the confidentiality of respondents. In these instances, the POWPUMAs/MIGPUMAs are assigned unique codes that do not match the codes of any standard PUMAs.
Because place of work PUMAs (POWPUMAs) are county based, PUMA to POWPUMA flows are usable only at very large geographies. The CTPP (ACTS) is a better source of detailed commuter flows.
4.3 Uses of PUMS Data
NCHRP Synthesis 434 explores the awareness of, attitudes toward, and uses of PUMS data by state DOTs, large MPOs, and small/medium MPOs. Findings from a web-based survey conducted for this study include the following (Tierney 2012):
- Among state DOT and MPO analysts, the use of census PUMS data is less prevalent than the use of most other census data products.
- Of the three types of agencies studied, large MPOs are most likely to use the PUMS data, and smaller MPOs are least likely to use these data.
- In general, agencies that use PUMS data consider these data to be very important or somewhat important to their objectives and tend to rate the data highly along most quality dimensions.
- Despite the moderately high satisfaction levels of PUMS users, many of the agencies that do not use PUMS data are not aware of what the data are or have not identified a specific need for the data.
- Finally, academic researchers make limited use of the PUMS data for surveys and travel demand modeling purposes and use them heavily to simulate synthetic population and to conduct customized tabulations.
Table 4.1 summarizes the types of transportation analyses for which data specialists use PUMS.
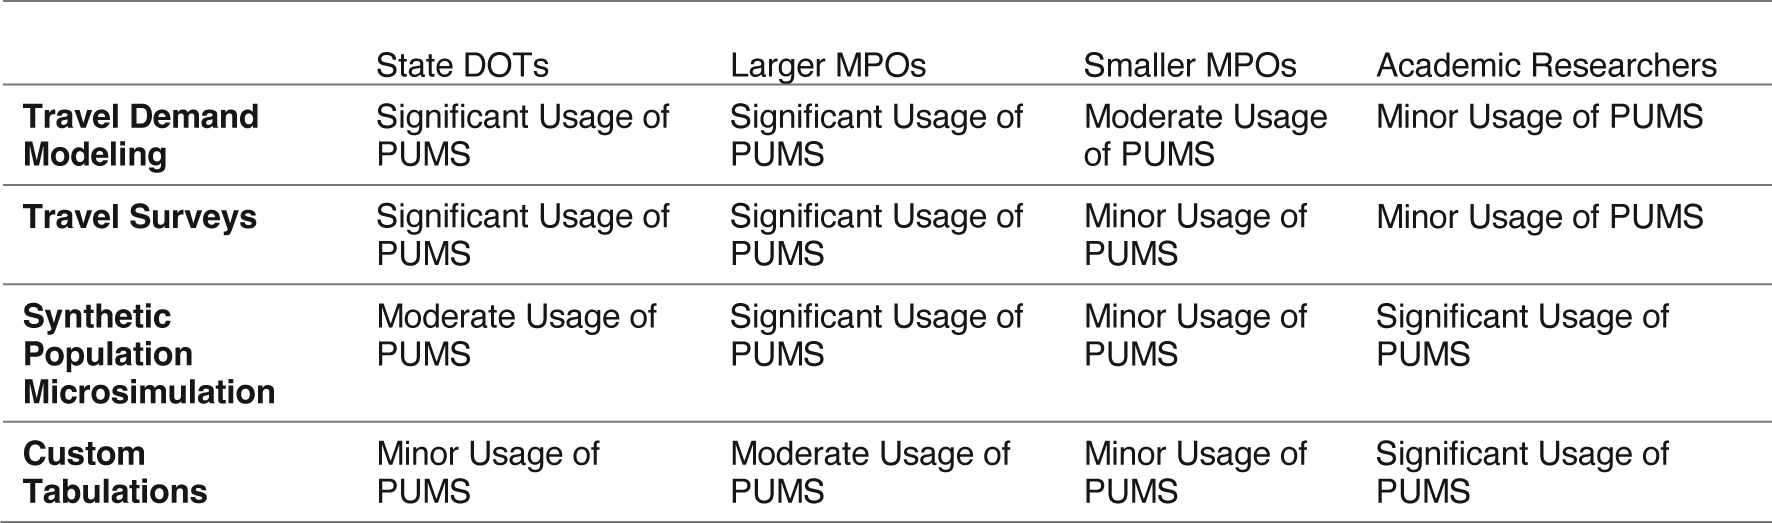
Source: Tierney 2012, Figure 13.
Long Description.
The table presents levels of PUMS usage by four user groups across four activities. The user groups are State DOTs, Larger MPOs, Smaller MPOs, and Academic Researchers. The activities include Travel Demand Modeling, Travel Surveys, Synthetic Population Microsimulation, and Custom Tabulations. For Travel Demand Modeling, State DOTs and Larger MPOs have significant usage, Smaller MPOs have moderate usage, and Academic Researchers have minor usage. For Travel Surveys, both State DOTs and Larger MPOs have significant usage, while Smaller MPOs and Academic Researchers have minor usage. For Synthetic Population Microsimulation, State DOTs show moderate usage, Larger MPOs show significant usage, Smaller MPOs show minor usage, and Academic Researchers show significant usage. For Custom Tabulations, State DOTs show minor usage, Larger MPOs show moderate usage, Smaller MPOs show minor usage, and Academic Researchers show significant usage.


