Census Data Field Guide for Transportation Applications (2025)
Chapter: 19 Resources and Guidelines for Practitioners

CHAPTER 19
Resources and Guidelines for Practitioners
This chapter focuses on resources available to the practitioner and includes a comparison of statistical calculators for computing MOEs when combining different variables or estimates within variables. This chapter also considers what happens when multiple estimates or variables are combined and their impact on the standard error compared to the microdata. Another topic covered in this chapter is using the Census Bureauʼs API. Finally, a list of training resources is provided.
19.1 Comparison of Statistical Calculators
The three statistical calculators available to practitioners using census data are the following:
- New York State Data Center Calculator
- Census Bureau Statistical Testing Tool
- National Center for Transit Research (NCTR) Statistical Calculator
Each of the tools is described in the following, and some insights are provided regarding their usefulness.
19.1.1 New York State Data Center Calculator
This spreadsheet-based tool (http://www.trbcensus.com/notes/StatisticalCalculationsMenu.xls) is the simplest and easiest to use and includes five calculators that
- Calculate the statistical significance of the difference between two estimates.
- Calculate the 90% MOE for the difference between or the sum of two estimates.
- Calculate the 90% MOE for the sum of three or more estimates.
- Calculate the MOE for a proportion.
- Calculate the MOE for a ratio.
For each case, the calculator provides the theory and when it is appropriate to use the specific calculator. This is followed by an example of the calculation carried out. This provides users of the calculator with a reference for applying the calculator to their own census and travel data. This calculator is recommended for practitioners who consider themselves beginners.
19.1.2 Census Bureau Statistical Testing Tool
The Census Bureau provides a spreadsheet-based statistical comparison tool (https://www.census.gov/programs-surveys/acs/guidance/statistical-testing-tool.html) that provides for the statistical comparison of two or multiple estimates. This tool provides the user with a quick check
on whether the estimates are statistically different or not or whether these statistical tests are even applicable for one or more of the estimates.
The tool only provides a comparison of the estimates, and it does not explicitly mention some of the issues that arise when linearly combining three or more estimates. Further, the tool focuses on estimates but is silent on computing statistical significance for a proportion or ratio. These drawbacks to the Census Bureau statistical testing tool mean that the New York State Data Center calculator is a better tool since it offers a way to perform a broader range of calculations.
19.1.3 NCTR Statistical Calculator
The NCTR calculator (https://rosap.ntl.bts.gov/view/dot/17758/dot_17758_DS1.xls) is the most comprehensive and detailed calculator of the three described in this section and is recommended for advanced users of the CTPP program. This calculator allows comparisons to Census 2000, which is the last census to use the census long form. The calculator itself has four functions and fifteen subfunctions that can be summarized as follows (https://fdotwww.blob.core.windows.net/sitefinity/docs/default-source/research/reports/fdot-bdk85-977-02-rpt.pdf):
- A. To derive other precision measures for ACS estimates in published tables at American FactFinder or estimates in CTPP ACS tables. Estimates from these two sources come with a margin of error (MOE):
- 01. For up to 200 ACS estimates from the same table (A01-ACS).
- B. To derive the precision measures for individual estimates that do not already have an MOE. These include published Census 2000 estimates, CTPP 2000 estimates, individual user-derived estimates from an ACS PUMS, and user-derived estimates from a Census 2000 PUMS:
- 02. For frequencies, totals, averages, or medians from an ACS PUMS using replicate estimates (B02-ACS Direct).
- 03. For averages from Census 2000 or a PUMS using a distribution table (B03-Average).
- 04. For medians from Census 2000 or a PUMS using a distribution table (B04-Median).
- 05. For frequencies from Census 2000 or a PUMS using design factors (B05-Frequency).
- 06. For percentages from 2000 Census or a PUMS using design factors (B06-Percentage).
- C. To derive the precision measures for new estimates obtained from two or more original estimates that already have an MOE. These estimates can be published ACS estimates, CTPP estimates, estimates whose precision measures are derived using Function B, or estimates whose precision measures are derived using another sub-function of this function. This function covers estimates obtained using one of the following six operations:
- 07. Sum of two or more estimates (C07-Sum).
- 08. Difference of two estimates (C08-Diff).
- 09. Percent difference of two estimates (C09-%Diff).
- 10. Ratio of one estimate over another (C10-Ratio).
- 11. Percentage of one estimate in another (C11-Percentage).
- 12. Product of two estimates (C12-Product).
- D. To compare pairs of two estimates that already have an MOE. The estimates to be compared may be published ACS estimates, CTPP ACS estimates, estimates whose precision measures are derived using Function B, or estimates that are derived along with their precision measures using Function C. This function covers three types of comparisons:
- 13. One ACS estimate with another (D13-ACS&ACS).
- 14. One ACS estimate with a Census 2000 estimate using an actual MOE for the 2000 estimate (D14-ACS&2000 Actual).
- 15. One ACS estimate with a Census 2000 estimate using an assumed MOE for the 2000 estimate (D15-ACS&2000 Assumed).
For comparing ACS to Census 2000 data for mean, median, frequency, and percentages (Calculators B03 to B06), the user must be well versed in using the design factors that are required to determine the accuracy measures for estimates using data from the Census 2000 long form survey. Using these design factors is an exercise requiring detailed analysis of census sampling by geography and sociodemographic characteristics.
This calculator is best suited for advanced users of the CTPP. Newcomers to the ACTS program would be best served by using the New York State Data Center previously described. It should also be noted that the NCTR calculator has not been updated in a long time.
19.2 Approximating Standard Errors (and MOEs) for Multiple Estimates
Due to data privacy considerations, approximated standard errors can differ from those derived and published with ACS microdata. Therefore, the Census Bureau guides users to consider utilizing a collapsed version of a detailed table or the less detailed annual supplemental tables when computing the standard errors for more than two estimates. Using these tables, if available, may reduce the number of estimates used in the approximation. These issues may also be avoided by creating estimates and standard errors using PUMS or by requesting a custom tabulation. Table 19.1 through Table 19.3 show the changes in MOE based on the number of estimates used to calculate the MOE.
A comparison of MOEs between the three tables suggests the following:
- Ratio of MOEs from Table 19.1 and Table 19.2 for 65 years and older is 16.5
- Ratio of MOEs from Table 19.1 and Table 19.3 for 65 years and older is 27.9
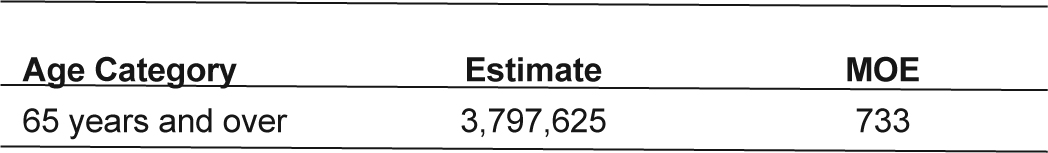
Source: U.S. Census Bureau.
Long Description.
The table has three columns: Age Category, Estimate, and Margin of Error. There is only one row, in which Age Category is 65 years and over; Estimate is 3, 797,625; and Margin of Error is 733.
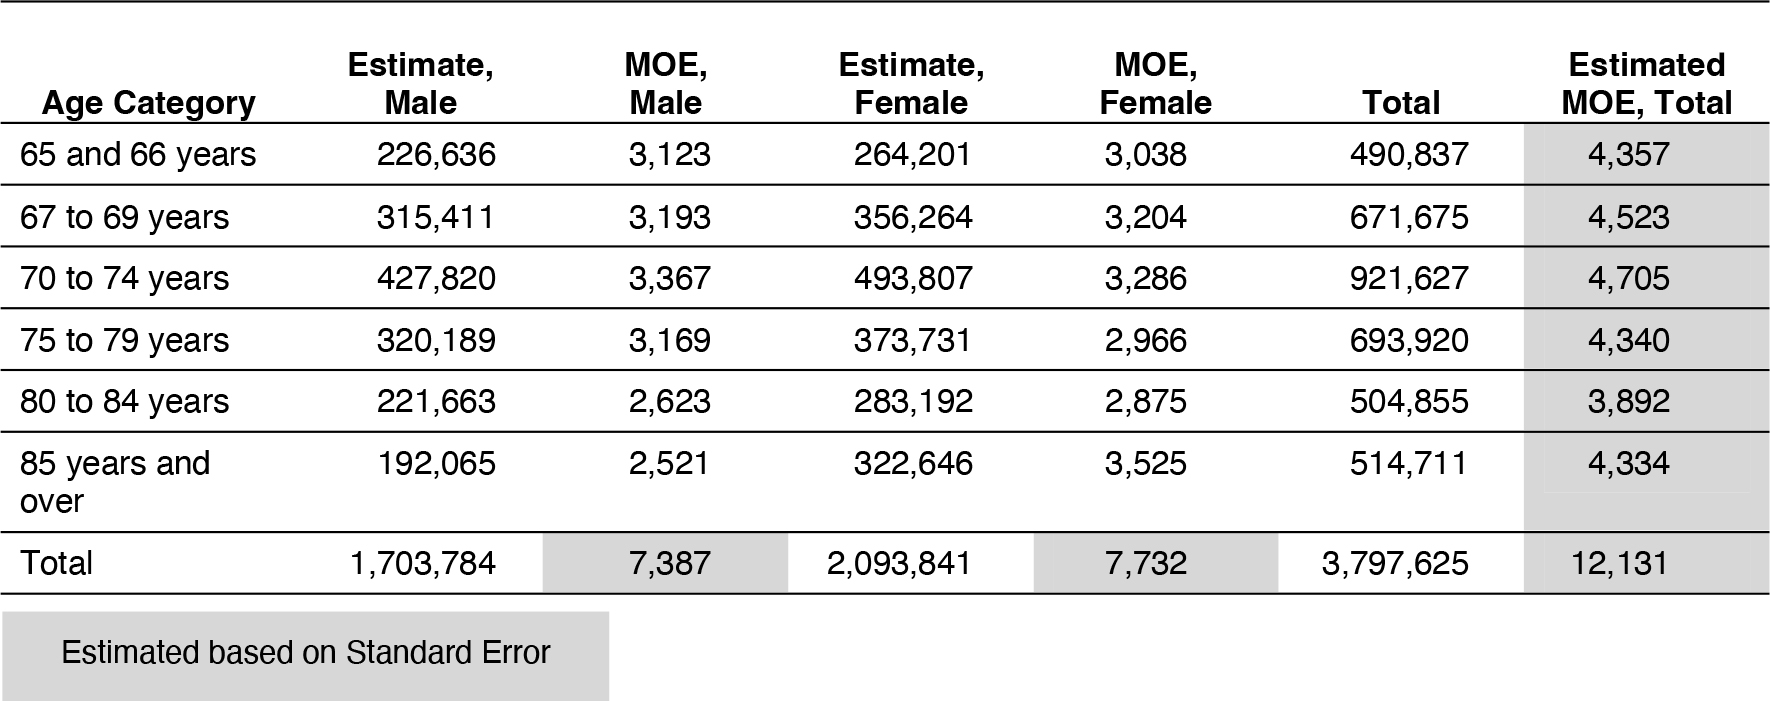
Long Description.
The table shows population estimates in Florida for people age 65 and over between 2012 and 2016. Age categories are 65 and 66 years, 67 to 69 years, 70 to 74 years, 75 to 79 years, 80 to 84 years, and 85 years and over. Each category has population estimates for males and females with margin of error for each. Total population and total margin of error are also shown. A note indicates that total margin of error for each age group and for males and females is estimated based on standard error. For ages 65 and 66 years, there are 226,636 males with margin of error 3,123 and 264,201 females with margin of error 3,038. Total is 490,837 and total margin of error is 4,357. For ages 67 to 69 years, there are 315,411 males with margin of error 3,193 and 356,264 females with margin of error 3,204. Total is 671,675 and total margin of error is 4,523. For ages 70 to 74 years, there are 427,820 males with margin of error 3,367 and 493,807 females with margin of error 3,286. Total is 921,627 and total margin of error is 4,705. For ages 75 to 79 years, there are 320,189 males with margin of error 3,169 and 373,731 females with margin of error 2,966. Total is 693,920 and total margin of error is 4,340. For ages 80 to 84 years, there are 221,663 males with margin of error 2,623 and 283,192 females with margin of error 2,875. Total is 504,855 and total margin of error is 3,892. For ages 85 years and over, there are 192,065 males with margin of error 2,521 and 322,646 females with margin of error 3,525. Total is 514,711 and total margin of error is 4,334. Total population for all categories is 1,703,784 males and 2,093,841 females. Total combined is 3,797,625. Total margin of error for males is 7,387, for females is 7,732, and for total is 12,131.
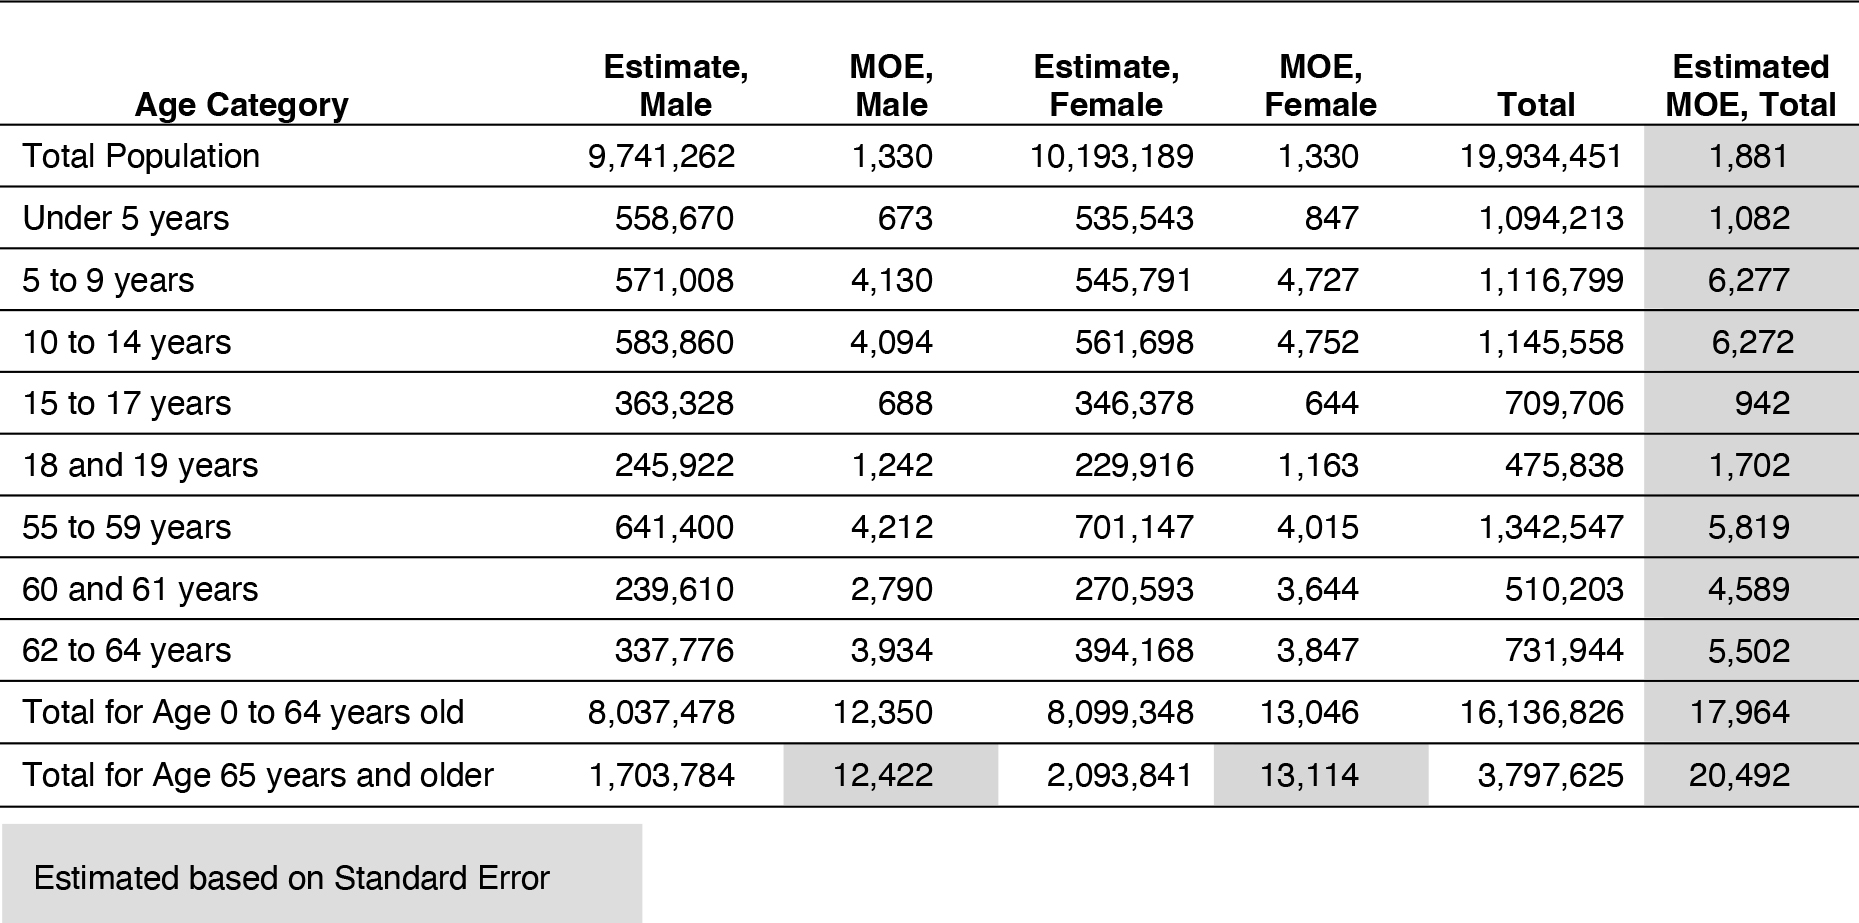
Long Description.
The table shows population estimates and margins of error for males and females in Florida across multiple age categories. Table columns are the following: estimate, male; M O E, male; estimate, female; M O E, female; total; and estimated M O E, total. Table rows are the following: Row 1: total population, Row 2: under 5 years, Row 3: 5 to 9 years, Row 4: 10 to 14 years, Row 5: 15 to 17 years, Row 6: 18 to 19 years, Row 7: 55 to 59 years, Row 8: 60 and 61 years, Row 9: 62 to 64 years, Row 10: total for age 0 to 64 years old, and Row 11: total for age 65 years and older. Row details are as follows. Row 1: 9,741,262; 1,330; 10,193,189; 1,330;19,934,451; 1,881. Row 2: 558,670; 673; 535,543; 847; 1,094,213; 1,082. Row 3: 571,008; 4,130; 545,791; 4,727; 1,116,799; 6,277. Row 4: 583,860; 4,094; 561,698; 4,752; 1,145,558; 6,272. Row 5: 363,328; 688; 346,378; 644; 709,706; 942. Row 6: 245,922; 1,242; 229,916; 1,163; 475,838; 1,702. Row 7: 641,400; 4,212; 701,147; 4,015; 1,342,547; 5,819. Row 8: 239,610; 2,790; 270,593; 3,644; 510,203; 4,589. Row 9: 337,776; 3,934; 394,168; 3,847; 731,944; 5,502. Row 10: 8,037,478; 12,350; 8,099,348; 13,046; 16,136,826; 17,964. Row 11: 1,703,784; 12,422; 2,093,841; 13,114; 3,797,625; 20,492. A note indicates that total margin of error for each age group and for males and females is estimated based on standard error.
These results indicate that as the number of categories and MOE estimates increase, so does the deviation from the published MOEs that are based on restricted microdata. This is reflected in the example above when comparing MOEs in Table 19.3, which are based on 18 estimates, to MOEs in Table 19.2, which are based on 6 estimates. It should be noted that the Census Bureau provides additional details on this topic (U.S. Census Bureau 2018a).
Figure 19.1 shows the impact of aggregating multiple estimates and how the standard error deviates from the published standard error as more estimates are aggregated.
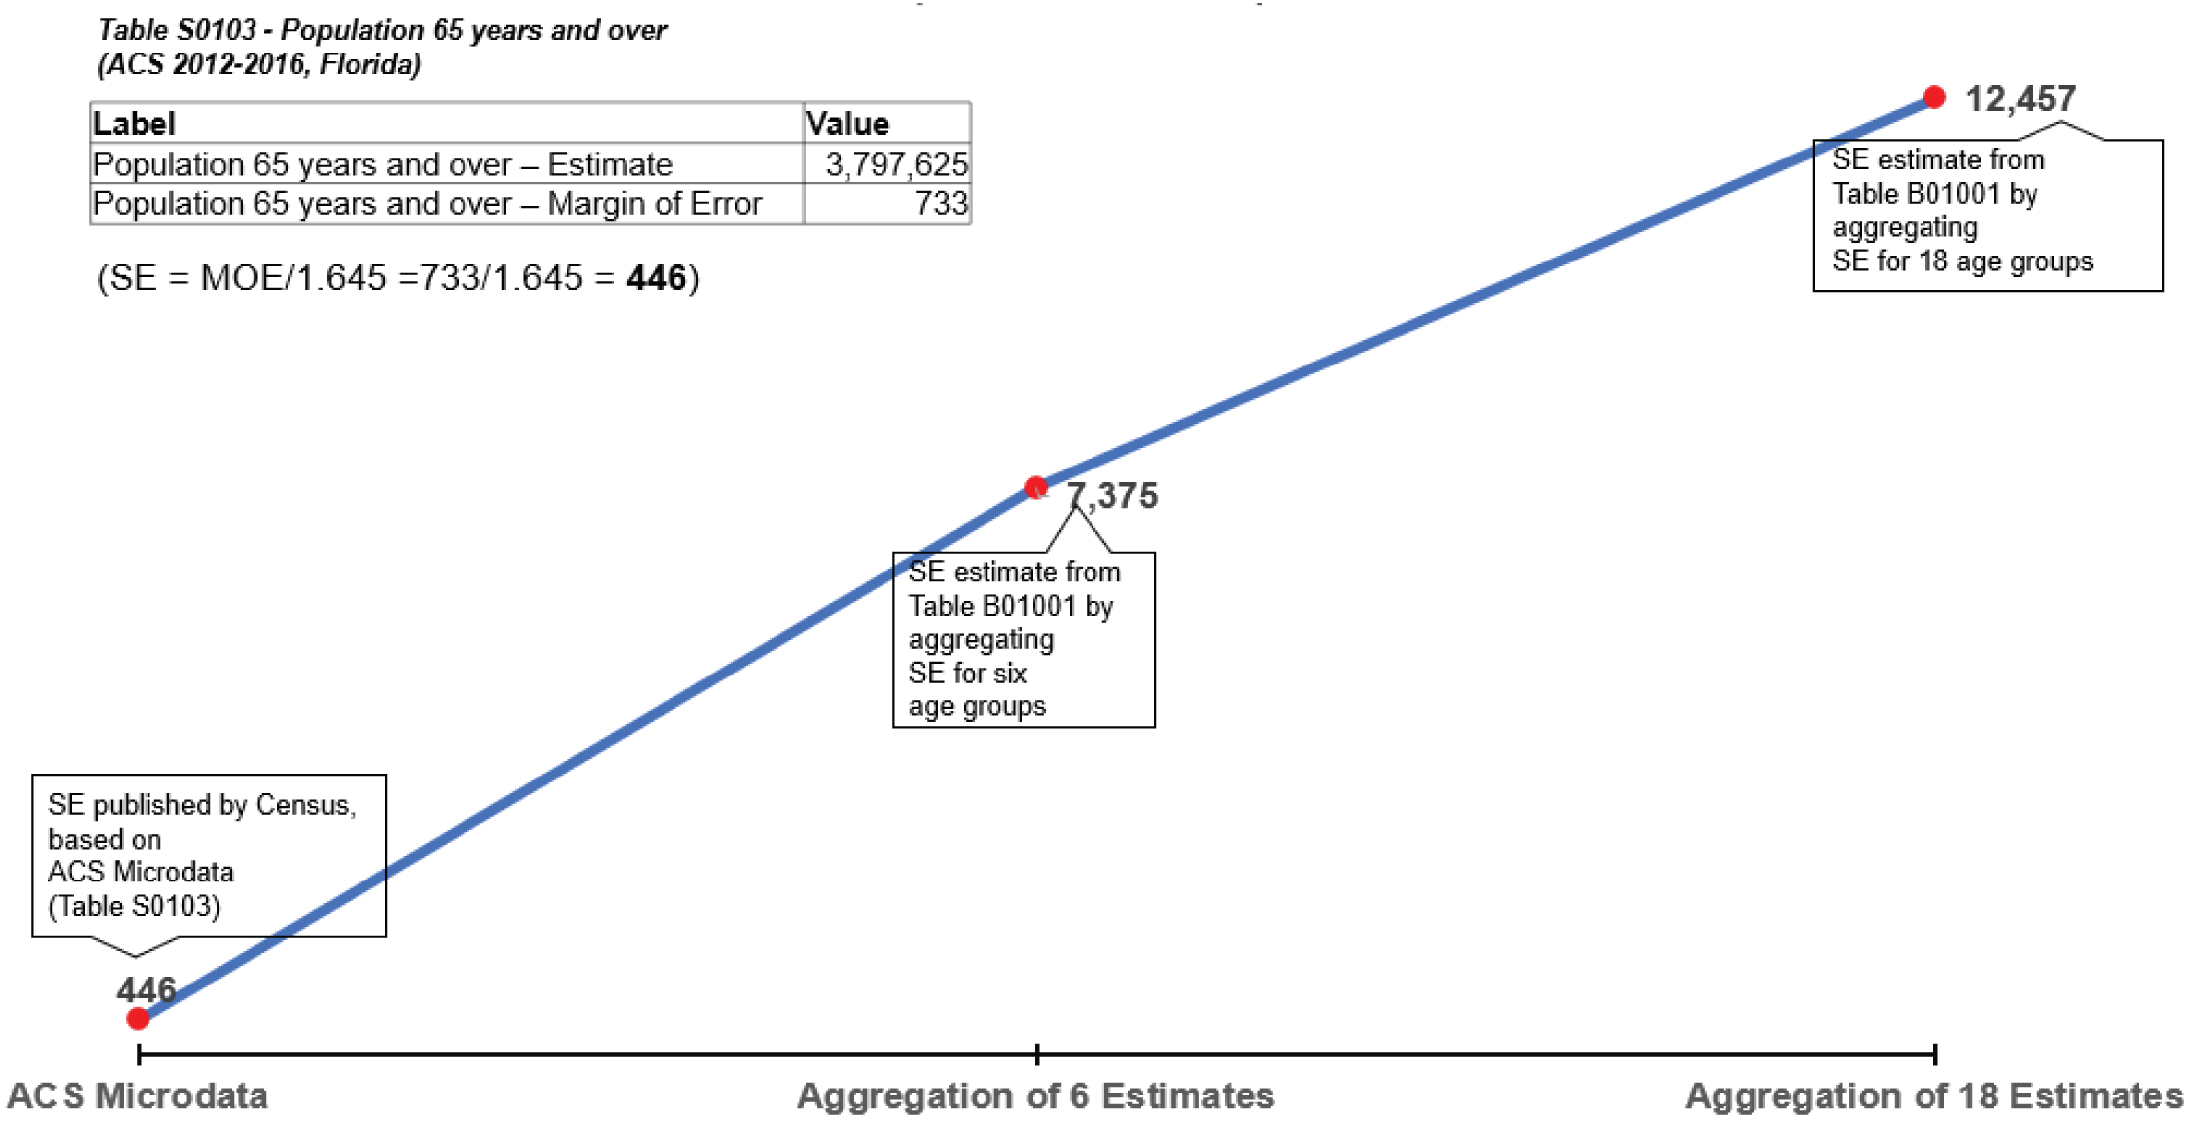
Long Description.
The chart shows standard error for the Florida population age 65 and over using three calculation methods for the years 2012 to 2016. The first point is based on ACS Microdata from Table S 0 1 0 3 and shows a standard error of 446. This is calculated from the margin of error 733 using the formula 733 divided by 1.645. The second point shows a standard error of 7,375, which is estimated by aggregating the standard error for six age groups from Table B01001. The third point shows a standard error of 12,457, which is estimated by aggregating the standard error for 18 age groups from the same table. A line connects the three dots that mark each standard error value. Labels beside the dots explain the source and method for each estimate. A small table above the chart shows the population estimate for age 65 and over as 3,797,625 and the margin of error as 733.
19.3 Using the Census Bureauʼs API
The Census Bureauʼs API lets developers create custom applications to reach new users and makes key demographic, socioeconomic, and housing statistics more accessible than ever before. The Census Bureauʼs API allows developers to design web and mobile applications that provide users quick and easy access from an ever-increasing pool of publicly available datasets and allow them to learn more about Americaʼs changing population and economy.
Developers can use the statistics available through this API to create applications that:
- Show commuting patterns for every city in America.
- Display the latest numbers on owners and renters in a neighborhood.
- Provide a local government with a range of socioeconomic statistics on its population.
The API does not include any information that could identify an individual; such information is kept strictly confidential by law. The API only uses statistics that the Census Bureau has already released publicly and in aggregate form.
The Census Bureau API is available for free via https://api.census.gov/data/key_signup.html and readers are encouraged to get a key. Accessing data via the API does not require any special tools and can be done directly via the browser (https://www.census.gov/data/developers/guidance/api-user-guide.Example_API_Queries.html#list-tab-2080675447). However, it is much better to use via a library such as the popular R library, tidycensus. tidycensus is an R package that allows users to interface with a select number of the Census Bureauʼs data APIs and return tidyverse-ready data frames, optionally with simple feature geometry included. Details about tidycensus can be found at https://walker-data.com/tidycensus/.
19.4 Training Resources
There are multiple resources for learning about census data and the Census Bureauʼs various products. Some of the main ones are listed in the following:
- ACTS: https://transportation.org/ctpp/ctpp-training/. The ACTS has a variety of training resources for independent and in-person training. The link for the training page provides access to these resources.
- Census: https://www.census.gov/data/academy.html. The Census Academy is a great free resource to learn everything about the Census.
- ACS handbooks: https://www.census.gov/programs-surveys/acs/library/handbooks.html. Each ACS downloadable PDF handbook provides specific how-to instructions and/or case studies. For an introduction to the ACS, the reader should refer to the latest version of Understanding and Using American Community Survey Data: What All Data Users Need to Know: https://www.census.gov/programs-surveys/acs/library/handbooks/general.html
- PUMS: https://www.ipums.org/support/teaching-resources. These are great resources. The IPUMS-USA will be of particular interest to practitioners since it addresses the PUMS data referenced in this report.
- LEHD: https://lehd.ces.census.gov/doc/workshop/2022/Trainings/LODES-OnTheMapTraining2022_Final_Publish.pdf. Also, “NCHRP 08-36, Task 098: Improving Employment Data for Transportation Planning” (Spear, 2011) provides a very good introduction to LEHD (available at https://onlinepubs.trb.org/onlinepubs/nchrp/docs/NCHRP08-36(98)_FR.pdf).
To prevent link rot (where links go dead or resources get moved), it is advisable to download the resources to your personal library if possible.


