Active Traffic Management Strategies: A Planning and Evaluation Guide (2024)
Chapter: Appendix C: Case Studies


TEXAS
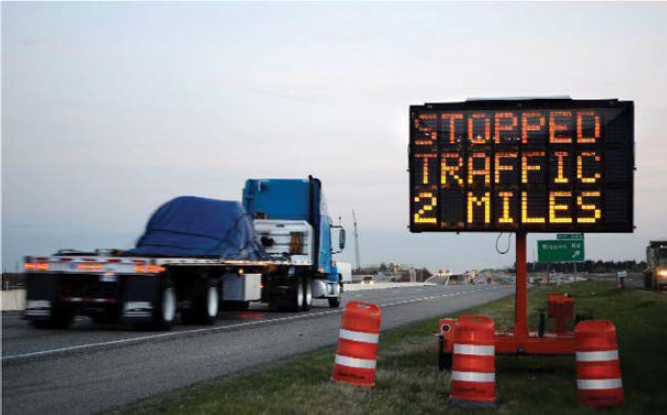
I-35 END-OF-QUEUE WARNING
Overview
Since 2010, the Texas Department of Transportation (TxDOT) has been implementing planned improvements to 200 directional miles of the Interstate 35 (I-35) corridor through the Waco District in Central Texas. Reconstruction efforts expanded the roadway from four lanes to six in rural areas and six lanes to eight in urban areas in addition to upgraded geometrics, bridges, drainage, and safety features. Over the multiyear construction timeframe, this necessitated thousands of lane closures. The work zone and resultant queues came with four main issues: (1) drivers along the rural segments of I-35 did not expect traffic queues, especially at night, (2) the dynamic nature of the closures (necessity and locations) did not allow nightly travelers to develop an expectation of queues, (3) contractors used all available right-of-way for construction activities, making it difficult to position and leave end-of-queue (EOQ) warning equipment in place until needed, and (4) the I-35 corridor is the most heavily traveled freight roadway in the state, thereby increasing the severity and risk of work zone crashes.
Deploying/Operating Agency: Texas Department of Transportation
Key Features
TxDOT developed the first application and use of end-of-queue warning systems applied on a mobile, nightly, basis to work zones across the 200 directional miles. TxDOT developed two typical plans for their EOQ deployments. Plan 1 utilized four sensors and one Portable Changeable Message Sign (PCMS). The layout had the first sensor at the lane closure taper, the next upstream sensor at a one-half-mile spacing, and the next two sensors at 1-mile-upstream spacings. The PCMS was located 1 mile in advance of the final sensor, or three and a half miles from the taper. Depending on the speeds identified by the sensors, the PCMS displays a notice of Work Zone Ahead, Slowing Traffic, or Stopped Traffic. The Slowing and Stopped Traffic messages incorporated a distance based on the sensor locations.
Plan 2 added in an additional four sensors at 1-mile spacings and an additional PCMS at seven and a half miles back from the taper. Utilizing this level of infrastructure allowed for warning traffic of both slowing and then stopped conditions, both with a distance component.
A critical component of the success of the EOQ deployments was a queuing analysis performed for each mainlane closure by hour of closure. Based on the longest anticipated queue during the entire timeframe of the lane closure, a deployment decision of no EOQ system, a Plan 1 or Plan 2 was made. If the queue analysis resulted in a queue estimation of less than 2.5 miles, Plan 1 was implemented. If the queue estimate was longer than 2.5 miles, a Plan 2 was implemented. Performing the initial queuing analysis incorporated several important data considerations, including a recent average of traffic, by hour, on representative nights of the closures, as well as updated truck percentages. This data collection was accomplished using a set of side-fire microwave sensors at various locations along the corridor. The entire process was automated and executed upon entry of a mainlane lane closure into the lane closure database for the corridor,
Another factor contributing to the success of these implementations was the significant outreach that was performed to the traveling public and specific populations such as freight, to increase awareness of the location, length, and activity within the work zones. Overall, the deployment of EOQ warning systems was a comprehensive effort involving:
- Understanding of traveler goals (limit delay due to work zones).
- Systemic and automated assessment of queuing potential based on location, direction, volume, day of week, time of day, and type of activity.
- Automated recommendations for deployments in multiple arrangements for different queuing lengths.
- Development of new statewide specification and procurement procedures.
- Development of new traveler information outreach.
- Integration of multiple commercial vendors into the EOQ system.
- After-action analysis for all work zones to verify projected vs. actual queues.
- In-field development and refinement of equipment placement procedures.
- Use of resultant queuing and extent data applied to similar projects and closures.
- In-depth safety analysis across multiple years of deployment to quantify safety results.
- Stepping stone for trailing additional work zone innovations such as dynamic late merge.
Operating Highlights
- More than 500 deployments. This was the first application nationwide of mobile, nightly deployments.
- Developed specifications for TxDOT, which were used for bidding and subsequently copied by at least eight other states.
Unique Challenges Addressed
The I-35 work efforts developed an entirely new application of traditional, static, EOQ systems. The comprehensive effort addressed
- Requirements and specifications,
- System layout and operation,
- Testing plan,
- Operations and maintenance plan,
- Training plan,
- Security plan,
- Outreach plan, and
- Evaluation plan.
Outcomes and Results
As detailed in the FHWA Work Zone clearinghouse, queue warning systems have been shown to reduce crashes that typically occur when queues are present by 55 percent. More importantly, the majority of the crashes that are avoided would likely have involved injuries or fatalities.
Lessons Learned
- Efficacy of system degrades when equipment not deployed in time.
- Equipment malfunctions can affect reporting and accuracy.
- Traffic Control Plan (TCP) subcontractors had to be trained on system deployment and use.
Future Steps
As a result of this innovation in the construction process, EOQ systems are being implemented across the state to mitigate work zone hazards and improve safety.
MICHIGAN
US-23 FLEX ROUTE
Overview
US-23 is the first implementation of Active Traffic Management on technologies on highways in Michigan. The Flex Route system was piloted on a nine-mile segment of US-23 north of Ann Arbor. This corridor is prone to bottlenecks during peak-travel periods, and the proximity to the University of Michigan campus means heavy congestion during off-peak times for special event traffic.
Michigan DOT (MDOT) was already actively using technology and incident response patrols to help address mobility and safety on US-23. A long-term solution was needed, and MDOT estimated it would have cost more than $185M to widen this corridor. ATM technologies were implemented to help MDOT dynamically manage changing congestion, address safety issues and improve incident response times on this corridor. Based on the success of piloting ATM on US-23, MDOT is extending the Flex Route on US-23 and implementing Flex Route strategies on other corridors, including I-96.
Deploying/Operating Agency: Michigan Department of Transportation
Partner Agencies: Michigan State Police, metropolitan planning organization
Key Features
ATM strategies deployed on US-23 include
- Hard-shoulder running,
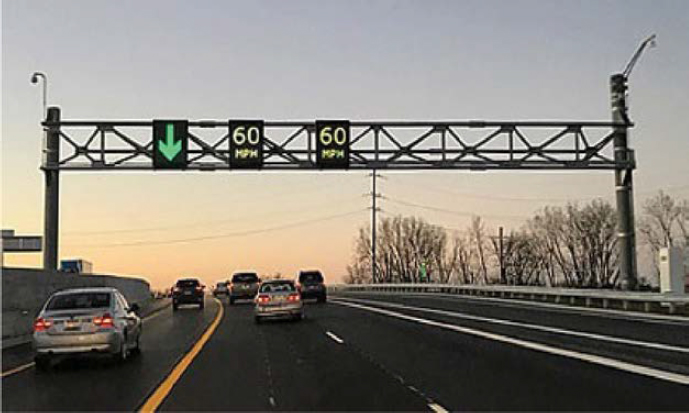
- Dynamic lane control systems,
- Advisory variable speed limits, and
- Queue warning system.
Additional features include the following:
- Explored several potential alternatives to address recurring and nonrecurring congestion on US 23as part of a 2014 Environmental Assessment process, among them ATM.
- Conducted detailed modeling to analyze ATM strategies and potential impacts.
- Performed a detailed risk assessment and analysis for different software modules to promote interoperability with MDOT’s Advanced Traffic Management System software.
Operating Highlights
- Developed new operating procedures and Quick Reference Guides for operators to help make decisions under different conditions. The Flex Route system sends an alert when certain congestion thresholds are met to indicate if the system should be activated outside of the scheduled peak hour operations.
- Speeds for the VSL are calculated using real-time speeds. When the dynamic shoulder is opened, the VSL automatically runs with an initial post of 60 miles per hour; speeds reduce by increments of 10 miles per hour based on actual conditions. When VSL is active, the queue warning system also is activated.
- Integrated other multimodal and safety innovations into the US-23 Flex Route, including emergency pull-off sites, park and ride facility and truck parking ITS.
Unique Challenges Addressed
- Institutional coordination (Chapter 3) is essential for a successful ATM. MDOT partnered with MSP for enforcement and safety considerations, particularly for VSL and flex shoulders. MDOT integrated safety pull-out areas to support incident management and minimize impacts of incidents on the travel lanes. MDOT also partnered with the MPO to use travel demand forecast data to model and analyze different ATM strategies to build consensus and determine high priority ATM applications for this corridor.
- Several design issues were addressed, including adding ramp extensions at five interchanges and improving ramp terminals. MDOT also reconstructed three interchanges and three bridges. The bridge improvements raised under clearance to mitigate high-load hits. MDOT was able to address key safety features while designing and implementing ATM on US-23 (Chapter 7).
- MDOT provided an additional flex lane in active work zones to help manage traffic during reconstruction of the road and implementation of the technology infrastructure (Chapter 8).
- MDOT Established unique branding for the Flex Route and implemented a comprehensive outreach and awareness strategy. MDOT spent over a year presenting information about Flex Route to travelers and government agencies to promote awareness. Outreach also included media events, social media, and print advertising (Chapter 9).
- MDOT integrated several features to support maintenance once US-23 was implemented. MDOT incorporated remote access and a rebooting mechanism in each gantry cabinet to improve maintenance response times and efficiencies (Chapter 9).

- MDOT developed unique training for the Flex Route Operators and also developed Quick Reference Guides to help support operators making decisions in different operating scenarios (Chapter 9).
Outcomes and Results
- Improved system reliability during peak hours by 56 percent (SB lanes) during the morning commute, and 27 percent on the NB lanes in the afternoon.
- Reduced primary and secondary crashes by more than 50 percent in the first month of operation. For two years following initial implementation, crashes have reduced a total of 4.5 percent in both directions, with more pronounced crash reduction in the southbound lanes.
- Improved corridor speeds from 43 mph to 62 mph southbound in the morning, and from 48 mph to 54 mph northbound during the afternoon/evening commute.
- Nearly 70% of travelers responded that they were satisfied or very satisfied with their experience driving on the US-23 Flex Route, and more than 50% of survey respondents noted that they perceived improved safety when there was an incident and the flex lane was open, and over 80% indicated the flex lane made it easier for them to navigate around the incident.
Lessons Learned
- Multiple operating systems require careful attention to the logic for software configuration, particularly when systems are supplied by multiple vendors. Software needs to share data across multiple systems in real-time, and compatibility to support this data sharing needs to be built into the logic and functions.
- Outreach campaign helped to educate travelers in advance of the Flex Route going live. Officials including the Michigan Governor and MDOT director were part of the grand opening to show support.
Future Steps
- Based on the success of US-23, MDOT is expanding the Flex Route as part of a Phase 2 of the US-23 project and is implementing a similar ATM system on I-96 in Oakland County.
CALIFORNIA
DYNAMIC LANE ARTERIAL ASSIGNMENT
Overview
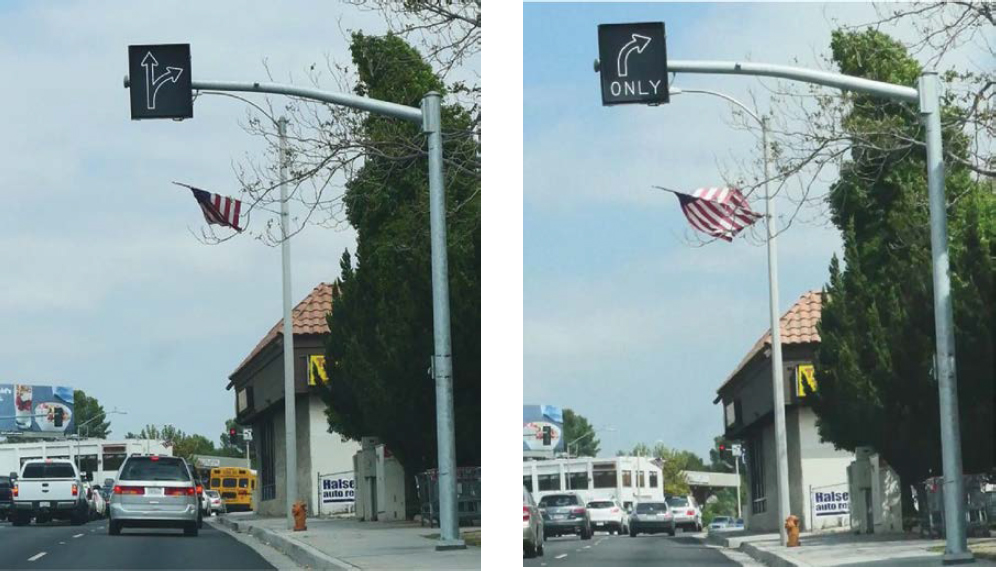
In 2017, the City of Santa Clarita, California, deployed a dynamic lane on Soledad Canyon Road approaching Sierra Highway. The deployment addresses queuing concerns along eastbound on Soledad Canyon Road by transforming an exclusive right-turn only lane to a through/right-turn lane to create flexible operations that adapt to the demands of the intersection. During other hours of the day, when heavy right turns occur, the exclusive right-turn movement is preserved.
Deploying/Operating Agency: City of Santa Clarita
Key Features
Key features involved in installing and supporting the deployment of the Soledad Canyon dynamic lane include the following:
- Fiber-optic communication.
- Dynamic lane assignment (facilitated through dynamic signage).
- Assessment of queuing potential based on the time of day to understand project benefits.
Operating Highlights
Several operational characteristics make this an important deployment for the City of Santa Clarita, and in the context of arterial ATM deployments:
- Lane has been deployed for over 5 years.
- Lane changes from right-turn only to through-right during the evening peak period.
- The controller activates the lane automatically through a time of day setting during the evening peak period; evening peak was determined through examining ADTs to see what time of day would necessitate the through-right movement.
- Initially, the City had considered installing a CCTV camera pointed at the signs to examine its operations and condition, but the City’s preventive maintenance field visits have been working. The system has been operating as intended, so it plans to continue this approach.
Unique Challenges Addressed
The City of Santa Clarita has been a pioneer of ITS technologies. Its challenges are unique in that it is a residential community with some industry while constrained by mountains and two major Caltrans facilities: I-5 and SR-14. Not only does it face commuter congestion, but it experiences cut-through traffic during peak hours or when incidents arise on SR-14 and I-5. It is also susceptible to wildfire fires due to its proximity to open space. These familiar, but unique challenges, have encouraged the City to expand its approaches beyond traditional traffic engineering, relying heavily on technology to optimize its existing roadway capacity. Dynamic lanes, detection systems, and a robust network fiber-optic and CCTV network are some of the many examples of the City’s investment in its traffic network.
Unique challenges addressed under this project include the following:
- Heavy through/right-turn movements in the eastbound PM period; however, throughout the day, the lane is needed for right-turn movements.
- Better management of cut-through regional traffic on local arterials.
- Changing demands of the roadway throughout the day.
Outcomes and Results
The City successfully documented the before-and-after conditions of this project area. The following results came from the project efforts:
- Interagency coordination among the different departments.
- Data collection before and after the project promoted demonstrated benefits.
- City configured a new video detection zone, which could separate the through and right-turn movements by lane. Originally, its video detection system did not have this capability, but it worked with the vendor to create this functionality. The City compared the before movements (also taken from the video detection cameras) to the movements after
- implementation during the evening peak hour. The results of the study demonstrated approximately 6.9% of increased vehicular throughput daily.
- Community outreach and education on the new installation to inform the public prior to deployment.
- Project demonstrated a reduction in average vehicle approach delay of approximately 2.4 seconds per vehicle in the eastbound direction during the PM peak hour.
Lessons Learned
There were several lessons learned from the project:
- Project reenforced the importance of the City’s commitment to engaging maintenance and traffic operations staff on design decisions; this practice promotes shared institutional knowledge and lessons learned across departments.
- Technology enhancements can increase vehicular throughput without adding capacity and there might be an opportunity to expand treatments similar to this as the community and traffic continues to increase.
- Before-and-after data are valuable in making a case and demonstrating the benefits of a project.
Future Steps
As the dynamic lane continues to operate there are future considerations for the City:
- Continue collecting performance metrics for corridor assessment.
- Modify traffic signal timing as travel patterns and demands change.
- Apply dynamic lane projects to corridors with similar challenges and opportunities to benefit.
OHIO
I-670 SMART LANE
Overview
The Ohio Department of Transportation (Ohio DOT) needed solutions to address congestion issues on I-670 in Columbus, particularly during the afternoon peak. As part of a statewide Active Transportation and Demand Management Study completed as part of the agency’s new TSMO program, ATM strategies were identified to address recurring bottlenecks and delays on a 4.5-mile segment of I-670. Ohio DOT was already embarking on a reconstruction of the I-270/I-670 interchange near downtown Columbus and was able to integrate a flexible shoulder to support the increased demand during afternoon commutes.
Since implementing the Smart Lane system and technologies on I-670, travel times are more reliable, crashes have been reduced, and speeds are consistently free-flow.
Deploying/Operating Agency: Ohio DOT
Partner Agencies: Ohio State Patrol, Columbus Ohio Police
Key Features
The I-670 Smart Lane includes several ATM strategies, including
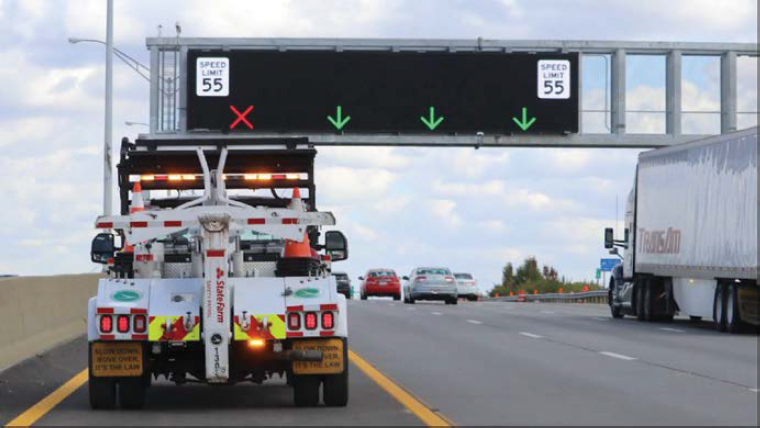
- Flexible shoulder operations to expand capacity when needed,
- Variable speed limits,
- New dynamic message signs,
- CCTV cameras with analytics, and
- Radar speed detection.
Ohio DOT developed a TSMO Plan, and ATM systems and technologies were included among the early action implementation recommendations. This provided a foundation for Ohio DOT to explore ATM implementation. As part of the new TSMO program, Ohio DOT prepared a TSMO Guidebook to support districts in identifying potential strategies to address needs on specific corridors. Several
countermeasures, including a wide range of ATM strategies, are provided to assist District engineering staff in examining the full range of candidate technologies and operating strategies.
Operating Highlights
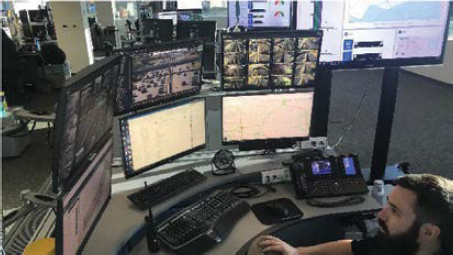
With new operating strategies and new technologies, Ohio DOT also developed new positions at the Traffic Management Center (TMC) to address ATM operating needs. The ATM components are operated by a newly created TMC Specialist. These Specialists are in charge of ATM operations and have decision-making authority to open the shoulder when conditions warrant. Ohio DOT staffs its TMC with four levels of operations staff who will contact the Specialist after hours. New operations procedures and training materials were developed so that all operations staff are familiar with the systems and can initiate ATM messages prior to the Specialist getting involved. Specialists can operate the ATM remotely for after-hours needs (such as incidents).
Ohio DOT’s processes included a sweep of the corridor by the Freeway Service Patrol and other Ohio DOT staff to be sure there are no vehicles blocking the shoulder prior to the shoulder being opened for traffic.
Unique Challenges Addressed
The I-670 Smart Lane was the first ATM implementation and the first major system deployed since the DOT developed its TSMO Plan. There are unique sight distance issues with a curve on this segment of I-670 that initially posed some challenges to raising the VSLs above 45 miles per hour when the shoulder was active. Ohio DOT was able to address this issue, and developed procedures where the ATM specialist can adjust the displayed speeds if queues build upstream of the curve. The additional camera coverage installed as part of the project supports enhanced real-time monitoring from the TMC.
The ATM system was a cost-effective addition to an existing capital project to reconstruct the I-270/I-670 interchange. The interchange improvements alone would not have addressed the recurring congestion issues, and the flexibility of the shoulder lane allows Ohio DOT to implement shoulder operations for both recurring and nonrecurring issues.
Law enforcement was actively involved in the concept development, particularly for the VSL and shoulder operations. Because the median shoulder serves as the flexible lane, Ohio DOT agreed to keep the right lane clear to allow for enforcement activities.
Ohio DOT had an extensive outreach campaign to prepare drivers for the new Smart Lane technologies and shoulder operations. Initially there was negative feedback from the public, largely through social media. After the Smart Lane was open, feedback was overwhelmingly positive and travelers noted the improvements to their commute times.
Outcomes and Results
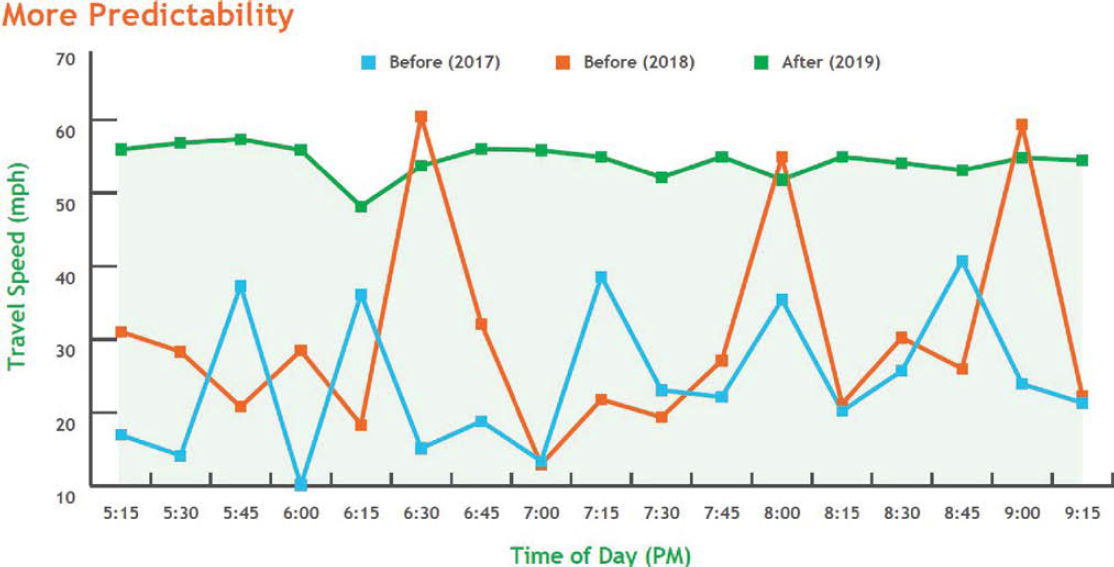
Ohio DOT has analyzed performance data for the Smart Lane operations, examining speeds, travel times and reliability and crashes. The figure below shows the dramatic improvement in travel speeds on I-670 since the Smart Lane was implemented; travel speeds are consistently free flow compared to unpredictable speeds prior to ATM operations.
The I-670 Smart Lane has also reduced crashes, which has reduced the workload for the Freeway Service Patrol tow trucks. These trucks support a sweep of the corridor in advance of opening the shoulder to mainline traffic.
Lessons Learned
- Ohio DOT continues to refine operating processes to improve ATM operations within the corridor. The trained TMC Specialists will frequently open the shoulder before congestion builds to mitigate any bottlenecks and promote free-flow travel speeds throughout the afternoon peak.
- The sensor data and analytics are a helpful tool, but trained operations staff can visually see when traffic is on the verge of becoming congested, and they can begin implementing operational changes accordingly.
Future Steps
Based on the success of the I-670 Smart Lane, Ohio DOT is implementing similar ATM strategies on I-275 near Cincinnati and is proposing a Smart Lane on I-71, also in Columbus.
NEVADA
PROJECT NEON, I-15
Overview
Project Neon in Las Vegas includes an Active Traffic Management (ATM) System deployed along I-15 and is bordered by the “Spaghetti Bowl” interchange to the north and Sahara Avenue to the south. The “Spaghetti Bowl” is an informal name used to define the interchanges of I-15, I-515, US-93, and US-95. The Nevada Department of Transportation (NDOT) opted to integrate ATM as part of a large reconstruction and widening of I-15 through the heart of the Las Vegas Strip.
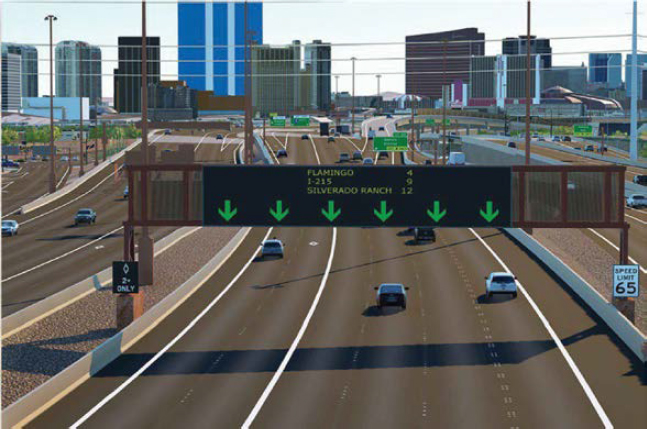
The I-15 ATM project includes 12 gantries, which span across all lanes of travel, and are spaced approximately mile in distance to maintain sight visibility and alert drivers. I-15 is faced with many of the recurring congestion issues that other major cities across America experience daily, in addition to frequent large-scale events throughout the year, which makes Las Vegas traffic challenges unique and unpredictable. The ATM system lends itself to being adaptable to these conditions and provides many operational and safety benefits for the public.
Deploying/Operating Agency: Nevada Department of Transportation, Regional Transportation Commission (RTC) of Southern Nevada
Key Features
Key features of the Project Neon ATM system include the following:
- Forty-two full-color matrix signs which can be used for multiple applications.
- Signs can identify operational lanes, closed lanes, and merge lanes.
- Signs can share speed limits and messages, which include reduced speed limits and road closures.
- Flow detectors (traffic monitoring).
- CCTV camera coverage.
- Expansion of 20-mile High-Occupancy Vehicle (HOV) network.
- Extensive roadway, drainage, ramp, and bridge work.
Operating Highlights
Several operational characteristics make this an important project for the State of Nevada. The ATM is built on a strong foundation of the FAST Freeway Management System. The RTC operates both the freeway and arterial management systems from the FAST Traffic Management Center (TMC), which helps to support coordinating operations. Additional highlights include:
- Dynamic lane assignment through dynamic signage along the corridor
- Variable speed limits to adjust to changing demands of traffic
- Electronic messages to alert the public of hazards or reduced speeds ahead
- The development of standard operating procedures for non-automated functions of the I-15 ATM (High-Occupancy Vehicle Lane open and lane control signals)
- Agency partnerships to manage operations include Nevada Highway Patrol (NHP), which is also colocated at the FAST TMC, NDOT, and RTC Southern Nevada
Unique Challenges Addressed
The travel patterns and challenges in Las Vegas are unique. The City’s 24-hour operation creates abnormal shift hours and peak periods. Unlike in other major cities, where the peak period is often two to three hours in the morning and two to four hours in the evening, and sometimes a small portion of the midday, Las Vegas sees an uptick in travel during the end and beginning of 8-hour shifts throughout the entire day; given the number of employees at the mega-resorts on the Strip, the shift schedule is a key factor in local traffic patterns.
Las Vegas’ tourism industry adds in another factor including travelers unfamiliar with the area that are navigating the “Spaghetti Bowl.” This convergence of major roadways can lead to additional confusion for visitors of the area. These factors create a need for clear signage, accurate travel time information, and warnings of hazards ahead. NDOT and FAST noted that the agencies did an extensive outreach campaign on the new ATM technologies, and residents who navigate this stretch of I-15 are familiar with the route, but reaching the tourists and new travelers with outreach on the system is a key challenge.
Outcomes and Results
NDOT and RTC launched the I-15 ATM in March 2020, just as travel patterns and tourism levels were disrupted by the pandemic. This resulted in limited and inconsistent data shortly after commencing operations but also provided NDOT and RTC with an opportunity to fine-tune system operations. While limited in available data, NDOT and the RTC set forth the following goals and objectives, which are ultimately the guiding principles to measure Project Neon’s success:
Goal 1: Safety - Objectives
- Reduce crashes.
- Reduce incident duration.
- Support work zone management.
Goal 2: Reliability - Objectives
- Improve throughput.
- Reduce congestion.
- Improve travel time.
- Improve traveler information.
Some available metrics include that daily traffic counts are about 300,000 vehicles, which includes approximately 25,000 lane changes per hour. The area also experiences an average of 3 crashes daily. These metrics provide a baseline to measure the system’s effectiveness and impact on the Las Vegas community.
The RTC issued a survey to the public during the first year of the I-15 ATM operations to understand the public’s perception and awareness of the technologies, the messages being displayed, and to gauge overall trust and acceptance of the new system. Results showed that the public was confident in their abilities to understand guidance provided by the new signs and technology and were confident in the information being provided.
Additionally, the FAST TMC’s involvement in the daily monitoring and operations of the system provides them with firsthand knowledge of the ATM system’s successes and challenges. Overall, the FAST staff have noticed benefits in:
- Improved trip reliability
- Reduced travel time and more consistent travel time through the corridor
- Increased safety
The Project Team will continue to monitor and adjust operations to meet the system’s needs. Engagement of partners continues to one of the best ways to receive feedback. Local media outlets are an integral part of providing information to the public, while promoting outreach and awareness.
Lessons Learned
NDOT and RTC participated in several peer exchanges with other ATM deployers during the planning and design stages, and feedback from agencies such as Minnesota DOT provided important insights that NDOT was able to incorporate into the I-15 ATM, such as providing maintenance and right-of-way access to the field equipment.
A project of this size involves several agency partners and contractors, particularly with the magnitude of the overall design-build for the I-15 reconstruction. In total the involved 717 companies, including subcontractors and vendors. The complexity of this project emphasized the following lessons to be carried over to future endeavors:
- Project emphasized the need for organization to track the progress of an effort of this size.
- Communication is critical to keeping over 700 entities on the same page and to deliver the project successfully.
Ongoing coordination with Law Enforcement, particularly NHP, is a key element to the sustaining operations and expansion of the I-15 ATM. Not only was NHP actively involved in the concept of operations, but also provided some important feedback about enforcement needs on the corridor. NDOT implemented several public safety pull-out areas to allow law enforcement to safely conduct stops and investigations out of the travel lanes.
Future Steps
NDOT and RTC are examining applicability to corridors in Southern Nevada. The RTC and NDOT successfully secured a federal grant through the Advanced Transportation Congestion Management and Technology Deployment (ATCMTD) program, which will expand ATM technologies an additional five miles on US-95, between I-15 and Summerlin Parkway. The ATM is being expanded.
Las Vegas is the most visited city in the state, but other challenges can be addressed with this type of ATM improvement. Considerations for the future include expanding applicability to the following conditions on corridors throughout the state:
- Snow and ice-prone areas.
- Freight corridors.
- Other high-volume and special event corridors (in Las Vegas and other tourism hubs across the State).
NDOT is currently completing a Statewide ITS and ATM Master Plan, which identifies corridors and different types of ATM technologies can address unique operating needs.
OREGON
ATM ON OR217
Overview
The Oregon DOT has numerous ATM solutions in operation, being planned, in design, or in construction throughout the state. All five regions in the state will have at least one ATM deployment in the future. As a result, five different TOCs are responsible for monitoring and operating some aspect of ATM. ATM in Portland includes the following:
- Ramp metering is deployed in the area that leverages loops and radar sensors.
- These systems leverage a fiber network that includes Oregon DOT fiber or access to fiber through agreements with local agencies.
- In Portland, six ATM projects have been implemented since 2013. These deployments assist in providing queue warnings and weather warnings.
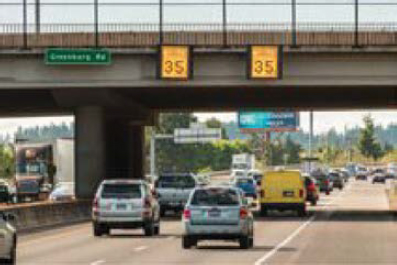
- Variable Speed Limits (VSL) are advisory; Oregon’s is the same across all lanes on the gantry, not different speeds for individual lanes.
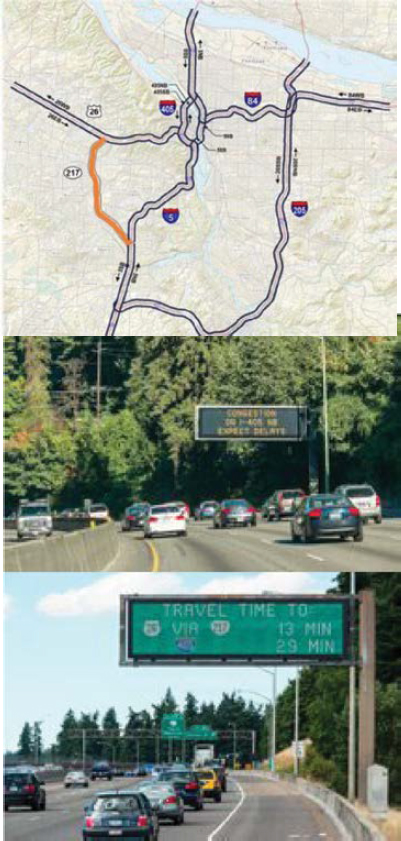
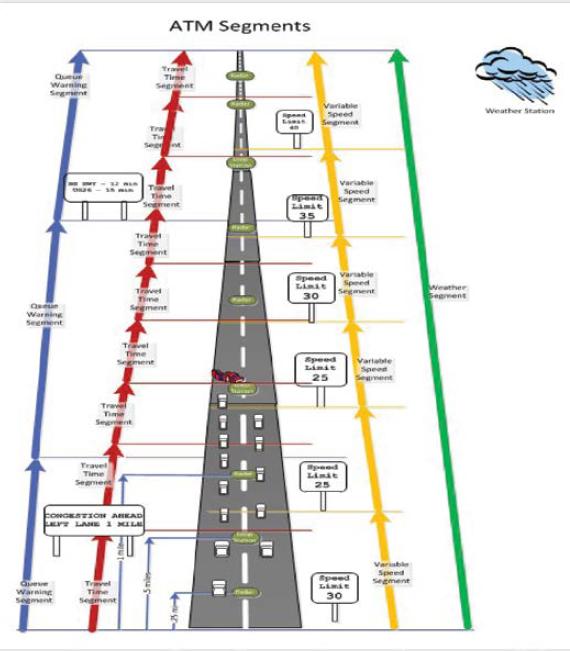
The ATM pilot on OR217 was constructed in 2013 along a 7.5-mile stretch of the freeway connecting I-5 and US-26. This highly congested facility has 2 to 3 lanes in each direction and has an ADT of 122,000. The facility has limited right-of-way for future expansion. The ATM elements in operation include
- Fiber network,
- Twenty-eight variable advisory speed signs,
- Six mainline dynamic message signs,
- Six arterial dynamic message signs, • Four RWIS,
- Five radar traffic sensors,
- Twelve Bluetooth travel time sensors,
- Twenty mainline dual-loop stations, and
- Curve warning systems on loop ramps.
Deploying/Operating Agency: Oregon Department of Transportation
Key Features
Key features of the OR217 system include:
- Variable advisory speeds (note: speed limits are the same across all lanes).
- Queue and weather warning.
- Curve warning at loop ramps—especially at high crash ramps and freeway-to-freeway ramps.
- Adaptive ramp metering.
- Travel-time information.
Different segment lengths are used for different systems with different systems having different priorities. Travel times are the lowest priority.
Operating Highlights
The OR217 deployment adheres to the overall ATM statewide goals and system features established by the department. The intent is to have a single statewide solution from a user standpoint that applies to both urban and rural areas of the state. They are noted below:
Oregon ATM Statewide Goals
- Consistency.
- Accuracy.
- Timeliness.
- Minimize burden on transportation operations center operator.
- One statewide solution that can serve both urban and rural applications and includes VSL, queue warnings, weather alerts, and travel time information.
- Provide info about speed reductions.
Oregon ATM System Features
- Automation.
- Error Checking.
- Configurable/Site Specific Tuning.
- Limited Operator Override.
- Message Queue Manager.
Unique Challenges Addressed
Oregon DOT recognizes that when utilizing DMSs for information communication, it is likely that the agency will switch from presenting travel times to communicating congestion on routes that serve as alternates to each other. Oregon DOT anticipates that they can address load balancing by curating messages appropriately.
With respect to messages for inclement weather that may be oncoming soon, ODOT notes that does not get massive, unexpected weather events like other areas. The area receives frequent/consistent rain. Oregon DOT will implement advanced warnings for weather conditions. Most issues are friction sensing, pavement temperature, etc., and the warning indicators are automated. Oregon DOT is looking at integrating a weather prediction system (Pikalert) to provide forecasting, though that information will not be posted on a DMS for liability reasons.
Outcomes and Results
In 2017, Oregon DOT conducted an evaluation, however, the evaluation was limited in scope as noted below:
- Evaluation primarily focused on congestion versus weather system activation data.
- The evaluation did not provide the type of data Oregon DOT would like to examine for ATM (travel time reliability, incident response, etc.).
- At the time of the evaluation, there was only 1 year of post-implementation crash data available.
- The evaluation provided a good indication of results but did not show a longer trend.
- Oregon is a self-reporting state; they rely on drivers to submit crash reports and wait for data to work through the process and then get released; takes a long time for crash data to be fully released.
The evaluation showed that 89% of speed reductions were due to congestion and 11% were due to weather. Most of the weather-related speed reductions occurred in off-peak hours. There was better compliance with weather speeds compared to congestion speeds. When the speed was lowered to 35 mph, there was an 8.5% delta during congestion messages compared to a 1.5% delta for weather events. In general, motorists paid more attention to the messages during adverse weather than typical congestion. The evaluation showed a 11% overall reduction of crashes in the corridor but only compared 2013 to 2015 data. Prior to the deployment, there was a trend of increasing crashes for the prior five years as volumes increased. ATM reversed the trend of upward crashes.
Lessons Learned
The ATM Atlas is not a living document, so it is not updated that frequently. Parts of it are living though (e.g., Performance Report, Corridor Bottleneck Study are updated frequently and will inform any ATM planning). Costs are re-aligned at the scoping level to update costs.
Future Steps
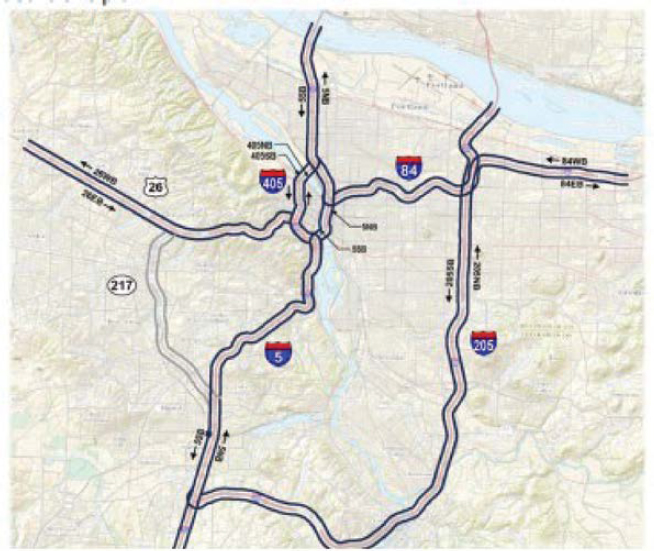
In 2016, Oregon DOT developed an ATM Atlas that the agency uses to prioritize improvements and plan for funding. The Atlas provides insights on potential ATM strategies/tools to address specific issues. The Atlas includes recommendations on the following corridors:
- I-5 from south of WilsonvilleHubbard Highway to the Columbia River;
- I-84 from I-5 through Troutdale;
- I-205 along the entire freeway corridor in the region;
- I-405 along the entire freeway corridor in the region;
- US-26 from I-405 through North Plains; and
- I-5, I-84, I-205, I-405 and Route 26.
OR-217 was already built out when the Atlas was developed.
The Atlas includes proposed infrastructure locations for ATM deployments and identifies segments of priority. Other details include the following:
- Assessment of Overall Safety and Reliability of the Segment.
- ATM Implementation and Benefits.
- Phasing of projects.
- Proposed ATM Improvements.
- Expected Safety Benefits.
- Benefit/Cost Ratio.
- Anticipated Costs (Planning Level).
- Other information.
It is noted that the planning-level costs are low compared to actual design/construction, but the document has been very helpful and useful to help with program continuity, planning, etc. An additional segment is in design on I-5. The project will be completed by 2027 to complete this segment. Two more projects (three project areas) are under consideration in the draft 2024–2027 STIP. Additionally, ODOT is examining lane management strategies and has recently started incorporating RITIS data into their systems and is looking at utilizing RITIS in lieu of agency detectors. RITIS data is being used to fill in gaps on segments and used in areas that are under construction where detectors are out of commission.
Appendix C Bibliography
Hsieh, E., G. Ullman, G. Pesti, and R. Brydia. (2017). “Effectiveness of End-of-Queue Warning Systems and Portable Rumble Strips on Lane Closure Crashes.” Journal of Transportation Engineering, Part A: Systems, Vol. 143(11). https://doi.org/10.1061/JTEPBS.0000084.


