Review of the Long-Term Operations of the Central Valley Project and the State Water Project (2026)
Chapter: Appendix A: Northern California Climate, Hydrology, and Geology
Appendix A
Northern California Climate, Hydrology, and Geology
This appendix provides background information on the natural system that supports the Central Valley Project (CVP) and the State Water Project (SWP). It begins with information on the hydrology and climate of Northern and Central California,1 considering past, current, and projected near-future conditions. It also describes the underlying geography of the region, changes in land use over time, and changes in the ecology of the Delta region over the past 150 years. The intent is for all of the appendixes to support this report and subsequent reviews from the National Academies of Sciences, Engineering, and Medicine, with updates and modifications being made for each subsequent review as appropriate given the specific tasks.
INTRODUCTION
Northern California’s highly varied physical geography includes coastal and inland marshes; large floodplains; high and low mountain ranges, some with coldwater springs; and large and small basins drained by a network of rivers. Its climate, with long dry summers and wetter winters, evolved about 15 million years ago (Millar, 2012). Together, this climate and the underlying geology have shaped the physical habitat in which California’s ecosystems evolved over millions of years. Prior to human development, one of the most prominent features were the extensive seasonal and permanent wetlands, especially on the vast floodplains of California’s Central Valley and in the Sacramento-San Joaquin Delta.
Climate has always shaped California’s landscape and ecosystems. At the end of the last ice age, global sea level was about 100 meters (m) below present levels (Dolby et al., 2016; Lambeck et al., 2014; Siddall et al., 2003). The estuary for the Sacramento-San Joaquin Delta was then outside (west of) the Golden Gate Bridge near today’s Farallon Islands. At that time, the inland Delta region was a non-tidal freshwater confluence of the two major rivers, probably with seasonal wetlands. Rising sea levels inundated San Francisco Bay about 9,000 years ago and started to inundate the Delta about 6,000 years ago, transforming it into a permanent tidal freshwater marsh with brackish western margins (Drexler et al., 2007; Malamud-Roam et al., 2007). This new and vast permanent marsh accreted peat soils during this period until most of the region was diked and drained for agriculture in the late 1800s and early 1900s.
___________________
1For the purposes of this report, California is divided into Southern, Central, and Northern regions. Southern California includes Los Angeles, Orange County, San Diego, Inland Empire, and desert areas. Northern California includes the San Francisco Bay Area up to the border with Oregon. Central California features the San Francisco Bay Area, Central Coast, Central Valley, and Gold Country.
The region and its habitats have evolved to endure enormous seasonal and interannual variability. Indeed, many of California’s iconic native aquatic and avian species evolved, adapted, and have prospered since the end of the Ice Age (about 10,000 years ago). These species and ecosystems adapted their life histories and movements to the long, dry summer seasons by migrating, employing flows from coldwater springs and groundwater, and employing the snowmelt freshet in spring and early summer. The geographic diversity of California also gave refuge opportunities to species across multi-year droughts, before extensive land and water development reduced and disconnected these habitats (see Appendix B).
CALIFORNIA CLIMATE
This section discusses various climate parameters, including rainfall and snowfall, temperature, sea level rise, droughts and aridity, and wildfires. Where possible both trends of the recent past and projections for the near future are provided for the regional watershed that drains to the Delta. The climate projection results reported here are mostly obtained from the sixth Assessment Report (AR6) of the Intergovernmental Panel on Climate Change (IPCC, 2021), and they are based on model simulations from the Coupled Model Intercomparison Project Phase 6 (CMIP6). IPCC AR6 describes Climatic Impact Drivers (CIDs) and categorizes them into two groups: (1) changes in the average behavior of physical climate conditions, and (2) changes in extreme behavior. Both categories of CIDs are discussed in this report.
California’s climate has enormous seasonal and interannual hydrologic variability, with more wet and dry years (floods and droughts) per average year than any other state (Dettinger, 2011). The long dry season (from April through September) is typically longer than any dry period seen by most of the more humid United States. The wet season runs from November through March, can be marked by occasional large storms, and provides on average 75 percent of the state’s precipitation. Storms can create small to major floods in a single month or over several months from a series of atmospheric rivers. Droughts can be attributed to a delay in wet season storms, an early end to the wet season, a single “dry” wet season, or several years of “dryer-than-usual” wet seasons. In medieval times2 parts of California had droughts lasting many decades, with average runoff of 40–60 percent of historical averages (Stine, 1994).
Average Annual Precipitation
The average annual precipitation varies greatly among California’s 11 climate regions, from 4.7 inches in the Sonoran Desert to 67.8 inches in the North Coast (OEHHA, 2022), as demonstrated in Figure A-1. Areas in the southern end of the Central Valley and south of the Central Valley are particularly dry and are desert in some areas (< 5 inches per year). In contrast some of the watersheds that supply the CVP and SWP, such as northeast of the Delta in the Sierras and the Trinity River watershed, can be very wet (> 50 inches per year). The spread across the entire state narrows when one considers only the Bay-Delta watershed, where annual precipitation varies from 12.9 inches in the San Joaquin portion of the Delta to 49 inches in the North Central climatic region (OEHHA, 2022).
Figure A-2 shows average monthly rainfall in five different cities in the state. Average rainfall in the more northern cities (Sacramento) is larger than in Southern California (Los Angeles, Palm Springs, Bakersfield) in the winter. Figure A-2 also illustrates the seasonal pattern of precipitation present throughout the state, with rain coming in the October-to-April time period.
There has been no apparent long-term trend in total statewide precipitation over the last 60 years (Dettinger, 2024). However, an analysis of observed changes in precipitation nationwide suggests that over the 2002–2021 period, mean annual precipitation in most of California decreased by approximately 5–15 percent relative to 1901–1960. As Figure A-3 shows, in the Sacramento-San Joaquin watersheds, the decline in mean annual precipitation is less severe compared to the southern part of the state, yet it still represents a notable decrease of around 5 percent. This decrease in mean annual precipitation over the past two decades reflects the impact of the California megadrought from 2012 to 2015 (Diffenbaugh et al., 2015; Williams et al., 2015). The period between
___________________
2First, from before AD ~892 to around AD 1112, and second, from before AD 1209 to around AD 1350 (Stine, 1994).

SOURCE: National Atlas, https://maps.redcross.org/website/Maps/Images/California/pageprecip_ca3.pdf.
October 2012 and October 2015 saw the lowest precipitation amount ever recorded in California in a consecutive three-year period (OEHHA, 2022).
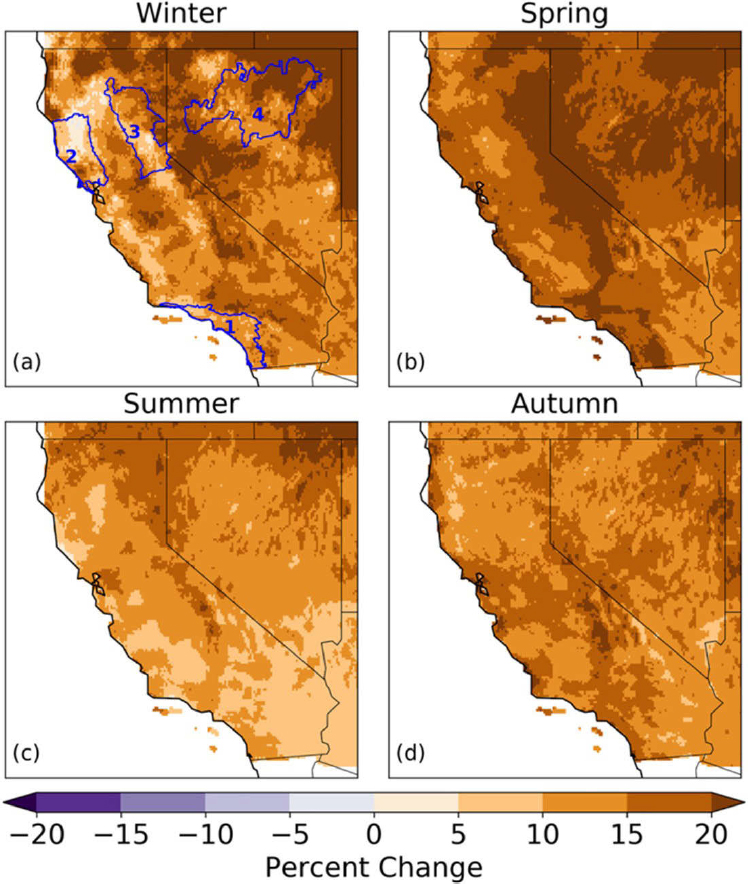
Projected future changes in mean annual precipitation, derived from CMIP6 and shown in Figure A-4, suggest marginal variations ranging from -5 percent (in the southern part of the state) to 5 percent (in the northern and central regions of California) relative to the climatological baseline period of 1851–1900—a spatial heterogeneity that aligns somewhat with observed changes (Figure A-3). These projections are consistent with earlier analyses from CMIP5 models, as presented in California’s Fourth Climate Change Assessment (Bedsworth et al., 2018). However, model projections for future precipitation in California lack consensus compared to other regions of the United States (USGCRP, 2023). In Figure A-4, regions are marked with hatch patterns if 80 percent or more of the models agree on the direction of change. It is evident from Figure A-4 that models exhibit significant divergence regarding the anticipated change in precipitation over California, even at high global warming levels of 4°C (7.2°F).
Anthropogenic global warming influences precipitation because of the increased atmospheric water demand of a warmer climate. The Clausius-Clapeyron (C-C) relationship dictates that the atmospheric holding capacity of water vapor increases by approximately 7 percent per 1°C of warming. In wet regions where water availability matches atmospheric water demand, precipitation is expected to increase, albeit possibly less than the C-C rate. Conversely, in arid regions, increased atmospheric demand leads to greater evaporation and aridity. These effects, coupled with enhanced moisture convergence from dry to wet regions, result in distinct patterns: wet regions


NOTE: Changes are estimated relative to the baseline period 1851–1900.
SOURCE: Figure from Chapter 2 of the Fifth National Climate Assessment (USGCRP, 2023).
becoming wetter and dry regions becoming drier. However, this paradigm has faced challenges, with several studies suggesting that it does not hold true because of its failure to consider changes in atmospheric circulation (e.g., Byrne and O’Gorman, 2015). In addition, energy balance constraints also moderate the response of precipitation to global warming, resulting in an increase lower than the 7 percent per 1°C rate predicted by the C-C relationship (Allen and Ingram, 2002).
Snowpack
Because precipitation generally occurs during the October-to-April time period, while municipal and industrial water demands are year-round, and agricultural demand is largest from April to August, the need to store water from the winter is critical, either as snowpack or via CVP and SWP infrastructure, for use in the spring and summer. Indeed, snowpack plays a crucial role in water resource management by capturing, storing, and releasing water for downstream use (Immerzeel et al., 2020). Since the mid-1970s, more of the statewide precipitation generally has fallen as rain compared to snow, although there is some variability, with snowpack in 2015 being the lowest on record (for the period 1949–2020) (OEHHA, 2022). Precipitation from atmospheric rivers supplies about 40 percent of the Sierra Nevada snowpack (Guan et al., 2010).
Global warming reduces snowpacks through several mechanisms including elevated temperatures that lead to a decrease in snowpack volume (Mote et al., 2018), reduction in fraction of precipitation falling as snow (O’Gorman, 2014; Ombadi et al., 2023), altered sublimation rates (Sexstone et al., 2018), earlier snowmelt, and a reduction in the length of the snowpack season (Stewart et al., 2004). Climate change impacts on precipitation patterns can also affect the volume of snowpack; however, given the insignificant and uncertain projections of precipitation change shown in Figure A-3, it is less likely that this will be a dominant mechanism.

NOTE: In all panels, red markers indicate a decrease or earlier change, whereas blue markers indicate an increase or later temporal change.
SOURCE: Figure obtained from the Fifth National Climate Assessment (USGCRP, 2023).
Figure A-5a shows that peak snowpack, as indicated by April 1 measurements, has been declining in the majority of sites across the western United States for the period 1955–2022. In the Sacramento and San Joaquin watersheds, peak snowpack has shrunk by up to 80 percent with most sites experiencing a reduction of 20–80 percent over the past seven decades. Consistent with those decreasing trends in peak snowpack, global warming is causing an earlier snowmelt, thus shifting the timing of snowpack peaks earlier in the year by up to 20 days (Figure A-5b). Furthermore, warmer winters and earlier springs lead to a shortening of the snowpack season in the majority of sites in the western United States (Figure A-5c). In parts of the Sacramento and San Joaquin watersheds, the length of snowpack season has decreased by 30–40 days since the early 1980s.
A synthesis of published literature on projected snowpack declines in the western United States shows estimated decreases of ~25 ± 5 percent by 2050, ~35 ± 10 percent by 2075, and ~50 ± 10 percent by 2100 (Siirila-Woodburn et al., 2021).3 The same analysis shows that projected declines in the Sierra Nevada snowpack are relatively higher than other mountain ranges in the western United States (e.g., Rockies and Wasatch/Uinta), especially for mid- and end-of-the century projections. Siirila-Woodburn et al. (2021) showed that low-to-no snow
___________________
3This synthesis was based on time period as opposed to warming level.
conditions, defined as years with peak snow water equivalent below the 30th percentile of historical occurrences, could become persistent within the next 35 to 60 years if global warming trends continue.
The consequences of diminishing snowpacks extend far beyond the mountain ranges. Changes in snowpack dynamics, such as earlier melting and decreased water storage, will alter groundwater and streamflow patterns, challenging effective use and management of current water infrastructure and effective use of available water, with associated economic losses. These projections underscore the urgent need for proactive measures to mitigate the effects of a low-to-no snow future.
Precipitation Extremes
California experiences large interannual variability in precipitation amounts (Figure A-6), and that variability has been increasing. Thus, the two left panels of Figure A-6 compare the coefficient of variation of water-year precipitation for the time periods 1941–1980 and 1981–2020. Variation is particularly acute in Southern California, but all of California is experiencing more variation over time. As the section below explains, the increase in variation over time affects both droughts and extreme precipitation events.
Droughts
Droughts occur frequently in California, sometimes lasting four years or more. Over the past few decades, California has experienced several multi-year droughts, including in 2001–2004, 2007–2010, and 2012–2016 (Bedsworth et al., 2018). The 2012–2016 drought was the most severe on record (OEHHA, 2022) and the most extreme in the past 1,200 years (Meko et al., 2014). Williams et al. (2020) demonstrated, through analysis of tree-

SOURCE: Dettinger (2024).
ring reconstructions, that the 19-year period from 2000 to 2018 was the second driest such period for the southwest United States including California since 800 CE. The transition toward aridity in the western United States is due not only to changes in precipitation but also to rising temperatures. These higher temperatures contribute to soil moisture loss and increased evapotranspiration rates. For example, the high air temperatures in 2014 significantly intensified drought conditions across California (Griffin and Anchukaitis, 2014; Williams et al., 2015). Studies have shown that the likelihood of precipitation deficits occurring concurrently with warm conditions has increased in California (Diffenbaugh et al., 2015), and warming accounted for up to 27 percent of the severity of the California 2012–2015 megadrought (Williams et al., 2015). This phenomenon, often referred to as a “warm drought” or “hot drought” (Overpeck, 2013), is expected to become more frequent in a warming climate.
Another measure of dryness is the Palmer Drought Severity Index (PDSI), which combines precipitation, temperature, and soil moisture data into a single measure of dryness. As shown in Figure A-7, PDSI values in California for 1895–2020 indicate that dryness has increased in the past 50 years, likely because increased air temperatures have resulted in increased evapotranspiration (Albano et al., 2022) and thus decreased soil moisture (Cheng and Huang, 2016; OEHHA, 2022).
Climate change will undoubtedly increase atmospheric evaporative demand due to rising temperatures, which means that droughts likely will become more severe and last longer in a warmer climate. A recent multi-dataset assessment of trends in evaporative demand over the past four decades revealed that increases in atmospheric evaporative demand in the western United States are already happening at a faster rate than in other regions (Albano et al., 2022). Climate model projections based on CMIP5-downscaled global climate models (GCMs), shown in Figure A-8, suggest that these increasing trends in atmospheric evaporative demand are anticipated to amplify with global warming, with an anticipated increase of 13–18 percent by the end of the 21st century (2070–2099; McEvoy et al., 2020). Overall, there is a very high certainty that future occurrence of episodic deficits in precipitation (e.g., drought events) in California will be accompanied by warmer temperatures and an increased atmospheric evaporative demand.
Atmospheric Rivers
The impact of global warming on extreme precipitation in California is quite evident, both in observations of the past and model projections of the future. The western United States, including California, has experienced an increase in both the magnitude and frequency of extreme precipitation events such as landfalling atmospheric rivers, which are concentrated bands of moisture in the atmosphere that transport large amounts of water vapor (Easterling et al., 2017; USGCRP, 2023). Large atmospheric rivers contribute approximately 30–50 percent of the annual precipitation in the western United States (Dettinger, 2011; Guan et al., 2010). Atmospheric rivers can also result in termination of droughts, and they are estimated to be responsible for terminating 33–74 percent of

SOURCES: OEHHA (2022) from NOAA (2021).
NOTE: Projections are based on CMIP5 RCP 8.5 for the end of the century (2070–2099) relative to the baseline period (1950–2019).
SOURCE: McEvoy et al. (2020).
droughts in the western United States, including the California megadrought of 2012–2016 (Dettinger, 2013; Payne et al., 2020; Wang et al., 2017).
Atmospheric rivers drive the interannual (year-to-year) variability of precipitation in the region (Dettinger, 2016; Dettinger and Cayan, 2014). Figure A-9a shows that greater than 70 percent of interannual variability of precipitation in California can be attributed to variability in extreme precipitation amounts from one year to another. This is also clearly shown in Figure A-9b, with variability of the water-year precipitation in the Delta watershed closely matching the variability of extreme precipitation from the wettest 5 percent of days.
Overall, there is growing evidence that atmospheric rivers will intensify in a warmer climate due to thermodynamic increase in precipitation (Espinoza et al., 2018; Payne et al., 2020). In California, climate projections also indicate that concurrently with this intensification of atmospheric rivers, other storms will get smaller and less frequent. Consequently, the contribution of atmospheric rivers to annual precipitation will increase even further compared to the current climate, with estimates of a 20 percent increase by the end of the 21st century (Gershunov et al., 2019). Climate model projections show an increase of 25–100 percent in rapid shifts from extreme dry to wet

NOTE: Wetter than a threshold exceeded by an average of seven days per year at each 1º-latitude–longitude grid cell, water years 1951–1999.
(A) Percentages of total water-year precipitation variance explained by precipitation from the wettest days (wetter than a threshold exceeded by an average of 7 days per year at each 1º-latitude–longitude grid cell). Data includes water years 1951–1999. (B) Water-year precipitation totals (brown bars and black curve) in the Delta’s catchment. NOTE: The graph shows 1895-2014 1895–2014 based on updated monthly Abatzoglou et al. (2009) data, and five-year moving averages of contributions to these totals from the wettest 5 percent of wet days (days with precipitation > 95th percentile; (red curve) and all other wet days (< 95th percentile green curve) based on updated daily Hamlet et al. (2005) data, 1916–2010.
SOURCES: (A) Dettinger (2016); (B) Dettinger and Cayan, (2014). CC BY 4.0.
conditions (Swain et al., 2018), analogous to the rapid shift from the megadrought conditions in 2012–2016 to the wet year of 2017. Dettinger (2024) stressed the need for the CVP and SWP operations to transition to preparing for and managing extremes rather than relying solely on average conditions in order to enhance resilience in the face of increasingly unpredictable weather patterns.
Temperature
Annual average air temperature and climate in California varies widely from the hot desert in the southeast to extreme cold in a small part of east central California, depending on latitude, elevation, and proximity to the Pacific Coast. The temperature gradient between the immediate coast and the interior regions of the state can be significant, especially in the summer, when the difference can be as much as 20°F (11°C).
Since the early 20th century, the Global Mean Surface Temperature of Earth has risen by approximately 1.96°F (1.09°C) compared to the baseline of 1850–1900 (IPCC, 2021), with land areas experiencing faster warming than oceans. Earth’s warmest year on record was 2024 (Tollefson, 2025). It is widely recognized that many land regions in the extratropical northern hemisphere have warmed more rapidly than the global average, notably the United States since the 1970s (USGCRP, 2023). In California, long-term average air temperature has increased about 2.5°F (1.4°C) since 1895, with an average of 55.9°F (13.3°C) in 1895 to an average of 57.4°F (14.1°C) in 2023. The highest statewide annual average temperature occurred in 2014 during the 2012–2015 drought, when the mean was 60.7°F (15.9°C; OEHHA, 2022). In general, the warmer years have occurred during the drier years, which, as previously discussed, increases the effects of drought through greater evaporative demand. Moreover, higher temperatures increase water demand for powerplant cooling (OEHHA, 2022). Warming has been greater in the southern portion of the state than in the north—that is, the Bay-Delta watershed.
Water temperature is highly correlated with air temperature and is a key factor affecting fish health, including metabolism, predation, thermal stress, reproductive timing, development rates, and susceptibility to disease and toxins, as well as other characteristics. Bashevkin et al. (2022) examined about 50 years of water temperature data in the upper San Francisco Bay estuary, between Suisun Bay and the upstream extent of the Delta, in order to isolate the effect of ocean water on estuary freshwater temperature. They found that water temperatures have increased on average 0.017°C per year between 1970 and 2020. Temperature increases were most widespread in the late-fall to winter (November to February) and mid-spring (April to June). Warming was also fastest in the northern regions of the upper estuary. These results, particularly the long-term rate of water temperature warming, were consistent with earlier studies of rates of air temperature warming (Hoerling et al., 2013).
Projections of Extreme High Temperatures and Heatwaves
In the Sacramento Valley, downscaled climate model projections from CMIP5 show that average daily maximum temperature is projected to increase by 10°F (5.6°C) by the end of the 21st century (Figure A-10a). Moreover, the frequency of extreme heat days, defined based on daily maximum temperature exceedances of 102.2°F (39°C), is expected to increase 10-fold (from 4 days/year to 40 days/year; Figure A-10b). These results are based on analysis of an ensemble of high emission scenarios (RCP8.5) using downscaled climate model projections (Houlton and Lund, 2018).
For the San Joaquin Valley region, projections of high emission scenarios (RCP8.5) show an increase up to 8°F (4.4°C) in average daily maximum temperature by the end of the 21st century. The increase in temperature is associated with a 50 percent projected decline in snowpack, 13 percent more precipitation coming in extreme events, and more frequent wet and dry years by the end of the 21st century (Fernandez-Bou et al., 2021; Persad et al., 2020).
Wildfires
The area burned by wildfires in the western United States has increased in recent years, in line with rising air temperatures and greater atmospheric evaporative demand (OEHHA, 2018). In fact, there was a five-times

NOTES: (a) Increase in average daily maximum temperature is projected to be around 10°F (5.6°C) by the end of the 21st century. (b) The frequency of extreme heat days is projected to increase from 4 days/year to 40 days/year.
SOURCES: Cal-Adapt (2018); Houlton and Lund (2018).
increase in summer burned area in Northern and Central California during 1996 to 2021 compared to 1971 to 1995 (OEHHA, 2022). Statewide, there were 3,356 fires during 2009–2018, which is 1.4 times greater than the average number of fires per decade in 1979 and 2009 (Buechi et al., 2025). California lost 2.12 million hectares of tree cover because of wildfires, and another 0.80 million hectares, or 0.27 percent of the total, from other activities (Global Forest Watch, 2025). Although loss of trees generally leads to higher runoff, reduction in tree cover likely leads to snowpack reduction due to increased exposure of snow to sunlight and associated sublimation.
Observation-based studies indicate that anthropogenic global warming contributed to an additional 4.2 million hectares of forest fires between 1984 and 2015, accounting for roughly 55 percent of the observed increase in fuel aridity in the western United States (Abatzoglou and Williams, 2016). Specifically, warming-induced increases in vapor pressure deficit have played a key role in driving wildfire activity in the region (Williams et al., 2019). Model simulations suggest that during 1971–2021, climate change resulted in, on average, 170 percent more burned area than if climate had remained stable during the period (Turdo et al., 2023).
Although the direct impacts of wildfires may not be central to the three actions outlined in the Committee’s statement of task, it is important to acknowledge the cascading effects they can trigger. For example, an analysis of streamflow data from 72 forested watersheds across the western United States found that average streamflow increased by up to 20 percent of the standard deviation for as long as six years after a fire (Williams et al., 2022). Given the projected rise in wildfire-conducive conditions, wildfires are a critical CID, both for their direct and indirect effects.
HYDROLOGY OF THE DELTA REGION
The Bay-Delta watershed is a naturally complex system that has been significantly altered by humans. Figure A-11 shows an aerial view of the California Delta and its location in the northern part of California’s Central Valley. At the center top of the figure, the Sacramento River flows from the north draining an area around Mount Shasta and the Sierra Nevada Mountains north of the Delta. As it flows south to the Delta, the Sacramento River
is joined by several major tributaries, including the Feather River and the American River on the east side. At the bottom right corner of Figure A-11, the San Joaquin River flows northward from the southern end of the Central Valley to the Delta.
The Delta itself consists of a complex set of channels, including the areas where the Sacramento and San Joaquin rivers connect and areas where local sources of water such as the Mokelumne and Cosumnes rivers flow out of the Sierras into the Delta. The Yolo Bypass, Cache Slough, and Lindsey Slough flow into the Delta from the Coastal Range to the northwest. The Delta is the intersection of these river systems.
The following discussion addresses (1) the Sacramento River basin upstream from the Delta, (2) the San Joaquin River basin upstream from its confluence with the Sacramento River, and (3) the Sacramento River–San Joaquin River Delta.
Sacramento River Basin
The Sacramento River drainage basin (Figure A-12) is the largest river basin wholly in California. The drainage area is 27,210 square miles including tributaries north of the Cosumnes River basin, the closed basin of Goose Lake, and drainage subbasins of Cache and Putah creeks, which lie west of the Sacramento River (RWQCB, 2019). All the major rivers of the Sacramento River basin—the Sacramento, Feather, American, and Yuba rivers—have impoundments. The upper Sacramento River, the McCloud River, and the Pit River flow into Shasta Reservoir, which has a capacity of 4,552,000 acre-feet. Oroville Reservoir, on the Feather River, has a capacity of 3,537,600 acre-feet. Folsom Reservoir, on the American River, has a capacity of 974,500 acre-feet, and New Bullards Bar Reservoir on the Yuba River has a capacity of 966,100 acre-feet. The big dams on the Sacramento River (Shasta, Oroville, Yuba Bullards Bar, Folsom) can hold about 10 million acre-feet (MAF) of water compared to an average annual runoff in the basin of 21 MAF.
The effects of the Shasta Dam on flows can be seen in the record from the stream gaging station on the Sacramento River at Red Bluff (U.S. Geological Survey [USGS] station 11377100), which has a continuous record from 1891 to the present. Following the construction of the dam, overall peak flows (greater than the approximately 30th percentile) were reduced, as expected. The lowest 70 percent of flows were higher following dam construction (see flow duration curves in Figure A-13), despite the fact that the period after 1950 generally was drier than

SOURCE: Sumer (2024).

SOURCE: Kevin Lear, International Mapping Associates.

the first half of the 20th century (Figure A-7). The median flow was 9,350 cubic feet per second (cfs) following dam construction but was 30 percent lower (6,500 cfs) prior to dam construction.
The presence of the reservoirs, as well as other flood storage areas, also has modified the annual flood hydrograph from one in which a flood peak pulse occurred in late spring to one in which the flood peak is lowered, spreads over a longer period, and occurs earlier in the spring (Sommer, 2024).
Yolo Bypass
The Yolo Bypass is a leveed floodway between 1.3 and 3 miles wide and extends for 41 miles generally parallel to, and west of, the Sacramento River and northwest of the Delta. The two primary sources of water to the bypass are the Fremont Weir, located just downstream from the Sacramento River–Feather River junction at the upstream end of the bypass, and the Sacramento Weir, located just west of the city of Sacramento. The primary purpose of the bypass is to mitigate flooding in urban areas along the Sacramento River. The bypass also supports the Yolo Bypass Wildlife Area, which is an extensive marshland (California Water Library, 2025).
Delta Cross Channel
The Delta Cross Channel (DCC) is a controlled diversion channel between the Sacramento River and Snodgrass Slough. Located near Walnut Grove, California, the DCC is a short excavated channel that diverts water from the main river to Snodgrass Slough. The water then flows through natural channels (initially the North and South Mokelumne rivers) for about 30 miles to help provide freshwater to the intakes of the state and federal pumping facilities, improves the irrigation supplies within the Sacramento-San Joaquin Delta, and pushes against the upstream movement of saline ocean water coming up the San Joaquin River. The DCC is designed to divert approximately 3,500 cfs. It also has the unintended consequence of diverting downstream migrating salmonids into the Delta rather than passing directly to San Francisco Bay and the Pacific Ocean.
Sacramento Deep Water Ship Channel
The Sacramento Deep Water Ship Channel serves the marine terminal facilities at the Port of West Sacramento by providing a passageway from San Francisco Bay. The channel joins the Sacramento River near Grand Island above Rio Vista. From Rio Vista to the Port of Sacramento, the canal serves as the eastern boundary of the Yolo Bypass. The Sacramento River flows parallel to the channel to the east. The shipping channel accommodates large ocean-going cargo vessels, with the primary cargo being agricultural products and other bulk goods. The channel, completed in 1963, is 30 feet deep, 200 feet wide, and 43 miles long, although a portion of the channel over an 8-mile reach downstream of the Port of Sacramento was deepened to 35 feet.
San Joaquin River Basin
The San Joaquin River drains about 31,200 square miles of Central California, portions of the western Sierra Mountains, and the eastern slopes of the Coastal Range. As with the Sacramento River, the hydrology of the San Joaquin River basin has been significantly modified by the operation of reservoirs. Of the major tributaries to the San Joaquin River, only the Cosumnes River is still free flowing. Of the 25 reservoirs in the basin, 17 provide hydropower and 14 supply irrigation water (Gronberg et al., 1998). Storage in the largest San Joaquin reservoirs (New Melones, New Don Pedro, New Exchequer, and Millerton) is 6.3 MAF, which is comparable to the 6.6 MAF runoff in the basin. The presence of these reservoirs modifies the larger annual hydrograph of the San Joaquin River in a manner similar to the impacts of Sacramento River reservoirs on the Sacramento River hydrograph (e.g., Figure A-13). In dry years, the many consumptive water diversions throughout the San Joaquin watershed make the San Joaquin River very dry.
The Stockton Deep Water Ship Channel extends 41 miles west from the Port of Stockton to Antioch, California, in the counties of Contra Costa, Sacramento, and San Joaquin. The channel, which for most of its length is also the lower San Joaquin River, has an average depth of 35 feet (10.6 meters) and reaches an average of 40 feet (12.2 meters) at high tide.
The Delta
The Sacramento–San Joaquin Delta is an inland tidal freshwater delta, formed by rising sea levels over the past 6,000 years. It is east of Carquinez Strait, which is the only outlet for the Sacramento and San Joaquin rivers to San Pablo Bay and subsequently San Francisco Bay. Historically, the Delta was highly dendritic (right side of Figure A-14); however, the Delta has been altered (left side of Figure A-14) to drain tidal lands for agriculture, improve flood conveyance, reduce saltwater intrusion, allow commercial cargo ships to reach Sacramento and Stockton, and improve opportunities for recreational boating.
The Delta is a large heterogeneous tidal region with a number of features, as shown in Figure A-15. In the west, Suisun Marsh is a large set of wetlands, managed mostly for duck hunting, which also supports some of the largest remaining brackish tidal wetlands in the region, with salinity partially managed by the Suisun Marsh Salinity Control Gates. (The gates are operated twice per day during ebb tide to direct a pulse of freshwater from the Sacramento River into the salty Bay water of the marsh.) The northern Delta is better supplied with the more abundant freshwaters of the Sacramento Valley and is shaped by that valley’s flood infrastructure and bypasses (including the Yolo Bypass and Cache Slough). This section of the Delta has the most remaining tidal marshes compared to the historical coverage (Whipple et al., 2012). The Central Delta receives freshwater inflows from the Sacramento River (via the DCC, Georgiana Slough, and Three-Mile Slough), the San Joaquin River, and smaller eastside rivers and streams. Tidal mixing (particularly in Franks Tract) is a primary mechanism for bringing saline seawater further into the Central Delta. The Southern Delta has freshwater (and summer brackish water) inflows from the San Joaquin River and smaller streams, but most dry season freshwater inflows to the Southern Delta are drawn from the Central Delta and through the Old and Middle River corridors by pumping. Native fishes are more abundant in the Suisun Marsh and northern Delta, with non-native fishes dominating in the central and southern parts of the Delta.

SOURCE: Robinson et al. (2014).
There are numerous withdrawals—perhaps as many as 2,000—in the Sacramento River basin, the San Joaquin River basin, and the Delta. Temporary barriers, located primarily in the south Delta (Middle River, Head of Old River, Old River, Grantline Canal, West False River), are used for managing salinity and fish passage (Sommer, 2024).
Regional Streamflow Patterns
A general average annual water balance of the Delta includes four major inputs: (1) the Sacramento River, 16.1 MAF; (2) the San Joaquin River, 3.1 MAF; (3) the Yolo Bypass, 1.8 MAF; and (4) eastern tributaries, 0.8 MAF (Figure A-16). The major outflows from the Delta are outflows to San Francisco Bay, 15.8 MAF; and exports of

SOURCE: Kevin Lear, International Mapping Associates.

SOURCES: Long-term modeling from CalSim, shown in Sommer (2024). ET estimates from Medellín-Azuara et al. (2018) and precipitation estimates from Ariyama et al. (2019).
water to Central and Southern California, 5.1 MAF. Estimated inflows exceed the outflows by 0.9 MAF (Sommer, 2024), presumably due to consumptive and evaporative losses within the Delta.
Annual averages, however, do not capture regional, seasonal, and interannual variation in Delta inputs and outputs. One long-term trend in inflows to the Delta, discussed earlier, is the change in the timing and volume of snowmelt runoff of tributaries draining to the Delta, with less streamflow coming in the historical snowmelt period of April to June. This reflects the fact that more of the total precipitation in California is falling as rain (OEHHA, 2022; Figure A-17).
Interannual variability is observed in the mean annual runoff for the entire state of California (Figure A-18). The mean annual runoff is about 80 MAF between 1901 and 2023 (Figure A-18, red line), but this average value occurs rarely. A base flow of about 25 MAF (Figure A-18, green line) occurred in all but one water year (1976–1977). This “base flow” is reliable and is exceeded almost every year. The additional flow above this base is highly dependent on the number and magnitude of the atmospheric rivers that impact California in that year (Dettinger et al., 2023). The variation evident in Figure A-18 has significant ramifications for the management of the CVP and SWP.
Flows in California streams have been highly altered by human activities. Of the 540 sites assessed by Zimmerman et al. (2017), greater than 95 percent had at least one month of flow that is depleted or inflated beyond the range of natural variation in the 1996–2015 period. On average, depleted monthly flows were 20 percent of expected natural flows, and inflated flows were 10 times the magnitude of natural flows. The majority of sites exhibited depleted maximum annual flows and a reduction in flow variability (consistent with Figure A-13). Figure A-19 shows how water supply development has reduced Delta outflow over the last century. It shows both the declining trend in winter/spring outflow and full water-year outflow as the water projects were developed, though this decline halted in the 1990s (for winter/spring outflow) and in the 2000s (for full water-year outflow).
Historical Reflection on Delta Inflows
There have been attempts to reconstruct natural flows into San Francisco Bay for the period 1850–1920 (i.e., prior to the time when exports began), but these efforts have not been particularly satisfying. Moftakhari et al. (2015) concluded that there has been an approximately 35 percent decrease in annual flow to San Francisco Bay

SOURCE: OEHHA (2022), from CDWR (2021).

SOURCE: Data downloaded from USGS California Water Science web page.

SOURCE: Gartrell and Mount (2022).
since the mid-1800s. However, MacVean et al. (2018) concluded that reconstruction of flood frequency and extent was not possible, because a good time-series of levee construction was not available. Reconstructed natural inflows did suggest, however, that annual inflows to the Delta increased due to human activities between 1850 and 1920.
To further explore the changes in the system and their effects within the Delta, Andrews et al. (2017) constructed a 3-D hydrodynamic model to explore the system in its “pre-development” condition, prior to significant modern anthropogenic influence, for comparison to its contemporary condition. The pre-development system model was calibrated by varying marsh plain elevations in order to match sparse observations of tidal characteristics, and it was used to simulate assumed conditions thought to exist prior to the alterations of the past two centuries. The relationship between estuary outflow and the longitudinal distance from the estuary mouth to the 2 psu bottom salinity isohaline (X24) was analyzed. The Andrews et al. (2017) analysis shows much more extensive variation in the position of X2 under pre-development conditions.
Fox et al. (1990) concluded that there was no decrease in the annual Delta outflow for 1921–1986, despite interbasin exports. There were, however, seasonal changes, including a decreased outflow during April–May and increased outflow during July–November. Changes in other months were not statistically significant. Changes were attributed to operation of upstream water projects and earlier snowmelt. Hutton et al. (2017) also found no change in annual Delta outflows for 1922–2015, but they did detect statistically significant decreasing outflows in February, April, May, and November, and increasing outflows in July and August. These results generally agree with those of Fox et al. (1990), who had 25 fewer years of data.
Streamflow Changes Caused by Global Warming
Global warming-induced changes in streamflow are affected by changes in other variables such as precipitation, evapotranspiration, and snowpack, to name a few. Furthermore, changes in land surface conditions such as those associated with vegetation cover can significantly alter streamflow characteristics (Zhou et al., 2023). Despite the complexity of processes involved in runoff generation, there is an emerging consensus in the literature that runoff is projected to increase over most global land regions with continued global warming (Zhou et al., 2023) including the western United States (Payton et al., 2023).
Observations-based analysis shows spatial heterogeneity and opposing trends in streamflow magnitude across watersheds. However, changes in streamflow seasonality are arguably the most affected aspect of streamflow due to climate change. Recent studies have documented a reduction in streamflow seasonality in northern high latitudes (above 50°N) that are directly related to anthropogenic global warming (Wang et al., 2024). Furthermore, it has been shown that streamflow seasonality is altered either toward earlier or delayed peaks in streamflow depending on mean snow fraction. More specifically, earlier snowmelt is observed in snow-rich catchments, while less snowy catchments exhibit a delayed streamflow peak (Han et al., 2024).
GROUNDWATER
Groundwater is an important freshwater resource for California. USGS reports that roughly 60 percent of statewide water withdrawals is used for the agricultural sector (Brandt, 2018); the California Department of Water Resources indicates roughly 40 percent.5 The difference among reported amounts arises from different survey methods and assumptions. Groundwater provides about 40 percent of agricultural water, and it provides freshwater for a number of communities, including the Delta communities of Clarksburg, Courtland, Freeport, Hood, Isleton, and Rio (PPIC, 2024).
As a result of groundwater depletion, land subsidence is common in many parts of California, including northwest of Sacramento and portions of the San Joaquin River basin, where subsidence in the western part of the basin has exceeded 25 feet (USGS, 2018a). In the Delta, drainage and oxidation of nutrient-rich peat soils, as well agricultural practices, have caused these lands to subside to 9 to 26 feet below sea level (USGS, 2018b).
___________________
4X2 is the location kilometers from the Golden Gate Bridge where average daily salinity is 2 parts per thousand at 1 meter from the bottom.
5See https://water.ca.gov/Programs/Water-Use-And-Efficiency/Agricultural-Water-Use-Efficiency.
TIDES AND SALINITY
Salinity in the Delta substantially determines habitat for fish, and it frequently controls whether the water is fit for municipal uses or agriculture. If saltwater protrudes too far east into the estuary, freshwater in the Delta becomes contaminated and Delta ecosystems are disrupted. For this reason, standards exist on how to operate water exports so that salt does not intrude too far into the Delta.
Surface water flows drive the movement of salts, water quality constituents, and most aquatic organisms and fish in the Delta. These flows are mostly driven by large semi-diurnal tides. In the western Delta average tidal flows vary ± 12,000 cubic meters per second (cms, over 400,000 cfs). The influence of tides within the Delta is shown in Figure A-20, which shows flow rate measured by the USGS Middle River gauge. Tidal elevation and flow changes also drive the existence and functioning of many Delta wetlands and much of their biological productivity.
Interestingly, tides affect river flows beyond the Delta, including as far upstream as Freeport on the Sacramento River and up to Stockton on the San Joaquin River. (Salinity is restricted from traveling this far into the Delta by freshwater river inflows.) As shown in Figure A-21, Freeport has a significant tidal signal, although the tidally averaged or net flows are usually positive—that is, toward the ocean. Under severe low-flow conditions, it is possible for the net flows at Freeport to be negative for periods of time (Figure A-22). Further into the Central Delta, flows usually reverse with the tides, except under flood flow conditions. The influence of tides is diminished throughout the Delta, and saltwater is pushed further downstream toward the Bay, during periods of river flooding. Figure A-23 shows that tidal fluctuations are not discernable during the peak days of the flood hydrograph. However, the tidal elevation influences flood elevations within the Delta under these high river flow conditions.
The influence of tides on water elevations and flows has always dominated in the Delta (except for major floods), but it has changed over time. From 1860 to 2018, the average tidal range increased by 2 feet in the San Joaquin River at Stockton and by 0.8 feet in the Sacramento River at Sacramento (Szlemp, 2020). The increase coincided with river deepening, channelization, and floodplain leveeing in the early 20th century. Tidal ranges decreased after the mid-1930s, perhaps from wetland restoration and subsided island failures. Since about 1950, reservoir releases, various gates, and water export pumping have been managed to control seawater intrusion into the Delta while providing local and exported water of acceptable quality. For example, the Suisun Marsh Salinity Control Gates help the marsh remain fresh for Delta smelt and waterfowl. Water levels and flows are also influenced by diversions and operation of temporary barriers within the Delta.
The primary drivers of subtidal water level variations are barometric pressure variations and lesser effects from wind (Walters, 1982). A residual circulation also can be caused by a longitudinal salinity or temperature density

SOURCE: Israel (2024).

SOURCE: Brown et al. (2024).

SOURCE: Data from U.S. Geological Survey.

SOURCE: Data from U.S. Geological Survey.
gradient in a tidal system. In most of the Delta, these density gradients are usually too small to cause significant circulation, but when they occur, the results can be biologically and ecologically important (Brown et al., 2024).
Many of the processes discussed above are captured in Figure A-24, which shows the mix of tides, river inflows, and exports that influence flows, salinity, and transport across the California Delta (Brown et al., 2024).
Tidal flows and elevations in the Suisun Marsh area in the western Delta are particularly important. As shown in Figure A-25, tidal flows vary from ± 12,000 cms (400,000 cfs) at Martinez to near zero at Sacramento on the Sacramento River and Stockton on the San Joaquin River. Tidal excursions show the transport of salts, nutrients, and organisms within and across the area over an average tidal cycle. These tidal amplitudes and flows vary considerably across higher and lower daily tidal peaks, spring and neap cycles, and longer seasonal and multi-year cycles. Tidal harmonic studies often cover a 19-year range of cycles, with even longer cycles being important for some purposes (Enright et al., 2013).
Figure A-26 shows how salinity varies across a transect of the Delta relevant to the Summer-Fall Habitat Action, and how this salinity varies with ebb and flood tides. As mentioned previously, if sea salt disperses too far into the estuary, then it contaminates freshwater flowing down the Sacramento River, which is the primary freshwater source for in-Delta uses and water exports. Another source of salinity in the Delta is agricultural drainage from within the Delta and upstream. These salts accumulate in the southern and central Delta unless tidal dispersion moves these salts to other parts of the Delta, higher winter San Joaquin River outflows flush these salts downstream, or these salts are exported from CVP and SWP pumps.
Sea Level Rise
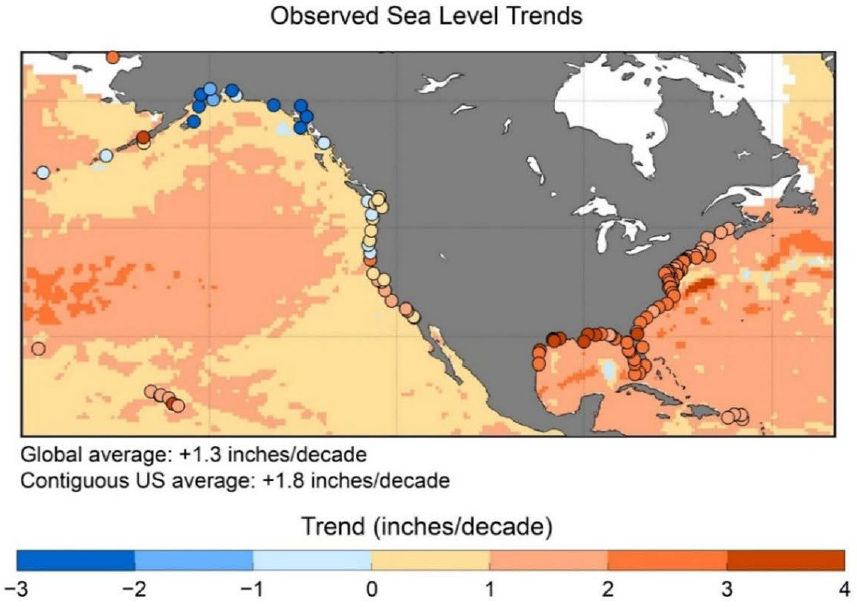
Climate change-induced sea level rise is reshaping coastlines across the globe, with observable trends indicating a significant increase in sea level over the past few decades. Globally, sea levels have risen by an average of 1.3 inches per decade, but in the contiguous United States, the average increase has been even higher at 1.8 inches per decade (USGCRP, 2023).6 However, these rises are not uniform across regions, with varying rates of sea level rise observed in different parts of the country (Figure A-27).
In the United States, sea level rise rates exhibit considerable variation. Over the last 30 years, the most pronounced rise has been observed along the U.S. western Gulf Coast, where sea levels have increased by approximately 3 inches per decade. This substantial increase can be attributed largely to high rates of land subsidence, primarily driven by subsurface groundwater extraction and fossil fuel withdrawal activities. Conversely, the Pacific coastlines of the northwest and southwest regions have experienced relatively lower rates of sea level rise, with increases of around 0.7 and 1 inch per decade, respectively.
The impacts of sea level rise extend beyond coastal infrastructure, leading to increased saltwater intrusion into freshwater habitats and extending the regions of tidal influence. Both ramifications could disrupt Delta ecosystems and threaten the survival of native fish species. Figure A-28 shows the simulated inundation of San Francisco Bay (left) and the larger Bay-Delta (right) resulting from 1 meter of sea level rise.
DELTA ECOLOGY
Ecological function in the Delta has been shaped by over a century of land use change, along with altered hydrological function and non-native species introductions.
Land use in the Sacramento River and San Joaquin basins and the Delta has been radically transformed since the middle of the 19th century. The most significant change has been the conversion of almost all of the contiguous wetlands to agricultural production (Figure A-29; Cloern et al., 2021; Whipple et al., 2012) through the drainage of wetlands. Nearly all tidal (98 percent) and non-tidal (99 percent) wetlands have been drained and converted for agriculture or open water habitat, along with a loss of 68 percent of riparian forest habitats (Whipple et al., 2012). Moreover, the current landscape is largely disconnected from its rivers by levees and because of flow regulation from upstream dams.
___________________
6If the USGCRP website is not available, similar information can be found at https://oehha.ca.gov/climate-change/epic-2022/impacts-physical-systems/sea-level-rise and https://www.climate.gov/news-features/understanding-climate/climate-change-global-sea-level.

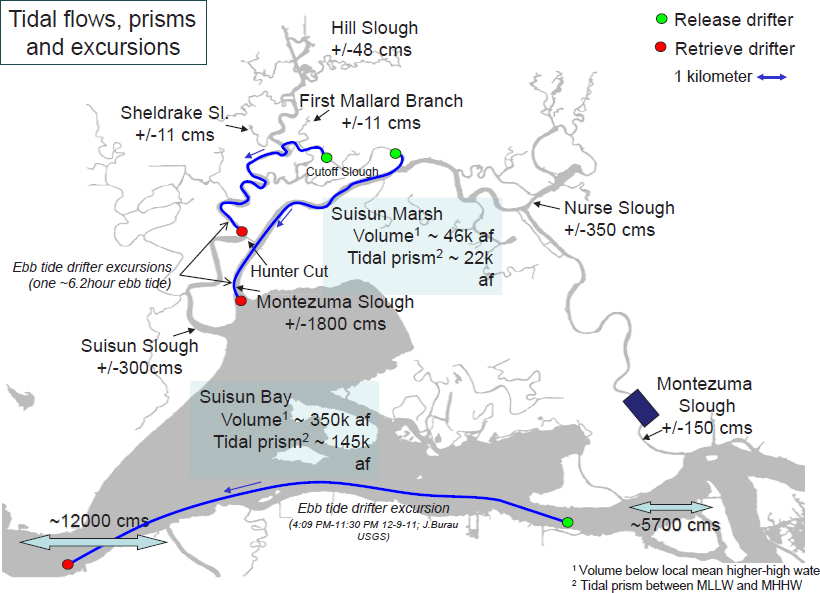
NOTE: Simplistically, the tidal prism is the volume of water between high tide and low tide, measured at a point. Martinez is located near the red dot in the lower left-hand corner.
SOURCE: Brown et al. (2024).

SOURCE: Sommer (2024).
SOURCE: USGCRP (2023).

SOURCE: https://v2.cal-adapt.org/tools/slr-calflod-3d/.

Hydrologic Connectivity and Flow Regimes
When the system was dominated by wetlands and a large diversity of plants, vascular marsh plants contributed the majority of net primary productivity, which represents the amount of energy available to support secondary consumers. Phytoplankton and pelagic primary production were a comparatively small component of total system production. Now the Delta region is dominated by agriculture, with the loss of wetland habitat causing an increase in the relative importance of pelagic primary production (phytoplankton and invasive aquatic vegetation) for consumers.
Pelagic ecosystems within the historic Delta are thought to have been dominated by detrital energy flows. Cloern et al. (2021) estimate that with the cumulative loss of 77 percent of Delta wetland habitats, systemwide net primary production was reduced by 94 percent, with sharp declines in energy available to both herbivore (89 percent decline) and detritivore (94 percent decline) components of the food web.
Historically unimpeded flows meant that tidal flushing not only helped to contribute to high rates of primary production but also provided a mechanism to distribute that material to pelagic food webs. Today, tidal hydrodynamics still exert strong controls on the growth of phytoplankton and microalgae and regulate production and the distribution of detrital material.
A historical perspective on the ecology of the Delta and an understanding of how physical and biological conditions have changed are critical for placing the current environmental challenges and management objectives in context. There has been a considerable amount of effort by scientists and natural historians to piece together how Delta ecology has changed over the past century and a half. The description provided below draws from historical reconstructions of Delta morphology and landscape, empirical studies of species adaptations and habitat use, and analyses of long-term shifts in primary production, trophic pathways, and species abundances. Figure A-30 shows a timeline of key historical and ecological changes in California and the Delta.
Historically, the Central Valley and Delta functioned as a hydrologically dynamic system shaped by seasonal flood pulses, variable snowmelt, and tidal mixing. The Sacramento and San Joaquin rivers regularly overtopped their banks during winter and spring, inundating vast flood basins such as the Butte, Sutter, Yolo, and Colusa basins. These floodwaters moved slowly across the landscape, recharging wetlands, distributing nutrients, and creating temporally dynamic habitats critical for native fish and bird species (Bay Institute, 1998; SFEI, 2012; Whipple et al., 2012). In the Delta, fluvial and tidal forces interacted to produce a shifting network of distributary channels,

backwater sloughs, and tidal wetlands, maintaining salinity gradients and a highly retentive flow regime that supported aquatic productivity (Enright et al., 2013; SFEI, 2012; Whipple et al., 2012).
This regime was radically altered by hydraulic mining, levee construction, large dam projects, and water exports (see Appendix B for a description of these activities). Beginning in the mid-19th century, sediment from hydraulic mining aggraded channels and filled wetlands, reducing their natural flood storage capacity (Gilbert, 1917; Kelley, 1989). By the early 20th century, levees had disconnected more than 90 percent of floodplain wetlands from river channels (Bay Institute, 1998; SFEI, 2012; Whipple et al., 2012). Later, major reservoirs captured spring snowmelt, reducing overbank flooding by greater than 80 percent and transforming the timing, volume, and thermal characteristics of downstream flows (Bay Institute, 1998; Lund et al., 2007). In the Delta, the CVP and SWP established net southward flow during key ecological periods, reversing natural flow directions in Old and Middle Rivers and increasing the risk of fish entrainment while shortening fish residence times in productive habitats (Cloern and Jassby, 2012; Jassby and Cloern, 2000; Kimmerer, 2008).
Landscape and Habitat Structure
The historical Delta and surrounding Central Valley floodplains were defined by spatial complexity and a high degree of land-water interspersion (Whipple et al., 2012). Natural levees, oxbows, scroll bars, and flood basins created a shifting mosaic of interconnected habitat types—including tidal and non-tidal emergent wetlands, riparian forests, backwater sloughs, and seasonal lakes and ponds (Thompson, 1957; Whipple et al., 2012). In the South Delta, dynamic fluvial-tidal interactions sustained diverse habitats used by splittail, perch, and juvenile Chinook salmon (Sommer et al., 1997, 2001). In the North Delta, warm, shallow lakes supported now-extirpated fish species such as Thicktail chub and Sacramento perch (SFEI, 2012).
This fine-grained landscape structure was steadily dismantled over several decades by wetland reclamation, levee construction, and agricultural development. The Swamp and Overflowed Lands Act of 1850 facilitated large-scale drainage and conversion of wetlands to farmland (Kelley, 1989). By the early 20th century, over 90 percent of Central Valley wetlands had been lost or hydrologically isolated (SFEI, 2012). In the Delta, the construction of a rectilinear network of levees and drainage canals transformed a complex floodplain-tidal system into subsided, disconnected agricultural islands (Lund et al., 2010; Thompson, 1957). Land subsidence driven by peat oxidation pushed some Delta islands more than 5 meters below sea level, further entrenching the need for levee maintenance and eliminating shallow habitat gradients (Bay Institute, 1998).
These changes greatly simplified the physical structure of the landscape and removed the spatial heterogeneity that had supported diverse life histories and ecological functions (Moyle et al., 2010) and a food-web structure reliant on wetland inputs (DISB, 2024).
Primary Production, Food-Web Structure, and Energy Flow
Historically, the Delta and its floodplain wetlands were among the most productive wetland ecosystems in North America, supporting spatially complex and seasonally dynamic food webs in which energy moved primarily through detrital and benthic pathways (DISB, 2024). Organic material produced by marsh vegetation and floodplain algae was slowly decomposed and transported through microbial and invertebrate consumers. Blind tidal channels and flood basins retained detritus and organic carbon, allowing energy to be recycled locally and released gradually to the aquatic food web. Flood pulses enhanced lateral connectivity, pulsing nutrients and organic matter across habitat boundaries and fueling bursts of secondary production. Benthic grazers, microbial decomposers, and filter feeders processed this material, supporting a range of consumers from zooplankton to fish (Junk et al., 1989; SFEI, 2012, 2016; Sommer et al., 2001). The Delta’s tidal marsh and riparian zone habitats generated an estimated 915 million pounds of organic carbon annually, primarily from emergent vegetation and benthic algae (Bay Institute, 1998). This production was spatially extensive and seasonally mobilized: flood pulses transported detritus and nutrients across land-water boundaries, supporting microbial decomposers, filter feeders, and fish in adjacent aquatic habitats (Junk et al., 1989; Sommer et al., 2001). Organic inputs were predominantly autochthonous and slow-cycling, creating a stable detritus-based energy system that persisted year-round (Bay Institute, 1998; DISB, 2024).
This regime of highly diffuse marsh and floodplain productivity gave way in the mid-20th century to a system increasingly dominated by pelagic primary production. As tidal wetlands and floodplain habitats were disconnected by draining and levee construction, channel complexity declined, and emergent vegetation and marsh detritus ceased to be the dominant energy sources. The food web instead shifted toward a pelagic-based system supported primarily by phytoplankton and microbial loop dynamics, reliant on phytoplankton produced within the Delta’s open water channels—especially diatoms and other fast-growing taxa that flourished in longer, deeper, clearer, and more hydrologically isolated channels (Brown et al., 2016; Cloern, 2007; DISB, 2024; Jassby and Cloern, 2000). In this configuration, phytoplankton served as the primary organic carbon and energy sources, while dissolved organic matter was processed by free-living bacteria and consumed by heterotrophic nanoflagellates, ciliates, and other microbial grazers—a trophic pathway known as the microbial loop (Azam et al., 1983; Hollibaugh et al., 2000). These microbial organisms formed an intermediate step, transferring dissolved organic carbon into particulate forms that, along with phytoplankton biomass, could be consumed by zooplankton (Sobczak et al., 2002; Stepanauskas et al., 2005).
Though simplified relative to the historical system, this mid-20th-century pelagic food web remained sufficiently productive, with chlorophyll a concentrations that averaged above 10 µg/L in many regions of the estuary able to support robust populations of copepods, mysid shrimp, and cladocerans that formed the dietary base for native planktivorous fishes such as Delta smelt and longfin smelt (Brown et al., 2016; Jassby et al., 2002; Kimmerer, 2004). However, the physical alterations to the Delta—including levee confinement, reduced residence times, and the elimination of shallow vegetated margins—increasingly constrained the spatial and temporal extent of productive food-web zones (Cloern et al., 2012; Monsen et al., 2007).
Over time, additional factors further affected primary production and food availability. The non-native freshwater clam, Corbicula fluminea, was introduced to the Delta in the 1940s (Brown et al., 2007). While C. fluminea entered the system before long-term monitoring was underway, studies suggest, based on its substantial biomass and widespread distribution, that it has substantially influenced the Delta food web (Cohen et al., 1984; Lopez et al., 2006; Lucas and Thompson, 2012). Long-term monitoring data indicate that decreasing trends in phytoplankton biomass and pelagic primary productivity in the Delta and Suisun Bay were already underway during the 1970s (Jassby, 2008), with some evidence suggesting that increasing water exports could explain some of those decreases (Jassby and Powell, 1994).
The “pelagic”-based food-web system experienced a pronounced collapse following the introduction of Pomatocorbula amurensis in 1986, which triggered a five-fold decline in phytoplankton biomass across much of the Delta and Suisun Bay. Chlorophyll a concentrations fell to less than 3 µg/L, even during periods when biomass had historically accumulated (Cloern and Jassby, 2012).
The collapse of phytoplankton and microbial productivity in the late 1980s triggered a broader unraveling of trophic linkages. The food web became decoupled, meaning that energy no longer moved efficiently from basal producers through zooplankton to native fishes (Greene et al., 2011; Kimmerer et al., 1994; Werner and Hollibaugh, 1993). Native zooplankton populations declined sharply, and the species that replaced them (e.g., invasive cyclopoid copepods) were smaller, less nutritious, and poorly matched to the feeding ecology of native fishes (Bouley and Kimmerer, 2006; Ger et al., 2010). Where benthic filter feeders such as P. amurensis and C. fluminea occur in high densities, their grazing rates can approach 12 m3 m-2 d-1 in some seasons (Figure A-31). High grazing rates intercepted phytoplankton and microbial biomass before it could be consumed by zooplankton, severing the direct link between primary producers and higher consumers (Cloern and Jassby, 2012; Greene et al., 2011). The detrital pathways that historically provided a slow and stable source of energy had been largely eliminated because of the loss of marshes and seasonal floodplains (SFEI, 2016; Whipple et al., 2012). The result was a fragmented and inefficient food web in which much of the available carbon was either lost to microbial respiration, sequestered in the benthos, or cycled through pathways that no longer supported zooplankton or fish production (Kimmerer et al., 1994; Sobczak et al., 2002).
Species Composition and Adaptation
Native species in the Delta evolved in response to its historical hydrologic variability, habitat heterogeneity, and seasonal productivity. Fish such as Sacramento splittail, Chinook salmon, steelhead, and Sacramento perch
![Estimated grazing rates (volume of water filtered per unit area per day [m3/m2/d]) for Potamocorbula amurensis and Corbicula fluminea in May 2019.](https://www.nationalacademies.org/read/29130/assets/images/img-229-1.jpg)
NOTE: In the areas where P. amurensis (blue) and C. fluminea (orange) overlap, their combined total grazing rate is shown. Grazing rates are based on clam biomass determined through field sampling (g/m2) converted to grazing (i.e., filtration) rate based on lab-determined conversion factors, with the P. amurensis filtering approximately four times faster per unit biomass than C. fluminea.
SOURCE: Zierdt-Smith et al. (2023).
developed life-history strategies that depended on predictable access to floodplains, backwater sloughs, and shallow wetlands. Spring inundation cued spawning migrations, provided warm and productive rearing habitats, and sustained invertebrate prey populations. Resident species such as Sacramento perch and Thicktail chub thrived in the Delta’s warm, slow-moving, structurally complex backwaters (Moyle, 2002; SFEI, 2012). Waterfowl and other wetland birds also took advantage of this dynamic landscape, using a broad array of habitats during different phases of migration and breeding cycles (Taft and Haig, 2005).
As levees severed floodplain connections, wetlands were drained, and flows became more regulated, the ecological context that had shaped these adaptations disappeared. For migratory fishes, access to critical spawning and rearing habitats was lost or compressed, and the timing and temperature of flows no longer matched evolved life-history cues (Jeffres et al., 2008; Williams, 2006). Floodplain specialists such as splittail became increasingly confined to marginal habitat remnants, while salmon populations experienced elevated pre-spawn mortality, juvenile stranding, and reduced outmigration success because of altered flow regimes and degraded rearing conditions (Bay Institute, 1998; SFEI, 2012; Sommer et al., 2001; Appendix E). For resident species, the loss of low-velocity vegetated margins and shallow warmwater habitats meant both the physical structure and thermal conditions required for persistence were diminished (Moyle et al., 2010).
The biological community of the Delta shifted with the introduction of dozens of non-native species. Predatory fish such as striped bass (Morone saxatilis), introduced in the 1870s, became widespread and now consume native juvenile fishes, including Chinook salmon and Delta smelt (Moyle, 1976; Nobriga and Feyrer, 2007). Invasive
plankton, such as Pseudodiaptomus forbesi, and filter feeders like Corbula amurensis restructured lower trophic levels (Greene et al., 2011; Kimmerer and Orsi, 1996). These non-native species often lacked historical controls and were able to exploit simplified or novel conditions, outcompeting native taxa and altering food availability, timing, and spatial distribution in ways that created mismatches between native fish and their prey (Baxter et al., 2008; Brown and Michniuk, 2007).
The resulting biological community is now composed of many species that are either maladapted to current conditions or functionally dependent on relict habitat features and highly managed flow conditions. Population trajectories for native fish and many waterbirds reflect this loss of ecological fit—a pattern that is unlikely to reverse without restoration of key functional processes and habitats (Moyle et al., 2010; SFEI, 2016).
Water Quality, Contaminants, and Novel Stressors
Historically, the Delta’s water quality was shaped by natural processes: seasonal runoff, tidal mixing, floodplain inundation, and biogeochemical cycling in marshes and sloughs. These processes maintained relatively high turbidity and buffered nutrient concentrations. Light penetration was limited by suspended sediments mobilized during flood events and tidal currents, which, in turn, constrained algal overgrowth and supported balanced productivity. Nutrients cycled through marsh vegetation and microbial pathways, and shallow vegetated margins supported denitrification and sediment retention (Cloern, 2001; SFEI, 2012; Tockner et al., 1999).
In the modern Delta, many of these self-regulating processes have been diminished or lost. Levees and flood control infrastructure eliminated lateral exchanges and reduced sediment inputs, contributing to increased water clarity in some regions (Jassby et al., 2002; Wright and Schoellhamer, 2004). This reduction in turbidity has shifted predator-prey dynamics and exposed native fishes to increased visual predation (Ferrari et al., 2014; Nobriga et al., 2005). Flow regulation and channel simplification reduced residence time and the opportunity for biogeochemical processing (Cloern et al., 2012; Monsen et al., 2007). Meanwhile, nonpoint source pollutants—including agricultural runoff, stormwater, and wastewater effluent—introduced a wide range of contaminants, including pesticides, herbicides, ammonium, and legacy metals (Jassby et al., 2003; Kuivila and Hladik, 2008). These contaminants often exert sublethal effects: impairing olfactory cues critical to migration, reducing reproductive success, and increasing vulnerability to predation (Hasenbein et al., 2014; Scholz et al., 2000). Emerging concerns also include endocrine-disrupting compounds and mixtures of unknown interactions (Anderson et al., 2006; Werner et al., 2010). At the same time, warming temperatures, increased nutrient loading, and longer water residence times have facilitated harmful algal blooms, particularly during low-flow summers. Cyanobacteria such as Microcystis have become recurrent features of the Delta’s summer ecology, producing toxins that further degrade habitat quality for fish, zooplankton, and waterfowl (Cloern and Jassby, 2012; Lehman et al., 2005).
Taken together, these novel stressors represent a fundamentally different water quality regime than the one to which native species are adapted. The Delta now hosts a chemically, thermally, and ecologically altered water column—one that interacts with hydrology, habitat loss, and invasive species to intensify ecological stress.
REFERENCES
Abatzoglou, J. T., K. T. Redmond, and L. M. Edwards. 2009. “Classification of Regional Climate Variability in the State of California.” Journal of Applied Meteorology and Climatology 48(8): 1527–1541. https://doi.org/10.1175/2009JAMC2062.1.
Abatzoglou, J. T., and A. P. Williams. 2016. “Impact of Anthropogenic Climate Change on Wildfire Across Western US Forests.” Proceedings of the National Academy of Sciences 113(42): 11770–11775. https://doi.org/10.1073/pnas.1607171113.
Albano, C., J. Abatzoglou, D. McEvoy, et al. 2022. “A Multidataset Assessment of Climatic Drivers of Recent Trends in Evaporative Demand Across the Continental United States.” Journal of Hydrometeorology 23(4): 505–509. https://doi.org/10.1175/JHM-D-21-0163.1.
Allen, M. R., and W. J. Ingram. 2002. “Constraints on Future Changes in Climate and the Hydrologic Cycle.” Nature 419(6903):224–232. https://doi.org/10.1038/nature01092.
Anderson, B. S., B. M. Phillips, J. W. Hunt, et al. 2006. “Evidence of Pesticide Impacts in the Sacramento–San Joaquin Delta: Results of Water and Sediment Toxicity Testing.” Environmental Toxicology and Chemistry 25(12): 3188–3199.
Andrews, S. W., E. S. Gross, and P. H. Hutton. 2017. “Modeling Salt Intrusion in the San Francisco Estuary Prior to Anthropogenic Influence. Continental Shelf Research 146:58–81. https://doi.org/10.1016/j.csr.2017.07.010.
Ariyama, J., G. F. S. Boisramé, and M.R. Brand. 2019. “Water Budgets for the Delta Watershed: Putting Together the Many Disparate Pieces.” San Francisco Estuary and Watershed Science 17(2):3. https://doi.org/10.15447/sfews.2019v17iss2art3.
Azam, F. F., T. Fenchel, J. G. Field, J. S. Gray, L. A. Meyer, and T. F. Thingstad. 1983. “The Ecological Role of Water-Column Microbes in the Sea.” Marine Ecology Progress Series 10(3):257–263. https://www.int-res.com/articles/meps/10/m010p257.pdf.
Bashevkin, S. M., B. Mahardja, and L. R. Brown. 2022. “Warming in the Upper San Francisco Estuary: Patterns of Water Temperature from Five Decades of Data.” Limnology and Oceanography 67:1065–1088. https://doi.org/10.1002/lno.12057.
Baxter, R., R. Breuer, L. Brown, et al. 2008. “Interagency Ecological Program Synthesis of Monitoring Results: Interactions and Effects of Non-Native Species in the San Francisco Estuary.” IEP Newsletter 21(2):12–18.
Bay Institute. 1998. From the Sierra to the Sea: The Ecological History of the San Francisco Bay–Delta Watershed. The Bay Institute of San Francisco. https://aquariumofthebay.org/wp-content/uploads/tbi_sierra-to-the-sea-1998.pdf.
Bedsworth, L., D. Cayan, G. Franco, L. Fisher, and S. Ziaja. 2018. Statewide Summary Report: California’s Fourth Climate Change Assessment. Publication No. SUMCCCA4-2018-013. California Governor’s Office of Planning and Research, Scripps Institution of Oceanography, California Energy Commission, and California Public Utilities Commission. https://www.energy.ca.gov/sites/default/files/2019-11/Statewide_Reports-SUM-CCCA4-2018-013_Statewide_Summary_Report_ADA.pdf.
Bouley, P., and W. J. Kimmerer. 2006. “Ecology of a Highly Abundant, Introduced Cyclopoid Copepod in a Temperate Estuary.” Marine Ecology Progress Series 324:219–228.
Brandt, J. 2018. California Water Use. https://www.usgs.gov/centers/california-water-science-center/science/california-water-use.
Brown, L. R., D. E. Ayers, B. Bergamaschi, et al. 2024. Physics to Fish: Understanding the Factors That Create and Sustain Native Fish Habitat in the San Francisco Estuary. U.S. Geological Survey Open-File Report 2023–1087. https://doi.org/10.3133/ofr20231087.
Brown, L. R., W. Kimmerer, J. Conrad, S. Lesmeister, and A. Mueller–Solger. 2016. “Food Webs of the Delta, Suisun Bay, and Suisun Marsh: An Update on Current Understanding and Possibilities for Management.” San Francisco Estuary & Watershed Science 14(3). https://doi.org/10.15447/sfews.2016v14iss3art4.
Brown, L. R., and D. Michniuk. 2007. “Littoral Fish Assemblages of the Alien-Dominated Sacramento–San Joaquin Delta, California, 1980–1983 and 2001–2003.” Estuaries and Coasts 30(1):186–200. https://doi.org/10.1007/BF02782979.
Brown, L. R., J. K. Thompson, K. Higgins, and L.V. Lucas. 2007. “Population Density, Biomass, and Age-Class Structure of the Invasive Clam Corbicula Fluminea in Rivers of the Lower San Joaquin River Watershed, California.” Western North American Naturalist 67 (4):572–586. https://doi.org/10.3398/1527-0904(2007)67[572:PDBAAS]2.0.CO;2.
Buechi, H., D. Cameron, S. Heard, A. Plantinga, and P. Weber. 2025. Long-term Trends in Wildfire Damages in California. The Nature Conservancy, emLab Issue Brief. https://emlab.ucsb.edu/sites/default/files/documents/wildfire-brief.pdf.
Byrne, M. P., and P. A. O’Gorman. 2015. “The Response of Precipitation Minus Evapotranspiration to Climate Warming: Why the ‘Wet-Get-Wetter, Dry-Get-Drier’ Scaling Does Not Hold Over Land.” Journal of Climate 28(20):8078–8092. https://doi.org/10.1175/JCLI-D-15-0369.1.
Cal-Adapt. 2018. “Home page.” Accessed October 7, 2025. https://cal-adapt.org/.
California Water Library. 2025. “Yolo Bypass and Its Sources.” https://cawaterlibrary.net/wp-content/uploads/2017/09/WeirsBypassesFloodTermsRiverSystems.pdf.
CDWR. 2021. The California Hydroclimate Report, Water Year 2020. Accessed October 17, 2025. https://water.ca.gov/-/media/DWR-Website/Web-Pages/Programs/Flood-Management/Flood-Data/Climate-summaries/Hydroclimate_Report_2020-ADA-FINAL.pdf.
Cheng, S., and J. Huang. 2016. “Enhanced Soil Moisture Drying in Transitional Regions Under a Warming Climate.” JGR Atmospheres 121:2542–2555. https://doi.org/10.1002/2015JD024559.
Cloern, J. E. 2001. “Our Evolving Conceptual Model of the Coastal Eutrophication Problem.” Marine Ecology Progress Series 210:223–253. https://doi.org/10.3354/meps210223.
Cloern, J. E. 2007. “Habitat Connectivity and Ecosystem Productivity: Implications from a Simple Model.” The American Naturalist 169(1):E21–E33. https://doi.org/10.1086/510258.
Cloern, J. E., and A. D. Jassby. 2012. “Drivers of Change in Estuarine-Coastal Ecosystems: Discoveries from Four Decades of Study in San Francisco Bay.” Reviews of Geophysics 50(4):RG4001. https://doi.org/10.1029/2012RG000397.
Cloern, J. E., A. D. Jassby, J. K. Thompson, and K. A. Hieb. 2012. “A Cold Phase of the East Pacific Triggers New Phytoplankton Blooms in San Francisco Bay.” Proceedings of the National Academy of Sciences 109(47):18514–18519.
Cloern, J., S. Safran, L. Vaughn, et al. 2021. “On the Human Appropriation of Wetland Primary Production. Science of the Total Environment 785. https://doi.org/10.1016/j.scitotenv.2021.147097.
Cohen, R. R. H., P. V. Dresler, E. J. P. Phillips, and R. L. Cory. 1984. “The Effect of the Asiatic Clam, Corbicula fluminea, on Phytoplankton of the Potomac River, Maryland.” Limnology and Oceanography 29:17–180. https://doi.org/10.4319/lo.1984.29.1.0170.
Dettinger, M. 2011. “Climate Change, Atmospheric Rivers, and Floods in California–A Multimodel Analysis of Storm Frequency and Magnitude Changes.” Journal of the American Water Resources Association 47(3):514–523. https://doi.org/10.1111/j.1752-1688.2011.00546.x.
Dettinger, M. 2016. “Historical and Future Relations Between Large Storms and Droughts in California.” San Francisco Estuary & Watershed Science 14(2). https://doi.org/10.15447/sfews.2016v14iss2art1.
Dettinger, M. 2024. Climate Change and the Central Valley Project. Presentation to the NASEM Committee to Review the LTO of the CVP and SWP. August 12, 2024.
Dettinger, M., and D. R. Cayan. 2014. “Drought and the California Delta—A Matter of Extremes.” San Francisco Estuary & Watershed Science 12(2). https://doi.org/10.15447/sfews.2014v12iss2art4.
Dettinger, M., A. Wilson, and G. McGurk. 2023. “Keeping Water in Climate-Changed Headwaters Longer.” San Francisco Estuary & Watershed Science 21(4). https://doi.org/10.15447/sfews.2023v21iss4art1.
Dettinger, M. D. 2013. “Atmospheric Rivers as Drought Busters on the US West Coast.” Journal of Hydrometeorology 14(6):1721–1732. https://doi.org/10.1175/JHM-D-13-02.1.
Diffenbaugh, N. S., D. L. Swain, and D. Touma. 2015. “Anthropogenic Warming Has Increased Drought Risk in California.” Proceedings of the National Academy of Sciences 112(13):3931–3936. https://doi.org/10.1073/pnas.1422385112.
DISB (Delta Independent Science Board). 2024. Advancing Scientific Understanding and Management of the Delta Through a Food Web Perspective. Delta Stewardship Council, Sacramento, CA. https://deltacouncil.ca.gov/pdf/isb/products/2024-10-02-isb-food-webs-review.pdf.
Dolby, G. A., R. Hechinger, R. A. Ellingson, L. T. Findley, J. Lorda, and D. K. Jacobs. 2016. “Sea-level Driven Glacial-Age Refugia and Post-Glacial Mixing on Subtropical Coasts, a Palaeohabitat and Genetic Study.” Proceeding of the Royal Society B 283:20161571. http://dx.doi.org/10.1098/rspb.2016.1571.
Drexler, J. Z., C. S. de Fontaine, and D. L. Knifong. 2007. Age Determination of the Remaining Peat in the Sacramento–San Joaquin Delta, California, USA. USGS Open File Report 2007-1303. Sacramento, CA: U.S. Geological Survey. https://pubs.usgs.gov/of/2007/1303/.
Easterling, D. R., K. E. Kunkel, J. R. Arnold, et al. 2017. “Precipitation Change in the United States.” Pp. 207–230 in Climate Science Special Report: Fourth National Climate Assessment, Volume I, edited by D. J. Wuebbles, D. W. Fahey, and K.A. Hibbard. Washington, DC: U.S. Global Change Research Program. https://doi.org/10.7930/J0H993CC.
Enright, C., S. D. Culberson, and J. R. Burau. 2013. “Broad Timescale Forcing and Geomorphic Mediation of Tidal Marsh Flow and Temperature Dynamics.” Estuaries and Coasts 36:1319–1339. https://doi.org/10.1007/s12237-013-9639-7.
Espinoza, V., D. E. Waliser, B. Guan, D. A. Lavers, and F. M. Ralph. 2018. “Global Analysis of Climate Change Projection Effects on Atmospheric Rivers.” Geophysical Research Letters 45(9):4299–4308. https://doi.org/10.1029/2017GL076968.
Fernandez-Bou, A. S., J. P. Ortiz-Partida, C. Pells, et al. 2021. Regional Report for the San Joaquin Valley Region on Impacts of Climate Change. Publication number: SUM-CCCA4-2021-003. https://www.energy.ca.gov/sites/default/files/2022-01/CA4_CCA_SJ_Region_Eng_ada.pdf.
Ferrari, M. C. O., B. D. Wisenden, and D. P. Chivers. 2014. “Chemical Ecology of Predator–Prey Interactions in Aquatic Ecosystems: A Review and Prospectus.” Canadian Journal of Zoology 88(7):698–724. https://doi.org/10.1139/Z10-029.
Fox, J., T. R. Mongan, and W. J. Miller. 1990. “Trends in Freshwater Inflow to San Francisco Bay from the Sacramento-San Joaquin Delta.” Journal of the American Water Resources Association 26(1):101–116. https://doi.org/10.1111/j.1752-1688.1990.tb01355.x.
Gartrell, G., and J. Mount. 2022. Tracking Where Water Goes in a Changing Sacramento–San Joaquin Delta. Public Policy Institute of California.
Ger, K. A., S. J. Teh, and C. R. Goldman. 2010. “Microcystin-LR Toxicity on Dominant Copepods Eurytemora affinis and Pseudodiaptomus forbesi of the Upper San Francisco Estuary.” Science of the Total Environment 409(3):485–491. https://doi.org/10.1016/j.scitotenv.2009.05.043.
Gershunov, A., T. Shulgina, R. E. Clemesha, et al. 2019. “Precipitation Regime Change in Western North America: The Role of Atmospheric Rivers.” Scientific Reports 9(1):9944. https://doi.org/10.1038/s41598-019-46169-w.
Gilbert, G. K. 1917. Hydraulic-Mining Debris in the Sierra Nevada. No. 105. U.S. Geological Survey. https://doi.org/10.3133/pp105.
Global Forest Watch. 2025. “Dashboards.” Accessed October 7, 2025. https://www.globalforestwatch.org/dashboards/country/USA/5/?category=fires&location=WyJjb3VudHJ5IiwiVVNBIiwiNSJd.
Greene, V. E., L. J. Sullivan, J. K. Thompson, and W. J. Kimmerer. 2011. “Grazing Impact of the Invasive Clam Corbula amurensis on the Microbial Food Web in San Francisco Estuary.” Marine Ecology Progress Series 431:183–193. https://doi.org/10.3354/meps09099.
Griffin, D., and K. J. Anchukaitis. 2014. “How Unusual Is the 2012-2014 California Drought?” Geophysical Research Letters 41(24):9017–9023. https://doi.org/10.1002/2014GL062433.
Gronberg, J., N. Dubrovsky, C. Kratzer, J. Domagalski, L. Brown, and K. Burow. 1998. Environmental Setting of the San Joaquin – Tulare Basins, California. U.S. Geological Survey Water-Resources Investigations Report 97-4205. https://pubs.usgs.gov/wri/1997/4205/report.pdf.
Guan, B., N. P. Molotch, D. E. Waliser, E. J. Fetzer, and P. J. Neiman. 2010. “Extreme Snowfall Events Linked to Atmospheric Rivers and Surface Air Temperature Via Satellite Measurements.” Geophysical Research Letters 37:L20401. https://doi.org/10.1029/2010GL044696.
Hamlet, A. F., P. W. Mote, M. P. Clark, and D. P. Lettenmaier. 2005. “Effects of Temperature and Precipitation Variability on Snowpack Trends in the Western United States.” Journal of Climate 18(21):4545–4561. https://doi.org/10.1175/JCLI3538.1.
Han, J., Z. Liu, R. Woods, et al. 2024. “Streamflow Seasonality in a Snow-Dwindling World.” Nature 629(8014):1075–1081. https://doi.org/10.1038/s41586-024-07299-y.
Hasenbein, S., L. M. Komoroske, R. E. Connon, J. Geist, and N. A. Fangue. 2014. “Turbidity and Salinity Affect Feeding Performance and Physiological Stress in the Endangered Delta Smelt.” Environmental Biology of Fishes 97(5):545–554. https://doi.org/10.1093/icb/ict082.
Hoerling, M. P., M. Dettinger, K. Wolter, et al. 2013. Present Weather and Climate: Evolving Conditions.” In Assessment of Climate Change in the Southwest United States: A Report Prepared for the National Climate Assessment, edited by G. Garfin, A. Jardine, R. Merideth, M. Black, and S. LeRoy, 74–100. A report by the Southwest Climate Alliance. Washington, DC: Island Press. https://swccar.arizona.edu/chapter/5.
Hollibaugh, J. T., P. S. Wong, and M. C. Murrell. 2000. “Similarity of DOC Removal by Plankton Communities in Twelve Temperate Estuaries.” Marine Ecology Progress Series 205:15–27.
Houlton, B., and J. Lund. 2018. Sacramento Summary Report. California’s Fourth Climate Change Assessment. Publication number: SUM-CCCA4-2018-002.
Hutton, P., J. Rath, and S. Roy. 2017. “Freshwater Flow to the San-Francisco Bay-Delta Estuary Over Nine Decades (Part 1): Trend Evaluation.” Hydrologic Processes 31(4):2500–2515. https://doi.org/10.1002/hyp.11201.
Immerzeel, W. W., A. F. Lutz, M. Andrade, et al. 2020. “Importance and Vulnerability of the World’s Water Towers.” Nature 577(7790):364–369. https://doi.org/10.1038/s41586-019-1822-y.
IPCC (Intergovernmental Panel on Climate Change). 2021. Climate Change 2021: The Physical Science Basis. Contribution of Working Group I to the Sixth Assessment Report of the Intergovernmental Panel on Climate Change, edited by V. Masson-Delmotte, P. Zhai, A. Pirani, et al. Cambridge, UK and New York: Cambridge University Press. https://doi.org/10.1017/9781009157896.
Israel, J. 2024. Overview of the Central Valley Project and State Water Project, Part 2: Ecology Perspective. Presentation to the NASEM Committee to Review the LTO of the CVP and SWP. January 30, 2024.
Jassby, A. 2008. “Phytoplankton in the Upper San Francisco Estuary: Recent Biomass Trends, Their Causes, and Their Trophic Significance.” San Francisco Estuary & Watershed Science 6(1). https://doi.org/10.15447/sfews.2008v6iss1art2.
Jassby, A. D., and J. E. Cloern. 2000. “Organic Matter Sources and Rehabilitation of the Sacramento–San Joaquin Delta (California, USA).” Aquatic Conservation: Marine and Freshwater Ecosystems 10(5):323–352. https://doi.org/10.1002/1099-0755(200009/10)10:5<323::AID-AQC417>3.0.CO;2-J.
Jassby, A. D., J. E. Cloern, and A. B. Müller-Solger. 2003. “Phytoplankton Fuels Delta Food Web.” California Agriculture 57(4):104–109. https://escholarship.org/uc/item/7888j7fk.
Jassby, A. D., W. J. Kimmerer, S. G. Monismith, et al. 2002. “Isohaline Position as a Habitat Indicator for Estuarine Populations.” Ecological Applications 12(2):442–455. https://doi.org/10.2307/1942069.
Jassby, A. D., and T. M. Powell. 1994. “Hydrodynamic Influences on Interannual Chlorophyll Variability in an Estuary: Upper San Francisco Bay-Delta (California, U.S.A.).” Estuarine, Coastal, and Shelf Science 39(6):595618. https://doi.org/10.1016/S0272-7714(06)80012-0.
Jeffres, C. A., J. J. Opperman, and P. B. Moyle. 2008. “Ephemeral Floodplain Habitats Provide Best Growth Conditions for Juvenile Chinook Salmon in a California River.” Environmental Biology of Fishes 83(4):449–458. https://doi.org/10.1007/s10641-008-9367-1.
Junk, W. J., P. B. Bayley, and R. E. Sparks. 1989. “The Flood Pulse Concept in River-Floodplain Systems.” Canadian Special Publication of Fisheries and Aquatic Sciences 106(1):110–127. https://ftp.cs.ru.nl/toinesmits/Recommended_readings_IWRM_2009/Water_Ecomorphological_principles/1989JunkThe%20flood%20pulse%20concept%20in.pdf.
Kelley, R. 1989. Battling the Inland Sea. Berkeley: University of California Press.
Kimmerer, W. J. 2004. “Open Water Processes of the San Francisco Estuary: From Physical Forcing to Biological Responses.” San Francisco Estuary & Watershed Science 2(1). https://doi.org/10.15447/sfews.2004v2iss1art1.
Kimmerer, W. J. 2008. “Losses of Sacramento River Chinook Salmon and Delta Smelt to entrainment in water diversions in the Sacramento-San Joaquin Delta.” San Francisco Estuary & Watershed Science 6(2). https://doi.org/10.15447/sfews.2008v6iss2art2.
Kimmerer, W. J., E. Gartside, and J. J. Orsi. 1994. “Predation by an Introduced Clam as the Likely Cause of Substantial Declines in Zooplankton of San Francisco Bay.” Marine Ecology Progress Series 113:81–93. https://www.int-res.com/articles/meps/113/m113p081.pdf.
Kimmerer, W. J., and J. J. Orsi. 1996. “Changes in the Zooplankton of the San Francisco Bay Estuary Since the Introduction of the Clam Potamocorbula amurensis.” Pp. 403–424 in San Francisco Bay: The Ecosystem, edited by J. T. Hollibaugh. San Francisco, CA: Pacific Division AAAS.
Kuivila, K. M., and M. L. Hladik. 2008. “Understanding the Occurrence and Transport of Current-Use Pesticides in the San Francisco Estuary Watershed.” San Francisco Estuary & Watershed Science 6(3). https://doi.org/10.15447/sfews.2008v6iss3art2.
Lambeck, K., H. Rouby, A. Purcell, Y. Sun, and M. Sambridge. 2014. “Sea Level and Global Ice Volumes from the Last Glacial Maximum to the Holocene 15296–15303.” Proceedings of the National Academy of Sciences 111(43). http://www.pnas.org/cgi/doi/10.1073/pnas.1411762111.
Lehman, P. W., S. J. Teh, G. Boyer, et al. 2005. “Whole Estuary Distribution and Toxicity of a Microcystis aeruginosa Bloom in San Francisco Estuary.” Aquatic Toxicology 75(3):286–297. https://doi.org/10.1007/s10750-004-4670-0.
Lopez, C. B., J. E. Cloern, T. S. Schraga, et al. 2006. “Ecological Values of Shallow-Water Habitats: Implications for the Restoration of Disturbed Ecosystems.” Ecosystems 9:422–440. https://doi.org/10.1007/s10021-005-0113-7.
Lucas, L. V., and J. K. Thompson. 2012. “Changing Restoration Rules: Exotic Bivalves Interact with Residence Time and Depth to Control Phytoplankton Productivity.” Ecosphere 3(12):1–26. https://doi.org/10.1890/ES12-00251.1.
Lund, J., E. Hanak, W. Fleenor, et al. 2010. Comparing Futures for the Sacramento-San Joaquin Delta. Berkeley, CA: University of California Press.
Lund, J., E. Hanak, W. Fleenor, R. Howitt, J. Mount, and P. Moyle. 2007. Envisioning Futures for the Sacramento-San Joaquin Delta. San Francisco, CA: Public Policy Institute of California.
MacVean, L., S. Thompson, P. Hutton, and M. Sivapalan. 2018. “Reconstructing Early Hydrologic Change in the California Delta.” Water Resource Research 54(1):7767–7790. https://doi.org/10.1029/2017WR021426.
Malamud-Roam, F., M. Dettinger, B. L. Ingram, M. K. Hughes, and J. L. Florsheim. 2007. “Holocene Climates and Connections Between the San Francisco Bay Estuary and Its Watershed: A Review.” San Francisco Estuary & Watershed Science 5(1). http://repositories.cdlib.org/jmie/sfews/vol5/iss1/art3.
McEvoy, D. J., D. W. Pierce, J. F. Kalansky, D. R. Cayan, and J. T Abatzoglou. 2020. “Projected Changes in Reference Evapotranspiration in California and Nevada: Implications for Drought and Wildland Fire Danger.” Earth’s Future 8:e2020EF001736. https://doi.org/10.1029/2020EF001736.
Medellín-Azuara, J., K. T. Paw, Y. Jin, and J. R. Lund. 2018. A Comparative Study for Estimating Crop Evapotranspiration in the Sacramento-San Joaquin Delta. Report for the Office of the Delta Watermaster, California State Water Resources Control Board.
Meko, D., C. Woodhouse, and R. Touchan. 2014. Klamath/San Joaquin/Sacramento Hydroclimatic Reconstructions from Tree Rings. Draft Final Report to California Department of Water Resources. https://cawaterlibrary.net/wp-content/uploads/2017/05/DWR-Tree-Ring-Report.pdf.
Millar, C. I. 2012. “Geologic, Climatic, and Vegetation History of California.” Pp. 49–67 in The Jepson Manual: Vascular Plants of California. 2nd Edition, edited by B. G. Baldwin, D. H. Goldman, D. J. Keil, et al. Oakland, CA: University of California Press.
Moftakhari, M., D. Jay, S. Talke, and D. Schoelhammer. 2015. “Estimation of Historic Flows and Sediment Loads to San Francisco Bay, 1849–2011.” Journal of Hydrology 529(part 3):1246–1261. https://doi.org/10.1016/j.jhydrol.2015.08.043.
Monsen, N. E., J. E. Cloern, L. V. Lucas, and S. G. Monismith. 2007. “A Comment on the Use of Flushing Time, Residence Time, and Age as Transport Time Scales.” Limnology and Oceanography 47(5):1545–1553. https://doi.org/10.4319/lo.2002.47.5.1545.
Mote, P. W., S. Li, D. P. Lettenmaier, M. Xiao, and R. Engel. 2018. “Dramatic Declines in Snowpack in the Western US.” NPJ Climate and Atmospheric Science 1(1):2. https://doi.org/10.1038/s41612-018-0012-1.
Moyle, P. B. 1976. Inland Fishes of California. Oakland, CA: University of California Press.
Moyle, P. B. 2002. Inland Fishes of California (revised and expanded edition). Oakland, CA: University of California Press.
Moyle, P. B., W. A. Bennett, J. R. Durand, and W. E. Fleenor. 2010. California’s Delta Ecosystem: Interactions, Stressors, and Strategies for Management. Public Policy Institute of California.
NOAA. 2021. NOAA National Centers for Environmental Information: Climate at a Glance, Time Series. Palmer Drought Severity Index.
Nobriga, M. L., and F. Feyrer. 2007. “Shallow-water Piscivore-Prey Dynamics in California’s Sacramento–San Joaquin Delta.” San Francisco Estuary & Watershed Science 5(2). https://doi.org/10.15447/sfews.2007v5iss2art4.
Nobriga, M. L., F. Feyrer, R. D. Baxter, et al. 2005. “Fish Community Ecology in an Altered River Delta: Spatial Patterns in Species Composition, Life History Strategies, and Biomass.” Estuaries 28:776–785. https://doi.org/10.1007/BF02732915.
OEHHA (Office of Environmental Health Hazard Assessment). 2018. Indicators of Climate Change in California, California Environmental Protection Agency. https://oehha.ca.gov/climate-change/2018-report-indicators-climate-change-california.
OEHHA. 2022. Indicators of Climate Change in California: Precipitation, Fourth Edition. California Environmental Protection Agency, OEHHA. https://oehha.ca.gov/media/downloads/climate-change/document/2022caindicatorsreport.pdf.
O’Gorman, P. A. 2014. “Contrasting Responses of Mean and Extreme Snowfall to Climate Change.” Nature 512(7515):416–418. https://doi.org/10.1038/nature13625.
Ombadi, M., M. D. Risser, A. M. Rhoades, and C. Varadharajan. 2023. “A Warming-induced Reduction in Snow Fraction Amplifies Rainfall Extremes.” Nature 619(7969):305–310. https://doi.org/10.1038/s41586-023-06092-7.
Overpeck, J. T. 2013. “The Challenge of Hot Drought.” Nature 503(7476):350–351. https://doi.org/10.1038/503350a.
Payne, A. E., M. E. Demory, L. R. Leung, et al. 2020. “Responses and Impacts of Atmospheric Rivers to Climate Change.” Nature Reviews Earth & Environment 1(3):143–157. https://doi.org/10.1038/s43017-020-0030-5.
Payton, E. A., A. O. Pinson, T. Asefa, et al. 2023. “Water.” Chapter 4 in Fifth National Climate Assessment, edited by A. R. Crimmins, C. W. Avery, D. R. Easterling, et al. Washington, DC: U.S. Global Change Research Program. https://doi.org/10.7930/NCA5.2023.
Persad, G. G., D. L. Swain, C. Kouba, and J. P. Ortiz-Partida. 2020. “Inter-Model Agreement on Projected Shifts in California Hydroclimate Characteristics Critical to Water Management.” Climatic Change 162:1493–1513. https://doi.org/10.1007/s10584-020-02882-4.
PPIC (Public Policy Institute of California). 2024. “Groundwater in California.” https://www.ppic.org/publication/groundwater-in-california/.
Robinson, A.H., S.M. Safran, J. Beagle, R.M. Grossinger, J.L. Grenier, and R.A. Askevold. 2014. A Delta Transformed: Ecological Functions, Spatial Metrics, and Landscape Change in the Sacramento-San Joaquin Delta. SFEI Publication #729.
RWQCB (California Regional Water Quality Control Board). 2019. The Water Quality Control Plan (Basin Plan) for the California Regional Water Quality Control Board Central Valley Region, fifth edition revised February 2019 (with approved amendments). https://www.waterboards.ca.gov/rwqcb5/water_issues/basin_plans/sacsjr_201902.pdf.
Scholz, N. L., N. K. Truelove, B. L. French, et al. 2000. “Diazinon Disrupts Antipredator and Homing Behaviors in Chinook Salmon (Oncorhynchus tshawytscha).” Canadian Journal of Fisheries and Aquatic Sciences 57(9):1911–1918. https://cdnsciencepub.com/doi/abs/10.1139/f00-147.
Sexstone, G. A., D. W. Clow, S. R. Fassnacht, G. E. Liston, C. A. Hiemstra, J. F. Knowles, and C. A. Penn. 2018. “Snow Sublimation in Mountain Environments and Its Sensitivity to Forest Disturbance and Climate Warming.” Water Resources Research 54(2):1191–1211. https://doi.org/10.1002/2017WR021172.
SFEI (San Francisco Estuary Institute). 2012. A Delta Transformed: Ecological Functions, Spatial Metrics, and Landscape Change in the Sacramento–San Joaquin Delta. SFEI Publication #672.
SFEI. 2016. Delta Renewed: A Guide to Science-Based Ecological Restoration in the Sacramento–San Joaquin Delta. SFEI Publication #799.
Siddall, M., E. Rohling, A. Almogi-Labin, et al. 2003. “Sea-level Fluctuations During the Last Glacial Cycle.” Nature 423:853–858. https://doi.org/10.1038/nature01690.
Siirila-Woodburn, E. R., A. M. Rhoades, B. J. Hatchett, et al. 2021. “A Low-to-No Snow Future and Its Impacts on Water Resources in the Western United States.” Nature Reviews Earth & Environment 2(11):800–819. https://doi.org/10.1038/s43017-021-00219-y.
Sobczak, W. V., J. E. Cloern, A. D. Jassby, and A. B. Müller-Solger. 2002. “Bioavailability of Organic Matter in a Highly Disturbed Estuary: The Role of Detrital and Algal Resources.” Proceedings of the National Academy of Sciences 99(12):8101–8105. https://doi.org/10.1073/pnas.122614399.
Sommer, T. 2024. Bay-Delta Hydrology. Presentation to the NASEM Committee to Review the LTO of the CVP and SWP. January 30, 2024.
Sommer, T. R., R. Baxter, and B. Herbold. 1997. “Resilience of Splittail in the Sacramento–San Joaquin Estuary.” Transactions of the American Fisheries Society 126(6):961–976. https://doi.org/10.1577/1548-8659(1997)126<0961:ROSITS>2.3.CO;2.
Sommer, T. R., W. C. Harrell, and M. L. Nobriga. 2001. “Floodplain Rearing of Juvenile Chinook Salmon: Evidence of Enhanced Growth and Survival.” Canadian Journal of Fisheries and Aquatic Sciences 58(2):325–333. https://doi.org/10.1139/f00-245.
Stepanauskas, R., M. Moran, B. Bergamaschi, et al. 2005. “Sources, Bioavailability, and Photoreactivity of Dissolved Organic Carbon in the Sacramento–San Joaquin River Delta.” Biogeochemistry 74:131–149. https://doi.org/10.1007/s10533-004-3361-2.
Stewart, I. T., D. R. Cayan, and M. D. Dettinger. 2004. “Changes in Snowmelt Runoff Timing in Western North America Under a Business as Usual Climate Change Scenario.” Climatic Change 62(1):217–232. https://doi.org/10.1023/B:CLIM.0000013702.22656.e8.
Stine, S. 1994. “Extreme and Persistent Drought in California and Patagonia During Mediaeval Time.” Nature 369:546–549. https://doi.org/10.1038/369546a0.
Sumer, D. 2024. Overview of the Central Valley Project and the State Water Project. Preamble: Modeling for LTO Operation and Actions. Presentation to the NASEM Committee to Review the LTO of the CVP and SWP. February 28, 2024.
Swain, D. L., B. Langenbrunner, J. D. Neelin, and A. Hall. 2018. “Increasing Precipitation Volatility in Twenty-First-Century California.” Nature Climate Change 8(5):427–433. https://doi.org/10.1038/s41558-018-0140-y.
Szlemp, E. 2020. “Analysis of the Tidal Range in the Sacramento San Joaquin Delta from 1857 to Present.” In partial fulfillment of the requirements for the degree Master of Science in Civil and Environmental Engineering, California Polytechnic State University, San Luis Obispo, CA. https://digitalcommons.calpoly.edu/theses/2166/.
Taft, O. W., and S. M. Haig. 2005. “The Value of Agricultural Wetlands as Invertebrate Resources for Wintering Shorebirds.” Agriculture, Ecosystems & Environment 110(3–4):249–256. https://doi.org/10.1016/j.agee.2005.04.012.
Thompson, J. K. 1957. “Settlement Geography of the Sacramento-San Joaquin Delta, California.” PhD dissertation, Stanford University.
Tockner, K., D. Pennetzdorfer, N. Reiner, F. Schiemer, and J. V. Ward. 1999. “Hydrological Connectivity, and the Exchange of Organic Matter and Nutrients in a Dynamic River–Floodplain System (Danube, Austria).” Freshwater Biology 41(3):521–535. https://doi.org/10.1046/j.1365-2427.1999.00399.x.
Tollefson, J. 2025. “Earth Breaches 1.5°C Climate Limit for the First Time: What Does It Mean?” Nature 637(8047):769–770. https://EconPapers.repec.org/RePEc:nat:nature:v:637:y:2025:i:8047:d:10.1038_d41586-025-00010-9.
Turdo, M., J. Abatzoglou, S. Herrera, and I. Cvijanovic. 2023. “Anthropogenic Climate Change Impacts Exacerbate Summer Forest Fires in California.” Proceedings of the National Academy of Sciences 120(5). https://doi.org/10.1073/pnas.2213815120.
USGCRP (U.S. Global Change Research Program). 2023. 5th National Climate Assessment. https://toolkit.climate.gov/sites/default/files/2025-07/NCA5_Ch2_Climate-Trends.pdf.
USGS (U.S. Geological Survey). 2018a. “Land Subsidence in the San Joaquin Valley.” https://www.usgs.gov/centers/land-subsidence-in-california/science/land-subsidence-san-joaquin-valley.
USGS. 2018b. “Land Subsidence in the Sacramento – San Joaquin Delta.” https://www.usgs.gov/centers/land-subsidence-in-california/science/subsidence-sacramento-san-joaquin-delta.
Walters, R. A. 1982. “Low-frequency Variations in Sea Level and Currents in South San Francisco Bay.” Journal of Physical Oceanography 12:54–64.
Wang, H., J. Liu, M. Klaar, A. Chen, L. Gudmundsson, and J. Holden. 2024. “Anthropogenic Climate Change Has Influenced Global River Flow Seasonality.” Science 383(6686):1009–1014. https://doi.org/10.1126/science.adi9501.
Wang, S. Y. S., J. H. Yoon, E. Becker, and R. Gillies. 2017. “California from Drought to Deluge.” Nature Climate Change 7(7):465–468. https://doi.org/10.1038/nclimate3330.
Werner, I., L. A. Deanovic, D. Markiewicz, et al. 2010. “Monitoring Acute and Chronic Water Column Toxicity in the Northern Sacramento–San Joaquin Estuary, California, USA.” Environmental Toxicology and Chemistry 29(10):2190–2199. https://doi.org/10.1002/etc.281.
Werner, I., and J. T. Hollibaugh. 1993. “Potamocorbula amurensis: Comparison of Clearance Rates and Toxicant Sensitivity with Corbicula fluminea and Mytilus galloprovincialis.” San Francisco Estuary Project Technical Report.
Whipple, A. A., R. M. Grossinger, D. Rankin, B. Stanford, and R. A. Askevold. 2012. Sacramento-San Joaquin Delta Historical Ecology Investigation: Exploring Pattern and Process. Prepared for the California Department of Fish and Game and Ecosystem Restoration Program. A Report of SFEI-ASC’s Historical Ecology Program, SFEI-ASC Publication #672. San Francisco Estuary Institute-Aquatic Science Center, Richmond, CA.
Williams, A. P., J. T. Abatzoglou, A. Gershunov, et al. 2019. “Observed Impacts of Anthropogenic Climate Change on Wildfire in California.” Earth’s Future 7(8):892–910. https://doi.org/10.1029/2019EF001210.
Williams, A. P., E. R. Cook, J. E. Smerdon, et al. 2020. “Large Contribution from Anthropogenic Warming to an Emerging North American Megadrought.” Science 368(6488):314–318. DOI: 10.1126/science.aaz9600.
Williams, A. P., B. Livneh, K. A. McKinnon, et al. 2022. “Growing Impact of Wildfire on Western US Water Supply.” Proceedings of the National Academy of Sciences 119(10):e2114069119. https://doi.org/10.1073/pnas.2114069119.
Williams, A. P., R. Seager, J. T. Abatzoglou, B. I. Cook, J. E. Smerdon, and E. R. Cook. 2015. “Contribution of Anthropogenic Warming to California Drought During 2012–2014.” Geophysical Research Letters 42(16):6819–6828. https://doi.org/10.1002/2015GL064924.
Williams, J. G. 2006. “Central Valley Salmon: A Perspective on Chinook and Steelhead in the Central Valley of California.” San Francisco Estuary & Watershed Science 4(3). https://doi.org/10.15447/sfews.2006v4iss3art2.
Wright, S. A., and D. H. Schoellhamer. 2004. “Trends in the Sediment Yield of the Sacramento River, California, 1957–2001.” San Francisco Estuary & Watershed Science 2(2). https://doi.org/10.15447/sfews.2004v2iss2art2.
Zhou, S., B. Yu, B. R. Lintner, K. L. Findell, and Y. Zhang. 2023. “Projected Increase in Global Runoff Dominated by Land Surface Changes.” Nature Climate Change 13(5):442–449. https://doi.org/10.1038/s41558-023-01659-8.
Zierdt-Smith, E. L., K. H. Shrader, J. K. Thompson, F. Parchaso, K. Gehrts, and E. Wells. 2023. Bivalve Effects on the Food Web Supporting Delta Smelt—A Spatially Intensive Study of Bivalve Recruitment, Biomass, and Grazing Rate Patterns with Varying Freshwater Outflow in 2019. U.S. Geological Survey Open-File Report 2022–1102. http://doi.org/10.3133/ofr20221102.
Zimmerman, J., D. Carlisle, J. May, et al. 2017. “Patterns and Magnitude of Flow Alteration in California, USA.” Freshwater Biology 63:859–873. https://doi.org/10.1111/fwb.13058.


