Review of the Long-Term Operations of the Central Valley Project and the State Water Project (2026)
Chapter: 2 Shasta Coldwater Pool Management
2
Shasta Coldwater Pool Management
The Committee’s statement of task requires it to assess the state of science for the Shasta Coldwater Pool Management Action as it relates to long-term operations of the Central Valley Project (CVP) and, where applicable, the State Water Project (SWP). In addition, the Committee was asked to recommend how modeling, monitoring, and decision support strategies and tools can better support Shasta coldwater pool management. Hence, the focus of this chapter is on winter-run Chinook salmon, which is the target of the coldwater pool management action.
Winter-run Chinook salmon historically migrated through the Delta and up the Sacramento River to spawn in the stable, cold spring-fed headwaters of the Sacramento, Pit, and McCloud rivers, as well as in Battle Creek. The historic spawning habitats in the first three rivers lie upstream of Project dams, such that nearly all adult holding and spawning, as well as egg and alevin incubation and rearing, now takes place in an ~20 km reach of the Sacramento River below Keswick Dam (NMFS, 2014; Windell et al., 2017). The isolation of the current winter-run Chinook salmon population from reliable historic spawning and rearing habitats has placed the population at risk, and keeping the current spawning grounds cold enough for optimal spawning is a substantial management challenge. Indeed, the status of the Sacramento River winter-run Chinook salmon population has declined in the last five years, with the single spawning population below Keswick Dam having a high risk of extinction (NMFS, 2024a). The Shasta Coldwater Pool Management Action aims to ensure that water cold enough to support adult holding and spawning and egg incubation is present in the reaches downstream of Keswick Dam at the appropriate times of year so that that winter-run can reproduce with enough success for the species to survive.
This chapter first provides background on the Shasta Coldwater Pool Management Action, including descriptions of the infrastructure used to provide cold water and the seasonal timeline for decisions. It then discusses the roles of physical and biological monitoring data and the use of models related to the action. Finally, the chapter highlights aspects of the action where improved scientific understanding could significantly affect how the action is conducted and supported.
The existing scientific understanding supports a three-pronged approach to Shasta management: (1) improving conditions downstream of Keswick Dam, (2) continuing propagation and supplementation including hatcheries management, and (3) reintroduction of winter-run Chinook salmon above Shasta Dam and in Battle Creek. Improving conditions downstream of Keswick Dam and continuing propagation and supplementation will be necessary for winter-run Chinook salmon’s survival for as long as the species depends on that reach as its primary spawning habitat. Incremental improvements to each approach are possible, as discussed in the chapter. Nevertheless,
approaches (1) and (2) will likely be insufficient to sustain and recover the species. The most promising longer-term alternative is reintroduction of winter-run Chinook salmon to their historic spawning habitats.
DESCRIPTION OF THE SHASTA DIVISION AND THE COLDWATER POOL MANAGEMENT ACTION
Figure 2-1 shows the geography of the Shasta Division of the CVP. Shasta Dam, located about 10 miles north of Redding, was completed in 1945 and is the CVP’s principal storage facility. The dam impounded the upper Sacramento River and created Shasta Reservoir, which is the largest water storage facility in California and the ninth largest storage facility in the United States.1 The reservoir has a surface area of about 30,000 acres at full pool and a maximum depth of 517 feet. The dam is 0.6 miles wide and 600 feet tall. It is one of the 10 highest dams in the United States, and it has a maximum capacity of 4.5 million acre-feet of water.2 It receives runoff from a 6,665 square mile drainage basin. Shasta Dam was primarily constructed to provide irrigation water to the Central Valley, flood control, and hydropower generation. Water released through the turbines at Shasta Dam provides hydropower with an average value of $50 million annually.3
The Shasta Division of the CVP also includes Trinity Reservoir, which is large and deep, with 2.45 million acre-feet of storage. Because of the altitude of its catchment, its water is colder than that of Shasta Reservoir (Patton, 2024; USBR, 2024a). Water released from Trinity Dam flows a short distance to Lewistown Reservoir, which serves as a re-regulating reservoir for Trinity Dam. From Lewistown, water can flow through its powerhouse and/or spillway and then downstream, meeting demands and requirements for in-basin Trinity River flows, or it can be diverted through Clear Creek Tunnel into Whiskeytown Reservoir. (A powerhouse is located at the end of this tunnel.) Whiskeytown Reservoir also receives some inflow from the upper Clear Creek catchment. Some releases from Whiskeytown Dam flow south down Clear Creek to meet environmental requirements and fisheries; Clear Creek eventually flows into the Sacramento River near the I-5 crossing below Keswick Reservoir. However, most water from Whiskeytown Reservoir exits through Spring Creek Tunnel and its powerhouse into Keswick Reservoir. This is the primary route for cold water in Trinity Reservoir to reach the Sacramento River to meet CVP water demands; hydropower is generated as it passes through three powerhouses. Keswick Reservoir is large enough to regulate highly variable flows from Shasta’s powerhouse and thus to modulate releases down the Sacramento River, except during flood operations.
Shasta Reservoir is fed by rivers and streams that feed into five major arms: the Pit River, Sulanharas Creek,4 the McCloud River, the Sacramento River, and Backbone Creek Inlet. The longest arm of the reservoir stretches approximately 35 miles from the dam. Shasta Reservoir stratifies annually, resulting in warm surface waters (i.e., epilimnion) sitting above deeper, colder waters (hypolimnion). The thermocline is the boundary between the layers where water density and temperature change rapidly. During drought years, when the thermocline is at a low elevation, delivering cold water from Shasta Reservoir to Keswick Dam can be challenging. Furthermore, the water downstream of Keswick Dam can warm rapidly during summer conditions, further contracting the downstream extent of coldwater habitat needed for spawning of winter-run Chinook salmon in summer. The drought years (1976–1977, 2007–2009, 2012–2016, 2020–2022) significantly affected reservoir and river temperatures and are believed to have caused sharp declines in the winter-run population (USBR, 2024b).
Although coldwater pool management affects only a portion of the many habitats that winter-run Chinook salmon use throughout their life, the area and time frame targeted by the action are critical to the species’ survival. To support winter-run Chinook salmon, stream habitats need suitable temperature and flow conditions for spawning, egg incubation, and fry emergence during the period from May to October. A stream temperature in the low- to mid-50s F has been considered necessary for reproductive success and survival of winter-run Chinook salmon (McCullough, 1999). In addition, clean, well-oxygenated gravel substrates (often located on riffles) are
___________________
1See https://npdp.stanford.edu/largestusreservoirs.
2See https://www.usbr.gov/mp/mpr-news/docs/factsheets/shasta-dam.pdf.
3See https://www.usbr.gov/projects/index.php?id=552.
4Renamed in 2022 by the Board on Geographic Names.

SOURCE: Kevin Lear, International Mapping Associates.
necessary for spawning, although their availability can be limited in the portion of the system where winter-run spawning occurs under current conditions. After hatching, juveniles rely on instream cover, such as woody debris, submerged aquatic vegetation, and riffle–pool sequences, to provide refuge from predators and to facilitate foraging. Habitat complexity in this region of the Sacramento River has been reduced by channelization, channel incision, bank armoring, and levee construction, which have subsequently reduced access to floodplain and wetland rearing habitats (Herbold et al., 2018; San Francisco Estuary Partnership, 2019). The remaining habitat is of poor quality (Lindley et al., 2009; NMFS, 2014, 2016, 2024a). Although restoration efforts, such as gravel augmentation and riparian habitat improvements, aim to enhance spawning and rearing habitats, a combination of poor habitat quality downstream of Keswick Dam and limited coldwater availability have limited the effectiveness of these actions in restoring salmon populations, necessitating ongoing dependence on the Livingston Stone National Fish Hatchery to maintain winter-run populations via artificial propagation and supplementation. This chapter focuses on the coldwater management aspect of winter-run Chinook salmon survival and recovery.
Components of Coldwater Pool Management
The Shasta Coldwater Pool Management Action includes several key components. The main component is releasing water of a certain temperature and flow rate by operating the Temperature Control Device (TCD) within Shasta Reservoir and via diversions from Whiskeytown Reservoir (which receives water from the Trinity Reservoir). The action is supported by a wide range of planning, monitoring, and modeling activities that assess physical and ecological conditions within the reservoir/river system. For example, every year in February, the U.S. Bureau of Reclamation (USBR) develops a seasonal temperature management plan that establishes target releases from Shasta Reservoir based on climatological projections and estimates of the anticipated coldwater pool volume in the Shasta and Trinity reservoirs. Hence, modeling water temperature within the reservoir and predicting the available coldwater pool volume over time are central to the action. Finally, the winter-run Chinook salmon hatchery program to supplement natural recruitment is mentioned, given its role in maintaining fish populations alongside coldwater pool management.
Flow Releases and Use of the Temperature Control Device
Water temperatures within Shasta Reservoir typically range approximately 6–27°C (42.8–80.6°F) annually across the volume of the reservoir, reaching a seasonal minimum in late winter or early spring before warming to a summer maximum. As with many large lakes and reservoirs, during spring and summer Shasta Reservoir undergoes vertical thermal stratification, which causes water temperature to vary significantly with depth, with colder, denser water overlain by warmer surface waters (Boehrer and Schultze, 2008; Ford and Johnson, 1983). During the stratified period, surface waters frequently exceed 22°C (71.6°F), while bottom waters typically remain below 10°C (50°F), with a steep thermal transition that defines the top of the coldwater pool (Daniels et al., 2018; Lieberman and Horn, 1998). The coldwater pool itself is defined as the volume of water between the thermocline and dead pool elevation.5 To take advantage of this stratification, in 1997 USBR installed a TCD on Shasta Dam to enable selective withdrawals from different reservoir elevations and hence different temperatures (Box 2-1). The installation of the TCD was a major step in optimally using the cold water from Shasta Reservoir to provide a specified minimum water temperature for fish habitat downstream of Keswick Dam.
The use of the TCD has not been without challenges, including potential leakage around the gates (which has been blamed for difficulties in accurately delivering waters to achieve release temperature targets, [USBR, 2024a]). Some effort has been made to characterize the precise flow patterns into the TCD, including the actual elevations from which water is predominantly being withdrawn. Studies were conducted by Resource Management Associates (2003) to estimate the leakage around the TCD, and on occasion a remotely operated camera has also been used to assess gate closure. Currently the University of California (UC), Davis, is working with USBR to experiment with upward-looking Acoustic Doppler Current Profilers (ADCPs) to quantify the flow behavior into
___________________
5Dead pool elevation is the lowest elevation in the reservoir below which water cannot be released.
BOX 2-1
The Temperature Control Device at Shasta Reservoir
Shasta Dam was retrofitted with a TCD at a cost of $80 million to enhance USBR’s ability to regulate the temperature of releases, primarily for sustaining viable downstream fish habitat while avoiding loss of hydropower generation (Hanna et al., 1999). At the time of completion in February 1997, this was one of the most innovative and large-scale structural adaptations to a large dam in the United States. The TCD is a 250-ft wide and 300-ft high structure that consists of upper, middle, and lower gates (Figure 2-2). There is a separate unit for each of the five penstocks. For a given unit, the upper, middle, and lower gates can be opened individually or in combination to withdraw water from specific thermal layers in the reservoir. Below the gates, each unit is also equipped with a side gate located at an even lower elevation that enables access to deeper hypolimnetic water not available through the main gates. This design enables temperature blending across a broad vertical range of the reservoir, which is especially valuable during drought or low-storage conditions when cold water is in short supply.
Operators can reposition the TCD gates vertically to align with the desired thermal layer, and transitions between gate settings can be made within a few hours. Each penstock is instrumented with temperature and flow measurement devices with values recorded every 15 minutes. These devices inform hydropower operations and temperature management decisions. However, no continuous temperature sensors are embedded within or on the TCD structure itself, limiting real-time vertical profiling capability at the intake face.
The TCD’s difficulties with temperature releases and stabilization of water temperatures in the river downstream of Shasta could be related to leakage around the gates. To remedy this situation, particularly under severe drought conditions and low reservoir water surface elevations, USBR has considered installing impermeable curtains on the middle TCD gates. The curtains could help reduce leakage of warm water and provide greater control of the temperature of water releases (NMFS, 2024b, Section 7.9.3). The decision to temporarily install these curtains would depend on many factors, including the lake surface elevation, depth of the thermocline, duration of the drought, prevailing ambient conditions, and the estimated reduction in downstream temperatures. Internal mixing processes and circulation in the reservoir also could play a role in the observed temperature fluctuations. For example, as water is entrained into the TCD, the vertical temperature profile is likely to be altered locally (Hanna et al., 1999). Seiching within the reservoir can create vertical fluctuations over a period of hours to days (as discussed in a later section).
Managing Shasta Dam in general, and operating the TCD in particular, to achieve a downstream target temperature is not trivial and relies heavily on the skill and experience of the dam operators, who must balance several factors (USBR, 2017). They must determine the volume of water to be released, taking into account hydropower operations, and they must decide how many and which turbines to use. The net temperature downstream of the dam is affected by the blending of water from multiple different pathways including from Spring Creek Tunnel. In addition, the operator needs to anticipate water temperature changes during river transit between Shasta and Keswick, during the period the water is resident in Keswick Reservoir, and after mixing with releases from Whiskeytown Reservoir via Clear Creek. To ease management somewhat, USBR could develop decision support software that incorporates the Water Temperature Modeling Platform (see modeling discussion) and measurements of the vertical reservoir temperatures. That software could guide operators on optimal ways to use releases from Shasta Reservoir to achieve downstream flow and temperature targets.

NOTES: There are 10 river release gates at three elevations, each approximately 8 feet in diameter that release directly into the Sacramento River. The TCD feeds water into the penstocks that lead to the powerhouse. Elevations are relative to mean sea level. Powerhouse units 1 through 5 are shown for reference.
SOURCES: (A) Figure 8 in Daniels et al. (2018); (B) USBR (2024c).
the TCD under different release criteria and under different reservoir conditions.6 This study shows promise and was underway during the preparation of this report; no results are yet available. Furthermore, despite substantial investment in the TCD, in auxiliary screens, and in cooling systems to manage extreme drought conditions, relatively little attention has been paid to vertical temperature fluctuations that occur more frequently than the current weekly or biweekly monitoring can detect, such as fluctuations caused by seiching within the reservoir. These issues are discussed in the subsequent section on monitoring.
Forecasting Release Temperatures and Coldwater Pool Volume
Shasta coldwater pool management is guided by complex modeling and decision-making processes. The general goal of those processes is to balance the need to predict water availability and to prepare for future water needs with the need to maintain operational flexibility. If USBR errs on the side of retaining cold water, then deliveries may be lower, or they may be released after water users have already planned for lower delivery levels. If USBR errs on the side of early-season releases, then it may have insufficient cold water to support both winter-run and fall-run Chinook salmon through the summer and fall. Because of these stakes, and because an explanation of the decision-making processes will help readers understand some of the chapter’s recommendations, the following paragraphs describe the decision-making criteria and steps in detail.
In 2004, USBR started to write water temperature management plans for Shasta Reservoir based on predictions of the coldwater pool volume and spring/summer climatological forecasts. Applicable to the May through October time frame, a typical water temperature management plan establishes temperature requirements at various locations and estimates potential winter-run Chinook salmon egg mortality, dates for operation of the side gates on the TCD, and coldwater pool volume at the end of September. USBR monitors the coldwater pool, compares the projected coldwater pool with observations, tracks actual performance during implementation of the temperature management plan, and provides regular updates to the Sacramento River Group (SRG) throughout plan implementation.
In March, April, and May—prior to the temperature management season—USBR uses seasonal air temperature forecasts and historical meteorological data (USBR, 2025) to model projected inflows, estimate water availability, and evaluate end-of-April and end-of-September storage targets. In coordination with the SRG, USBR selects one of five inflow forecast scenarios, each based on a different inflow exceedance probability—a statistical representation of the likelihood that future reservoir inflows will meet or exceed a given value. A high exceedance probability (e.g., 90 percent) reflects more conservative planning because there is a 90 percent chance that inflows will reach or exceed the modeled value. In contrast, a low exceedance probability (e.g., 10 percent) reflects more aggressive planning because there is only a 10 percent chance that inflows will be as high or higher than the modeled value. High exceedance probability is more common during drier conditions and when water availability is lower, in order to reduce the risk of overcommitting cold water early in the season. A 10 percent exceedance forecast is more likely to be chosen during wetter conditions, although this increases the risk of inadequate coldwater reserves if actual inflows fall short. Use of a medium exceedance threshold (e.g., 50 percent or 70 percent) may result in higher anticipated deliveries and earlier coldwater use; however, if inflows underperform, then end-of-September storage may fall below planning targets, reducing the ability to meet temperature objectives during late summer and fall egg incubation.
In February of each year, the SRG starts to evaluate data and discuss scenarios. Each month after February, USBR creates an operational forecast and performs a water temperature model run. In mid-April, USBR typically prepares updated projections of anticipated temperature management capability including considerations from updated hydrologic and runoff forecasts; those projections are shared at SRG meetings. In April and May, the operators evaluate the volume of coldwater pool available. They release a draft temperature management plan at the end of April or early May and finalize that plan at the end of May or early June.
The 2024 Record of Decision for the Long-term Operations of the Central Valley Project (USBR, 2024d) adopts a new approach for setting specific objectives for the Shasta coldwater pool management season. As shown in Table 2-1, under this new “bin” approach, the overall action is classified as Bin 1, 2, or 3, along with two
___________________
6This sentence was edited after release of the report to clarify the partnership between UC Davis and USBR.
TABLE 2-1 Requirements for Various Elements of Shasta Coldwater Pool Management, by Bin
| Designations | Bin 1A | Bin 1B | Bin 2A | Bin 2B | Bin 3A | Bin 3B |
|---|---|---|---|---|---|---|
| Estimated Frequency | 80% of years | ~11.5% of years | ~8.5% of years | |||
| End-of-April Storage (MAF) | ≥ 3.7 | 3.0–3.7 | < 3.0 | |||
| End-of-September (EOS) Storage (MAF) | ≥ 3.0 | ≥ 2.4 | 2.2–2.4 | 2.0–2.2 | > 2.0 | < 2.0 |
| Operational Goals | Increase EOS ≥ 2.4 MAF. If impossible, shift into Bin 2A | Increase EOS ≥ 2.2 MAF. If impossible, shift into Bin 2B | Increase EOS ≥ 2.0 MAF. If impossible, shift into Bin 3A | Increase EOS ≥ 2.0 MAF. If impossible, shift into Bin 3B | Increase EOS ≥ 2.0 MAF. If impossible, identify system priorities and contingencies | |
| Biological Objective | Enhance | Recover | Maintain | Protect | ||
| Temperature Target | Average daily water temperature 53.5°F (11.9°C) (determined by BiOps; subject to change with future scientific research) | |||||
| Compliance Point | Downstream of CCR gage | At the CCR gage | Upstream of the CCR gage | |||
| Temperature-Dependent Mortality | ≤ 3% | ≤ 30% | ||||
| Temperature Management for Winter-Run Chinook Salmon | Manage all spawning habitat | Manage the majority of spawning habitat | Manage spawning habitat during the critical periods of spawning and egg incubation | |||
NOTES: CCR = Clear Creek compliance location; EOS = end-of-September; MAF = million acre-feet.
SOURCE: NMFS (2024b).
subcategories: A (standard) and B (drought protection). Bin number (1, 2, or 3) is defined by the projected end-of-April storage, which is primarily driven by hydrology, and it considers forecasted end-of-September storage (USBR, 2025). The letter of the bin (A or B) is primarily driven by the expected demands on the reservoir, which are a function of hydrology, meteorology, systemwide conditions, contractual requirements, and other conditions. The “A” bins are years when the expected demand on the reservoir is lower, with the potential of affording better drought protection if the following year is dry. The “B” bins designate drought protection and are intended to increase the priority of storage conservation to address the possibility that the current year is likely to be a drought.
The bin designation begins in February, with updates once per month until mid-April. During a two-week period (May 1–14) following bin determination and before the beginning of the temperature management season, uncertainty with inflows and late-spring weather conditions may impact storage volumes. The temperature management plan drafted each year by USBR (in coordination with the SRG) contains the bin-specific operational, thermal, and biological objectives for adult holding, spawning, and egg incubation, along with projected reservoir releases, assumed meteorological conditions, anticipated water temperatures and target locations, and temperature-dependent mortality estimates (Table 2-1). USBR finalizes the temperature management plan in May or later through coordination with the SRG and the Shasta Operations Team (SHOT).
Winter-Run Chinook Salmon Hatchery
Although technically not part of the Shasta Coldwater Pool Management Action, the hatchery program is discussed here because of its role in supplementing winter-run stocks, especially in years when coldwater pool management cannot or does not deliver water below the required target temperatures. The Livingston Stone National Fish Hatchery (established in 1997 by the U.S. Fish and Wildlife Service [USFWS] just downstream of Shasta Dam) is designed to serve as a genetic safety net, supplementing the wild population while attempting to maintain genetic diversity (NMFS, 2019). Each spring, wild winter-run Chinook salmon adults are collected from
the Sacramento River and held at the hatchery until spawning occurs between June and August. After fertilization, eggs are incubated at the hatchery, and the juveniles are reared through the winter before release into the Sacramento River near Redding the following April. Increasing hatchery output in years when coldwater pool storage is insufficient to meet temperature objectives is a management lever to mitigate thermal mortality among in-river eggs and fry (USBR, 2024a).
Although the hatchery has helped buffer the population during periods of extreme environmental stress, its effectiveness in aiding long-term recovery is questionable. One concern is the potential for hatchery-origin fish to interbreed with natural-origin fish, leading to reduced reproductive success, domestication selection, and loss of locally adapted traits. Such concerns are echoed broadly among fisheries conservation ecologists (Araki et al., 2007; Bert et al., 2007; Naish et al., 2007). The proportion of hatchery-origin spawners within the winter-run population is a key indicator of this risk. Recent estimates suggest that hatchery-origin fish comprise a small enough proportion of the population to only present a moderate risk of extinction due to reduced fitness in natural spawning conditions (NMFS, 2019), but that risk can shift dramatically during successive drought years when native returns decline over a prolonged period. NMFS (2024b) identified the influence of hatchery broodstock as a key factor negatively influencing Chinook populations that remain at a high risk of extinction. Hatchery-origin fish differ behaviorally from their wild counterparts and often have lower survival, and perhaps more importantly, reduced reproductive success, which in turn imperils the wild stock with which they interbreed (Berejikian et al., 2005; CDWR and USBR, 2024).
The hatchery’s role in population supplementation presents ecological and demographic tradeoffs. It provides a buffer against catastrophic recruitment failure, especially during years when coldwater pool volume is insufficient to protect natural incubating eggs, and it can be used to augment populations in historically productive coldwater streams. For example, fertilized hatchery eggs have been used to support reintroduction efforts in Battle Creek (NMFS, 2024b). However, the use of hatchery fish, as a replacement strategy, risks masking continued habitat degradation and may delay or displace investment in the restoration of thermal and hydraulic conditions essential to rebuilding a self-sustaining population (Hilborn, 1992; McMillan et al., 2023). Livingston Stone maintains a broodstock reserve as a multi-year hedge against poor adult escapement, but this buffer is only viable for about three years. Extended droughts, which are increasingly likely under a warming climate (see Appendix A), could exhaust this reserve and expose the hatchery’s limits as a long-term insurance policy (NMFS, 2019).
Despite the implementation of best genetic management practices—including factorial mating schemes, temporal broodstock collection, and limits on natural-origin take—the hatchery program alone remains a temporary mitigation measure rather than a recovery solution (Bert et al., 2007; NMFS, 2019). The broader scientific consensus cautions against relying too heavily on hatchery-based strategies, particularly when underlying habitat conditions remain impaired (Hilborn, 1992; McMillan et al., 2023).
Pulse Flows
Although not formally part of the Shasta Coldwater Pool Management Action, pulse flows interact with the action in operational, thermal, and ecological ways. Pulse flows are short-duration, intentional increases in river discharge designed to simulate natural variability for ecological benefits. Flow has been correlated with survival for outmigrating Chinook salmon in the Sacramento River system (Michel et al., 2021). Spring pulse flows specifically support juvenile spring-run Chinook salmon survival by providing migratory cues, accelerating their downstream transport, lowering water temperatures, and improving access to off-channel rearing habitats (NMFS, 2019). The pulses also attract adult spring-run Chinook during their upstream migration between April and June and contribute to geomorphic processes by mobilizing fine sediment, transporting gravel, and helping sustain geomorphic features (NMFS, 2019). If the pulse flow releases are higher in magnitude, then they can also serve as flushing flows that flush fine sediments from the gravel bed, leaving behind cleaner, recently mobilized spawning gravels. USBR may release up to 150,000 acre-feet in spring pulses when conditions permit, provided this does not compromise other operational objectives (USBR, 2024e). USBR coordinates this planning through the SRG and SHOT, in alignment, when possible, with storm-driven events or tributary pulses (NMFS, 2024b).
Observational and experimental studies in the upper Sacramento River system support many of the potential
ecological benefits of pulse flows discussed above. Acoustic telemetry studies indicate that pulse flows improve juvenile migration speed and survival during outmigration from the Sacramento River (Notch et al., 2024). Increased spring discharge has also been linked to reduced residence time of hatchery-origin juveniles in the upper river, altering exposure to predation and contributing to life-history diversity (Hassrick et al., 2022). Flow-driven reductions in water temperature have also been shown to advance winter-run Chinook salmon spawning phenology, which may reduce the risk of thermal mortality during summer incubation (Jennings and Hendrix, 2020).
While the potential ecological benefits of pulse flows are well established, their specific effects on juvenile salmon survival remain less certain and stage-dependent. Most direct evidence comes from smolts, where telemetry studies demonstrate that higher flows are associated with greater survival (Michel et al., 2021; Notch et al., 2020). Effects on fry survival are less well understood because of constraints on tagging size, and information is limited to indirect indices and inference. Regardless of which specific early life-history stage, how pulse flows translate into improved outcomes (i.e., mechanisms, or interactions with factors such as water temperature, turbidity, predation risk, or habitat access) remains uncertain. Evidence exists that, in certain circumstances, the timing and magnitude of Delta inflows affect travel time, route selection, and survival of migrating juvenile Chinook salmon (Perry et al., 2018). The timing, magnitude, and duration of pulse flows are often not optimized to support the full spectrum of juvenile development stages (USBR, 2024e), or they are constrained altogether because of coldwater pool limitations. There is limited integration of pulse flow strategies with other environmental variables such as water temperature, turbidity, through-Delta migration, and predation risk, which are critical factors influencing post-fry survival (Notch et al., 2024). Currently, pulse flows are not implemented unless Shasta Reservoir storage exceeds 4.1 million acre-feet on May 1 (NMFS, 2024b); in dry years with elevated risk of temperature-dependent mortality, pulse flows may be deferred altogether to conserve cold water (NMFS, 2024b).
Decision Making During Shasta Coldwater Pool Management
The Coldwater Pool Management Action is implemented by three main coordination teams: the winter-run Juvenile Production Estimate (JPE) SubTeam, the SRG, and the SHOT. The Winter-run JPE SubTeam is a technical group tasked with the development of the yearly winter-run JPE (see Chapter 3) and the winter-run broodstock assessment; it is composed of staff from USBR, the California Department of Water Resources (CDWR), the National Marine Fisheries Service (NMFS), USFWS, and the California Department of Fish and Wildlife (CDFW). The SRG discusses pulse flow shaping, temperature management, fall flow smoothing, and fall/winter base flows. It is composed of technical staff from USBR, CDWR, NMFS, USFWS, CDFW, the California State Water Resources Control Board, tribes, the Sacramento River Settlement Contractors, and the Western Area Power Administration. The SHOT is a policy-level team that discusses actions whose implementation may have biological, system conditions, or water supply impacts or tradeoffs. It includes management and policy staff from key management agencies. Generally, topics will be discussed at a technical level through the SRG, with agency feedback provided prior to topics being discussed by the SHOT.7
The chronology of decisions for coldwater pool management is shown in Table 2-2. The annual consultation about water allocations and water contracts occurs in February because farmers need to know how much water to expect, thereby affecting the crops to be planted. Those initial allocation decisions are made based on certain assumptions about what the water-year type will be (see Chapter 1) as an estimate of water availability and demand. As the SRG begins to develop the draft temperature management plan, it looks at weather, reservoir, and instream data and discusses potential bin scenarios. The SRG meets at least monthly throughout the temperature management season, and it may update the final temperature management plan at the request of the SHOT.
Each month, USBR operators make operational forecasts and conduct a temperature model run to be discussed during the monthly SRG meetings. In April and May, thermal stratification in the reservoir begins. The final water allocation is issued in May. By the end of May, the SRG finalizes the temperature management plan.
There is the potential for downstream target temperatures to increase beyond the 53.5°F (11.9°C) target stipulated in the biological opinions, depending on conditions. The NMFS 2024 Biological Opinion states that
___________________
7This paragraph was edited after release of the report to clarify the composition of SHOT.
when conditions may “cause water temperatures to rise to concerning levels prior to the completion of the final temperature management plan, USBR will begin temperature management as early as March 1st to target water temperatures of 58°F (14.4°C) as the threshold daily average temperature at the Sacramento River Clear Creek (CCR) gage [rather than 53.5°F (11.9°C)].” It is unclear how decisions are made regarding deviations from the 53.5°F (11.9°C) threshold and deviations from the distance at which the temperature threshold must be met. As an additional challenge, the initial allocation of water to downstream contractors occurs in February, prior to the SRG evaluation of coldwater pool volumes (in March) that reveals the amount of water that must be conserved for the temperature management season.
Why Is the Action Controversial?
The controversies surrounding the Shasta Coldwater Pool Management Action stem from its impact on freshwater allocations for a wide variety of end users. Shasta Reservoir holds 41 percent of all the water in the CVP,8 which supplies roughly 7 million acre-feet of water annually to agricultural and urban users; CVP water irrigates about 3 million acres of farmland (~30 percent of California’s total) and provides about 2.5 million people with water for municipal and industrial uses (CRS, 2025). The hydroelectric powerplant at Shasta Reservoir generates roughly 1,800 gigawatt-hours of electricity annually.9 Any management decisions that reduce water availability are consequently met with opposition from a host of stakeholders and interest groups. At the same time, construction of Shasta Dam has prevented migration, in both directions, of all fish species that historically journeyed from the Pacific Ocean to the upper Sacramento River watershed, most notably winter-run Chinook salmon. The current poor condition of the winter-run Chinook salmon population (Appendix E) has led to pressure from other stakeholders for releases and diversions to be altered to benefit the fish.
Conflicting Water Use Needs and Prioritizing Allocations
Coldwater pool management affects several water end-user groups, each with specific seasonal needs. Agricultural users, particularly those in the Sacramento Valley, depend on predictable and consistent water deliveries from spring through early fall for crop irrigation. As described above, their needs are integrated into decision making for the action, which influences the development of the annual temperature management plan. Hydropower operators may face diminished power generation during spring and early summer if flows are restricted to preserve cold water for release later in the summer (Box 2-2). Indeed, during the critically dry 2021 season, USBR was forced to bypass power generation at Shasta Dam for one month starting in April, which resulted in a reduction in power value by approximately $5 million (USBR, 2022). In most cases, however, bypassing hydropower generation has nothing to do with coldwater pool management and is more likely to occur to avoid penalties from generating power when renewables are online (during sunny and/or windy days).
Uncertainty Around Temperature Thresholds and Compliance Points
The temperature threshold chosen for coldwater pool management is controversial because it establishes the volume of cold water needed for conservation (and consequently affects the timing of deliveries and the volume unavailable for other uses), and evidence suggests that the threshold may not be protective. The current 53.5°F (11.9°C) threshold was established based on guidelines issued by the Environmental Protection Agency (EPA Region 10, 2003) in conjunction with studies of temperature-dependent mortality that identified sharp increases in egg mortality above this temperature during incubation (Anderson et al., 2022; Martin et al., 2017). Martin et al. (2017) observed that field-based mortality rates in the Sacramento River were higher than laboratory predictions at similar temperatures, likely due to compounding and interactive effects from multiple abiotic and biotic stressors or heterogeneity at the ecosystem scale. The sensitivity of embryonic development to competing abiotic
___________________
| Activity | Action | Purpose | Timing | Source |
|---|---|---|---|---|
| Pre-Season Planning | Develop initial hydrologic forecasts based on snowpack, reservoir storage, and runoff predictions. | Assess anticipated water availability for the upcoming season, considering drought or surplus conditions. | January–March | USBR (2023a) 2022 LTO Shasta CWP Seasonal Report |
| Initial Temperature Management Projections | Generate early forecasts of coldwater pool volume and temperature management plan. | Determine preliminary targets for temperature compliance points and prioritize coldwater conservation. | February–March | USBR (2024a) Final EIS Appendix L - Shasta CWPM |
| Coordination with Stakeholders and Regulatory Agencies | Convene meetings with the SRG, fishery agencies, and water users to review forecasted conditions and discuss management options. | Ensure alignment on coldwater allocation priorities and regulatory compliance. | February–November | USBR (2023a) 2022 LTO Shasta CWP Seasonal Report |
| Draft Initial Temperature Management Plan (TMP) | Draft TMP with target temperature thresholds at compliance points. | Consider operational goals based on early assumptions of water-year type/snowpack. | April | USBR (2024a) Final EIS Appendix L - Shasta CWPM |
| Finalize the TMP | Develop and submit TMP with target temperature thresholds at compliance points. | Formalize operational goals for the season, balancing environmental and water delivery needs. | May–June | USBR (2024a) Final EIS Appendix L - Shasta CWPM |
| Onset of Coldwater Management Season | Begin operational adjustments to manage releases from Shasta Dam using the TCD. | Regulate water temperatures to support winter-run Chinook salmon egg incubation. | May–October | USBR (2023a) 2022 LTO Shasta CWP Seasonal Report |
| Monthly and Weekly Operational Adjustments | Adjust reservoir releases and TCD gate operations based on real-time conditions. | Optimize coldwater usage while maintaining compliance with temperature and flow targets. | Weekly or ongoing, May–October | USBR (2023a) 2022 LTO Shasta CWP Seasonal Report |
| Monitoring and Data Collection | Conduct temperature monitoring at compliance points and assess fish habitat conditions. | Evaluate performance of temperature management and ensure real-time responsiveness. | Year-round with varying frequency depending on the month | USBR (2024b) Chapter 5 Winter-Run Chinook Salmon |
| End-of-Season Assessments and Carryover Storage Planning | Evaluate the effectiveness of coldwater pool management and assess remaining storage for the next year. | Review lessons learned and plan carryover storage strategies to mitigate impacts of potential drought. | October–December | USBR (2024a) Final EIS Appendix L - Shasta CWPM |
| Four-Year Reviews and Independent Evaluations | Conduct comprehensive reviews of coldwater management performance. | Assess long-term efficacy of CWP management and inform future operational changes. | Every 4 years | NMFS (2019) BiOp Section 7 |
BOX 2-2
Hydropower Operations and Coldwater Pool Management
To achieve desired temperatures at compliance points below Keswick Dam, cold water from Shasta Reservoir is released using the TCD on the lake side of Shasta Dam, which allows withdrawal of water from different depths. The coldwater temperature calculation also accounts for the volume and temperature of cold water from the Trinity Reservoir that enters Keswick or the Sacramento River from Clear Creek, along with an allowance for warming as water travels from the Shasta or Trinity dams to the spawning areas below Keswick (USBR, 2017). According to USBR (2017), “[W]ater temperature variations in Spring Creek Powerhouse flows typically have a relatively modest impact on Keswick Dam release temperatures because Shasta Dam discharges are much larger than Spring Creek Powerhouse flows into Keswick Reservoir.” Indeed, Shasta currently contributes on average almost 10 times more flow to the Sacramento River than does the Trinity River. Thus, rescheduling Trinity releases to control Sacramento River temperatures is likely not worth pursuing. (Keswick Reservoir is shallower, well-mixed, and with a shorter residence time than Shasta although weak stratification can occur occasionally. The mixing of waters within Keswick Reservoir is the subject of an ongoing study by the U.S. Geological Survey [USGS] using the DELFT-3D hydrodynamic model; results are pending although preliminary data are available.a)
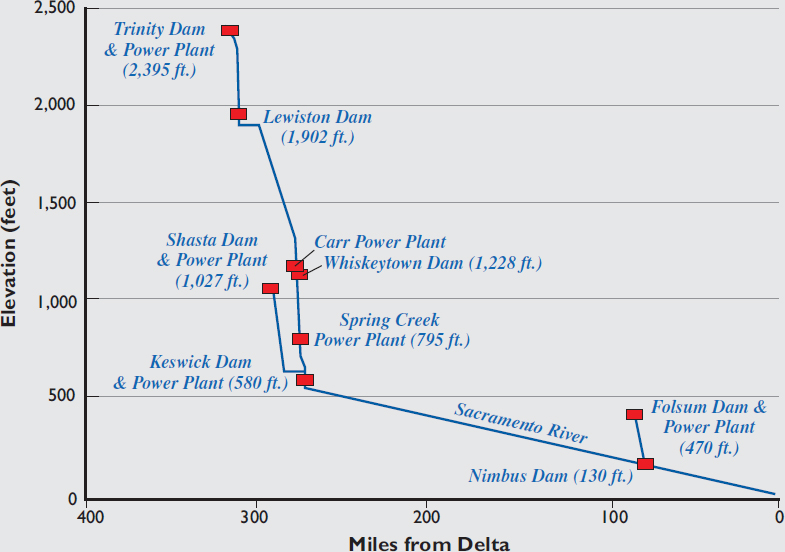
Figure 2-3 shows the CVP’s north-of-Delta reservoirs and powerplants. It includes the major CVP reservoirs that have powerplants (Folsom, Trinity, and Shasta dams) plus the stand-alone Carr and Spring Creek powerplants. The figure shows the crest elevation of each reservoir and powerplant locations. Figure 2-3 demonstrates the large head for hydropower generation at these CVP reservoirs. The top of Trinity Reservoir has an elevation of nearly 2,400 feet, whereas Shasta Dam’s crest is at an elevation just above 1,000 feet, and Folsom’s crest is near 500 feet. The 1,300-foot difference between Trinity and Shasta results in Trinity’s water temperature being lower than Shasta’s, and water traveling from Trinity to the Sacramento River at Keswick Dam has much more incremental hydropower potential (generated at the Trinity, Carr, and Spring Creek powerhouses). The Shasta powerplant, with a capacity of 710 megawatts, generates energy worth $50–100 million annually.b
Both Shasta and Trinity dams can schedule hydropower releases at any time of day, with downstream Lewistown and Keswick dams reregulating flows within 24 hours. Power generation is generally directed to times when power has a higher energy market value and hydropower generation is not restricted by competition from other renewable sources of energy (like wind and solar). In some circumstances, coldwater pool management requirements may delay coldwater releases in the spring and early summer so that the coldwater pool will last through the early fall. Although this withholding can delay hydropower generation, the volume of water withheld then becomes available for release in the fall. Thus, the volume of water released in different months shifts, but total power production is about the same. The value of differences in energy and spinning reserve in different
factors has been demonstrated (Del Rio et al., 2019, 2021) and suggested as a factor explaining differences in survival between lab and field studies (McCullough et al., 2001). Given the vulnerability of winter-run Chinook as exemplified by its declining population over the past 50 years (Figure 1-2C), additional research is warranted to explore the interactive effects of temperature, dissolved oxygen, and flow through redds. As discussed in a subsequent section, this research may provide valuable insight for refining the temperature threshold or managing temperature and flow more dynamically.
The spatial extent of the Sacramento River reach that is managed for temperature, which spans Keswick Dam (River Mile or RM 302) to Balls Ferry (RM 275), has changed over time. Presently, the downstream compliance point is in the vicinity of the Sacramento River confluence with Clear Creek (CCR, RM 292) (Table 2-1 and Figure 2-4A; NMFS, 2019; USBR, 2024a). There has been an ongoing upstream shift of the compliance point over the last few decades (Figure 2-4B). This shift has reduced the spatial extent of suitable spawning habitat,
months will depend on energy and reserve-power regional markets and where a facility’s generation fits in those markets at different times of the day. Although there has been one documented instance where hydropower generation was diminished because the turbines were bypassed in spring to benefit adult winter-run prior to spawning (USBR, 2022), in general the economic impact of coldwater pool management on hydropower’s value is expected to be small because relative to the spring, energy prices are the same or higher in the fall.
SOURCE: Adapted by Kevin Lear, International Mapping Associates from Patton (2024).
__________________
a See https://data.usgs.gov/datacatalog/data/USGS:62e16507d34e10763b599008.
concentrated redds in upstream areas, and diminished genetic diversity and imprinting cues essential for long-term population resilience (NMFS, 2024b). Although upstream shifts in the compliance point can reduce temperature-related mortality in critically dry years, they risk undermining recovery objectives that depend on maintaining a broader spawning distribution (NMFS, 2024b; USBR, 2024a). For example, density-dependent disturbance effects on redds may negatively impact egg survivorship (Bartholow, 2004). Figure 2-4B illustrates that over the past three decades, the compliance point has gradually moved upstream. In the 20 years prior to 2005, the compliance point was always downstream from RM 275, whereas in the 20 years since 2005, the compliance point has been downstream from RM 275 only twice. Also shown in the graph is the annual mean flow in the Sacramento River, illustrating that the relationship between annual runoff and the compliance point (and therefore the reaches of river meeting suitable temperature conditions for spawning) is not simple and relies on numerous other factors such as the available volume of the coldwater pool and the timing of releases.

NOTES: The compliance point for meeting the thermal threshold for cold water in the Sacramento River has shifted between 1996 (green segment) and 2024 (red segment). RM = River Mile. Annual mean flows (red bars) are measured at the Sacramento River near Red Bluff.
SOURCE: Danner (2024) adapted from Anderson (2018).
DATA SOURCES: Compliance points from Sacramento River annual WY Reports 1996–2009, Sacramento River Temperature Task Group annual reports, see https://www.usbr.gov/mp/cvo/temperature.html, and JPE letter footnotes 2010–2024; River flows from USGS Gage 11377100.
Limitations of Coldwater Pool Management Alone for Conserving Winter-Run
Coldwater pool management, while critical for mitigating high water temperatures in the Sacramento River during spring and summer months, has inherent limitations for sustaining recovery of winter-run Chinook salmon. The species’ dependence on managed flows and artificial coldwater management below Keswick Dam exposes the population to heightened risk, especially during consecutive drought years, when storage levels at Shasta Reservoir are insufficient to maintain coldwater reserves and the hatchery program is at risk of insufficient broodstock to support spawning. As discussed later, drought intensity is increasing and winter temperatures are warming—outcomes that underscore the risk of long-term management strategies that do not include natural coldwater habitats. The 2024 NMFS Five-Year Review for winter-run Chinook salmon (NMFS, 2024a) similarly concludes that the species remains at high risk of extinction due to its restricted spawning range, dependence on Shasta Reservoir coldwater pool availability, and vulnerability to increasing climate variability.
NMFS (2024a) emphasizes continued temperature and flow management below Keswick Dam to reduce egg mortality, in particular maintaining and, where feasible, expanding the spatial extent of the temperature-managed reach beyond the Clear Creek gauge. The report also recommends developing operational tools that merge real-time environmental monitoring with temperature-dependent mortality models and seasonal hydrologic forecasts to guide decision making. Finally, NMFS (2024a) calls for continued investment in habitat restoration and expanded biological monitoring, including disease and genetic assessments. In parallel, NMFS (2024a) recommends expanding the spatial access of winter-run to coldwater habitat by restoring connectivity to historically occupied areas—particularly above Shasta Dam and in Battle Creek—to reestablish population structure and reduce reliance on the managed reach below Keswick. Collectively, these recommendations prioritize near-term survival while recognizing that long-term recovery depends on diversifying habitat access and buffering the population against environmental uncertainty—a theme taken up in this report as well.
Conflicting Conservation Priorities
Coldwater pool management decisions can have varying effects on several non-target fish species, some of which are listed as or expected to be listed as threatened under the Endangered Species Act (ESA). Fall-run and spring-run Chinook salmon, which spawn later in the year than winter-run, face reduced habitat availability or suboptimal temperatures if coldwater reserves are depleted by early season Shasta releases for winter-run Chinook salmon. Similarly, steelhead, which rear year-round in the Sacramento River, depend on consistently low water temperatures for juvenile development (Kershner et al., 2019; USBR, 2024a); sudden temperature or flow fluctuations may negatively impact their growth or survival during the fall and winter. Both green and white sturgeon are impacted by flow and temperatures during the spring, and during and after spawning (NMFS, 2019; USBR, 2024a). Reduced spring flows to conserve water for summer coldwater storage may hinder sturgeon spawning success by altering flow cues and increasing egg and larval exposure to warmer temperatures, potentially increasing stress, mortality, or vulnerability to predators for early-life-stage sturgeon (NMFS, 2019; USBR, 2024a). Thus, managing flows to prioritize winter-run Chinook salmon can result in suboptimal water temperatures or flow conditions for these other species during their critical life stages.
SHASTA MONITORING
Monitoring activities supporting coldwater pool management encompass a suite of physical, biological, and ecological assessments that inform decision making for water temperature management, flow volume and release timing, drought and water supply planning, and species protection. The sections below describe and then discuss improvements to the monitoring of physical parameters relevant to the Shasta Coldwater Pool Management Action, followed by biological parameters.
Monitoring of Physical Parameters
The improvements to monitoring of physical parameters discussed below focus on additional streamflow monitoring, improved temperature profiling in Shasta Reservoir, and better understanding reservoir dynamics. The overall point is that augmenting the monitoring of physical processes will facilitate more accurate determination of the coldwater pool volume and inform more effective operational decision making.
Stream Monitoring Downstream of Shasta and Keswick Dams to Support Coldwater Pool Management
Stream monitoring on tributaries to Shasta Reservoir and along the Sacramento River is conducted variously by the U.S. Geological Survey (USGS), CDWR, USBR, USFWS, and CDFW, as well as other entities such as Pacific Gas & Electric (PG&E). At most of the USGS stream gaging stations, only stage and discharge are measured continuously, with the exception of select gages that include temperature and/or turbidity measurements. At other stations, a wider range of water quality data (e.g., nitrates, pH, salinity) are measured, in addition to temperature and turbidity. Water temperature sensors are also located in each of the penstocks of Shasta Dam and at the Livingston Stone National Fish hatchery downstream of Shasta Dam. Table 2-3 shows the monitoring locations used in the Water Temperature Modeling Platform (WTMP; discussed in a subsequent section on Shasta Modeling) along with the responsible agencies.
| WTMP Site Abbreviation | Site Name | Agency | Site Active? | Data Frequency |
|---|---|---|---|---|
| Shasta Reservoir and Primary Tributaries | ||||
| Flows | ||||
| 11342000 | Sacramento River at Delta CA | USGS | Yes | 15-minutes |
| 11368000 | McCloud River above Shasta Lake CA | USGS | Yes | Daily |
| 11365500 | Sulanharas C at Shasta Lake CA | USGS | No | Discontinued |
| 11365000 | Pit River near Montgomery Creek CA | USGS | Yes | Daily |
| DLT | Sacramento River at Delta | CDEC-USBR | Yes | 15-minutes |
| MSS | McCloud River above Shasta Lake | CDEC-PG&E | Yes | Hourly |
| PMN | Pit River near Montgomery Creek | CDEC-USBR | Yes | Daily |
| SHA | Reservoir Elevation and Storage | CDEC-USBR | Yes | Hourly |
| SHA | Generation Release through 5 powerhouse units | CDEC-USBR | Yes | Hourly |
| SHA | Spill Release | CDEC-USBR | Yes | Hourly |
| SHA | Outlet Release | CDEC-USBR | Yes | Hourly |
| SHA | Total Release (Spill+Outlet+Power Generation) | CDEC-USBR | Yes | Hourly |
| Water Temperature | ||||
| DLT | Sacramento R at Delta | CDEC-USBR | Yes | Hourly |
| MSS | McCloud R above Shasta Lk | CDEC-PG&E | Yes | Hourly |
| PMN | Pit R near Montgomery Cr | CDEC-USBR | Yes | Hourly |
| SHD | Tailbay Water Temperature (Below Shasta Dam) | CDEC-USBR | Yes | Hourly |
| SP1 | Shasta Penstock #1 | CDEC-USBR | Yes | Hourly |
| SP2 | Shasta Penstock #2 | CDEC-USBR | Yes | Hourly |
| SP3 | Shasta Penstock #3 | CDEC-USBR | Yes | Hourly |
| SP4 | Shasta Penstock #4 | CDEC-USBR | Yes | Hourly |
| SP5 | Shasta Penstock #5 | CDEC-USBR | Yes | Hourly |
| WTMP Site Abbreviation | Site Name | Agency | Site Active? | Data Frequency |
|---|---|---|---|---|
| Keswick Reservoir and Primary Tributaries | ||||
| Flows | ||||
| SPC | Spring Creek Debris Dam | CDEC-USBR | Yes | Hourly |
| WHI | Spring Creek Generation Release through 2 powerhouse units | USBR | Yes | Hourly |
| 11371600 | Spring C PH A Keswick CA | USGS | Yes | Daily |
| KES | Reservoir Elevation and Storage | CDEC-USBR | Yes | Hourly |
| KES | Generation Release through 3 powerhouse units | CDEC-USBR | Yes | Hourly |
| KES | Spill Release | CDEC-USBR | Yes | Hourly |
| KES | Fishtrap Release | CDEC-USBR | Yes | Hourly |
| KES | Total Release (Spill+Fishtrap+Power Generation) | CDEC-USBR | Yes | Hourly |
| Water Temperature | ||||
| SPP | Spring Creek Powerhouse | CDEC-USBR | Yes | Hourly |
| Sacramento River: Keswick Dam to Red Bluff | ||||
| Flows | ||||
| KES | Keswick Reservoir: Total Release | CDEC-USBR | Yes | Hourly |
| 11370500 | Sacramento R A Keswick CA | USGS | Yes | Hourly |
| 11370700 | Anderson-Cottonwood ID CN AT Redding CA | USGS | Yes | Hourly |
| 11372000 | Clear Creek near Igo CA | USGS | Yes | Hourly/Daily |
| CCP4 | Clear Creek at Phase 4 Site | Graham Mathew and Assoc. | No | Hourly |
| 11374000 | Cow Cr NR Millville CA | USGS | Yes | Hourly |
| 11376000 | Cottonwood Cr NR Cottonwood CA | USGS | Yes | Hourly |
| 11376550 | Battle Cr Fish Hatchery NR Cottonwood CA | USGS | Yes | Hourly |
| 11377100 | Sacramento R AB Bend Bridge NR Red Bluff CA | USGS | Yes | Hourly |
| Water Temperature | ||||
| KWK | Keswick Water Quality | USBR | Hourly | |
| 11372000 | Clear Creek near Igo CA | USGS | Yes | Hourly |
| CCVW Confluence | Clear Creek video weir RM0.1 Clear Creek confluence RM0.5 | CDFW | Yes | Hourly |
| NA | Cow Cr near mouth (old video station at RM1) | CDFW | Yes | Hourly |
| BSF | Sacramento River at Balls Ferry Bridge | CDEC | Yes | Hourly |
| NA | Cottonwood Cr | CDFW | Yes | Hourly |
| NA | Battle Cr | CDFW | Yes | Hourly |
| JLF | Sacramento River at Jellys Ferry | CDEC | Yes | Hourly |
| BND | Sacramento River at Bend Bridge | CDEC | Yes | Hourly |
SOURCE: USBR (2024c) and https://cdec.water.ca.gov/webgis/?appid=cdecstation.
NOTE: CDEC = California Data Exchange Center
Temperature monitoring downstream of Shasta Dam between Shasta and Keswick and downstream of Keswick could be supplemented by the addition of more thermistors. Currently, measurements being made at the penstocks and at Livingston Stone occur before the water flows have mixed fully across the width of the river channel. This makes it difficult to determine whether the release temperatures used as the upstream boundary condition in the river segment of the WTMP are accurate for forecasting downstream temperatures at compliance points. If the temperature sensor downstream of the dam (which is mounted on one side of the channel before the flow is fully mixed across the channel) were moved downstream, or an additional sensor were added, a much more accurate measurement of average water temperature in the river just below Shasta Dam would be obtained.
There also appears to be limited measurement of water temperatures at tributary confluences downstream of Keswick. This information could influence assessments of whether main stem Sacramento River segments can provide appropriate spawning grounds for winter-run Chinook salmon or the effect of tributary inflows on downstream temperature targets.
Enhanced Tributary Monitoring Above Shasta Reservoir to Enable Better Estimation of the Coldwater Pool
The development of the coldwater pool in reservoirs depends on the carryover volume and water temperature from the previous year, the internal hydrologic mixing processes, and the tributary inflows. If the tributary inflow has a density less than the receiving water in the reservoir (i.e., low sediment concentrations and warmer temperature), then the flow will be positively buoyant and the inflow will spread across the surface waters. If the reservoir is stratified, then these inflows will contribute primarily to the warmer surface waters of the epilimnion. However, if the tributary inflows are denser than the receiving waters, then the inflow can plunge beneath the surface layers and possibly along the bed of the reservoir as a density current (underflow) or as an interflow at a depth in the reservoir where the density of the inflow matches the receiving water and the motion of the inflowing plume stabilizes (e.g., Alavian et al., 1992; Fischer et al., 1979). These colder inflows can flow beneath the thermocline and contribute directly to the coldwater pool. For example, the Pit and upper Sacramento rivers enter Shasta Reservoir as density-driven interflows or underflows depending on their temperature and sediment load and can reinforce the coldwater pool without disrupting upper stratification (Lieberman and Horn, 1998).
The WTMP is well structured to capture the dynamics of these inflows, but accurate inflows and water temperatures are required close to the points where the tributaries enter the reservoir. The top half of Table 2-3 summarizes the flow and water temperature data collected from tributaries into Shasta Reservoir. The inflow from Big Backbone Creek is assumed negligible, and Sulanharas Creek10 is not currently monitored and a regression equation is used to predict flows based on water-year type (USBR, 2024c). Although the inflow from Sulanharas Creek is significantly less than that from the upper Sacramento River, the Committee suggests placing a low-cost temperature sensor close to the Sulanharas inflow to the reservoir. This would enable a confirmation of the accuracy of the regression equation used. Consideration should also be given to placing temperature sensors close to the point of tributary inflow to Shasta Reservoir where the current gaging is significantly upstream of the inflow point. The WTMP can be used to evaluate the importance of the inflowing tributaries in establishing the coldwater pool and the value of maintaining these low-cost gages beyond the study period.
Measurements of Reservoir Temperatures and Coldwater Pool Volume
Temperature profile data of Shasta Reservoir and the reservoir’s stage–storage relationship (Figure 2-5) are used to estimate the volume of the coldwater pool. Specifically, the elevation of the thermocline is identified from the single vertical profile, and this elevation is then used in stage–storage curves to calculate the volume of water below a selected temperature threshold down to the reservoir’s dead pool or other management-defined elevation (Nickel et al., 2004; NMFS, 2019). Assuming a horizontally uniform temperature distribution introduces uncertainty because stratification can vary across the reservoir and at fairly short time scales, especially in a large multi-arm reservoir such as Shasta (Nickel et al., 2004). Furthermore, water temperature below the thermocline is
___________________
10Renamed in 2022 by the Board on Geographic Names.

NOTE: The volume is based on bathymetry measured in a 2019 survey, “Surfer” interpolation from bathymetric maps, and calculated from the model grid.
SOURCE: USBR (2024c, Figure 5.3).
not uniform and may vary from year to year; knowing the vertical temperature profile is key to optimally managing the TCD and water releases and projecting the amount of cold water throughout the season. To reduce uncertainty in the Shasta Coldwater Pool Management Action, water temperature should be measured at sufficiently high spatial and temporal resolution to capture shorter time scale physical dynamics that affect the temperature distribution. Without capturing these dynamics, or at least understanding whether and when they are significant, single-profile or infrequent measurements risk mischaracterizing the extent and availability of the coldwater pool, especially during critical temperature management periods. Indeed, if the estimation of the coldwater pool is inaccurate by 1 foot in elevation, this translates, assuming an area of 15,000 acres, to the equivalent of releasing 1,000 cubic feet per second (cfs) of cold water for one week. Managers would be better positioned to plan and communicate operational decisions about Shasta if an accurate understanding of the thermal structure, prevailing mixing processes, and coldwater pool characteristics were available—all of which can be addressed with improved monitoring, as discussed below.
Vertically discrete measurements of water temperature from within Shasta Reservoir are necessary to estimate and validate the depth and volume of the coldwater pool. A few different approaches have been implemented in the past, described in greater detail below: (1) water temperature profile measurements manually collected from a boat, (2) continuous measurements of water temperature made at discrete intervals throughout the water column using a thermistor chain, (3) a short-term temperature study conducted from 2015 to 2016 using fiber-optic distributed temperature sensing (DTS), and (4) a USGS study that evaluated the spatial distribution of water temperature from 1995 to 1997 (Lieberman and Horn, 1998). The profilers used in (2) and (3) are usually attached to a surface buoy or platform and can be linked directly to other water quality sensors. Micro-meteorology stations can be mounted on the buoy or platform with capability to transmit real-time data through cell phones, satellites, or cables. These comprehensive systems go by different names; this report uses the generic term Lake Diagnostic System (LDS; Imberger, 2004) without preference for any specific fiber-optic or thermistor technology.
First, manual water temperature profiles are collected year-round via boat on a weekly to monthly basis. The highest frequency (weekly) measurements are made from April through mid-November at a vertical resolution of
5 feet (ft). During the winter months (December to March) sampling is done only monthly and at a lower vertical resolution of 25 ft. In the two short intervals between those periods (March and the latter two weeks of November) sampling is done every two weeks at a vertical resolution of 25 ft. The exact location of the profile varies depending on prevailing conditions, but for safety reasons it is generally about 75 meters (m) (246 ft) from the dam face.
Second, continuous monitoring of temperature throughout the water column has been temporarily conducted at one location in the reservoir, on a seasonal basis, and only for the purposes of validating the WTMP implemented by USBR. This was done using a series of HOBO© water temperature loggers deployed in a vertical array as a thermistor chain. Neither real-time telemetered nor manually downloaded high-frequency measurements of water temperature are part of the existing monitoring program in Shasta Reservoir.
Third, a short-term high-resolution monitoring effort was conducted from August 2015 to July 2016. During that period, the National Oceanic and Atmospheric Administration (NOAA) and USBR deployed a combined micro-meteorology station and continuous fiber-optic DTS cable, which was installed in a vertical array to measure water temperature at high resolution over the vertical length of the cable. Figure 2-6 illustrates the monitoring setup; weather data are recorded hourly, and water temperature is measured at 1-ft intervals over the water column every 15 minutes (Daniels, 2024). Although equipment was acquired to continue this more detailed real-time monitoring, it has not been deployed since 2018 because of safety concerns for recreational boaters and potential risks posed to the TCD and other dam infrastructure.
Investment in continuous, high-resolution monitoring infrastructure—such as the vertically distributed thermistor chains or fiber-optic DTS systems (mentioned as approaches 2 and 3 above)—would provide more accurate inputs for coldwater pool modeling and more defensible operational decisions. The addition of LDS or similar technology will supplement previous studies by USBR, NMFS, and USGS and provide continuous recording with the ability to download data either in real time or via a daily download. One of these stations should be permanently deployed within 1 km of the dam. Other LDS stations could be located to provide the best representation of the flow and meteorological conditions in the arms of the reservoir and to capture the interactions between the various parts of the reservoir. Ideally, WTMP modelers could run scenarios and determine the optimum number and location of these LDS stations. The deployment should last for as many seasons as required to ensure the WTMP team and SHOT have confidence in the model projections (typically 2-3 years), after which fewer monitoring stations (perhaps only one) would be needed. Deployment of these technologies has several advantages over the status quo including continuous data at 5- to 15-minute intervals that are capable of capturing shorter time scale vertical mixing processes (including seiching), less staff time to collect measurements by boat if coupled with telemetry (maintenance is only required when the data transmission indicates a problem), and collection of information during adverse weather conditions when significant changes may occur. The detailed vertical temperature profiles provided by LDS will provide a better understanding of the coldwater pool, how it is likely to develop throughout the year, and how water may be blended within the TCD and river outlets to maximize the ecological benefits of this finite resource.
Thermal Regime and Mixing Dynamics in Shasta Reservoir
The mixing regime of Shasta Reservoir is warm monomictic, meaning it never cools to the point of freezing and only experiences one period of vertical mixing a year. However, in many years, vertical mixing in the fall and winter is incomplete, reaching only a depth of 50–60 m below the surface, and the reservoir is considered meriomictic (Lieberman and Horn, 1998). The extent of this vertical mixing depends on the water temperature profile and the associated density differences that develop over the year. Figure 2-7 shows the seasonal thermal stratification of Shasta Reservoir over the last five years. As previously mentioned, stratification usually develops in April or May, the onset of which is defined as the point when surface waters warm 2°F (1.1°C) above the normal spring surface water temperature of 52°F (11.1°C). The thermocline typically deepens through early summer before stabilizing in mid-summer. In dry or critically dry years, stratification may begin earlier and persist longer, often with a thinner coldwater pool and greater risk of mid-summer hypolimnetic warming (Figure 2-7). Conversely, in wet years, colder inflows from high-elevation tributaries such as the McCloud and upper Sacramento rivers sustain colder hypolimnetic temperatures and a larger coldwater pool.

NOTE: Data presented in this report are for the DTS vertical section only.
1 This figure was revised after release of the report to add more detail about the vertical temperature profile monitoring setup used in 2015–2016.
SOURCE: Daniels (2024).

SOURCE: https://www.usbr.gov/mp/cvo/temperature.html.
In addition to inflow temperatures and volumes, seasonal air temperatures (Nickel et al., 2004), and vertical mixing processes, the thermal structure of reservoirs is further shaped by complex mixing dynamics that include wind-driven turbulence, seiching, and internal waves—especially in the multi-arm, mountainous morphology, and microclimatology of Shasta Reservoir. A potential role for seiching was suggested from the Daniels et al. (2018) modeling study that was trying to better understand leakage around the TCD gates. Some leakage around the gates in the TCD is inevitable due to the scale of the TCD structure and high pressures. Estimates of gate leakage have been made in the past (Resource Management Associates, 2003), and a current UC Davis study aims to improve these estimates. Daniels et al. (2018) predicted the temperature of water releases with and without estimated TCD leakage (Figure 2-8). Accounting for leakage around the TCD improved the projections of water temperatures but failed to account for the high-frequency fluctuations of about 2°C (3.6°F) observed in the releases and the significant fluctuation at the end of June 2012 that persisted for a few days. Box 2-3 explores whether these temperature fluctuations might have been caused by seiching. The current monitoring of Shasta’s vertical water temperature profiles at a weekly to biweekly cadence during the coldwater pool management season does not have a fine enough temporal resolution to detect such physical mixing dynamics as seiches.
A final, complex factor affecting Shasta coldwater pool development is the volume and temperature of carryover storage. Higher end-of-September storage does not necessarily result in a greater volume of cold water the following season if the reservoir turns over with a large volume of warm water.
All of these factors suggest that additional monitoring of the vertical thermal structure within Shasta Reservoir, if coupled with the WTMP, will provide greater insights and predictions regarding the development and dissipation of the coldwater pool. It was mentioned previously that NOAA and USBR deployed a combined micro-meteorology station and continuous vertical profiler DTS from August 2015 to July 2016, with weather data recorded hourly and water temperature measured at 1-ft intervals over the water column every 15 minutes (Figure 2-6). Since that one effort, NOAA and USBR have not deployed such a monitoring system again. However, more detailed examination of this valuable data set and the long-term use of such an LDS setup would provide valuable information about physical processes in Shasta Reservoir. If deployed over a two-year period, an LDS linked with the reservoir model CE-QUAL-W2 (see Shasta Modeling section below) could be evaluated for its ability to simulate and predict the formation of stratification, the internal mixing processes affecting the coldwater pool, and the influence of different TCD operational rules. Some of this equipment could be used for other special studies after

SOURCE: Daniels et al. (2018).
the two-year deployment. The additional meteorological information close to the water surface will supplement the new meteorological station on Shasta Dam and provide a better understanding of conditions throughout the complex topography of Shasta Reservoir and the influence of internal mixing processes. Such enhanced monitoring would help Shasta operators understand and predict why the coldwater pool can vary significantly for water years with approximately the same total annual runoff, as well as help to clarify the roles of carryover, seiching, and leakage around the TCD.
Biological Monitoring
Biological monitoring activities inform both operational decision making for coldwater pool management and long-term protection of winter-run Chinook salmon. The short-term operational priorities are to ensure temperature compliance during critical spawning and egg incubation periods and mitigate risks of redd dewatering or juvenile stranding. The longer-term priority is to enhance population resilience by tracking population dynamics and habitat conditions over time.
In support of these goals, many monitoring activities track critical indicators of winter-run Chinook salmon abundance and development, as well as characterize key aspects of habitat availability and quality. Biological monitoring activities supporting the Shasta Coldwater Pool Management Action include annual assessments of returning adult salmon populations through carcass and redd surveys, which provide essential data on escapement trends and spawning success. Juvenile outmigration is monitored using rotary screw traps at strategic locations along the Sacramento River, enabling managers to evaluate fry survival rates, migration timing, biological condition (an index of size and weight), and year-class strength. Habitat surveys help assess the distribution, quality, and availability of redd areas, while rearing habitat assessments examine instream and floodplain conditions critical for juvenile growth and survival. Although not technically monitoring, hatchery production is a component of long-term conservation efforts, and hatchery-origin fish are monitored to assess their contribution to salmon recovery efforts and their relative contribution to the overall genetic pool of the wild population. These monitoring programs are described in Appendix D of this report. What follows is a brief summary and evaluation of activities.
BOX 2-3
Seiching in Shasta Reservoir
Seiching, a potentially important physical process affecting the coldwater pool, cannot be detected by the current reservoir monitoring. Seiching can be initiated by severe wind events or by gate or turbine operations, as well as external disturbances such as landslides or major inflows creating density currents. Seiching is not the only form of internal mixing phenomenon, and other mechanisms such as Kelvin waves could also play an important role (Wuest and Lorke, 2003).
Seiching is established when wind blows across the surface of a lake, and the water surface at the leeward shore becomes elevated relative to the windward shore. As the wind stops or changes direction, there is a counterflow to restore a horizontal water surface, and, because of the nature of water waves, this usually occurs as a series of diminishing oscillations. This process may become significant and relevant to reservoir operations if it occurs during a period of stratification. In this case, the epilimnion will deepen on the leeward shore and diminish on the upwind (windward) shore, and a counterflow will restore the horizontal thermocline when the wind subsides. These series of oscillations at the density interface are termed internal seiches (Fischer et al., 1979). The height of the internal seiche can be much larger than the surface oscillation, and the internal seiche can significantly affect the temperature of releases if the point of withdrawal is close to the thermocline or if a temperature gradient exists in the hypolimnion. The amplitude and period of the seiche depends on the wind speed, direction and duration, the fetch, atmospheric stability, density difference, and wavelength (Chen et al., 2016). Shasta Reservoir has five arms and mountainous topography that will create local meteorology and a complex interaction of seiches. NOAA and USBR conducted detailed continuous monitoring of the meteorology and vertical temperature profile from August 2015 to July 2016. During this period the peak sustained wind speed recorded was over 30 mph and a typical diurnal air temperature and wind pattern, as illustrated in Figure 2-9 for the month of April 2016. These wind events contribute to vertical mixing of the surface layers in the reservoir and have the potential to initiate seiching.
SOURCE: Graphed by the Committee with data sourced from Daniels (2024).
Observed vertical temperature profiles at Shasta Dam are shown in Figure 2-10 for August 28 and September 20, 2015. The air temperatures are cooling during this period and the water temperature in the well-mixed surface layer of the reservoir drops by about 2°C (3.6°F). During this period the reservoir was drawn down by 2.75 m, and the mixing layer in the epilimnion and upper hypolimnion increased by about 10 m. Mixing by turbulence from convective heat loss and diurnal wind activity does not account for the entire deepening of the warmer epilimnion (and reduction in the coldwater pool). The upper layers of the hypolimnion are also warming significantly during this period because of the transfer of warmer water across the thermocline. Strong winds can help explain the additional reduction in the coldwater pool, and further investigation is warranted using the new WTMP and associated reservoir monitoring.
There are two effects during this period. First, there was an abrupt deepening of the epilimnion. For example, at elevation 276 m, the water warmed to the same level as the epilimnion almost immediately and did not recover for the rest of the season (Figure 2-11). Second, there is evidence of a seiche at the thermocline (elevation 273 m) with a period of about 25 hours. The difference in wind speed and direction in the different arms of the reservoir and how the internal seiche propagates within such a complex geometry is unknown, but the WTMP can be used to determine when and whether these mixing processes will affect reservoir operations and enhance the ability to optimally manage the coldwater pool. Additional monitoring data can be used to better assess the effect of short time scale dynamics on coldwater pool volume estimates.
SOURCE: Graphed by the Committee with data sourced from Daniels (2024).
SOURCE: Graphed by the Committee with data sourced from Daniels (2024).
Redd Monitoring
Redd surveys along critical reaches of the Sacramento River document the location, depth, and surrounding flow conditions of redds. Those surveys directly inform flow release schedules from Shasta Reservoir to ensure that water levels remain adequate to protect redds during critical incubation periods. Real-time or near real-time monitoring of redds could be done by increasing the frequency of redd monitoring activities and equipping field teams with tools to input redd data directly into centralized databases, ensuring rapid processing and immediate availability for operational managers. Surveys could be conducted more frequently in areas at high risk of dewatering or sedimentation, which would allow for faster adjustments to flow releases when dewatering risks are identified.
Redd survey data could support proactive, rather than reactive, management strategies by being integrated with predictive tools such as temperature and flow models to forecast future risks to redd viability under various hydrological scenarios. Redd surveys could be used to identify areas with recurring dewatering or habitat degradation, guiding targeted restoration efforts such as gravel augmentation, sediment removal, or riparian improvements that mitigate sedimentation, improve gravel quality, and reduce warming. Egg-to-fry survival estimates derived from redd surveys could be correlated with long-term population data to refine recovery goals and evaluate the effectiveness of coldwater pool management.
Carcass Surveys
Carcass surveys provide data on adult salmon escapement and inform evaluation of spawning success from spawning reaches downstream of Keswick Dam. They contribute to validation of longer-term coldwater pool management actions, and they are used to assess the relative contribution of hatchery-origin fish to the total population. Current surveys are concentrated primarily in spawning reaches near Keswick Dam, leaving gaps in data from secondary habitats or underutilized areas that could be critical for improved escapement estimates. Expanding spatial coverage to include under-surveyed areas could provide a more comprehensive understanding of spawning activity.
Monitoring to Understand Juvenile Survival, Residence Time, and Habitat Use
Coldwater pool management actions support the broader survival and habitat utilization of winter-run Chinook salmon throughout the Sacramento River system. Flows interact with physical and biological cues in the environment to influence juvenile outmigratory behavior, with important implications for growth rates and survivorship. To that effect, multiple agencies justifiably expend considerable effort to characterize movement and habitat accessibility or utilization of juvenile winter-run Chinook salmon (NMFS, 2014, Windell et al., 2017, 2024a).11
Juvenile outmigration monitoring involves rotary screw traps, acoustic tagging, and environmental data collection to track juvenile salmon as they migrate downstream. In the short term, the data inform operational managers about the timing and magnitude of juvenile outmigration, allowing for flow adjustments to enhance migration conditions. In the long term, these data are used to assess the effectiveness of coldwater pool management strategies on juvenile survival, evaluate population trends, and guide habitat restoration efforts aimed at improving rearing and migration conditions. Rearing habitat surveys evaluate the quality and availability of habitats critical for juvenile growth and survival by assessing off-channel habitats, floodplains, and mainstem river areas to determine their suitability for rearing during key life stages. These surveys typically involve field assessments of water depth, temperature, turbidity, flow velocity, and cover availability, including vegetation, woody debris, and overhanging banks—factors that influence juvenile survival by providing refuge from predators, maintaining optimal temperatures, and supporting prey availability. Augmenting monitoring to improve estimates of mortality and develop a more detailed spatial-temporal understanding of movement and habitat utilization may help to increase survivorship of those individuals that have already cleared the upstream egg-to-fry survival hurdle.
***
Our assessment of the limitations in biological monitoring is consistent with NMFS (2024a). That report identified deficiencies in current monitoring as (1) limited spatial and temporal coverage, (2) inadequate integration of hatchery data including genetic monitoring, (3) insufficient study of the long-term impacts of hatchery-origin fish on wild populations, (4) a lack of comprehensive habitat assessments, and (5) insufficient climate preparedness including a lack of predictive tools to evaluate future changes in hydrology and their impacts on coldwater pools.
SHASTA MODELING
A suite of numerical models supports coldwater pool management, including operations, hydrologic, hydrodynamics, water quality, and fish models. Although USBR presented the Committee with a complex schematic of the models used in the CVP and SWP (Figure D-1; Sumer, 2024), many of which are indicated as particularly relevant for the three actions reviewed in the report, the Committee favors the simpler schematic of the models relevant to the long-term operation of the projects in Figure 2-12 (NMFS, 2024b). In Chapters 2 to 4, the Committee describes almost all of the models shown in Figure 2-12, focusing on those models where further consideration would lead to improved project operations. For this chapter on Shasta coldwater pool management, the primary focus is the WTMP, newly developed by USBR to encompass the reservoir and streamflow hydrologic models
___________________
11See https://www.fisheries.noaa.gov/resource/document/recovery-plan-evolutionarily-significant-units-sacramento-river-witer-run; see https://repository.library.noaa.gov/view/noaa/15458.
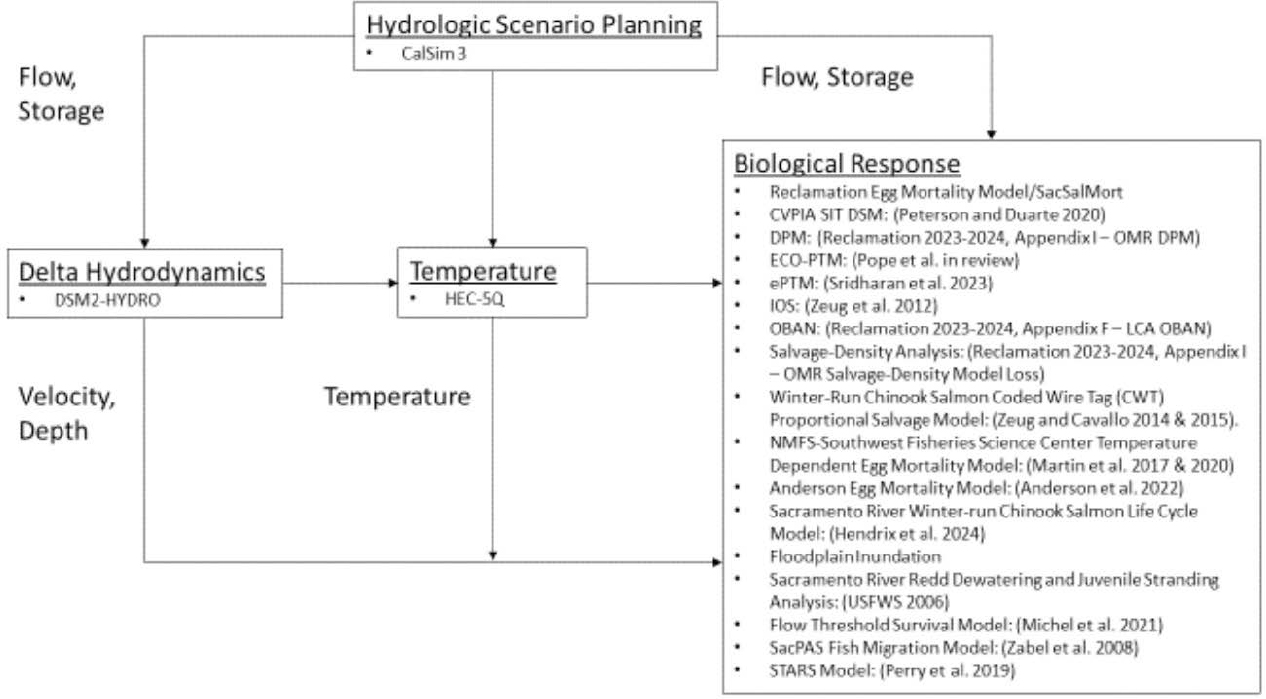
SOURCE: Figure 8 in NMFS (2024b).
currently used in coldwater pool management. Temperature-dependent mortality, egg-to-fry survival models, and life-cycle models for winter-run Chinook salmon are also discussed.
Many of the models relevant to coldwater pool management were critically reviewed by the Delta Science Program during the past two years. This includes an independent review of many models used for the Long-Term Operations for the Central Valley Project and State Water Project Fish and Aquatic Effects Analysis (Rose et al., 2024), a review of the WTMP (Delta Science Program, 2023), and a review of the Hydrologic Engineering Center (HEC) ResSim model (Wells et al., 2025). When appropriate, conclusions from those reviews are mentioned here, although the charge to those panels differed significantly from the charge to this Committee.
Numerical Modeling of Physical Processes
Estimating the Coldwater Pool
As the year progresses, stratification of water temperatures over the depth of the reservoir occurs. The coldwater pool is defined as the volume of water stored in the reservoir below the 52.5°F (11.39°C) isotherm (or other selected reference temperature) and, as previously discussed, can be estimated from the measured vertical temperature profiles and the stage–storage curves maintained by USBR.12 This estimate provides the volume of available cold water at the time of measurement but is not sufficient for SRG planning or for USBR operations because there is at least a three-day lag between inflows, releases, and Sacramento River water reaching critical downstream reaches. In addition, the coldwater pool evolves throughout the summer depending on the ambient weather conditions, inflows, and reservoir withdrawals, which affect the rate at which the thermocline and surface warm water layers deepen. For these reasons, the models that USBR has used are undergoing significant upgrades to enhance the accuracy of predictions of water temperatures throughout the reservoirs and downstream reaches of the Sacramento River. Physical models are critical for understanding how far downstream of Keswick Dam threshold temperatures can be achieved and provide insights into flow conditions and the risk of dewatering reaches.
Water Temperature Modeling Platform
USBR is updating its flow and temperature models by establishing a WTMP based on the software models CE-QUAL-W2 and HEC-ResSim. USBR initiated this project to modernize the analytical tools that it uses to support activities and decision making for water temperature management in CVP reservoirs aimed at protecting fish species in downstream river reaches. USBR intends to use the WTMP consistently for both CVP real-time operations and seasonal and long-term planning purposes.13 The scoping, development, and implementation of the WTMP has undergone a rigorous peer-review process (Delta Science Program, 2023) that will not be replicated in detail herein.
The WTMP has been developed with the intent of establishing a model user group to foster understanding and guide future model development, as well as to enable stakeholders to explore scenarios for managing flows and water temperatures. Although WTMP development includes three areas (Sacramento River, American River, and Stanislaus River), this report focuses on the region covered by the Trinity-Shasta system in the Sacramento River basin. The integrated river-reservoir model, CE-QUAL-W2, and the reservoir systems model, HEC-ResSim, are desktop software/physically based models that have been widely used for similar systems. Both models are in the public domain, supported by the HEC of the U.S. Army Corps of Engineers (USACE). HEC-ResSim is not open source, but it was developed so that a user can add a specific algorithm in certain limited situations.
HEC-ResSim was developed by the USACE HEC to simulate and optimize the behavior of one or more reservoirs (in terms of water storage, releases, and flows) for a variety of hydrologic and operational conditions.
___________________
12The most recent bathymetric survey of Shasta Reservoir was conducted in 2019 (Berry et al., 2021), and the stage–storage curves were updated in 2024 (USBR, 2024c).
The model simulates reservoir operations for a variety of purposes, from flood management to water supply. Depending on the chosen time step, the model can simulate single runoff events or a full period of record. Water temperature modeling capabilities were recently incorporated into HEC-ResSim.
The June 2025 Delta Science Program Independent Peer Review of HEC-ResSim (Wells et al., 2025) provides valuable insights into the model. The review acknowledges the considerable effort to link observations with model simulations across the upper Sacramento and Trinity river basins. The Shasta application of HEC-ResSim is still under development, and several important suggestions were made to guide the evolution of the model, including the following:
- Conduct a sensitivity analysis to understand which parameters are most important and how uncertainties in these key parameters can be reduced.
- Clarify whether the initial conditions to run the model are at the onset of stratification in the spring. Also unclear is whether multi-year projections can be made from a “hot start” based on conditions simulated in the previous 12 months, or if the model can be used to simulate planning horizons beyond a few months.
- Incorporate an algorithm that can track whether mass and energy are conserved.
The management of the WTMP and USBR’s efforts to build a modeling community around this new platform provides an excellent forum to explore the issues raised in Wells et al. (2025). Bringing together modeling experts from USACE HEC, USBR, CDWR, consulting groups, and academia would allow HEC-ResSim to be configured and compared to CE-QUAL-W2 and other models to ensure that it is state of the art. Currently, it is unclear when HEC-ResSim will be used within the WTMP rather than the more computationally intensive CE-QUAL-W2, and what the differences in model accuracy might be for the questions being asked.
CE-QUAL-W2 is a two-dimensional (2-D) water quality and hydrodynamic code supported by the USACE Waterways Experiments Station (Cole and Buchak, 1995) and last updated on February 28, 2025. The model has been widely applied to stratified surface water systems such as lakes, reservoirs, and estuaries. It simulates water levels, horizontal and vertical velocities, temperature, and 21 other water quality parameters (e.g., dissolved oxygen, nutrients, organic matter, algae, pH, the carbonate cycle, bacteria, and dissolved and suspended solids). The 2-D model captures vertical and longitudinal processes but laterally averages across the width of the river, reservoir, or estuary. CE-QUAL-W2 Version 4.5 can simulate the flow processes in sloping riverine sections and can model entire river basins with rivers and inter-connected lakes, reservoirs, and/or estuaries.
Within the WTMP, the more computationally efficient HEC-ResSim is used to evaluate operations of Keswick Reservoir and upstream facilities including Shasta Reservoir for long-term planning scenarios, develop annual operational plans, and rapidly assess any modifications required as the water year progresses. The more computationally intensive CE-QUAL-W2 model is used to provide greater spatial and temporal detail of the findings from HEC-ResSim, and to validate the results. Because the two models use different algorithms and assumptions, comparing simulations from the two can allow better understanding and quantification of potential sensitivities and uncertainties. CE-QUAL-W2 encompasses more of the physical and biogeochemical processes and is therefore a useful tool to enhance basic understanding of this complex system of reservoirs and rivers. It can also be used to evaluate the importance of internal seiching and mixing to the operation of the TCD, whereas it is not apparent that HEC-ResSim has this capability.
The WTMP includes a Graphical User Interface, which was the desired model format for users at USBR, to facilitate and standardize applications of CE-QUAL-W2 and HEC-ResSim. River segments are modeled using a one-dimensional (1-D) longitudinal model, whereas reservoirs are modeled with a 1-D vertical model or a 2-D transversally averaged model depending on the simulation objectives. The modular approach offers the advantage of using models of different spatial and temporal resolutions and scales for selected elements—for example, rivers and reservoirs. The modeling platform allows flexibility to change modeling elements to address processes at different temporal and spatial scales.
The WTMP accounts for three features related to Shasta operations: (1) the TCD at Shasta Dam, (2) thermal curtains in Lewiston Lake and Whiskeytown Reservoir, and (3) tunnels in the Trinity-Sacramento system (USBR,
2023b). Operators of Shasta Reservoir do not yet use the WTMP. USBR plans a public rollout and training of the WTMP in fall 2025.
In the conceptual planning of the WTMP, USBR wanted to create an open system that could be used by interested parties within and beyond USBR—thereby establishing a diverse community of modelers and allowing the application of other models or new algorithms. This approach is akin to that of the National Weather Service, which has more than 70 weather models. However, in the current software modeling framework, it would be very difficult for a model user to modify the code in order to update the governing equations, the calculations of heat transfer coefficients, and the equations that represent important heat transfer processes. Although these constraints offer consistency for day-to-day USBR users, they limit updating of the model to reflect the best available science. Recent stream temperature models have made substantial advances in predicting river temperatures by (1) developing a detailed full-spectrum radiation balance for calculating the heat energy balance (e.g., FLUVIAL-EB; Bray et al., 2017, 2025), and (2) focusing on the advection component of the energy balance (e.g., River Assessment for Forecasting Temperature [RAFT]; Daniels and Danner, 2020; Pike et al., 2013). To incorporate new equations or computational components, an external modeler would need to write code for a plug-in for other models and then conduct an objective model comparison. This substantial computational effort effectively limits other interested parties from readily testing different algorithms or assumptions within the WTMP.
Two approaches could be adopted to achieve USBR’s objective: (1) codes could be developed to be modular or source code could be offered to users through structured source code version control, or (2) initial conditions, boundary conditions, scenarios, and other data could be made available to different modeling groups. Under both situations, USBR and USACE would require adequate resources for managing the WTMP.
The WTMP provides an excellent foundation for outreach and communication of conditions within Shasta Reservoir and for predicting how conditions evolve during a given year and why. This important communication component of the WTMP should not be underestimated and should be resourced accordingly, particularly in the February to May period between initial allocation and final decisions on water deliveries.
The WTMP is not a real-time flow and temperature forecasting model, primarily because of the difficulty in assimilating temperature observations from across multiple entities with different protocols for data checking and time of reporting. However, it can be used to make short-term predictions if values of flows and temperatures at tributary inflows (Table 2-3) and monitoring stations are assimilated in a timely manner.
The WTMP represents a major initiative by USBR to enhance transparency and accelerate the generation of water temperature predictions along the Sacramento River. The success of this nascent initiative is dependent on adequate support and continued commitment to fostering a community of modelers that can refine and enhance the solid foundation achieved during the past two years.
HEC-5Q
The HEC-5Q model is used by USBR to predict river temperature, but it will soon be replaced with the WTMP because HEC-5Q is considered a legacy model by USACE and is no longer supported. This reservoir routing and temperature model uses meteorological data and flow data, and it employs lumped heat exchange coefficients at the water-atmosphere interface, which tend to be highly calibrated with adjustable parameters. Model outputs (temperature time series) serve, along with empirical daily water temperature data collected near redds, as input to egg-to-fry survival models, such as those produced by Martin et al. (2017) and Anderson et al. (2022). Although HEC-5Q is run at hourly or six-hour time steps, the reported output is a daily average. HEC-5Q logic informs the management of the TCD on Shasta Reservoir.
River Assessment for Forecasting Temperature Model
CE-QUAL-W2 is computationally expensive and requires many inputs. Therefore, only a limited number of simulations or longer-term planning scenarios can be assessed in a given year. Furthermore, the early river temperature models that informed the biological opinions used a weekly time step. To gain a deeper understanding of the response of fish to sub-diurnal time intervals, NMFS developed the RAFT (Pike et al., 2013) model to have
sub-hourly capacity to predict river temperatures below Keswick Dam. RAFT is a simplified version of CE-QUAL-W2 that can run thousands of combinations of operational scenarios. Also embedded in RAFT is the HEC-5Q logic that determines how to manage the TCD for certain objectives. RAFT does not represent operations of Trinity and Whiskeytown reservoirs. Despite these features, RAFT is not currently an integral part of the WTMP and is not used by USBR to guide reservoir operations. Rather, it was used to inform the 2024 NMFS Biological Opinion.
Using the Water Temperature Modeling Platform to Better Understand Physical Processes in Shasta Reservoir
The complex configuration of Shasta Reservoir creates local meteorology and winds that result in different hydraulic mixing within and between the major arms of Shasta Reservoir. CE-QUAL-W2 and the enhanced temperature and water quality monitoring proposed in the earlier section on monitoring can simulate this internal flow structure and anticipate the potential influence on releases, as well as impart greater real-time understanding for the operators responsible for controlling releases. Now that the WTMP is functional, a focused study using the optical temperature chains (DTS) and micro-meteorology stations coupled with the reservoir model is recommended to quantify the relative roles of gate leakage (building on the findings of Daniels et al., 2018; Resource Management Associates, 2003) and short-term fluctuations in the vertical temperature profile in the reservoir. Furthermore, the innovative current study by UC Davis and USBR to use upward-looking ADCP technologies has great potential to help USBR understand the flow structure into the TCD under different reservoir elevations, flow releases, and gate manipulations. These modifications and studies will elucidate more precisely the temperature of water releases into the Sacramento River, and these predictions can be confirmed by relocation of the temperature sensor downstream of the dam to a site where the water is fully mixed across the channel. This knowledge, combined with the WTMP and near real-time data feeds, will (1) enhance the information available to operators who are making short-term decisions on gate operations to help stabilize temperature of releases, (2) better inform the monthly SRG report, and (3) enable operators to communicate with the myriad parties interested in the actions outside the SRG.
To implement the full potential of the WTMP, the Shasta modeling team should do the following:
- Evaluate the importance of storms or high wind events in changing the available coldwater pool as is illustrated in Box 2-3. The study could identify under what conditions these events are important to operations.
- Design an enhanced monitoring system using an LDS (combined DTS and micro-meteorology technologies). This system would be optimized through model simulations and would build on the experience of NOAA, USGS, and USBR. The additional data can be assimilated into the WTMP to ascertain near real-time current conditions throughout the reservoir and to generate updated projections of the expected conditions for that water year. This technology could also reduce the need for manual sampling, although routine maintenance and service would be required in the event of sensor or transmission failure.
- When the WTMP is fully functional, expand on the recent sensitivity analyses (USBR, 2024c) to determine whether additional monitoring of tributary inflows and temperatures would significantly improve the predictive accuracy of the WTMP. The study should determine which tributaries to Shasta and tributaries to the Sacramento River between Shasta and Red Bluff, if any, should be monitored and whether both flow and temperature need to be measured. The study could also recommend whether a full gaging station is needed or whether simple low-cost temperature gages that can be downloaded infrequently would provide adequate information.
- Use the riverine component of the WTMP to conduct a hindcast of the past year to understand the consequences of operational decisions given the changing hydrologic and meteorologic conditions. When running the river model of the WTMP in predictive mode, the results should not be restricted to whether compliance was achieved at selected points along the river. Instead, the WTMP should generate longitudinal temperature profiles to enable ecologists to interpret temperature and flow habitat suitability criteria spatially.
- Use drone technologies to supplement existing manned flights of selected areas of concern in the Sacramento River. Drones equipped with thermal sensors could map fine-scale variation in downstream surface water temperatures in the river with respect to substrate, presence of redds, and zones of mixing, as well as locate where redds are created during the season.
- Continue validation exercises of the WTMP, with specific attention to the transition from HEC-5Q to HEC-ResSim.
- Ensure achievement of the full potential of the WTMP by fostering model enhancements, testing and integrating new models, and upgrading algorithms. These actions are important because current models based on existing or historic information may become less robust because of changes in climate. For example, modelers should pay attention to the air–water interface as longwave radiation and air temperatures increase over time. In recent years, understanding of air–water interfaces has improved substantially (Bray et al., 2025), and this knowledge can be folded into future discussions on temperature management.
***
USBR is to be commended for having taken the steps to build a community of modelers around the WTMP through the selection of open software, regular communication with the science and engineering community through forums such as the California Water and Environmental Modeling Forum, and open events hosted by USBR. USBR should continue to ensure that data used in the WTMP and the details of scenario model runs are easily accessible, enabling modelers to test algorithms and next-generation models in parallel with the industry-standard models that are already deployed.
Biological Modeling for the Shasta Coldwater Pool Management Action
A suite of biological tools and models informs decisions related to Shasta coldwater pool management. They range from simple risk assessment tools and empirically derived statistical relationships to process-based simulation models. They are used to forecast or evaluate outcomes such as egg-to-fry survival, juvenile passage, temperature-dependent mortality, floodplain habitat accessibility, and vulnerability to stranding or dewatering. The development and calibration of some of these tools are coupled with field monitoring and hydrologic simulation platforms such as CalSim3, HEC-5Q, and HEC-RAS to support both near-term operations and long-term scenario planning.
Model or tool outputs are used to guide seasonal temperature targets, determine coldwater pool storage targets, assess the feasibility and tradeoffs of pulse flows and release schedules, and project egg-to-fry survival under different temperature regimes. They also help to quantify cumulative biological risks under extended drought conditions or alternative management strategies. Managers typically weigh modeling results alongside other lines of evidence—including recent empirical observations, seasonal forecasts, and regulatory thresholds—as part of a broader deliberative process (USBR, 2024a). Although some models include ensemble runs or sensitivity analysis, uncertainty in both parameter estimates and structural assumptions remains a limiting factor for predictive precision and transparent risk communication (Rose et al., 2010), and the mechanisms through which model outputs are incorporated into decision making are often indirect or nontransparent (Rose et al., 2024; USBR, 2024f).
The following tools and models are described in Appendix D, starting with the simpler tools and empirical relationships and ending with the mechanistic life-cycle models of winter-run Chinook salmon.
- Redd dewatering tools
- Juvenile stranding tools
- Floodplain inundation and habitat models
- Temperature-dependent models of egg-to-fry mortality
- Quantitative winter-run Chinook salmon life-cycle models
- Interactive Object-Oriented Simulation model (Zeug et al., 2012) and its update, Zeug+
- Oncorhynchus Bayesian Analysis Network (USBR, 2024f)
- Winter-Run Life Cycle Model (WRLCM) developed by NMFS’s Southwest Fisheries Science Center (Hendrix et al., 2024)
- Central Valley Project Improvement Act (CVPIA) Science Integration Team (SIT) Winter-run Lifecycle Model (Peterson and Duarte, 2020) as well as the more expansive Reorienting to Recovery (R2R) Decision Support Model (DSM) derived from it
This section focuses on models of egg-to-fry survival—a key transition for winter-run Chinook salmon and the subject of much recent scientific effort—and the quantitative winter-run life-cycle models.
Modeling Egg-to-Fry Survival and Unattributed Mortality
Egg-to-fry survival is a sensitive life stage for winter-run Chinook. For the purposes of informing coldwater pool management, it is computed using estimates of the number, timing, and distribution of eggs based on redd surveys and carcass mark-recapture surveys, combined with modeled temperature-dependent mortality during egg development and estimates of the number of fry that reach Red Bluff Diversion Dam (RBDD). The number of eggs that hatch and survive to become fry directly contributes to the number of winter-run Chinook that eventually reach RBDD, thus affecting the calculation of the yearly winter-run JPE—see Chapter 3. The section below reviews the models and methods used to determine egg-to-fry survival as well as highlights focal areas that may be critical for reducing the existing uncertainty. Reducing the uncertainty around the relative importance of factors contributing to but not currently accounted for in estimates of egg-to-fry survival may hold greater potential for managing temperature than seeking a universally optimal threshold.
Several abiotic and biotic processes can contribute to mortality during the period from spawning through early alevin and fry life-history stages. Sources of mortality include inhospitable water temperature and dissolved oxygen concentrations, suboptimal redd composition and location, instream and hyporheic flow dynamics, predation, toxicity from contaminants, poor food availability, and pathogens and disease, such as thiamine deficiency (Mantua et al., 2021; Windell et al., 2017). Of these, temperature-dependent mortality is the only cause that is routinely quantified through mechanistic models. Two detailed quantitative simulation studies highlight many of the complexities associated with determining optimal temperature requirements and flow regimes needed to support winter-run egg-to-fry survival (Anderson et al., 2022; Martin et al., 2020). These models estimate egg and alevin survival as a function of river temperatures during development, linking thermal exposure to mortality risk through either cumulative or stage-specific mechanisms. While these egg-to-fry mortality models attempt to capture temperature dependence, they do not resolve the full set of mechanisms affecting survivorship (e.g., interstitial flow rates, gravel structure, substrate quality) and are thus imperfect representations of dynamics within redds.
NMFS Temperature-Dependent Egg Mortality Model.
The Martin model (Martin et al., 2020) applies a dose–response approach, assuming that thermal stress accumulates when daily temperatures exceed a threshold. Mortality is modeled as a function of the magnitude and duration of temperature threshold exceedance. Although grounded in oxygen-limitation theory, the model does not explicitly resolve oxygen supply and demand; instead, it uses cumulative thermal metrics as a proxy for metabolic stress. Monte Carlo sampling enables exploration of how uncertainty in thermal thresholds, metabolic scaling, and developmental timing influences survival, which makes the model especially useful for stress testing and scenario planning.
Anderson Egg Mortality Model.
The Anderson model uses a stage-specific framework based on mass transfer theory. It identifies a critical window near the end of egg development when oxygen demand increases sharply because of embryo growth and oxygen diffusion remains constrained. Mortality results when oxygen demand exceeds supply during this period. The model functionally uses temperature as a proxy for oxygen, and scales oxygen flux and metabolic demand with egg mass and development rate; it is calibrated to winter-run Chinook salmon survival data from 2002 to 2020 in the upper Sacramento River (Anderson et al., 2022). Empirical and experimental studies support the biological premise that diffusion limits oxygen supply during later stages of development, making embryos vulnerable to temperature-induced hypoxia (Del Rio et al., 2019, 2021). Although the Anderson model improves biological realism and provides a physiological foundation, its current implementation
uses fixed parameter values for background and density-dependent mortality and does not quantify uncertainty in model outputs (USBR, 2024a).
Although the effects of water temperature on egg-to-fry survival have been well studied in this system (Alderdice and Velsen, 1978; Anderson et al., 2022; Del Rio et al., 2019, 2021; Martin et al., 2017), uncertainty around temperature thresholds remains. Much of the debate about optimization of temperature thresholds neglects the broader ecosystem context of uncertainty for any given threshold. The physical environment that developing salmon eggs experience within redds varies across the entirety of the spawning reach because of differences in features such as channel shape, gravel size, sediment composition, and the movement of water through the riverbed (known as hyporheic flow). This spatial variability means that eggs in different locations may respond differently to the same water temperature. Any individual temperature threshold is unlikely to be optimal everywhere because of variation in localized conditions. Thus, reducing the uncertainty around the relative importance of those factors in mediating the temperature-survivorship response across the entirety of the spawning grounds may hold greater potential for managing temperature than seeking a universally optimal threshold. In fact, a universally applied threshold would likely need to be more conservative (i.e., colder) to guarantee the minimum functional effect in the face of spatial variability in responses across the spawning reach.
The relative importance of all the other factors contributing to mortality, currently bundled under the category of “unattributed mortality” in calculations done by USBR, remains unclear. According to Buttermore (2024), the contributions from any specific non-temperature-dependent source of mortality can be substantial, with unattributed mortality determined to be greater than temperature-dependent mortality in 17 of the past 20 years. Characterizing and quantifying the relative importance of several of these factors is a critical and rapidly developing area of research, one that is a priority focus of USBR and other agencies. For example, artificial redd experiments have occurred or are getting underway to assess critical factors affecting redd habitat quality as a function of environmental and managerial drivers, including temperature, dissolved oxygen, gravel quality, and river flow. Laboratory flume experiments using synthetic salmon redds have demonstrated that the roughness of the redd surface and the permeability of the egg pocket strongly influence the delivery of oxygenated water to incubating embryos (Hilliard et al., 2025). On the Sacramento River, artificial redd experiments have been planned (Cavallo, 2024; Plumb et al., 2024) but not yet executed; they will assess critical factors affecting redd habitat quality as a function of environmental and operational drivers.
To translate findings from these experiments into practical management tools, coordination across studies is essential. For example, results from artificial redd experiments could be systematically integrated with spatially explicit redd survey data and temperature modeling outputs to identify reach-specific drivers of mortality. A coordinated effort could involve standardizing field protocols, aligning experimental variables (e.g., flow treatments or gravel composition), and establishing a shared data platform to enable comparison across systems and years. This effort would allow researchers to link laboratory and field studies to predictive models, improving the attribution of observed egg-to-fry losses to specific mechanisms and guiding bin selection and coldwater allocation more precisely.
Developing a clearer mechanistic understanding of interactions between flow, redd physical structure, dissolved oxygen concentrations, and temperature may enable refinement of temperature thresholds and the range of resulting management strategies, and the Committee agrees that such efforts are warranted. Moving forward, coordination across studies and an evaluation of the science involved in relation to existing redd and spawning surveys will be vital to translating newly developing scientific understanding into useful management tools. Moreover, the most important questions warranting exploration center on other important factors that may contribute to unattributed mortality, such as the following:
- How do habitat availability, access, and quality relate to food availability and predatory pressure under different flow and temperature regimes?
- How does variability in hyporheic flows and redd structure relate to concentrations of contaminants?
- To what extent might interactive effects among factors contributing to mortality result in nonlinear increases in mortality, and how might that inform management decision making?
Other studies have considered taking a broader focus across other life-history stages (Crozier et al., 2021; Dahlke et al., 2020; Hendrix et al., 2014; Merz et al., 2013). Wohner et al. (2022), for example, highlight the potential for integrating monitoring and optimization modeling to inform flow decisions that increase success for outmigrating Chinook salmon smolts.
Better Use of Quantitative Life-Cycle Models
Shasta coldwater pool management is not having the intended impact on winter-run Chinook salmon recovery. The action tends to focus effort on narrow and incremental improvements rather than evaluations of other actions—or collections of actions—that could be more effective. A broader focus would be greatly aided by the fish life-cycle models that simulate biological and ecological processes and their relationship to environmental and managerial factors in the upper Sacramento River watershed/Bay-Delta region (see Appendix D for model descriptions). There are only two quantitative life-cycle models for winter-run Chinook—WRLCM and the CVPIA SIT Model (more recently expanded into the R2R Decision Support Model). They are not used in regular Shasta operations, including coldwater pool management. Rather, they are used intermittently to support long-term planning and the ESA reconsultation by enabling managers to explore the impacts of different operational choices. Differences in model structure, calibration methods, and treatment of uncertainty mean that no single model provides a definitive forecast. Instead, these models have been employed as complementary tools offering different perspectives on how operations may affect population viability (Rose et al., 2024; USBR, 2024a).
Chinook salmon life-cycle models (e.g., CVPIA SIT, WRLCM, R2R DSM) could be used to systematically investigate how combinations of stressors interact to influence both egg-to-fry survival and juvenile growth and survival in a spatially explicit context. A proactive approach will facilitate comparison of the effects and relative potential population benefits of both individual actions and suites of actions (as is being done in CVPIA SIT restoration planning, R2R, and winter-run drought management). For example, a multi-scenario model run could compare the outcomes of coldwater pool-only management to integrated strategies that combine temperature control with gravel enhancement, habitat restoration designed to improve food abundance or reduce predatory pressure, or thiamine treatment of spawners. With this approach, managers could quantify tradeoffs and identify which combinations offer the best gains in survival for a given water-year type.
Another activity to consider is using the quantitative life-cycle models to identify and comprehensively examine a series of alternative management actions to evaluate the systemwide tradeoffs. In many areas of marine fisheries management, assessment models that estimate the abundance and production of fish and the quality and availability of other resources in the system (e.g., habitat, food, aquatic environment) can be used interactively and even in real time to identify and implement reasonable sets of actions. One approach is known as management strategy evaluation (MSE), in which the methods of monitoring and assessment are established and modeled to interact with and produce results under a variety of quantifiable management actions known as control rules. Such approaches can be automated to explore a number of control rules, but once a set of optimal control rules is identified, a set of actions can be made available to explore the consequences of taking such actions in real time (e.g., annually or even on a monthly or weekly basis). Such an approach could be implemented in the upper Sacramento and Delta system in a stepwise fashion by taking existing quantitative integrated life-cycle models and simulating one by one the consequences of different managerial options under different environmental conditions. An MSE approach might, for example, guide hypothesis development and steer efforts to understand unattributed mortality in the egg-to-fry stage, helping to answer some of the questions posed in the section above. Likewise, it would contribute to a better understanding of the extent to which targeted restoration efforts between RBDD and the Delta, or different flow management strategies, might improve survivorship.
Others have made similar recommendations. The recent five-year review of winter-run Chinook salmon (NMFS, 2024a) indicates that options exist, beyond coldwater pool management, to promote the survival and recovery of the species inhabiting this system including evaluating the benefits of non-natal rearing habitats in the
context of different functional flow regimes, investigating sources of early life-stage mortality beyond temperature effects, and enhancing monitoring activities and juvenile abundance estimates to better inform both model simulations and management decision making.
There is value in exploring the ways in which the existing quantitative life-cycle models could be more broadly utilized and integrated to understand the consequences of different simulated scenarios. Life-cycle modeling can help to operationalize recommendations by estimating which of the options are most likely to reduce unattributed mortality and by how much, under realistic environmental constraints. Rather than treating unattributed mortality as a residual loss, it can be treated as a solvable problem—partitioned, modeled, and reduced through targeted, scenario-based exploration. If their use became more regular and interactive, these integrated life-cycle models, in conjunction with existing hydrological and climatological models, could help to drive alternative management actions rather than examining actions only occasionally and retrospectively.
Quantitative models can also be used to optimize the allocation and timing of monitoring efforts. Imagine that multiple elements of the ecosystem are being monitored, such as egg survival, juvenile passage through pumping stations, juvenile survival at downstream locations, proportion and genetic makeup of hatchery-reared versus natural adult returns, habitat use by different life stages, and habitat maintenance. A life-cycle model could be used to comprehensively identify all of the bottlenecks to survival in the system, including those currently categorized as unattributed mortality during the egg-to-fry stage, and then to determine the sampling effort needed to reduce uncertainty at each stage. For example, if the model identifies early alevin or fry mortality in specific reaches as a significant driver of population loss, then targeted monitoring could be deployed to assess habitat quality and predation pressure. Prioritization could then be done to focus on those actions that will have the greatest value in promoting overall survival. In this way, life-cycle models can be used in conjunction with ongoing monitoring efforts to guide the hydrologic actions as opposed to evaluating the actions post hoc.
In summary, USBR and its partners are encouraged to further develop the quantitative life-cycle models along with their associated monitoring data requirements and then employ the models to explore the consequences of alternative actions, with the goal of optimizing the survival and recovery of winter-run Chinook salmon. Many of the modeling concepts, and even the models themselves, already exist. Needed are efforts to use the existing life-cycle models more effectively and in an interactive, comprehensive, and adaptive way. To capture additional sources of mortality across life-history stages, model structures would need to include functions that explicitly link survival to measured environmental drivers (e.g., sediment load, predation pressure, habitat quality), allowing those factors to vary dynamically. Developing such functions would require empirical data from targeted field studies that quantify how these drivers affect survival under different conditions. By linking mortality attribution, monitoring design, and management action within a single simulation framework, life-cycle models can help to prioritize management actions that will have the greatest value in improving survival. In this way, life-cycle models can be used not only to predict biological outcomes but also to guide and optimize hydrological operations.
ADDITIONAL SCIENCE TOPICS
The discussion that follows recommends improvements to the Shasta Coldwater Pool Management Action that go beyond monitoring and modeling. In providing these recommendations, the Committee has assumed that temperature management in the Sacramento River below Keswick Dam will be a primary strategy for preventing extinction of winter-run Chinook salmon over the short term. But, for reasons explained below, the Committee also recommends restoring winter-run Chinook salmon to historic coldwater habitats both upstream of Shasta Reservoir and in Battle Creek. For the foreseeable future, both approaches, along with the maintenance of the winter-run hatchery, will likely be essential to the protection and eventual recovery of winter-run Chinook salmon populations.
Improvements to Flows and Geomorphology Immediately Downstream of Keswick Dam
The physical and ecological changes that occur in river channels downstream of large dams are well documented (e.g., USGS, 1996), and the Sacramento River downstream of Keswick Dam has not been immune to these changes. Changes to physical conditions can include reductions in sediment transport, armoring of the channel bed,
altered hydrographs that influence geomorphic characteristics and biological cues, channel incision, reduced connectivity to floodplains, loss of gravels suitable for spawning, reduction in the topography of pool–riffle sequences, armored banks that can reduce refuge habitat and inhibit meandering, reduction in hyporheic flows, altered seasonal water temperatures, loss of riparian vegetation and associated shading, and widening and shallowing of the cross-section that can contribute to enhanced warming of the water. There is an extensive literature on these changes as well as remedial measures taken to overcome them (e.g., Palmer and Ruhi, 2019; Poff et al., 1997). For example, pulse flows are sometimes used to sustain diversity of channel morphology and initiate biological cues.
The reach just downstream of Keswick Dam is where most winter-run Chinook salmon spawning currently occurs because water temperatures are maintained at levels conducive to spawning (Figure 2-4). Yet this reach tends to lack geomorphic diversity (Cavallo, 2024; Plumb et al., 2024), and the less pronounced and less frequent pool–riffle sequences in this reach are likely to restrict hyporheic flow through redds compared to reaches with well-defined riffles (Tonina and Buffington, 2007, 2011). Ongoing studies by consultants (Cavallo, 2024) and USGS and USBR (Plumb et al., 2024) aim to better understand the functioning of redds under a range of flow and channel conditions (varying such parameters as flow rate, water temperature, oxygen, and sediment fines) as a way to further explore egg-to-fry mortality. It would be beneficial if these field studies could be supplemented with a detailed geomorphic study of the lengthy reach below Keswick Dam to identify locations where restoration or augmentation activities would be the most effective and sustainable overall. A geomorphic study might develop explicit predictions regarding the potential tradeoffs of certain channel restoration actions in different locations. Examples of the actions or combination of actions in the reaches downstream of Keswick Dam that could be evaluated include the following:
- The benefits and persistence of riffles resulting from gravel augmentation;
- The location, scale, and benefits associated with river and floodplain restoration actions; and
- The role of pulse flows in establishing and sustaining channel morphology conducive to functioning redds, accelerating outmigration of smolts, and triggering biological cues that enhance spawning and egg-to-fry survivability.
Winter-Run Chinook Salmon Reintroduction
The Sacramento River winter-run Chinook salmon historically occurred in the upper reaches of the Sacramento River, its largest upper elevation tributaries (the McCloud River and the Pit River), and Battle Creek. Sacramento River winter-run is the only known Chinook sub-species exhibiting this run timing, which is presumed to be an adaptation to the long migratory pathways and perennially cold waters associated with those ancestral habitats. The construction of Shasta Dam flooded Winnemem Wintu villages and sacred ceremonial sites and displaced the tribe and their Nur14 (Chinook salmon) from the cold, spring-fed waters of the Winnemem Waywaket (McCloud River) where the Winnemem Wintu and the salmon had lived synergistically since time immemorial, as well as from the Sacramento River’s other largest tributaries (Johnson, 2023a). In the nearly 80 years since the completion of Shasta Dam, the winter-run population has reproduced in the hotter, lower-elevation Sacramento River, and has dwindled to the point of being listed as endangered. Box 2-4 makes clear the myriad environmental stressors affecting winter-run Chinook salmon in the Sacramento River watershed, which are not limited to the effects of the Projects. The winter-run stressors presented in Box 2-4, along with similar considerations for the other Chinook runs, are examples of components that could be included in the previously discussed life-cycle model-based framework to inform operations and support decision making.
During the past several decades, interest in reintroducing winter-run into their historic habitat above Shasta Dam has grown. Preliminary investigations by USBR and others were initiated in the early 2000s and have progressed, carried forward by state and federal agencies, nongovernmental organizations, tribal representatives,
___________________
14Nur is the Winnemem word referring to the ancestral salmon of the McCloud River and their progeny. It encompasses those individuals/populations commonly referred to as winter-run Chinook salmon, as well as those Sacramento River and its tributaries salmon species established in New Zealand and elsewhere.
BOX 2-4
Key Stressors for Sacramento River Winter-Run Chinook Salmon
The geographic and temporal diversity and extent of their freshwater habitat use has resulted in winter-run Chinook salmon being susceptible to impacts from a commensurately diverse range of landscape and ecosystem changes through time. In thinking about their protection beyond coldwater pool management, the Committee considered the impacts of 12 stressors on winter-run juveniles and adults, based on a review of relevant literature. The stressors are listed in the rows of Table 2-4, while the columns rank (1) impact of the stressor on fish, (2) the proximity of those impacts to the Projects (e.g., linked either directly or indirectly via a well-established driver-linkage-outcome relationship), and (3) potential for impact reduction via reoperation of the Projects based on the Committee’s best professional judgment and informed by (1) and (2). “Operation” (alone or in the context of reoperation) is defined as presence or use of existing infrastructure, the resulting hydrology and hydrogeomorphic dynamics, and manipulation of exports. Stressors categorized as medium or high rank across all three columns for a given life stage indicate a potential opportunity for stressor reduction through changes in Project operations. Justifications for the rankings are given in the text below and elsewhere throughout this report. For example, Appendix E describes certain stressors to winter-run Chinook salmon in greater detail, Chapter 3 describes entrainment of winter-run Chinook in the pumps and the South Delta, and the role of hatcheries in supporting winter-run populations is discussed in Chapter 2.
| STRESSOR ASSESSMENT KEY | ||||
|---|---|---|---|---|
| Magnitude | Low | Med | High | Unknown or N/A |
| Impact – The stressor severity and/or extent (spatial, temporal) of impact to the species | Results in sublethal effects and/or contributes to individual mortality indirectly; not considered a population level threat | Results in direct mortality to individuals and/or population level impacts when paired with another stressor of similar magnitude | Results in population level impacts | Level or extent (spatial/temporal) of impact unknown or poorly understood |
| CVP Proximity – the extent to which the stressor is a direct effect of CVP operations or infrastructure | Related to CVP only indirectly or via weak or inconsistent driver-linkage-outcome relationship(s) | Related to CVP indirectly via consistent driver-linkage-outcome relationship; or directly with weak or inconsistent effect | Related to the CVP via strong and/or consistent direct effect | No or unknown relationship to the CVP |
| Reoperation potential – The extent to which the stressor can be reduced through changes to CVP operations | Unlikely to be improved or resolved through changes to CVP; requiring non/extra-CVP related actions for improvement | May be somewhat improved through changes to CVP alone and/or significantly improved or resolved through a combination of CVP and other actions | May be significantly improved or resolved through changes to the CVP alone | Changes to CVP likely to have no effect and/or other factors expected to render effect of CVP changes inconsequential |
| Stressor | Life stage | Impact extent | CVP proximity | Reoperation potential |
|---|---|---|---|---|
| Loss of habitat access/area (due to physical alteration, infrastructure) | Juvenile | |||
| Adult | ||||
| Degradation in habitat quality/suitability (due to hydrodynamics, ecosystem condition) | Juvenile | |||
| Adult | ||||
| Disease (exacerbated by high water temperatures) | Juvenile | |||
| Adult | ||||
| Stranding/false pathways (due to flow changes and/or human infrastructure) | Juvenile | |||
| Adult | ||||
| Interspecies competition (including Chinook) | Juvenile | |||
| Adult | ||||
| Entrainment in agricultural diversions (including CVP and SWP Delta pumping facilities) | Juvenile | |||
| Adult | ||||
| High predation rates (human mediated) | Juvenile | |||
| Adult | ||||
| Degraded water quality (from agricultural and urban runoff) | Juvenile | |||
| Adult | ||||
| Hatchery biological (genetic introgression, competition) | Juvenile | |||
| Adult | ||||
| Hatchery management (cultivation and supplementation) | Juvenile | |||
| Adult | ||||
| Overfishing | Juvenile | |||
| Adult | ||||
| Climate Change | Juvenile | |||
| Adult |
Loss of habitat access/area (due to physical alteration, infrastructure).
At least 1,057 miles of the stream lengths historically available to salmon (or 48 percent of the total habitat, greater than 72 percent of the spawning habitat) have been lost as a function of dams from the original total of 2,183 miles in the Central Valley drainages (Yoshiyama et al., 2001). As much as 80 percent of the floodplain habitat historically accessible to Chinook salmon has been lost as a function of levees and reduced flows during critical portions of the outmigration window (Katz et al., 2012). Of the remaining portions, the vast majority for the Sacramento drainage is located within the Yolo and Sutter bypasses and activated primarily during flood events. Winter-run Chinook salmon are disproportionately affected by lack of access to higher-elevation portions of the habitat which provide the cold spring and snowmelt-fed conditions they require for over-summering and the yearling life-history strategy. Hence, for both juveniles and adults, the level of impact related to loss of habitat access/area, along with the proximity to CVP and SWP operations, is ranked high.
Reoperation opportunities include (but are not limited to) passage for adults into the upper watershed and release of additional flows to inundate floodplain habitats along the channel margin and in the bypasses during critical outmigration windows, potentially in combination with floodplain habitat restoration. Reoperation potential is ranked medium because of other confounding stressors (e.g., climate change) that are less amenable to being resolved through reoperation.
Degradation in habitat quality/suitability (due to hydrodynamics, ecosystem condition).
The abundance and accessibility of food and the energetic consequences of foraging vary among habitats and through time, providing a shifting mosaic of growth opportunities for fish in rivers (Rossi et al., 2024). The disruption of longitudinal connectivity in the river continuum caused by dams, the disruption of latitudinal connectivity with floodplains caused by levees, and changes to seasonal hydrodynamics caused by both of those physical structures, by diversions, and by managed flows have resulted in alteration, degradation, and disruption of ecosystem and food-web processes (Henery et al., 2010; Jeffres et al., 2008; Johnston et al., 2018; Limm and Marchetti, 2009; Michel et al., 2021; Sommer et al., 2001; SST, 2017; Takata et al., 2017). For both juveniles and adults, the impact of the Projects on habitat degradation and the proximity to Project operations are ranked high.
Reoperation opportunities include (but are not limited to) passage for adults into the significantly less impacted upper watershed habitat, release of additional flows to inundate floodplain habitats along the channel margin and in the bypasses during critical outmigration windows, and release of additional flows to improve juvenile survival during outmigration in the Sacramento mainstem and Delta. As above, reoperation potential is ranked medium for juveniles due to other stressors (e.g., climate change downstream of Shasta) that exacerbate the level of impact and would not be resolved through reoperation. Reoperation potential is ranked low for adults because (1) CVP operations do not significantly influence habitat quality or suitability in the historic above-dam habitats and (2) flexibility to create improved habitat conditions for adults downstream of Shasta through changed operations is currently limited.
Disease (exacerbated by high water temperatures).
Several different disease types (e.g., bacteria, parasites) posing risk to Chinook salmon are exacerbated by high water temperatures (Antonio and Hedrick, 1995; Holt et al., 1989). In the Sacramento River specifically, evidence suggests that pathogen-infected juveniles have lower outmigration success (Mauduit et al., 2022). Lack of access to historic habitat about Shasta Dam, along with increased demands on limited water resources, warmer seasonal air temperatures, and more frequent droughts increase the likelihood of winter-run Chinook salmon in the Sacramento River encountering less favorable temperatures. In part, as a result, the risk to winter-run from disease has been increasing. Emerging concerns include the advent of a thiamine deficiency complex, which has been observed to cause increased mortality in the early life stages of the winter-run Evolutionarily Significant Unit (NMFS, 2024a). CVP proximity is ranked high for adults due to both (1) CVP infrastructure preventing access to perennially cold historic upper watershed habitats and (2) the primary role that operations play in determining temperatures and creating or alleviating associated thermal stress that adult salmon experience in the current habitat downstream of Shasta Dam. CVP proximity for juveniles, on the other hand, is low because factors beyond CVP operations contribute to the temperatures juveniles experience.
Because the impacts from disease, as well as when and under what conditions impacts occur, are unknown for adults, reoperation potential to address this stressor is considered unknown. Reoperation potential is ranked low for juveniles because temperature conditions for juveniles can only be controlled to a limited extent via (1) translocation, which only fixes temperatures for a limited time/area of their outmigration, or (2) downstream temperature management, which even under the best circumstances is limited.
Stranding/false pathways including Delta routing (due to flow changes and/or human infrastructure).
Chinook salmon in the Central Valley evolved to take advantage of the heterogeneity of the habitat both in terms of landform and hydrology. Human alteration of the landscape, migration corridors, and the hydrograph has created the potential for species impacts from stranding (due to hydraulic variation) and false pathways to detrimental routing, especially in the Delta (Perry et al., 2018; SST, 2017). Impact extent is ranked medium for both juveniles and adults as both experience direct mortality from stranding and/or false pathways.
CVP proximity and reoperation potential are greater (ranked medium) for juveniles than for adults (ranked low) as operations have a larger relative influence on the extent to which the juvenile life stage is impacted (e.g., via Delta routing) versus the adult life stage (e.g., via stranding in the Yolo Bypass).
Interspecies competition.
Interspecies competition between juvenile winter-run and other species and other Chinook run timings primarily results from winter-run rearing in non-historic habitat, which is a function of Project operations (hence the high rank for proximity). The extent and severity of these impacts, however, is poorly understood. For adults, the impact is ranked low because spawning habitat availability and allocation of flow to support both fall-run and winter-run are known challenges (Jason Robers, CDFW, personal communication, 2024) and are actively being managed. Reoperation potential is accordingly unknown for juveniles and ranked low for adults.
Entrainment in diversions (including CVP and SWP Delta pumping facilities).
Water export operations contribute to juvenile salmonid mortality in the Delta via direct mortality at the pumps. Direct mortality (at the facilities) is a combination of pre-screen and within-facility mortality (including mortality during salvage and transport) and entrainment into the pumps and water conveyance canals. However, direct mortality does not account for the majority of juvenile Chinook salmon mortality in the Delta (Box 3-3) (hence the low ranking for impact and reoperation potential). The mechanisms and associated magnitudes of specific indirect effects of water project operations on juvenile Chinook mortality in the Delta but outside the facilities are poorly understood (SST, 2017).
High predation rates (human mediated).
Hypothesized factors contributing to the observed flow-correlated survival rates in the Sacramento River (Michel et al., 2021) and low Delta survival of juvenile Chinook salmon include (1) increased abundance and metabolic rate of predatory fish such as striped bass and largemouth bass in the Delta; (2) water project operations affecting the magnitude and timing of flow, resulting in increased juvenile salmonid predation mortality; and (3) changes in Delta habitat including expansion of non-native submerged aquatic vegetation and increased water clarity (NMFS, 2024a; SST, 2017). Given the many causes of habitat degradation in the Delta, reoperation potential is ranked medium.
Degraded water quality.
While there is evidence for both agricultural products (e.g., pesticides) and urban runoff (e.g., 6PPD) negatively affecting Chinook salmon (Anzalone et al., 2022; Lo et al., 2023) as well as the relationship between those effects and hydrogeomorphic dynamics in the Sacramento River system (Anzalone et al., 2022; Fuller et al., 2022), the extent of the impact of degraded water quality to winter-run in the Sacramento River system specifically is poorly understood. Proximity of these effects to CVP operations is limited for both juveniles and adults, resulting in unknown potential for remediation through reoperation.
Hatchery effects, both biological (genetic introgression, competition) and management related (cultivation and supplementation effects).
Hatchery supplementation remains a key conservation strategy for Central Valley Chinook salmon generally and winter-run Chinook salmon specifically. Competition between hatchery-produced Chinook and in-river spawning winter-run Chinook exists. However, the relatively small
universities, private landowners, and timber and valley water interests. In 2014 the NMFS Recovery Plan for Sacramento River Winter-Run and Central Valley Spring-Run Chinook Salmon specifically identified reintroduction above the valley rim dams as a critical need (NMFS, 2014).
In parallel, a number of key efforts exploring the possibility of winter-run reintroduction began to take form, including the following: (1) an assessment by USBR of habitat condition to support winter-run above Shasta Dam, which identified suitable conditions in both the McCloud and upper Sacramento rivers (USBR, 2014); (2) a suite of investigations into potential approaches for the capture and transport of juvenile outmigrating salmon before or during entrance into Shasta Reservoir; and (3) an investigation initiated and led by the Winnemem Wintu into the possibility of bolstering imperiled winter run populations by reintroducing Sacramento River-origin Chinook salmon historically translocated to New Zealand back into the Sacramento River system (Winnemem Wintu, 2016). Despite these efforts, successful reintroduction and translocation or passage of winter-run Chinook salmon around Shasta Dam was perceived as physically unachievable, cost-prohibitive, or politically infeasible, with few examples from other areas that were models of success. Key activities currently advancing winter-run reintroduction are discussed below.
population size and extent of reliance on hatchery supplementation as a mechanism for conservation result in competition- or introgression-related impacts being relatively minor and difficult to pinpoint. That said, the influence of hatchery broodstock has been identified as a key reason that winter-run populations remain at a high risk of extinction (NMFS, 2024a), and preliminary evidence suggests that several negative impacts associated with prolonged reliance on hatchery production are detectable in winter-run (Steven Lindley, former NMFS, personal communication, 2024).
Reoperation actions that provide an alternative to reliance on hatchery propagation and/or increase the potential for natural spawning and successful in-river juvenile rearing (principally reintroduction above dams and to a lesser extent coldwater pool management) may significantly reduce reliance on hatcheries, especially in years when adult escapement is low and hatchery supplementation has a disproportionately large effect on the recovering population.
Overfishing.
Harvest of winter-run has the potential to occur in years when commercial and recreational fisheries for fall-run Chinook salmon are open. Conservation and management measures to prevent harvest of winter-run include closures and non-retention periods for specific areas in the Sacramento River, as well as timing and location restrictions for ocean commercial and recreational fisheries (CDFG, 2004). Some estimated spawner reduction rates have ranged from 0.26 in 1988 to 0.23 in 1999 (CDFG, 2004). Total bycatch in any given year, however, is not well understood. In addition, the primary risk for bycatch occurs in the ocean fishery with minimal proximity to CVP and SWP operations, hence the unknown rankings for this stressor for both CVP proximity and reoperation potential.
Climate change.
Specific individual and multiple consecutive drought years are already measurably affecting the condition of California salmon populations directly, indirectly, and in combination with other stressors. Effects include but are not limited to direct impact on the extent, availability, and quality of habitat; ecosystem productivity and food-web dynamics; and predator-prey dynamics, as well as potential indirect impacts on fish behavior. For adults specifically, spawning already occurs in a significantly different, less suitable, lower elevation, more climate-vulnerable habitat—in close proximity to Shasta Dam.
Stream warming that might jeopardize adult spawning (for example) can be mitigated to some extent through coldwater pool management. Other opportunities include reintroduction to more climate resilient habitat above dams (assuming the infrastructural challenges can be overcome), as well as restoration of physical and ecological processes and associated habitats that support species condition and resilience within their existing ranges (e.g., floodplain restoration and gravel augmentation).
Juvenile Collection
In February 2022, CDWR received $1.5 million for the Juvenile Salmonid Collection System (JSC) Pilot Project in the upper McCloud arm of Shasta Reservoir, with the goal of evaluating the viability of juvenile salmon collection during emigration from the McCloud River. The project was specifically initiated to test an experimental, mobile guidance and capture system designed to collect outmigrating salmon and to determine whether it creates the desired conditions for fish, water temperatures, and debris management. The initial project was a collaborative effort between CDWR, CDFW, NMFS, and the Winnemem Wintu Tribe; construction is now complete (CDWR, 2022) with ongoing collection occurring as a component of the reintroduction efforts using a combination of the JSC and other collection methodologies. Overall, juvenile collection has continued to improve each year, with efficiencies reaching 75 percent in 2024 and greater than 13,000 juveniles transported downstream of Keswick Dam to continue their journey to the ocean (Rachel Johnson, NMFS, personal communication, September 2025). The measured collection efficiencies have been incorporated into preliminary life-cycle modeling. The modeling results suggest that, at current levels of collection efficiencies and outmigrant survival, the addition of upper watershed rearing has the potential to increase the likelihood of outmigrant success and survival to adulthood, especially in those years with dry or critically dry conditions in the lower Sacramento River (Noble Hendrix, QEDA Consulting LLC, personal communication, September 2025).
Drought Response
In 2022, in response to near unprecedented drought at a time when winter-run numbers were hovering around their lowest in history, NMFS and CDFW initiated a suite of emergency drought actions that included (1) increasing production of winter-run Chinook salmon at Livingston Stone National Fish Hatchery; (2) relocating a portion of adult winter-run Chinook salmon trapped at Coleman National Fish Hatchery and the Keswick Trap to Battle Creek, upstream of Eagle Canyon Dam; (3) relocating spring-run Chinook salmon collected incidentally at the Keswick Trap to Clear Creek; (4) initiating a secondary captive broodstock of winter-run Chinook salmon; and (5) incubating a portion of winter-run Chinook salmon eggs from Livingston Stone National Fish Hatchery along the McCloud River (Johnson, 2023b). While these measures appear to have been effective at averting some potential drought impacts for winter- and spring-run populations, both populations continue to hover at critically low levels.
Experimental Reintroduction of Winter-Run Chinook Salmon from New Zealand
The Winnemem Wintu Tribe is working to reintroduce winter-run Chinook salmon, which are currently reproducing naturally in New Zealand, back into the McCloud River. They have been collaborating with New Zealand biologists and Māori peoples to secure eyed eggs for broodstock cultivation in the United States, as part of a larger plan to restore the salmon population (Winnemem Wintu, 2016). Funding is needed to continue these efforts and to synthesize the data and information already gathered so that co-managers can make recommendations about a path forward. In addition, concerns over the potential introduction of both known and unknown foreign pathogens continue to challenge advancement of an experimental introduction in the McCloud (Sisk, 2024).
Passage Investigations
In spring 2023, the Winnemem Wintu Tribe, CDFW, and NMFS entered into historic salmon management and stewardship agreements. The coalition of “co-managers” comprised of CDFW, NMFS, and the Winnemem Wintu Tribe, with support from USGS and environmental consultants Anchor QEA and HDR and Associates, is developing a plan for studying volitional passage of winter-run Chinook salmon around Keswick and Shasta dams that includes the following core components (John Ferguson, Anchor QEA, personal communication, 2024):
- Gather critical biological and physical information needed to inform the development of engineering alternatives for fish passage, volitional or otherwise, and assess data gaps.
- Determine the feasibility of volitional passage, including development and analysis of alternatives using existing data.
- Advance design of the preferred alternative from concept to a level of engineering analysis and project description sufficient to prepare environmental compliance documents and estimate construction costs.
In addition, subsequent to launching the passage investigation for Shasta, a separate but related effort was initiated to explore potential removal of McCloud Dam and Reservoir to facilitate access to significant additional historic winter-run habitat upstream.
The four run timings of Central Valley Chinook salmon and their diverse life stages and life histories co-evolved with one another and benefit from many of the same hydro-physical and hydro-ecological conditions. Changes to those underlying conditions resulting from the construction and operation of the CVP and SWP have also forced novel management actions, like coldwater pool management for winter-run spawning, incubation, and emergence below Keswick Dam. Actions narrowly tailored to the preservation of a single run timing and/or specific life stages risk not only negatively impacting the other Chinook run timings and native aquatic species broadly but also reducing the magnitude and diversity of conservation benefits resulting from the management of California’s water—pitting water management actions for species needs against one another. Several key stressors for winter-run Chinook salmon specifically are sufficiently proximate to CVP infrastructure and operations that their impact could be mitigated through re-operation of Shasta releases and coldwater pool management (as shown in Box 2-4). In the absence of the constraints resulting from coldwater pool management, both re-operation
potential and other potential flow-associated benefits for the aquatic ecosystem and native species (including other Chinook run timings) could expand. Therefore, the Committee encourages further progress in reintroduction of winter-run Chinook salmon into their ancestral spawning grounds in the McCloud River, Battle Creek, and upper Sacramento River. If possible, these efforts could also consider the establishment of spring-run Chinook salmon populations above Shasta Reservoir, coupled with passage approaches for adults and juveniles (McCloud/upper Sacramento rivers) and habitat restoration (Battle Creek) that support success for those populations, in a life-cycle context, beyond what they are experiencing under current conditions. In the meantime, the Committee recommends maintaining the three-pronged approach to preventing winter-run extinction that combines reintroduction of winter-run Chinook salmon above Shasta Dam with improving conditions downstream of Keswick Dam and continuing artificial propagation, supplementation, and hatchery management.
Climate Impact Drivers Relevant to Coldwater Pool Management
Climate impact drivers are physical climate conditions—such as average states, events, or extremes—that affect human or natural systems (IPCC, 2021). The sections that follow discuss how climate impact drivers may affect the Shasta Coldwater Pool Management Action, beginning with the most critical drivers.
Drought
Drought episodes that result in decreased inflow to Shasta Reservoir will affect the size of the coldwater pool (Hallnan et al., 2020; USBR, 2022). While seasonal (one to three months) and year-long droughts can impact the system, the main concern regarding Shasta coldwater pool management is the occurrence of multi-year droughts such as the 2007–2009 drought and the 2012–2015 megadrought in California. Chen et al. (2025) show that there has been an increase in the occurrence and severity of multi-year drought events at the global scale. This is consistent with findings that show increased drought duration in a warmer climate (Gu et al., 2020). Furthermore, the probability of hot droughts (i.e., dry conditions associated with anomalously warm temperatures) is also projected to increase in a warmer climate (Chen and Sun, 2017). These events could have significant impacts on Shasta coldwater pool management and USBR’s ability to provide favorable conditions downstream of Keswick Dam.
Critically dry years have resulted in reduced total storage in Shasta Reservoir and a significantly diminished coldwater pool. For example, in 2014 and 2015, exceptionally low coldwater pool volumes contributed to downstream temperatures that exceeded survival thresholds, resulting in estimated egg-to-fry mortality rates of greater than 75 percent (NMFS, 2019; USBR, 2022). Similarly, in 2021–2022, below-average runoff and minimal carryover storage led to severely constrained thermal management, with operational forecasts indicating minimal ability to meet target temperatures through the end of the management season (USBR, 2024a). In addition to spring storage and other factors such as seasonal air temperature, radiative heating, the volume and temperature of runoff, and reservoir releases, the size of the coldwater pool is affected by prior-year carryover. This storage effect is particularly important in back-to-back drought scenarios, when biological risk compounds due to prolonged exposure to inadequate thermal conditions (USBR, 2024a). Moreover, the three-year brood stock reserve maintained by the Livingston Stone National Fish Hatchery is vulnerable to extended droughts (NMFS, 2019), and a prolonged period of critical drought could result in a population crash (NMFS, 2024a).
Average Annual and Seasonal Temperature
Projections of average annual temperatures clearly show an increase both globally and at local scales in the Bay-Delta region (see Appendix A). Higher air temperatures throughout the year—especially during the summer—can lead to higher downstream water temperatures at compliance points, which may require increased water releases. Empirical evidence showed that spring’s seasonal temperature is negatively correlated with the size of the coldwater storage (Nickel et al., 2004). Together with the magnitude of the preceding year’s late summer hypolimnetic releases, these two factors were found to explain 64 percent of the variability in the size of the coldwater pool (Nickel et al., 2004).
Snowpack
In a warmer climate, the transition from snow to rain leads to several changes in the snowpack, including reduced overall accumulation, an earlier peak, and a shorter snow season. These changes—both individually and collectively—can impact the size and timing of development of the coldwater pool. An earlier snowmelt peak and shorter snow season present unique challenges for system operations, particularly because temperature management occurs from May to October, directly following the start of the snowmelt period.
Streamflow
The impacts of global warming on streamflow are most evident in changes to the timing of flow (Han et al., 2024). In many snow-dominated river basins, shifts in streamflow timing have been observed over the past few decades (Han et al., 2024; Wang et al., 2024). However, shifts in streamflow timing are expected to be small (on the order of days) and their effect partially mitigated by the relatively large size of Shasta Reservoir.
Annual Precipitation
When it comes to trends in annual precipitation in California, it is difficult to observe effects that might be associated with warming, due to natural variability (Dettinger, 2011). Furthermore, climate model projections for annual precipitation show significant disagreement, with little consensus on either the direction (increase vs. decrease) or the magnitude of change (see Appendix A). Annual precipitation in the western United States has decreased between 2002 and 2021 compared to the long-term average (1901–1960) (Figure A-3), and if annual precipitation began to trend consistently downward, there could be substantial impacts to Shasta’s ability to store a sufficiently large pool of cold water in drier years.
Interannual variability in precipitation is expected to increase in a warmer climate (Figure 1-3). This is particularly relevant for California, where a substantial portion of annual precipitation comes from atmospheric rivers (Dettinger, 2016).
Heatwaves
Heatwaves can significantly affect downstream conditions through the impact of riverine heatwaves (Tassone et al., 2023), often necessitating increased releases of cold water to meet environmental requirements. However, because heatwaves are transient, the Shasta system is expected to be resilient and generally tolerant of these short-term disturbances.
Wildfires
There is growing scientific consensus that wildfires alter the partitioning of water fluxes at the watershed scale (Williams et al., 2022), typically leading to increased runoff and reduced evapotranspiration. These effects can persist for several years following a wildfire, often resulting in temporarily higher inflows—which can, in turn, expand the coldwater pool. Unlike other climate-influenced disturbances, increased wildfire activity may have a beneficial effect on coldwater pool management at Shasta Reservoir by increasing coldwater inflows and reducing rates of warming by reflecting incoming solar radiation (Farruggia et al., 2024). However, more detailed projections of wildfire activity in the upper Sacramento River basin are needed to fully assess the range of potential impacts.
***
Of the climate impact drivers discussed above, those that affect stream temperatures downstream of Shasta and Keswick dams are likely to be the most important to the future of the Shasta Coldwater Pool Management Action. Indeed, understanding the mechanisms and response of river temperatures to warming atmospheric conditions is a key challenge to be addressed globally in the management of water resources in large river basins.
Bray et al. (2025) showed that many of Earth’s climate variables, including incoming shortwave radiation, net longwave radiation, atmospheric emissivity, and air temperature, along with the fundamental optical properties of
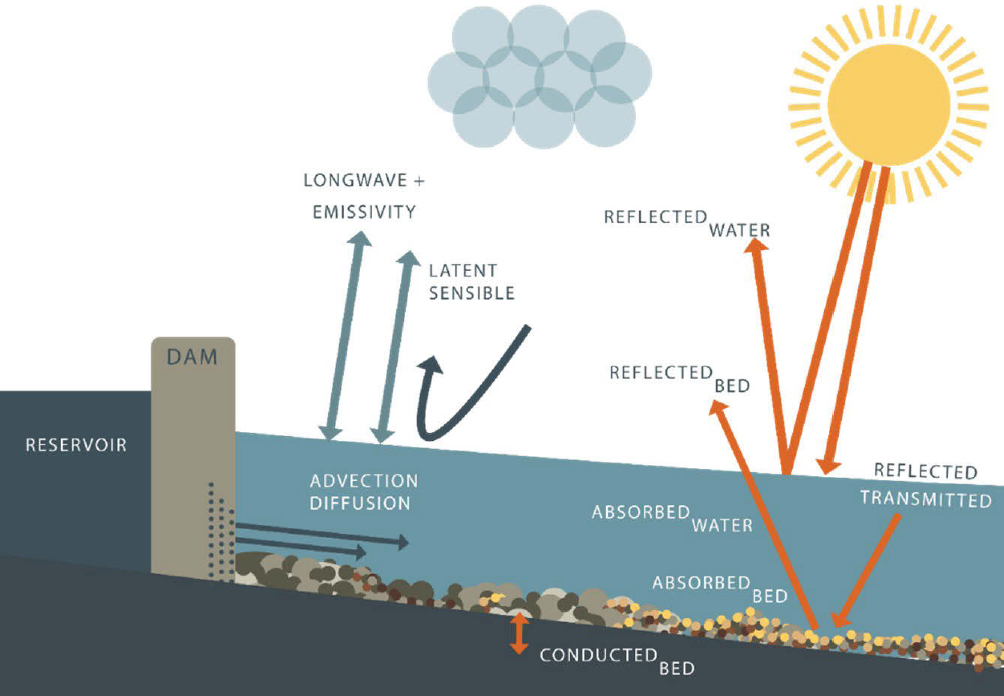
SOURCE: Bray et al. (2025).
water, control the heating of rivers. Although air temperature and river temperature are correlated, air temperature warming is not the primary mechanism that is driving warming of river temperatures, especially downstream of dams. Rather, the sensitivity of river temperatures to atmospheric factors likely to change under future climates also depends on the radiation that is absorbed by the water column and the bed, the rate at which energy is added or removed through atmosphere–water surface interactions, and the rate at which the river flow transports and accumulates energy in the water (Figure 2-13; Bray et al., 2017). Thus, climate coupled with advective and diffusive flow processes determines the along-stream temperature of the rivers downstream of dams.
Physically based modeling studies that employ future climate data to the year 2100 under the high emission scenario (RCP8.5) suggest that anticipated climate conditions may weaken the cooling benefits of managed flow releases from dams in the Central Valley, especially along rivers that experience a reduction in streamflow due to diversions. This reduction in streamflow results in shallower river depths, making the river more vulnerable to the net absorption of shortwave radiation, and higher temperatures, especially downstream of large diversions as the river becomes shallower and dominated by atmospheric heating fluxes (Rojas-Aguirre et al., 2024). Furthermore, water operators may experience increasing difficulty maintaining adequate coldwater pool volume in reservoirs through hotter summer months, and even extreme reductions in reservoir outflows may not be enough to mitigate the result of warmer release temperatures (Hallnan et al., 2020).
The implications of the above for Shasta coldwater pool management are that the action may not provide sufficiently cold stream temperatures for winter-run Chinook salmon downstream of Keswick Dam into the future. The watersheds that provide runoff and inflows to Shasta Reservoir will likely be subjected to more intense drought, decreased tributary inflows, higher rates of evapotranspiration and evaporation due to higher air temperatures, decreased snowpack, earlier peak snowpack, and a shorter snowpack season. Historical data already show that the thermally suitable river habitat has contracted from about 40 miles in 1996 to about 5 miles in 2022 (Figure 2-4).
A related consideration for coldwater pool management is that the percentage of years falling into each of the six available bins is likely to shift as climate factors change. Each bin corresponds to a range of storage values and is associated with a historical frequency of occurrence—for example, Bin 1 has occurred in about 80 percent of years historically (Table 2-1). However, climate change is expected to lead to sustained reductions in flows into Shasta Reservoir. As a result, the frequency of Bin 1 conditions will likely fall below the historical 80 percent, while the frequency of years falling into Bin 2 and Bin 3 will increase. In addition, climate change is amplifying variability between wet and dry years, which reduces the number of years with “normal” conditions. These shifts are not currently reflected in the existing bins framework, which is based on fixed, absolute storage thresholds.
To fully address climate-related impacts to Shasta Reservoir, management approaches should consider projects that provide fish passage to upstream habitats in the McCloud, Pit, and upper Sacramento rivers in addition to continued improvements in forecasts of the coldwater pool volume and flow releases downstream of Keswick Dam during the summer management season.
CONCLUSIONS AND RECOMMENDATIONS
A three-pronged approach to Shasta management that focuses on improving conditions downstream of Keswick Dam, continuing artificial propagation and supplementation via hatchery management, and reintroducing winter-run Chinook salmon in natal coldwater habitats will be essential to the protection and eventual recovery of winter-run. Some of the recommendations that follow are based on continued coldwater pool management, including monitoring improvements that can lead to better estimates of the volume of coldwater annually and a better understanding of the potential role of seiching and vertical mixing in Shasta Reservoir. Continuing efforts to improve temperature management downstream of Keswick Dam are essential because that is currently where the only significant population of spawning winter-run Chinook salmon can be found. Reintroducing winter-run Chinook salmon to other habitat areas (above Shasta Reservoir and to Battle Creek) will take time, with uncertain prospects of success, such that supporting the salmon population below Keswick Dam will be an important bridge to the future. Ultimately, an ecosystem approach to coldwater pool management, focused on optimization for a range of species, will create greater operational flexibility as well as diverse ecological benefits supportive of multiple species and life-history stages.
Recommendation 2-1: USBR should enhance the monitoring of temperature and mixing in rivers relevant to the coldwater pool management action.
Temperature sensors for rivers are inexpensive to install and maintain and could provide important information to enhance the predictive accuracy of the WTMP. USBR should use the WTMP to determine for which tributaries—particularly in the reach downstream of Keswick Dam—and locations additional temperature data will reduce uncertainty in simulations and increase accuracy of modeled boundary conditions. Evidence shows that the Sacramento River quickly mixes across the channel width eliminating any significant lateral variations; the main exception is the temperature gage at Shasta Dam, which should be relocated (or a secondary gage installed) downstream to a point of full lateral mixing.
Recommendation 2-2: USBR should install four to six Lake Diagnostic Systems (micro-meteorology stations mounted over a fiber-optic distributed temperature sensing system) throughout Shasta Reservoir for two years to better understand how high-frequency physical dynamics within the reservoir (such as seiching and internal mixing) affect the thermocline depth and to generate more accurate estimates of the coldwater pool volume.
Over this two-year period, the adequacy of a single Lake Diagnostic System linked with CE-QUAL-W2 could be evaluated for its ability to simulate and predict the formation of stratification, the internal mixing processes affecting the coldwater pool, and the influence of different TCD operational rules. This enhanced monitoring will support the WTMP and help to explain and predict why the coldwater pool can vary significantly for water years with approximately the same total annual runoff.
Recommendation 2-3: High levels of “unattributed mortality” of winter-run Chinook salmon eggs must be better understood through research that defines specific pathways for reducing said mortality, in order to develop management actions that can increase confidence in using egg-to-fry survival as the principal focus point for management.
The focus on temperature-dependent mortality, interactive effects of multiple stressors, and the fine-tuning of releases from the Shasta coldwater pool may increase survival, but even in years when temperature-dependent mortality is minimal, high mortality can still occur. Additional management actions supportive of winter-run survival can only be identified based on understanding the influence of factors such as temperature, flow, habitat, substrate, pathogens, predation, and food quality and availability across all life stages. Ongoing studies investigating the temperature, dissolved oxygen, and flow through redds could evaluate the potential benefits of larger-scale actions such as channel and floodplain restoration, gravel augmentation, and pulse flows in sustaining pool-riffle sequences and other geomorphic features conducive to spawning.
Recommendation 2-4: As tribes, CDWR, and others continue feasibility studies, USBR should develop an actionable plan to facilitate and support the reintroduction of winter-run Chinook salmon to historic spawning and rearing habitat above Shasta Reservoir and in Battle Creek.
The challenges and operational constraints posed on coldwater pool management by warming air temperatures, reduced snowpack, and increased drought frequency and duration place winter-run Chinook salmon at increasing risk. The only way to mitigate that risk, especially the risk of a catastrophic population crash associated with a more than three-year drought, is to safeguard some portion of the population in existing coldwater habitats.
Recommendation 2-5: Life-cycle models should be applied to develop a long-term strategy for winter-run Chinook salmon conservation and recovery, in the context of CVP and SWP operations.
Although temperature-dependent mortality has received the most focus as a factor in winter-run Chinook salmon mortality, the relative importance of other factors throughout the system remains unclear, especially in the context of interannual variability in climate and resulting variation in streamflow and water temperature. Chinook salmon life-cycle models (e.g., CVPIA SIT, WRLCM, R2R DSM) could be used to systematically investigate how combinations of stressors interact to influence both egg-to-fry survival and juvenile growth and survival in a spatially explicit context. Model comparisons could be done to quantify systemwide tradeoffs in management decisions, including impacts to other Chinook run timings and native aquatic species, and to identify which combinations offer the best gains in survival for a given water-year type.
Conclusion 2-1: Hatchery supplementation offers critical near-term support for both winter- and spring-run Chinook salmon populations but may become increasingly nonviable over the long term.
Conservation-focused hatchery production and supplementation has and continues to be a critical tool for the conservation of both winter-run and spring-run Chinook salmon populations, especially in drought years. However, mounting evidence suggests that the benefits of hatchery actions are coupled with associated impacts to the species genetics, life-history diversity, and reproductive fitness. In addition, increasing constraints on instream habitat conditions, reduced availability of clean cold water for hatchery production, and the increasing intensity of dry years are, collectively, likely to accelerate the decline of naturally reproducing populations, increase the frequency of hatchery interventions, and magnify harmful impacts from hatcheries.
Recommendation 2-6: Shasta Reservoir operations, and the models and inputs used to inform them, should more fully consider the effects of climate impact drivers on coldwater pool management.
In future years with anomalously warm temperatures, diminished snowpack, and more intense droughts, total winter-run survival is likely to drop meaningfully if current operations continue, particularly as these climate
conditions worsen over time. Importantly, biophysical model predictions based on historical relationships with climate variables may become unreliable, because those relationships may no longer reflect underlying physical mechanisms. In addition, the historical pattern of wet, dry, and normal years is expected to shift, making it necessary to adopt a more refined framework for coldwater pool management. Additional modeling could create an expanded set of operational rules targeted at extreme years (or even just those that are hotter and drier than considered by current management).
REFERENCES
Alavian, V., G. H. Jirka, R. A. Denton, M. C. Johnson, and H. C. Stefan. 1992. “Density Currents Entering Lakes and Reservoirs.” Journal of Hydraulic Engineering 118(1). https://doi.org/10.1061/(ASCE)0733-9429(1992)118:11(1464).
Alderdice, D. F., and F. P. J. Velsen. 1978. “Relation Between Temperature and Incubation Time for Eggs of Chinook Salmon (Oncorhynchus tshawytscha).” Journal of the Fisheries Research Board of Canada 35(1):69–75. https://doi.org/10.1139/f78-010.
Anderson, J. 2018. “Using River Temperature to Optimize Fish Incubation Metabolism and Survival: A Case for Mechanistic Models.” BioRxiv. https://doi.org/10.1101/257154.
Anderson, J. J., W. N. Beer, J. A. Israel, and S. Greene. 2022. “Targeting River Operations to the Critical Thermal Window of Fish Incubation: Model and Case Study on Sacramento River Winter-Run Chinook Salmon.” River Research and Applications 38(5):895–905. https://doi.org/10.1002/rra.3965.
Antonio, D.B., and R.P. Hedrick. 1995. “Effect of Water Temperature on Infections with the Microsporidian Enterocytozoon salmonis in Chinook Salmon.” Diseases of Aquatic Organisms 22(3):233–236. https://doi.org/10.3354/dao022233.
Anzalone, S. E., N. W. Fuller, K. E. H. Hartz, C. A. Fulton, G. W. Whitledge, J. T. Magnuson, D. Schlenk, S. Acuña, and M. J. Lydy. 2022. “Pesticide Residues in Juvenile Chinook Salmon and Prey Items of the Sacramento River Watershed, California–A Comparison of Riverine and Floodplain Habitats.” Environmental Pollution 303:119102. https://doi.org/10.1016/j.envpol.2022.119102.
Araki, H., B. Cooper, and M. Blouin. 2007. “Genetic Effects of Captive Breeding Cause a Rapid, Cumulative Fitness Decline in the Wild.” Science 318(5847):100–103. https://www.science.org/doi/10.1126/science.1145621.
Bartholow, J. M. 2004. “Modeling Chinook Salmon with SALMOD on the Sacramento River, California.” Hydroécologie Appliquée 14(1):193–219. https://doi.org/10.1051/hydro:2004012.
Berejikian, B. A., E. P. Tezak, and A. L. LaRae. 2005. “Female Mate Choice and Spawning Behavior of Chinook Salmon Under Experimental Conditions.” Journal of Fish Biology 57(3):647–661. https://doi.org/10.1111/j.1095-8649.2000.tb00266.x.
Berry, B., J. McInerney, A. Stang, A. Sharp, A. Forrest, and G. Schladow. 2021. Lake Shasta Bathymetric Sonar and ADCP Survey. Department of Civil and Environmental Engineering and Tahoe Environmental Research Center, University of California, Davis. June 22.
Bert, T. M., C. R. Crawford, M. D. Tringali, et al. 2007. “Genetic Management of Hatchery-Based Stock Enhancement.” In Ecological and Genetic Implications of Aquaculture Activities, edited by T. M. Bert. Reviews: Methods and Technologies in Fish Biology and Fisheries, vol 6. Dordrecht: Springer. https://doi.org/10.1007/978-1-4020-6148-6_8.
Boehrer, B., and M. Schultze. 2008. “Stratification of Lakes.” Reviews of Geophysics 46(2). https://doi.org/10.1029/2006RG000210.
Bray, E. N., J. Dozier, and T. Dunne. 2017. “Mechanics of the Energy Balance in Large Lowland Rivers, and Why the Bed Matters.” Geophysical Research Letters 44(17):8910–8918. https://doi.org/10.1002/2017GL075317.
Bray, E. N., N. Modar, and J. Dozier. 2025. “Atmospheric Controls on River Temperature: Sensitivity of River Temperature Downstream of a Dam to Changes in a Mediterranean Climate.” Journal of Hydrology: Regional Studies 16:32–53. https://doi.org/10.1016/j.ejrh.2025.102500.
Buttermore, E. 2024. “Shasta Cold Water Pool Management: Description of the Action, Objectives, Metrics, Monthly Operations.” Presented at the 3rd Meeting of the Committee on the Long-Term Operations of the Central Valley Project and the State Water Project, Redding, CA, May 2024.
Cavallo, B. 2024. “Monitoring Presentation to NAS Panel.” Presented at the 3rd Meeting of the NASEM Committee on the Long-Term Operations of the Central Valley Project and the State Water Project, Redding, CA, May 2024.
CDFG (California Department of Fish and Game). 2004. Sacramento River Winter-run Chinook Salmon. Prepared for the Fish and Game Commission. https://nrm.dfg.ca.gov/FileHandler.ashx?DocumentID=3503.
CDWR (California Department of Water Resources). 2022. “Juvenile Collection System.” Accessed October 3, 2025. https://water.ca.gov/Programs/Integrated-Regional-Water-Management/Fish-Passage-Improvement-Program/Juvenile-Salmon-Collection-System.
CDWR and USBR (U.S. Bureau of Reclamation). 2024. Biological Assessment for the Long-Term Operation of the Central Valley Project and State Water Project.
Chen, D.D, C.S. Ruf, and S.T. Gleason. 2016. “Response Time of Mean Square Slope to Wind Forcing: An Empirical Investigation.” Journal of Geophysical Research: Oceans 121(4):2809–2823. https://doi.org/10.1002/2016JC011661.
Chen, H., and J. Sun. 2017. “Anthropogenic Warming Has Caused Hot Droughts More Frequently in China.” Journal of Hydrology 544:306–318. https://doi.org/10.1016/j.jhydrol.2016.11.044.
Chen, L., P. Brun, P. Buri, et al. 2025. “Global Increase in the Occurrence and Impact of Multiyear Droughts.” Science 387(6731):278–284. https://doi.org/10.1126/science.ado4245.
Cole, T., and E. Buchak. 1995. CE-QUAL-W2: A Two-Dimensional, Laterally Averaged, Hydrodynamic and Water Quality Model, Version 2.0. Tech. Rpt. EL-95-May 1995, US Army Corps of Engineers. Waterways Experiments Station, Vicksburg, MS.
Crozier, L. G., B. J. Burke, B. E. Chasco, D. L. Widener, and R. W. Zabel. 2021. “Climate Change Threatens Chinook Salmon Throughout Their Life Cycle.” Communications Biology 4(1):222. https://doi.org/10.1038/s42003-021-01734-w/.
CRS (Congressional Research Service). 2025. Central Valley Project: Issues and Legislation. Updated March 28, 2025. https://www.congress.gov/crs_external_products/R/PDF/R45342/R45342.51.pdf.
Dahlke, F. T., S. Wohlrab, M. Butzin, and H. O. Pörtner. 2020. “Thermal Bottlenecks in the Life Cycle Define Climate Vulnerability of Fish.” Science 369(6499):65–70. https://doi.org/10.1126/science.aaz3658.
Daniels, M. E. 2024. “NOAA Data Set for Shasta Reservoir.” Accessed October 3, 2025. https://github.com/MilesEDaniels/shasta-dts-2015-and-2016.
Daniels, M. E., and E. M. Danner. 2020. “The Drivers of River Temperatures Below a Large Dam.” Water Resources Research 56(5): e2019WR026751. https://doi.org/10.1029/2019WR026751.
Daniels, M. E., V. K. Sridharan, S. N. John, and E. M. Danner. 2018. Calibration and Validation of Linked Water Temperature Models for the Shasta Reservoir and the Sacramento River from 2000 to 2015. NOAA Technical Memorandum NMFSSWFSC-597. U.S. Department of Commerce. https://doi.org/10.7289/V5/TM-SWFSC-597.
Danner, E. 2024. “An Integrated Modeling Framework for Assessing the Impacts of the CVP Operations on ESA Listed Salmon.” Presented at the 3rd Meeting of the Committee on the Long-Term Operations of the Central Valley Project and the State Water Project, Redding, CA, May 2024.
Del Rio, A. M., B. E. Davis, N. A. Fangue, and A. E. Todgham. 2019. “Combined Effects of Warming and Hypoxia on Early Life Stage Chinook Salmon Physiology and Development.” Conservation Physiology 7(1):1–14. https://doi.org/10.1093/conphys/coy078.
Del Rio, A. M., G. N Mukai, B. T. Martin, R. C. Johnson, N. A. Fangue, J. A. Israel, and A. E. Todgham. 2021. “Differential Sensitivity to Warming and Hypoxia During Development and Long-Term Effects of Developmental Exposure in Early Life Stage Chinook Salmon.” Conservation Physiology 9(1):coab054. https://doi.org/10.1093/conphys/coab054.
Delta Science Program. 2023. Central Valley Project Water Temperature Model Platform Review, Final Report. https://www.deltacouncil.ca.gov/pdf/science-program/reports/2023-10-20-wtmp-2023-final-report.pdf.
Dettinger, M. 2011. “Climate Change, Atmospheric Rivers, and Floods in California–A Multimodel Analysis of Storm Frequency and Magnitude Changes.” Journal of the American Water Resources Association 47(3):514–523. https://doi.org/10.1111/j.1752-1688.2011.00546.x.
Dettinger, M. 2016. “Historical and Future Relations Between Large Storms and Droughts in California.” San Francisco Estuary and Watershed Science 14(2). https://doi.org/10.15447/sfews.2016v14iss2art1.
EPA Region 10. 2003. EPA Region 10 Guidance for Pacific Northwest State and Tribal Temperature Water Quality Standards. EPA 910-B-03-002. Region 10 Office of Water. https://nepis.epa.gov/Exe/ZyPDF.cgi/P1004IUI.PDF?Dockey=P1004IUI.PDF.
Farruggia, M. J., J. Brahney, A. J. Tanentzap, et al. 2024. “Wildfire Smoke Impacts Lake Ecosystems.” Global Change Biology 30:e17367. https://doi.org/10.1111/gcb.17367.
Fischer, H. B., E. J. List, R. C. Y. Koh, J. Imberger, and N. H. Brooks. 1979. Mixing in Inland and Coastal Waters. San Diego, CA: Academic Press.
Ford, D. E., and L. D. Johnson. 1983. “Productivity and Water Quality Relationships in Reservoirs.” Reservoir Fisheries and Limnology 29–41.
Fuller, N., S.E. Anzalone, K. E. H. Hartz, G. W. Whitledge, S. Acuña, J. T. Magnuson, D. Schlenk, and M. J. Lydy. 2022. “Bioavailability of Legacy and Current-Use Pesticides in Juvenile Chinook Salmon Habitat of the Sacramento River Watershed: Importance of Sediment Characteristics and Extraction Techniques.” Chemosphere 298:134174. https://doi.org/10.1016/j.chemosphere.2022.134174.
Gu, L., J. Chen, J. Yin, et al. 2020. “Projected Increases in Magnitude and Socioeconomic Exposure of Global Droughts in 1.5 and 2 C Warmer Climates.” Hydrology and Earth System Sciences 24(1):451–472. https://doi.org/10.5194/hess-24-451-2020.
Hallnan, R., L. Saito, D. Busby, and S. Tyler. 2020. “Modeling Shasta Reservoir Water-Temperature Response to the 2015 Drought and Response under Future Climate Change.” Journal of Water Resources Planning and Management 146(5):04020018. https://doi.org/10.1061/(ASCE)WR.1943-5452.0001186.
Han, J., Z. Liu, R. Woods, et al. 2024. “Streamflow Seasonality in a Snow-Dwindling World.” Nature 629(8014):1075–1081. https://doi.org/10.1038/s41586-024-07299-y.
Hanna, D. B., L. Saito, J. M. Bartholow, and J. Sandelin. 1999. “Results of Simulated Temperature Control Device Operations on In-Reservoir and Discharge Water Temperatures Using CE-QUAL-W2.” Lake and Reservoir Management 15(2):87–102. https://doi.org/10.1080/07438149909353954.
Hassrick, J. L., C. J. Michel, and A. J. Ammann. 2022. “Influence of Flow Conditions on Migration Timing and Survival of Hatchery-Origin Winter-Run Chinook Salmon.” San Francisco Estuary and Watershed Science 20(1).
Hendrix, N., A. Criss, E. Danner, et al. 2014. Life Cycle Modeling Framework for Sacramento River Winter-Run Chinook Salmon. NOAA Technical Memorandum NOAA-TM-NMFS-SWFSC-530. https://repository.library.noaa.gov/view/noaa/4738/.
Hendrix, N., A. M. K. Osterback, S. John, et al. 2024. Life Cycle Modeling Framework for Chinook Salmon Spawning in the Sacramento River. NOAA-TM-NMFS-SWFSC-696. U.S. Department of Commerce. https://repository.library.noaa.gov/view/noaa/60717.
Henery, R. E., T. R. Sommer, and C. R. Goldman. 2010. “Growth and Methylmercury Accumulation in Juvenile Chinook Salmon in the Sacramento River and Its Floodplain, the Yolo Bypass.” Transactions of the American Fisheries Society 139:550–563. https://doi.org/10.1577/T08-112.1.
Herbold, B., S. M. Carlson, R. Henery, et al. 2018. “Managing for Salmon Resilience in California’s Variable and Changing Climate.” San Francisco Estuary and Watershed Science 16(2). https://doi.org/10.15447/sfews.2018v16iss2art3.
Hilborn, R. 1992. “Hatcheries and the Future of Salmon in the Northwest.” Fisheries 17(1):5–8. https://doi.org/10.1577/1548-8446(1992)017<0005:HATFOS>2.0.CO;2.
Hilliard, B., W. J. Reeder, R. Budwig, V. Durgesh, B. Bhattarai, B. T. Martin, T. Xing, and D. Tonina. 2025. “Unveiling Surface–Subsurface Flow Interactions of a Salmon Redd.” Advances in Water Resources 199:104947. https://doi.org/10.1016/j.advwatres.2025.104947.
Holt, R.A., A. Amandi, J.S. Rohovec, and J.L. Fryer. 1989. “Relation of Water Temperature to Bacterial Cold-Water Disease in Coho Salmon, Chinook Salmon, and Rainbow Trout.” Journal of Aquatic Animal Health 1(2):94–101. https://doi.org/10.1577/1548-8667(1989)001%3C0094:ROWTTB%3E2.3.CO;2.
Imberger, J. 2004. “A Lake Diagnostic System for Managing Lakes and Reservoirs.” Water Resources IMPACT 6(1):7–11. https://www.jstor.org/stable/wateresoimpa.6.1.0007.
IPCC (Intergovernmental Panel on Climate Change). 2021. Climate Change 2021: The Physical Science Basis. Contribution of Working Group I to the Sixth Assessment Report of the Intergovernmental Panel on Climate Change, edited by V. Masson-Delmotte, P. Zhai, A. Pirani, et al. Cambridge, UK and New York, NY: Cambridge University Press. https://doi.org/10.1017/9781009157896.
Jeffres, C. A., J. J. Opperman, and P. B. Moyle. 2008. “Ephemeral Floodplain Habitats Provide Best Growth Conditions for Juvenile Chinook Salmon in a California River.” Environmental Biology of Fishes 22 83:449–458. https://doi.org/10.1007/s10641-008-9367-1.
Jennings, S. K., and N. Hendrix. 2020. “Winter-run Chinook Salmon Spawn Timing Shifts in Response to Flow and Temperature Variability in the Sacramento River.” River Research and Applications 36(9):1328–1340.
Johnson, M. 2023a. The McCloud River Pilot Project, 2022 (Winnemem Wintu Tribe, NMFS, and DFW). Presentation to the Sacramento River Science Partnership Workshop, Folsom, CA.
Johnson, R. 2023b. Reconnecting Winter run Chinook salmon to ancestral waters: Monitoring reintroduction to the McCloud River. Presentation to the Sacramento River Science Partnership Workshop, Folsom, CA.
Johnston, M. E., A. E. Steel, M. Espe, T. Sommer, A. P. Klimley, P. Sandstrom, and D. Smith. 2018. “Survival of Juvenile Chinook Salmon in the Yolo Bypass and the Lower Sacramento River, California.” San Francisco Estuary and Watershed Science 16(2). https://doi.org/10.15447/sfews.2018v16iss2art4.
Katz, J., P. B. Moyle, R. M. Quiñones, J. Israel, and S. Purdy. 2012. “Impending Extinction of Salmon, Steelhead, and Trout (Salmonidae) in California.” Environmental Biology of Fishes 96(10-11):1169–1186. https://doi.org/10.1007/s10641-012-9974-8.
Lieberman, D. M., and M. J. Horn. 1998. Pre- and Post-Operational Effects of a Temperature Control Device on Physical, Chemical and Biological Attributes of Shasta Lake, California: Phase 1, Spring 1995 through Fall 1997. Open-File Report 98-251. U.S. Geological Survey. https://pubs.usgs.gov/publication/ofr98251.
Limm, M. P., and M. P. Marchetti. 2009. “Juvenile Chinook Salmon (Oncorhynchus tshawytscha) Growth in Off-Channel and Main-Channel Habitats on the Sacramento River, CA Using Otolith Increment Widths.” Environmental Biology of Fishes 85(2):141–151. https://doi.org/10.1007/s10641-009-9473-8.
Lindley, S. T., C. B. Grimes, M. S. Mohr, et al. 2009. What Caused the Sacramento River Fall Chinook Stock Collapse? Pre-publication report to the Pacific Fishery Management Council. https://www.noaa.gov/sites/default/files/legacy/document/2020/Oct/07354626592.pdf.
Lo, B. P., V. L. Marlatt, X. Liao, S. Reger, C. Gallilee, A. R.S. Ross, and T. M. Brown. 2023. “Acute Toxicity of 6PPD-Quinone to Early Life Stage Juvenile Chinook (Oncorhynchus tshawytscha) and Coho (Oncorhynchus kisutch) Salmon.” Environmental Toxicology and Chemistry 42(4):815–822. https://doi.org/10.1002/etc.5568.
Mantua, N., R. Johnson, J. Field, et al. 2021. Mechanisms, Impacts, and Mitigation for Thiamine Deficiency and Early Life Stage Mortality in California’s Central Valley Chinook Salmon. North Pacific Anadromous Fish Commission Technical Report No. 17, pp. 92–93. https://doi.org/10.23849/npafctr17/92.93.
Martin, B. T., A. Pike, S. N. John, et al. 2017. “Phenomenological vs. Biophysical Models of Thermal Stress in Aquatic Eggs.” Ecology Letters 20(1):50–59. https://doi.org/10.1111/ele.12705.
Martin, B. T., P. N. Dudley, N. S. Kashef, et al. 2020. “The Biophysical Basis of Thermal Tolerance in Fish Eggs.” Proceedings of the Royal Society B 287(1937):20201550. https://doi.org/10.1098/rspb.2020.1550.
Mauduit, F., A. Segarra, M. Mandic, A. E. Todgham, M. R. Baerwald, A. D. Schreier, N. A. Fangue, and R. E. Connon. 2022. “Understanding Risks and Consequences of Pathogen Infections on the Physiological Performance of Outmigrating Chinook Salmon.” Conservation Physiology 10(1). https://doi.org/10.1093/conphys/coab102.
McCullough, D. A. 1999. A Review and Synthesis of Effects of Alterations to the Water Temperature Regime on Freshwater Life Stages of Salmonids, with Special Reference to Chinook Salmon. EPA 910-R-99-010. Prepared for the U.S. Environmental Protection Agency Region 10. https://critfc.org/wp-content/uploads/2021/08/EPAreport_2.pdf.
McCullough, D. A., S. Spalding, D. Sturdevant, and M. Hicks. 2001. Issue Paper 5. Summary of Technical Literature Examining the Physiological Effects of Temperature on Salmonids. EPA-910-D-01-005. Prepared as part of U.S. EPA Region 10 Temperature Water Quality Criteria Guidance Development Project. https://www.epa.gov/sites/default/files/2018-01/documents/r10-water-quality-temperature-issue-paper5-2001.pdf.
McMillan, J. R., B. Morrison, N. Chambers, et al. 2023. “A Global Synthesis of Peer-Reviewed Research on the Effects of Hatchery Salmonids on Wild Salmonids.” Fisheries Management and Ecology 30:446–463. https://doi.org/10.1111/fme.12643.
Merz, J. E., M. Workman, D. Threloff, and B. Cavallo. 2013. “Salmon Lifecycle Considerations to Guide Stream Management: Examples from California’s Central Valley.” San Francisco Estuary and Watershed Science 11(2). https://doi.org/10.15447/sfews.2013v11iss2art2.
Michel, C.J., J.J. Notch, F. Cordoleani, A.J. Ammann, and E.M. Danner. 2021. “Nonlinear Survival of Imperiled Fish Informs Managed Flows in a Highly Modified River.” Ecosphere 12(5):e03498. https://doi.org/10.1002/ecs2.3498.
Naish, K. A., J. E. Taylor, P. S. Levin, et al. 2007. “An Evaluation of the Effects of Conservation and Fishery Enhancement Hatcheries on Wild Populations of Salmon.” Advances in Marine Biology 53:61–194. https://doi.org/10.1016/S0065-2881(07)53002-6.
Nickel, D. K., M. T. Brett, and A. D. Jassby. 2004. “Factors Regulating Shasta Lake (California) Cold Water Accumulation, a Resource for Endangered Salmon Conservation.” Water Resources Research 40(5). https://doi.org/10.1029/2003WR002669.
NMFS (National Marine Fisheries Service). 2014. Recovery Plan for the Evolutionarily Significant Units of Sacramento River Winter-run Chinook Salmon and Central Valley Spring-run Chinook Salmon and the Distinct Population Segment of California Central Valley Steelhead. California Central Valley Area Office. https://s3.amazonaws.com/media.fisheries.noaa.gov/dam-migration/central_valley_salmonids_recovery_plan-accessible.pdf.
NMFS. 2016. 5-Year Review: Summary & Evaluation of California Coastal Chinook Salmon and Northern California Steelhead. National Marine Fisheries Service, West Coast Region. https://repository.library.noaa.gov/view/noaa/17016.
NMFS. 2019. Biological Opinion on the Long-Term Operations of the Central Valley Project and State Water Project. National Marine Fisheries Service, West Coast Region. https://repository.library.noaa.gov/view/noaa/22046.
NMFS. 2024a. 2024 5-Year Review: Summary & Evaluation of Sacramento River Winter-Run Chinook Salmon. https://doi.org/10.25923/4t2m-kt52.
NMFS. 2024b. Endangered Species Act Section 7(a)(2) Programmatic Biological Opinion for the Reinitiation of Consultation on the Long-Term Operation of the Central Valley Project and State Water Project. https://cawaterlibrary.net/wp-content/uploads/2024/12/lto-biological-opinion-appendices-2024.pdf.
Notch, J., C. Michel, F. Cordoleani, W. Poytress, and E. Buttermore. 2024. Restoring Functional Flows in the Sacramento River – Chinook Salmon Survival in Relation to Spring Pulse Flows. https://ncgasa.org/wp-content/uploads/2025/03/BDSC_2024_Notch.pdf.
Notch, J.J., A.S. McHuron, C.J. Michel, et al. 2020. “Outmigration Survival of Wild Chinook Salmon Smolts Through the Sacramento River During Historic Drought and High Water Conditions.” Environmental Biology of Fishes 103:561–576. https://doi.org/10.1007/s10641-020-00952-1.
Palmer, M., and A. Ruhi. 2019. “Linkages Between Flow Regime, Biota and Ecosystem Processes: Implications for River Restoration.” Science 365(6459). https://doi.org/10.1126/science.aaw2087.
Patton, T. 2024. Shasta Cold Water Pool Management: Description of the Action, Objectives, Metrics, Monthly Operations. Presentation at the 3rd Meeting of the Committee on the Long-Term Operations of the Central Valley Project and the State Water Project. Redding, CA, May 7, 2024.
Perry, R. W., A. C. Pope, J. G. Romine, P. L. Brandes, J. R. Burau, A. R. Blake, A. J. Ammann, and C. J. Michel. 2018. “Flow-Mediated Effects on Travel Time, Routing, and Survival of Juvenile Chinook Salmon in a Spatially Complex, Tidally Forced River Delta.” Canadian Journal of Fisheries and Aquatic Sciences 75(11):1886–1901. https://doi.org/10.1139/cjfas-2017-0310.
Peterson, J. T., and A. Duarte. 2020. “Decision Analysis for Greater Insights into the Development and Evaluation of Chinook Salmon Restoration Strategies in California’s Central Valley.” Restoration Ecology 28(6):1596–1609. https://doi.org/10.1111/rec.13244.
Pike, A., E. Danner, D. Boughton, et al. 2013. “Forecasting River Temperatures in Real Time Using a Stochastic Dynamics Approach.” Water Resources Research 49(9):5168–5182. https://doi.org/10.1002/wrcr.20389.
Plumb, J., R. Perry, C. Fleming, B. Mathias, A. Vaisvil, and J. Israel. 2024. Draft Implementation Plan: Partitioning Egg and Fry Survival of Winter-Run Chinook Salmon in the Upper Sacramento River. Presentation at the 3rd Meeting of the NASEM Committee on the Long-Term Operations of the Central Valley Project and the State Water Project. Redding, CA, May 7, 2024.
Poff, N. L., J. D. Allan, M.B. Bain, et al. 1997. “The Natural Flow Regime.” Bioscience 47(11):769–784. https://doi.org/10.2307/1313099.
Resource Management Associates. 2003. Upper Sacramento River Water Quality Modeling with HEC-5Q: Model Calibration and Validation. DWR-1084. Prepared for the U.S. Bureau of Reclamation. https://www.waterboards.ca.gov/water-rights/water_issues/programs/bay_delta/california_waterfix/exhibits/docs/petitioners_exhibit/dwr/part2/DWR-1084%20RMA%202003%20SRWQM.pdf.
Rojas-Aguirre, A. F., E. N. Bray, and J. Dozier, J. 2024. “Evaluating the Effects of Climate Change on Managed Lowland Rivers in the California Bay Delta Watershed.” Journal of Hydrology 647:132293. https://doi.org/10.1016/j.jhydrol.2024.132293.
Rose, K., H. Jager, N. Monsen, A. Bai, and E. Howe. 2024. Peer Review of the Fish and Aquatic Effects Analysis for the Long-Term Operations of the Central Valley Project and State Water Project. Prepared for the Delta Science Program. https://deltacouncil.ca.gov/pdf/science-program/reports/2024-04-23-long-term-operations-fish-and-aquatic-effects-analysis-final-report.pdf.
Rose, K. A., J. Icarus Allen, Y. Artioli, et al. 2010. “End-To-End Models for the Analysis of Marine Ecosystems: Challenges, Issues, and Next Steps.” Marine and Coastal Fisheries 2(1):115–130. https://doi.org/10.1577/C09-059.1.
Rossi, G. J., J. R. Bellmore, J. B. Armstrong, C. Jeffres, S. M. Naman, S. M. Carlson, T. E. Grantham, M. J. Kaylor, S. White, J. Katz, and M. E. Power. 2024. “Foodscapes for Salmon and Other Mobile Consumers in River Networks.” BioScience 74(9):586–600. https://doi.org/10.1093/biosci/biae064.
San Francisco Estuary Partnership. 2019. State of the Estuary, 2019: Status and Trends of Indicators of Ecosystem Health. San Francisco, CA. https://www.sfestuary.org/wp-content/uploads/2019/10/State-of-the-Estuary-Report-2019.pdf.
Sisk, C. 2024. Presentation at the 3rd Meeting of the Committee on the Long-Term Operations of the Central Valley Project and the State Water Project. Redding, CA, May 7, 2024.
Sommer, T. R., W. C. Harrell, and M. L. Nobriga. 2001. “Floodplain Rearing of Juvenile Chinook Salmon: Evidence of Enhanced Growth and Survival.” Canadian Journal of Fisheries and Aquatic Sciences 58(2):325–333. https://doi.org/10.1139/f00-245.
SST (Salmon Scoping Team). 2017. Effects of Water Project Operations on Juvenile Salmonid Migration and Survival in the South Delta; Volume 1: Findings and Recommendations. Report to the Collaborative Adaptive Management Team. https://media.fisheries.noaa.gov/dam-migration/volume_1_january_2017_final.pdf.
Sumer, D. 2024. “Modeling for LTO Operation and Actions.” Presentation at the 2nd Meeting of the NASEM Committee on the Long-Term Operations of the Central Valley Project and the State Water Project. Davis, CA, February 28, 2024.
Takata, L., T. R. Sommer, J. L. Conrad, and B. M. Schreier. 2017. “Rearing and Migration of Juvenile Chinook Salmon (Oncorhynchus tshawytscha) in a Large River Floodplain.” Environmental Biology of Fishes 100:1105–1120. https://doi.org/10.1007/s10641-017-0631-0.
Tassone, S. J., A. F. Besterman, C. D. Buelo, et al. 2023. “Increasing Heatwave Frequency in Streams and Rivers of the United States.” Limnology and Oceanography Letters 8(2):295–304. https://doi.org/10.1002/lol2.10284.
Tonina, D., and J. M. Buffington. 2007. “Hyporheic exchange in gravel bed rivers with pool-riffle morphology: Laboratory experiments and three-dimensional modeling.” Water Resour. Res. 43:W01421. https://doi.org/:10.1029/2005WR004328.
Tonina, D., and J. M. Buffington. 2011. “Effects of stream discharge, alluvial depth and bar amplitude on hyporheic flow in pool-riffle channels.” Water Resour. Res. 47:W08508. https://doi.org/10.1029/2010WR009140.
USBR (U.S. Bureau of Reclamation). 2014. Habitat Assessment Final Report, Shasta Dam Fish Passage Evaluation. https://www.usbr.gov/mp/bdo/docs/final_sdfpe_habitat_assessment.pdf.
USBR. 2017. Water Temperature Management in Reservoir-River Systems through Selective Withdrawal. Reference Technical Memorandum for Central Valley Project Operation, California. https://www.usbr.gov/mp/bdo/docs/cvp-wtm-selective-withdrawal-2017-09.pdf.
USBR. 2022. 2021 Seasonal Report for the Shasta Cold Water Pool Management. Central Valley Operations Office and Bay-Delta Office in coordination with CDFW, CDWR, USFWS, and NMFS. https://www.usbr.gov/mp/bdo/docs/lto/2021/lto-ar-2021-app-b-2021-shasta-cold-water-pool-seasonal-report.pdf.
USBR. 2023a. 2022 Seasonal Report for the Shasta Coldwater Pool Management. April 2023.
USBR. 2023b. Central Valley Project Water Temperature Model Platform Review, Final Report, Oct 2023. https://deltacouncil.ca.gov/pdf/science-program/reports/2023-10-20-wtmp-2023-final-report.pdf.
USBR. 2024a. Final EIS: Long-Term Operations of the Central Valley Project and State Water Project. Appendix AB-L: Shasta Coldwater Pool Management. https://www.usbr.gov/mp/nepa/includes/documentShow.php?Doc_ID=55318.
USBR. 2024b. Appendix AB Biological Assessment Chapter 5 Winter-run Chinook. Long-Term Operation – Biological Assessment. https://www.usbr.gov/mp/nepa/includes/documentShow.php?Doc_ID=55341.
USBR. 2024c. Water Temperature Modeling Platform: Data Development. Central Valley Project. https://www.usbr.gov/mp/bdo/docs/water-temperature-modeling-platform-data-development.docx.
USBR. 2024d. Record of Decision (ROD) for the Long-Term Operation of the Central Valley Project and State Water Project. https://www.usbr.gov/mp/nepa/includes/documentShow.php?Doc_ID=55600.
USBR. 2024e. Appendix AB-J Winter and Spring Pulses and Delta Outflow. Long-Term Operation – Biological Assessment (Section 6.7). https://www.usbr.gov/mp/nepa/includes/documentShow.php?Doc_ID=55320.
USBR. 2024f. Appendix AB-F Modeling Long-Term Operation. Long-Term Operation – Biological Assessment. https://www.usbr.gov/mp/nepa/includes/documentShow.php?Doc_ID=55397.
USBR. 2025. DRAFT 2025 Sacramento River Temperature Management Plan, May 5, 2025. https://www.waterboards.ca.gov/waterrights/water_issues/programs/drought/sacramento_river/docs/2025/draft-2025-sacramento-river-temperature-plan.pdf.
USGS (U.S. Geological Survey). 1996. Dams and Rivers: Primer on the Downstream Effects of Dams. M. Collier, R. H. Webb, and J. C. Schmidt, eds. Circular 1126. https://doi.org/10.3133/cir1126.
Wang, H., J. Liu, M. Klaar, A. Chen, L. Gudmundsson, and J. Holden. 2024. “Anthropogenic Climate Change Has Influenced Global River Flow Seasonality.” Science 383(6686):1009–1014. https://doi.org/10.1126/science.adi9501.
Wells, S. A., T. C. Rasmussen, S. E. Null, and L. S. Garvin. 2025. HEC ResSim Water Temperature Model Platform (WTMP): Independent Peer Review. Prepared for the Delta Science Program. https://deltacouncil.ca.gov/pdf/science-program/2025-06-23-hec-ressim-water-temperature-model-platform-independent-peer-review.pdf.
Williams, A. P., B. Livneh, K. A. McKinnon, et al. 2022. “Growing Impact of Wildfire on Western US Water Supply.” Proceedings of the National Academy of Sciences 119(10):e2114069119. https://doi.org/10.1073/pnas.2114069119.
Windell, S., P. L. Brandes, J. L. Conrad, et al. 2017. Scientific Framework for Assessing Factors Influencing Endangered Sacramento River Winter-run Chinook Salmon (Oncorhynchus tshawytscha) Across the Life Cycle. NOAA-TM-NMFS-SWFSC-586 36. https://repository.library.noaa.gov/view/noaa/15458.
Winnemem Wintu. 2016. Winnemem Wintu Salmon Restoration Plan, McCloud River. https://cawaterlibrary.net/wp-content/uploads/2017/05/shasta_winnemem.pdf.
Wohner, P. J., A. Duarte, J. Wikert, B. Cavallo, S. C. Zeug, and J. T. Peterson. 2022. “Integrating Monitoring and Optimization Modeling to Inform Flow Decisions for Chinook Salmon Smolts.” Ecological Modelling 471:110058. https://doi.org/10.1016/j.ecolmodel.2022.110058.
Wuest, A., and A. Lorke. 2003. “Small-Scale Hydrodynamics in Lakes.” Annual Review of Fluid Mechanics. 35:373–412. https://www.annualreviews.org/content/journals/10.1146/annurev.fluid.35.101101.161220.
Yoshiyama, R. M., E. R. Gerstung, F.W. Fisher, and P. B. Moyle. 2001. “Historical and Present Distribution of Chinook Salmon in the Central Valley Drainage of California.” Fish Bulletin 179(1):71–176. https://escholarship.org/content/qt6sd4z5b2/qt6sd4z5b2.pdf#page=94.
Zeug, S. C., P. S. Bergman, B. J. Cavallo, and K. S. Jones. 2012. “Application of a Life Cycle Simulation Model to Evaluate Impacts of Water Management and Conservation Actions on an Endangered Population of Chinook Salmon.” Environmental Modeling & Assessment 17(5):455–467. https://doi.org/10.1007/s10666-012-9306-6.


