Review of the Long-Term Operations of the Central Valley Project and the State Water Project (2026)
Chapter: Appendix D: Descriptions of Monitoring and Modeling Relevant to the Projects
Appendix D
Descriptions of Monitoring and Modeling Relevant to the Projects
This appendix is a background reference document to the three action chapters. It discusses the monitoring enterprise in the Delta region, including a catalogue of the major monitoring networks relevant to the listed fish species and other physical and chemical parameters and hence broadly applicable to the Central Valley Project (CVP) and the State Water Project (SWP). It is valuable to know where long-standing physical, chemical, and biological monitoring data come from and what agencies or organizations are maintaining the networks. Previous reviews of the Delta monitoring enterprise are compiled. More thorough descriptions of the biological monitoring tools used for Shasta coldwater pool management are found herein.
The second half of this appendix itemizes and summarizes some major numerical models of physical processes common to all the actions reviewed by the Committee, particularly the core models used to simulate water quantity and quality for project operations. It also catalogues the life-cycle models for the listed fish species. Finally, it describes the biological tools and models used for Shasta coldwater pool management.
MONITORING TO SUPPORT THE CVP AND SWP
Monitoring is fundamental to understanding ecosystem status and responses to environmental and management drivers and hence is a key component of the long-term operations of the CVP and the SWP. Monitoring that supports the operation of CVP and SWP can serve one or more of three main purposes:
- Real-time Operations. These daily and weekly data inform the day-to-day project operations such as scheduling of releases and diversion. Examples of these types of data include water quality measurements to ensure compliance with salinity and flow standards in the state’s D-1641 regulation (see Appendix C), or fish data to ensure compliance with the 2024 biological opinions and incidental take permit (such as salvage data for Old and Middle River [OMR] management).
- Status and Trends. These are surveys on the long-term status of ecosystems. Examples include data on primary production, abundance of fish, and the Enhanced Delta Smelt Monitoring survey that provides population estimates. Some of these monitoring networks have been in place for a very long time (decades). They provide baseline knowledge of the system and are used for many purposes, such as to understand generally how actions may impact long-term metrics.
- Special Studies. Monitoring data collected during targeted studies are used to address a hypothesis. How are certain management actions working? Some of this work could be considered performance monitoring.
Various components of ongoing Delta monitoring support CVP and SWP management objectives for protecting water quality, fish, and fish habitat. These components include measurements of water flow, water quality, primary production, secondary production, and fish surveys. Surveys with particular relevance to the three actions reviewed in this report are listed in greater detail in Table D-1.
As illustrated and summarized in Table D-1, many state and federal agencies have been collecting large amounts of a wide range of data for some time. Because it focuses on the three actions, Table D-1 is not exhaustive of all Delta monitoring efforts. For additional information, the reader is referred to the Nelitz et al. (2020a) monitoring inventory report, which presents a table with more than 150 surveys, including invasive species surveys.
| Program/Project | Agency | Purpose/Study Type | Project Description Notes | Variables Monitored | Website |
|---|---|---|---|---|---|
| 20 mm Survey | CDFW | Short term/operations & Long Term | Larval fish survey to determine timing, distribution, and abundance of Delta smelt larvae and their food supply. | WQ, Fish, Zooplankton | https://wildlife.ca.gov/Conservation/Delta/20mm-Survey |
| Fall Mid-water Trawl Index (FMWT) | CDFW | Short term/operations & Long Term | Fish survey targeting adult fish abundance throughout the upper estuary during the fall. | WQ, Fish, Zooplankton | https://wildlife.ca.gov/Conservation/Delta/Fall-Midwater-Trawl |
| Spring Kodiak Trawl (SKT) | CDFW | Short term/operations & Long Term | The SKT determines the relative abundance and distribution of spawning Delta smelt. The SKT samples 40 stations. | Fish | https://wildlife.ca.gov/Conservation/Delta/Spring-Kodiak-Trawl |
| Summer Townet Survey (STN) | IEP, CDFW | Short term/operations & Long Term | Fish survey targeting Delta smelt and age-0 striped bass June through August. | WQ, Fish, Zooplankton | https://iep.ca.gov/Science-Synthesis-Service/Monitoring-Programs/Summer-Townet |
| U.S. Geological Survey (USGS) Continuous WQ | USGS | Short term/operations & Long Term | Continuous water quality (WQ’ i.e., temperature and salinity) and water level monitoring. | WQ | |
| Smelt Larva Survey (SLS) | CDFW | Short term/operations & Long Term | Near real-time distribution data for longfin smelt in the upper estuary. | WQ, Fish | https://wildlife.ca.gov/Conservation/Delta/Smelt-Larva-Survey |
| EMP: Discrete WQ | CDWR | Long Term | WQ and nutrient monitoring in the Delta, Suisun Bay, and San Pablo Bay. | WQ | https://iep.ca.gov/Science-Synthesis-Service/Monitoring-Programs/EMP |
| Environmental Monitoring Program: Phytoplankton | CDWR | Long Term | Phytoplankton monitoring in the Delta, Suisun Bay, and San Pablo Bay. | Phytoplankton | https://iep.ca.gov/Science-Synthesis-Service/Monitoring-Programs/EMP |
| EMP: Zooplankton | CDFW | Long Term | Microzooplankton (63–150 mm), mesozooplankton (150–500 mm), and mysid (>500 mm) samples collected throughout the estuary. | WQ Zooplankton | https://iep.ca.gov/Science-Synthesis-Service/Monitoring-Programs/EMP |
| EMP: Benthic Invertebrates | CDWR | Long Term | Benthic invertebrate monitoring in the Delta, Suisun Bay, and San Pablo Bay. | Phytoplankton, Benthic invertebrates | https://iep.ca.gov/Science-Synthesis-Service/Monitoring-Programs/EMP |
| Program/Project | Agency | Purpose/Study Type | Project Description Notes | Variables Monitored | Website |
|---|---|---|---|---|---|
| Fish Restoration Program | CDFW | Long Term | Monitors fish and invertebrate abundance in or near restored tidal wetlands. | WQ, Fish, Phytoplankton, Zooplankton, Benthic invertebrates | https://iep.ca.gov/Science-Synthesis-Service/Monitoring-Programs/Tidal-Wetland |
| Yolo Bypass Fish Monitoring Program | CDWR | Long Term | Monitors lower trophic levels, fish, hydrology, and WQ in the Yolo Bypass. | WQ, Fish, Phytoplankton, Zooplankton, Other invertebrates | https://iep.ca.gov/Science-Synthesis-Service/Monitoring-Programs/Yolo-Bypass |
| San Francisco Bay Study | CDFW | Long Term | Survey targeting both pelagic and demersal fish, shrimp, and crabs using otter trawls and midwater trawls throughout the Bay and upper estuary. | WQ, Other invertebrates, Fish | https://wildlife.ca.gov/Conservation/Delta/Bay-Study |
| Fish Salvage Monitoring | CDFW/CDWR | Short term/operations & Long Term | Data collected on fish entrained and salvaged at the Skinner Delta Fish Protection Facility. | Fish; regular counts and larval sampling | https://wildlife.ca.gov/Conservation/Delta/Salvage-Monitoring |
| Fish Salvage Monitoring | USFWS/USBR | Short term/operations & Long Term | Data collected on fish entrained and salvaged at the Tracy Fish Facility. | Fish; regular counts and larval sampling | https://data.usbr.gov/catalog/4494 |
| Suisun Marsh Survey | UC Davis | Long Term | Year-round fish surveys in Suisun Marsh. | WQ, Fish | https://iep.ca.gov/Science-Synthesis-Service/Monitoring-Programs/Suisun-Marsh |
| Delta Juvenile Fish Monitoring Program | USFWS | Long Term | Established in the 1970s to monitor juvenile salmon abundance in the Bay-Delta using trawling and beach seine nets. | Fish | https://www.fws.gov/project/delta-juvenile-fish-monitoring-program |
| Enhanced Delta Smelt Monitoring | USFWS | Long Term | Weekly surveys of fish communities; gear types rotate seasonally to target Delta smelt. | WQ, Fish | https://www.fws.gov/project/enhanced-delta-smelt-monitoring-program |
| USGS Polaris-Peterson Cruises | USGS | Long Term | Long-term boat-based monthly WQ samples. | WQ, Phytoplankton, Other | https://www.usgs.gov/centers/california-water-science-center/science/water-quality-san-francisco-bay-research-and |
| USGS Hydrodynamics Group Flow Network | USGS | Short term/operations & Long Term | 15-minute flow and WQ data collected at fixed stations. | WQ, Other | https://iep.ca.gov/Science-Synthesis-Service/Monitoring-Programs/Delta-Flows |
| USGS Biogeochemistry Group | USGS | Short term/operations & Long Term | 15-minute WQ data collected at fixed stations. | WQ, Phytoplankton, Other | https://sciencetracker.deltacouncil.ca.gov/activities/continuous-flow-and-water-quality-monitoring-network-sacramento-san-joaquin-delta |
| Program/Project | Agency | Purpose/Study Type | Project Description Notes | Variables Monitored | Website |
|---|---|---|---|---|---|
| Red Bluff Diversion Dam Rotary Screw Trap (RST) | USFWS | Short term/operations & Long Term | Currently provides biweekly, real-time, summarized daily passage estimates of all four runs of Chinook salmon and steelhead. | Fish | https://www.fws.gov/project/red-bluff-diversion-dam-juvenile-fish-monitoring |
| Upper Sacramento River Basin Salmonid Monitoring | CDFW | Long Term | High-priority stranding locations along the upper Sacramento River Basin between RM 300–246. | Fish | https://www.calfish.org/Programs/ConservationandManagement/CDFWUpperSacRiverBasinSalmonidMonitoring/tabid/357/Agg1606_Select-Tab/4/Default.aspx |
| Sacramento Valley Tributary Monitoring | CDFW | Long Term | Mainstem Sacramento R and its tributaries including Butte Creek, Big Chico Creek, Feather R, Yuba R, Bear R, Colusa Basin Drain, Natomas Cross Canal, American R, Cache Creek, Auburn Ravine, Cosumnes R, Mokelumne R, and the Calaveras R. | Fish | https://www.calfish.org/ProgramsData/ConservationandManagement/CentralValleyMonitoring/SacramentoValleyTributaryMonitoring.aspx |
| Middle Sacramento River Salmon and Steelhead Monitoring | CDFW | Long Term | Monitoring program at Knights Landing and Tisdale Weir. Rotary screw traps in the Sacramento River from Oct-June targeting juvenile Chinook salmon. | Fish | https://www.calfish.org/ProgramsData/ConservationandManagement/CentralValleyMonitoring/SacramentoValleyTributaryMonitoring/MiddleSacramentoRiverSalmonandSteelheadMonitoring.aspx |
| Feather River Fish Monitoring Station RST | CDWR | Long Term | The purpose of the FMS is to obtain accurate counts, determine temporal trends, and identify the origin of spring-run Chinook salmon, fall-run Chinook salmon, and steelhead that enter the Low Flow Channel of the Feather River. | Fish | https://www.calfish.org/ProgramsData/ConservationandManagement/CentralValleyMonitoring/SacramentoValleyTributaryMonitoring/DWR-FeatherRiverFishMonitoringStation.aspx |
| Lower Feather River RST Monitoring | CDFW | Long Term | Estimate the number of juvenile spring-run emigrating from the Feather River to the Sacramento River and thence the Delta for use in the development of a JPE for spring-run chinook salmon in the Sacramento River watershed. | Fish | https://www.calfish.org/ProgramsData/ConservationandManagement/CentralValleyMonitoring/SacramentoValleyTributaryMonitoring/LowerFeatherRiver-RSTMonitoring.aspx |
| Program/Project | Agency | Purpose/Study Type | Project Description Notes | Variables Monitored | Website |
|---|---|---|---|---|---|
| Stanislaus River (Caswell) - RST Monitoring | USFWS | Long Term | The primary objectives of the study are to collect data that can be used to estimate the passage of juvenile fall-run Chinook salmon and to quantify the raw catch of steelhead. | Fish | https://www.calfish.org/ProgramsData/ConservationandManagement/CentralValleyMonitoring/StanislausRiver-RSTMonitoring.aspx |
| Directed Outflow Project - Delta Smelt and lower trophic | USBR | Special Study | USBR and CDWR, along with collaborators, are continuing efforts to evaluate the hypothesized benefits of outflow and outflow alteration for Delta smelt. The collective aim of these efforts is to better inform management actions that will bolster and stabilize the Delta smelt population. | Fish, WQ, Phytoplankton, Zooplankton | https://sciencetracker.deltacouncil.ca.gov/activities/directed-outflow-project |
| Fish Diet and Condition Study | CDFW | Special Study | This study has provided information on the foraging habits of pelagic fishes in the San Francisco Estuary (SFE) since 2005. This study was created to address food limitation in young fish by understanding the types and amount of prey eaten among seasons and regions of the SFE. | Fish stomach contents | https://wildlife.ca.gov/Conservation/Delta/Special-Studies |
| North Delta Flow Action | CDWR | Special Study | This project monitors and evaluates the effects of augmented summer and fall flows in the Yolo Bypass and North Delta on lower trophic food-web dynamics and the benefits to listed fish species. | WQ, Phytoplankton, Zooplankton | https://nrm.dfg.ca.gov/FileHandler.ashx?DocumentID=225604&inline |
| Suisun Marsh Salinity Control Gate Study | CDWR | Special Study | WQ, fish, phytoplankton, clams, and zooplankton monitoring to support the Summer-Fall Suisun Marsh Salinity Control Gates Action, summer and fall 2018–2021. | WQ, Phytoplankton, Zooplankton, Benthic invertebrates, Fish | |
| Larval Entrainment Pilot Study | CDFW/CDWR | Special Study | Project seeks to better understand larval osmerid entrainment into Clifton Court Forebay. | WQ, Fish | https://nrm.dfg.ca.gov/FileHandler.ashx?DocumentID=225646&inline |
Past Reviews of Delta Monitoring Programs
Several reviews on monitoring programs in the Delta have been undertaken in the past 10 years. The breadth of these reviews has ranged from comprehensive (all agencies and types of monitoring) to specific topics (e.g., invasive species or trawling), species, or programs.
The Delta Independent Science Board (DISB, 2022) completed the most comprehensive recent review of the monitoring enterprise in the Delta. This four-year effort was based on three contracted reports (Nelitz et al., 2019, 2020a,b), which included a detailed inventory and an analysis of monitoring integration across agencies, a workshop, surveys, interviews, a comprehensive literature review, and a series of scientific panels and seminars. The comprehensive inventory of the monitoring enterprise of the Delta was particularly noteworthy (Nelitz et al., 2020a). It included discussions of the size and geographic scope of monitoring programs across federal, statewide, regional, local, agency, and private entities. Monitoring activities were categorized by management themes: water supply, flood management, habitat management, native species management, invasive/non-native species management, water quality, and land use management. The inventory includes 120 unique monitoring activities spanning more than 1,500 sampling locations within the Delta and Suisun Marsh. Detailed tables show which entities are doing the monitoring as well as the years sampled, and specific parameters measured. For example, sampling of Chinook salmon, steelhead, and green sturgeon was found to be part of 31, 26, and 18 monitoring activities, respectively (Nelitz et al., 2020b). There is also an analysis of interactions among agencies doing the monitoring.
The review identified five best practices that should be formally adopted into individual monitoring programs to help address the challenges and issues identified in the review:
- Monitoring should be tied to the goals, objectives, and specific questions of interest to managers, decision makers, scientists, and stakeholders.
- Monitoring should also be informed by stakeholder engagement and participation, and, when appropriate, include alternative forms of data and knowledge such as Traditional Knowledge, experiential information, and qualitative observations.
- Monitoring plans should have enough flexibility to take advantage of new information and opportunities to adapt to issues, to scientific opportunities such as unusually low or high flows, and as new techniques and technologies become available.
- Monitoring programs must include adequate data management, quality control, analysis, and synthesis, and should strive to improve statistical validity.
- Monitoring programs should ensure that the data produced are accessible and shared with the public and other agencies.
The Interagency Ecological Program (IEP) review (IEP Long-term Survey Review Team, 2021) considered three long-term bottom and midwater trawl fish surveys (San Francisco Bay Study, Fall Midwater Trawl, and Suisun Marsh—Table D-1) that collect data on abundance and distributions of multiple fish species in the San Francisco Bay and Estuary ecosystem. The review notes that the three fish surveys have had a range of objectives that have shifted over their 50-year history. It adds that the fish surveys are useful primarily for looking at changes in relative abundance, because absolute abundance cannot be directly calculated given gear selectivity and environmental factors that affect catchability across different fish sizes and environmental sampling conditions. The review also notes that unavailability of measures of uncertainty compromises the reliability of long-term trends in abundance and that evaluations of year-to-year trends need to assume that all catchability factors (e.g., turbidity, temperatures) do not vary among years.
In October 2021, the Collaborative Science and Adaptive Management Program (CSAMP) (a voluntary collaboration of 17 entities representing state, federal, and public water agencies and nongovernmental organizations) held a workshop that focused on six monitoring reviews (described in Conrad and Moffett, 2022):
- The Delta Independent Science Board monitoring enterprise review 2018–2022
- Historical IEP Monitoring Program Reviews 2004–2019
- IEP Long-term Monitoring Element Review: Pilot Approach and Methods Development
- Six-Agency Monitoring Redesign 2020–2022
- Winter-run Chinook Salmon and Sturgeon Assessment of Indicators by Life Stage (SAIL) 2015–2016
- U.S. Fish and Wildlife Service (USFWS) Monitoring Review to Support Delta Smelt Life-Cycle Modeling (since 2008)
According to Conrad and Moffett (2022), CSAMP members “indicated that they rely on the existing monitoring programs for status and trends; real-time information, including regulatory compliance; and assessing the effectiveness of management actions.” CSAMP members also used monitoring data to support modeling and targeted research. The CSAMP report also discussed resource allocation and balance among objectives and agencies, the value of monitoring programs, gaps in information, and the time and space scales of monitoring relative to operations and management. It recognized the need for flexibility in monitoring given the potential for rapidly changing conditions (e.g., climate change, sea level rise, invasive species).
Biological Monitoring in Support of Shasta Coldwater Pool Management
Redd Monitoring
Redd surveys are conducted weekly between Keswick Dam and Balls Ferry from May to August to document location, timing, and success of Chinook spawning activity. Surveys by the California Department of Fish and Wildlife (CDFW) and USFWS involve walking or boating along critical reaches of the Sacramento River to document the location, depth, and surrounding flow conditions of each redd, noting any signs of dewatering or sediment exposure, and whether the eggs or fry remain viable. To complement ground surveys, drones and aerial surveys are used once or twice a season in large and difficult-to-access areas to identify trends in redd distribution across a broader region.
During the spawning season (May–September), data collected from weekly redd surveys are combined with water temperature data and flow modeling to estimate the survival of incubating eggs. The information is fed into temperature-dependent mortality models (e.g., the Martin or Anderson models—see Chapter 2) to simulate the proportion of eggs that survive to the fry stage under specific environmental conditions. The findings directly inform flow release schedules from Shasta Reservoir, ensuring that water levels remain adequate to protect redds during critical incubation periods. Survival estimates also contribute to long-term management strategies by identifying trends in habitat quality, spawning success, and areas requiring restoration, such as gravel augmentation or sediment removal.
Carcass Surveys
Carcass surveys, which provide data on adult salmon escapement, spawning success, and population resilience, are conducted weekly from May to September by CDFW in collaboration with USFWS, with more frequent surveys during peak spawning periods. Surveys involve systematically identifying and collecting salmon carcasses from spawning reaches downstream of Keswick Dam. Carcasses are located using methods such as boat and snorkeling surveys, and they are tagged and returned to the river for mark-recapture estimates, which form the basis for escapement estimates. Fin clips, otoliths, and scales are also collected from carcasses to analyze genetic diversity, hatchery contributions, age structure, and life-history traits.
Although they do not directly inform operational decision making, carcass surveys contribute to validation of long-term flow management actions and planning. Escapement data and spawning success rates help to evaluate the effectiveness of flow and temperature strategies implemented earlier in the season. Insights from carcass surveys help to determine flow schedules or coldwater allocation strategies for subsequent years based on population trends and spawning success. Moreover, genetic and biological data collected during carcass surveys are used to assess the relative contribution of hatchery-origin fish to the total population.
Juvenile Salmon Monitoring
Juvenile outmigration monitoring is a critical component of assessing the survival, migration success, and population dynamics of winter-run Chinook salmon. This monitoring involves rotary screw traps, acoustic tagging, and environmental data collection to track juvenile salmon as they migrate downstream. CDFW, USFWS, and the National Marine Fisheries Service (NMFS) collect these data to inform short-term operational decisions such as flow adjustments and long-term strategies for species recovery.
Rotary screw traps installed in key migration corridors on the Sacramento River are the most widely used method for estimating abundance, survival, and timing of juvenile outmigration. Traps at the Red Bluff Diversion Dam provide data shortly after the fish leave spawning areas downstream of Keswick Dam while traps at Knights Landing enumerate juveniles as they move further downstream toward the Delta. Traps are operated daily during the outmigration season, typically year-round at Red Bluff Diversion Dam and from August through June at Knights Landing. Captured fish are measured, counted, and assessed for condition before being released back into the river. Data on size and growth patterns provide insights into how rearing conditions, such as water temperature and habitat quality, affect juvenile development. Water temperature, turbidity, and flow are also measured to assess how these factors influence migration success. Importantly, population size estimates rely on mark-recapture of juveniles. Best practices would involve performing mark-recapture at daily time scales under variable flow conditions to capture the breadth of potential variability affecting recapture. Apparently, however, recapture at Red Bluff is performed only a few times a season, with important implications for the accuracy of outmigrating population estimates.1
Acoustic tagging is used to complement rotary screw trapping by providing detailed data on migration routes, survival, and habitat use. Wild fish are captured, tagged, and released at various points along the Sacramento River; hatchery fish are also tagged and released. Outmigration dynamics of tagged fish are tracked using a network of stationary acoustic receivers deployed throughout the river, which enables researchers to identify migration bottlenecks, such as predation hotspots or areas with poor habitat connectivity. The data are processed and analyzed weekly or biweekly during the migration season. In the short term, the data inform operational managers about the timing and magnitude of juvenile outmigration, enabling flow adjustments to enhance migration conditions. In the long term, these data are used to assess the effectiveness of coldwater pool management strategies on juvenile survival, evaluate population trends, and guide habitat restoration efforts aimed at improving rearing and migration conditions. Insights from outmigration monitoring are also critical for refining predictive models and setting conservation goals for winter-run Chinook salmon recovery.
Current rotary screw trap and acoustic tagging methods have limited spatial and temporal resolution. Expanding spatial coverage to include under-monitored areas, such as downstream reaches and alternative migration pathways through the Sacramento Valley, would provide a more comprehensive understanding of juvenile survival throughout the river system. Adding more monitoring stations in restored floodplains and side channels could help evaluate the effectiveness of these habitats in supporting juvenile growth and survival. Increasing the frequency of monitoring during peak outmigration periods or high-risk environmental conditions would enable managers to detect rapid changes in juvenile abundance and migration timing, improving the responsiveness of flow and temperature management.
Alternative methods of tagging fish, such as micro-PIT (Passive Integrated Transponder) tags, could enable researchers to include earlier life stages and smaller fish in monitoring efforts. Pairing tagging data with real-time environmental monitoring of water temperature, turbidity, and predator presence would provide managers with a clearer picture of the factors affecting survival and migration success. Real-time data on juvenile survival and migration timing could enable flow adjustments to improve passage conditions and reduce risks, such as predation or unfavorable hydrodynamics.
___________________
1This paragraph was edited after release of the report to clarify the timing of rotary screw trap operation.
Habitat Surveys
Rearing habitat surveys evaluate the quality and availability of habitats critical for juvenile growth and survival by assessing off-channel habitats, floodplains, and mainstem river areas to determine their suitability for rearing during key life stages. CDFW, USFWS, and NMFS lead these efforts in collaboration with local watershed groups and conservation organizations. Surveys are conducted seasonally, peaking during juvenile rearing and outmigration periods (December through March). The data are used to guide operational flow decisions, restoration planning, and long-term recovery strategies for winter-run Chinook salmon.
Rearing habitat surveys typically involve field assessments of water depth, temperature, turbidity, flow velocity, and cover availability, including vegetation, woody debris, and overhanging banks—factors that influence juvenile survival by providing refuge from predators, maintaining optimal temperatures, and supporting prey availability. Riparian and floodplain habitats, which provide optimal foraging and refuge from predation, are monitored for connectivity during high-flow periods. Although much of the monitoring data are collected manually by wading or through boat surveys, drone imagery is used to map habitat extent, and high-frequency sensors are used to monitor environmental co-variates such as temperature and dissolved oxygen continuously. Biological sampling is often conducted in conjunction with habitat surveys to evaluate prey abundance and the presence of predators.
In the short term, data from rearing habitat surveys are integrated into flow management tools, such as hydrological models (e.g., CalSim), to adjust reservoir releases and ensure adequate connectivity between the mainstem river and off-channel habitats during critical rearing periods. Over the long term, rearing habitat data are used to identify areas for targeted restoration, such as floodplain reconnection, channel reconfiguration, or invasive species removal. These data inform the Winter-Run Chinook Salmon Lifecycle Model (Hendrix et al., 2019), which evaluates population viability and recovery progress under various habitat and operational scenarios.
MODELING
Since the 1970s, computer models have supported discussions, management, and policymaking for the CVP and the SWP in terms of water supply, flood, and hydropower operations. These modeling capabilities began with earlier organized hand calculations and the automation of these hand calculations. Over more than 50 years of computer modeling for these systems, modeling for water supply, floods, and hydropower has advanced greatly. Although these models have limitations (like all models), their accuracy and precision have improved, and they are usually useful, but still sometimes fallible, guides for managers and policymakers. These models, if run well, are usually much more accurate than our unaided intuitions or even the unaided intuitions of experts. Perhaps more importantly, modeling provides a framework for assembling more detailed and integrated knowledge and understanding of physical and policy aspects of these systems, which can enhance and test proposals for improving operation, infrastructure, and policies.
In contrast, modeling for ecosystem and environmental purposes is more difficult, because this requires the coupling of models of various physical processes with models of additional water quality, biological, and ecological processes. Such complex couplings require routine, tested, and long-term data development and quality control. It requires that more than a few modelers are experienced and comfortable with model architecture, construction, use, and shortcomings. Therefore, it is not surprising that modeling for ecological and environmental purposes is less advanced and less mature than that for physical processes in the Delta. Furthermore, when life-cycle models rely on underlying models of water flow and quality, such ecosystem models accumulate uncertainties, errors, and simplifications from underlying hydrodynamic and water quality models along with the errors already present from an imperfect understanding of biological and ecological processes.
Improving and interpreting both types of models are often hindered by the lack of field and laboratory data. Field data are especially expensive and time-consuming to gather, so most fish and ecosystem models have coarser spatial and temporal resolutions and tend to be less accurate than their underlying hydrodynamic and water quality models. Collecting sufficient field data is particularly hindered when the target is an endangered species; for example, Delta smelt modeling is challenged by the lack of wild Delta smelt populations for calibrating and testing mechanistic life-cycle models. This situation reduces the value and future of mechanistic modeling for guiding
Delta smelt management actions, unless wild Delta smelt populations recover at least somewhat. It seems important to aggressively develop life-cycle and ecological models for other desired Delta fishes, so these models can become insightful enough to guide management and policy actions before fish populations decline so far that the models can no longer be tested and updated for changing conditions with new field population data.
Few species life-cycle and ecological models for the Delta are likely to be accurate enough to firmly guide Delta ecosystem management for several years, but they are important today for firming up, exploring, and tentatively testing ideas and tradeoffs for Delta management. They are also an essential platform for coordinating and bringing together scientific activities and results. Without an integrative framework and empowered leadership for bringing science together with evolving management and policy contexts, most of the Delta monitoring work will offer only meager insights.
The Central Valley’s ecosystems and water management system face unprecedented changes in climate (higher temperatures, sea level, and storm frequency and intensity), invasive species (e.g., the golden mussel), and economic and demographic pressures (see Appendix A). Other regions, such as the Great Lakes, are struggling with similar ecological disruptions (Egan, 2017). Tools for both strategic and tactical decisions for the Central Valley (and California) are highly fragmented and mostly ad hoc in their development and testing. Particularly for ecological aspects of these systems, the collection of data and development and use of models are rarely organized for longer-term decisions that have only been (and can mostly only be) vaguely defined.
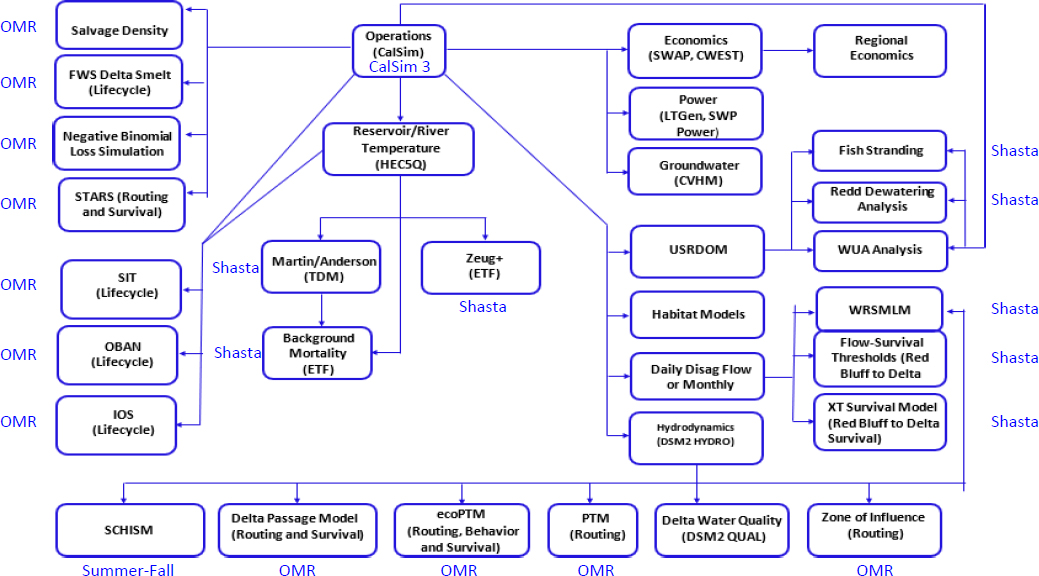
A suite of numerical models is available for long-term operations of the CVP and SWP, generally using a sequence of hydrologic, operations, hydrodynamics, water quality, and fisheries analyses. These linked modeling analyses provide an integrated assessment of how CVP and SWP operations affect Delta resources such as water supply, surface water, groundwater, and aquatic ecosystems. Figure D-1 below is a linkage schematic of models used for this purpose, with the model in each box providing input information to the subsequent models for the Shasta Coldwater Pool Management Action, the OMR Flow Management Action, and the Summer-Fall Habitat Action. The figure clearly highlights the central role of CalSim3 currently in simulating the long-term operation of CVP and SWP facilities. Water agencies have freedom to select models at their discretion for assessments. However, for biological opinion-related work, models require USFWS and NMFS approval.
Only some of the models shown in Figure D-1 are described in detail in this appendix. First, previous chapters describe several of the numerical models of physical processes that are the subject of conclusions and recommendations, including CalSim, Delta Simulation Model II (DSM2), Semi-implicit Cross-scale Hydroscience Integrated System Model (SCHISM), and UnTRIM. Second, a table of the fish life-cycle models relevant to the three actions reviewed in this report is provided here. Finally, more detailed descriptions of the biological models and tools relevant to Shasta coldwater pool management are provided than were found in Chapter 2.
Numerical Models of Physical Processes
Because it is the underpinning of all flow actions in the CVP and SWP, including those being reviewed by this Committee, the following section first describes the CalSim3 model to acquaint the reader with its general uses, strengths, and weaknesses. The section below also describes DSM2, SCHISM, and UnTRIM because of their frequent use in Delta management.
CalSim3
The backbone of current long-term operations modeling is CalSim3, jointly developed by the California Department of Water Resources (CDWR) and the U.S. Bureau of Reclamation (USBR) as a planning tool (CalSim3, 2022; Draper et al., 2004; Figure D-2). It has become the key tool for water operations for the Central Valley because it generates estimates of river flows, exports, storage, deliveries, power generation, fish salvage, routing, and many other parameters. All CVP and SWP long-term operational/planning models receive input from CalSim3. It can also be used for short-term operations; for example, Delta boundary flow inflows/exports from CalSim3 are used to drive the hydrodynamic model DSM2-HYDRO, the output of which is used for execution of DSM2-QUAL (water quality) and DSM2-PTM (particle tracking) models. CalSim3 was the subject of a recent extensive modeling review by the Delta Science Program (Rose et al., 2024).
NOTE: In 2025, HEC-5Q has been replaced by the more comprehensive Water Temperature Modeling Platform (WTMP), which utilizes a combination of CE-QUAL-W2 and HEC ResSim.
SOURCE: USBR (2024a).
CalSim3 represents operational decisions using a sequence of single time step linear optimizations with constraints and weighted priorities, within the general-purpose simulation environment Water Resources Integrated Modeling System developed by CDWR in 2000. CalSim3 simulates long-term operations for multi-year periods, using a monthly time step, over a 100-year time period (e.g., 1921–2021). It assumes constant facilities, land use, water contracts, and regulations for a fixed present or future development period. The highest spatial resolution is Demand Units (DUs), identified as areas with uniform water rights, contracts and sources, land use (e.g., agricultural, urban, wetland), and delivery and irrigation efficiencies. These areas usually represent large irrigation districts or groups of local water districts or a metropolitan area. Groups of DUs form a Water Budget Area, for computations.
Hydrologic inputs to CalSim3 include rim watershed hydrology and valley surface hydrology. The rim hydrology is mainly estimated by snowfall, snowmelt, and precipitation runoff from peripheral mountains (rim inflows), and is preprocessed as a time series of unimpaired runoff entering the rim boundary at the foothills. The valley floor hydrology is simulated using an array of models representing various valley floor hydrologic processes, with input files in the form of a Hydrologic Engineering Center-Data Support System (HEC-HMS) model (Anderson et al., 2002). Input hydrologic models are run external to CalSim3 without dynamic linkages. These models encapsulate the surface runoff from precipitation; applied water demand for rice (AWr); applied water demand for other agricultural crops (AWo); applied water demand for permanent, semi-permanent, and seasonal wetlands (AWw); urban demand, combining indoor and outdoor components; tailwater from irrigated agricultural land; wastewater return flows from wastewater treatment plants; and deep percolation from all land use classes. The groundwater system and its interaction with surface water is also included (Brush et al., 2013).
CalSim3 is run on demand for Delta flow management, and its coarse monthly time resolution enables model execution in about three to four hours for 100 years. CalSim3 output is flow at DU spatial scales, so
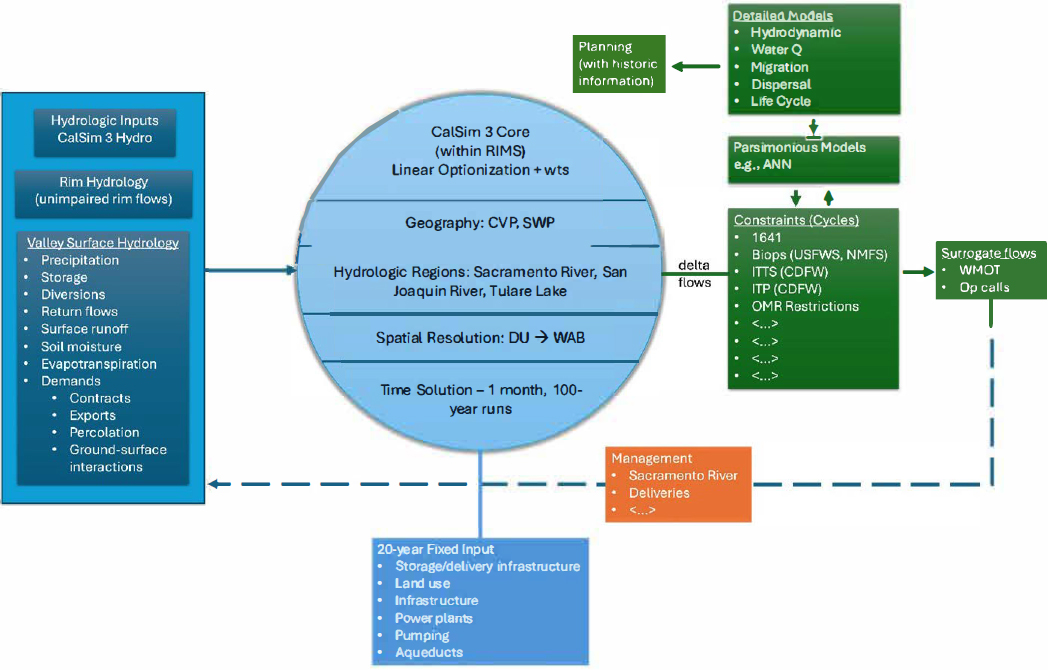
higher-resolution information for finer time and geographic scales needs suitable downscaling for many water quality, fish, and ecological purposes. To meet salinity and X2 standards for the Delta, CalSim3 relies on DSM2 model simulations of water quality and water quality standards. However, DSM2 is too computationally expensive for long-term planning runs (a run takes six to eight hours). Therefore, CalSim3 uses simplified flow-salinity relationships (based on more parsimonious models, described below) to calculate flows needed to meet a particular water quality standard.
Artificial neural networks (ANNs) (Anderson, 2004; Sandhu et al., 1999; Wilbur and Munevar, 2001) are routinely employed within CalSim3, trained using data from offline DSM2 simulations that translate salinity into flow equivalents (Jayasundara et al., 2020). These ANNs are surrogate models for DSM2 to represent the impact of operations on salinity standards and X2. They simulate salinity based on seven input variables in the Delta, including water control gate operations, water exports, tidal stage and flow, and salinity boundaries, and have been trained a priori for bulk flow-salinity relationships using an ensemble of DSM2 simulations. The 12 regulatory salinity control stations are Emmaton, Jersey Point, Collinsville, Rock Slough, Antioch, Mallard Island, Old River at Highway 4, Martinez, Middle River Intake, Victoria Intake, CVP Intake, and Clifton Court Forebay Intake, and currently the first four are calculated/used for decision making, for which the required CalSim3 run times are practicable. Variants of ANNs (not yet implemented in CalSim3) are available, such as those of Qi et al. (2021, 2022) that simultaneously predict salinity at all 12 regulatory water quality monitoring stations as well as the model developed by Namadi et al. (2023) for estimating ion constituents based on salinity.
For a given (monthly) time step, submodels are run to ensure that regulatory constraints are met (e.g., Water Rights Decisions D-1422, D-1616, D-1641, biological opinions, OMR flow surrogates). These submodels are discussed in greater detail in Chapter 3 under the section Modeling of OMR Flow Management.
DSM2
DSM2 (CDWR-DSM2, 2019) is a relatively coarse shallow-water one-dimensional (1-D) model of Delta hydrodynamics (DSM2-HYDRO) with extensions for water quality (DSM2-QUAL) and particle tracking (DSM2PTM). The basic model is typically run with a 15-minute time step. The use of DSM2 in OMR flow management is described in greater detail in Chapter 3. Figure D-3 shows the DSM2 model grid.
Sridharan et al. (2018) describe and evaluate the accuracy of DSM2. Not surprisingly, modeling of junction flow splits, tidal phasing, and particle tracking tend to be faster but less accurate with DSM2 compared with the more detailed SCHISM modeling.
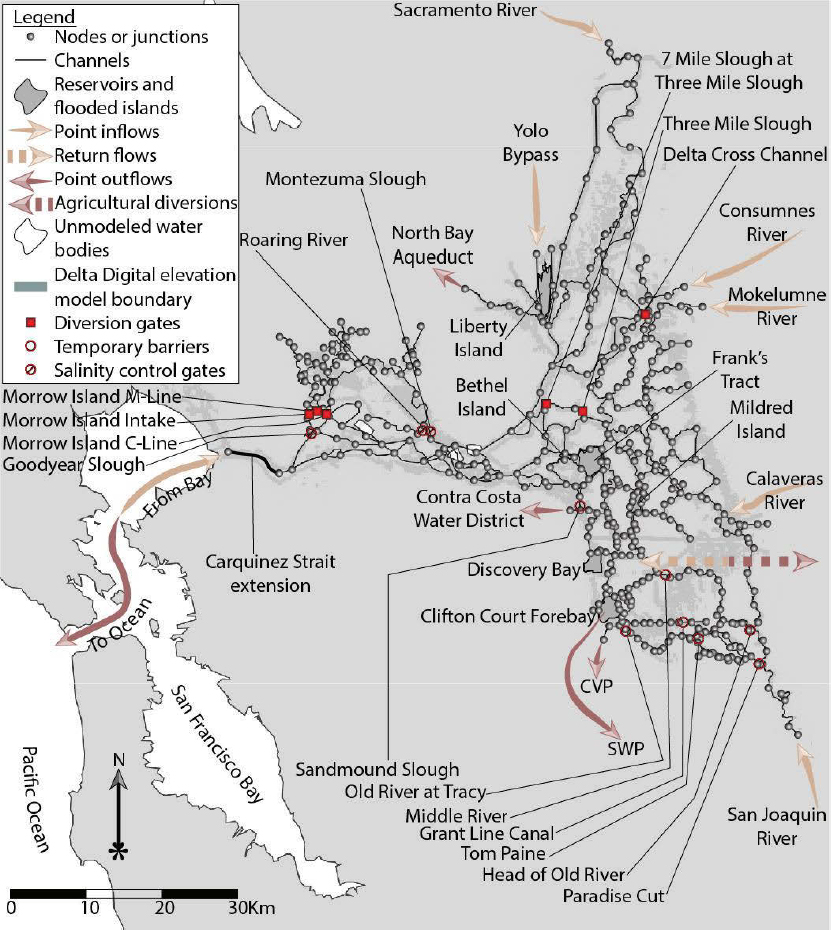
SOURCE: Sridharan et al. (2018).
SCHISM
SCHISM is a three-dimensional hydrodynamic and water quality model developed by CDWR to represent detailed water level, flow, and water quality responses to tides, inflows, wind, and atmospheric pressure in the Delta. SCHISM is the predominant model used by CDWR. It runs at fine spatial and temporal scales (over more than 300,000 spatial elements2 with 90-second time steps) to estimate local water elevation, velocity, and water quality effects in a tidal environment with numerous water and constituent inputs and outputs. Its long run times preclude its use for long-term simulations, but it is commonly used for policy and planning evaluations, as well as for providing physics-based water elevation, velocity, and salinity results that can then be used to calibrate simpler models (such as DSM2) for highly altered conditions such as sea level rise or major infrastructure changes. The SCHISM model of the Delta can be supplemented with additional water quality, biological, and ecosystem models to provide additional results for short representative time periods (e.g., Wang et al., 2020), particularly using particle tracking methods. Indeed, it is one of a variety of other two- and three-dimensional models of the Delta that have been developed and used by consultants and researchers (MacWilliams et al., 2016). In general, these models have greatly enhanced our ability to understand tidal effects on the physics, water quality, and ecological processes of the Delta.
UnTRIM
UnTRIM is a hydrodynamic model based on three-dimensional shallow water equations as well as transport equations, adapted for Bay-Delta boundary conditions. It is used to test hypotheses and evaluate impacts of varying management actions, climate scenarios, and hydrology. The model provides predictions of water level, tidal flows, current speed, and salinity. Use of an unstructured mesh grid at varying resolutions allows for individual cells to be wetted and dried in both horizontal and vertical directions by solving Navier-Stokes equations in the horizontal plane. Varying grid size allows for flexibility in a single model: localized model predictions can be made while still incorporating estuary-wide hydrodynamics. The model incorporates high-resolution bathymetric data varying from 10-meter to 90-meter resolution within different Bay regions (e.g., San Pablo Bay derived from 30-meter, Suisun Bay derived from 10-meter). Calibration includes water level, flow, and salinity observations from the San Francisco Bay and Delta (Casulli and Zanolli, 2002; MacWilliams et al., 2016). Model calibration and validation show that UnTRIM provides accurate predictions of flow, stage, and salinity (USBR, 2024c).
Water Temperature Modeling Platform (WTMP)
The WTMP3 is a major initiative by USBR to establish a community model that informs water temperature management through cascades of reservoirs and the intervening river reaches. In 2025, WTMP will replace HEC-5Q and comprises a new data management system, the CE-QUAL-W2 and HEC-ResSim models. The Shasta Coldwater Pool Management Action will use the WTMP. This suite of models will be available through USBR, and the intent is to enable a community of interested modelers to be established that can access and use the tool. USBR plans training opportunities with future developments being guided by USBR and this modeling community. The model platform has been designed to be accessible and transparent, but the code is not open source. HEC-ResSim was under development at the time of writing this report, with constructive preliminary independent peer reviews of both the WTMP and HEC-ResSim being completed by the Delta Science Program in 2023 and 2025. The WTMP is expected to go live in late 2025.
___________________
2See https://resources.ca.gov/-/media/DWR-Website/Web-Pages/Programs/State-Water-Project/Operations-And-Maintenance/Files/Bay-Delta/Monitoring-Special-Study/MSS-Plan/Attachment-3---SCHISM-3D-Hydrodynamic-and-Water-Quality-Modeling-Work-Plan.pdf.
Fish Life-Cycle Models
A life cycle is the series of stages in form and functional activity through which an organism passes between successive recurrences of a specified primary stage. It represents various developmental stages that occur during an organism’s lifetime including reproduction, thus creating the cycle. Different stages can include survivorship and growth and potentially evolutionary aspects.
A life-cycle model is an attempt to conceptualize subjectively or quantitatively the life cycle of an organism. Illustrated figures, such as Figure D-4, are often used to provide conceptual visual frameworks for discussion, but quantitative models can also be built, and these can come in various forms and different degrees of complexity. Hendrix et al. (2014) indicate that such quantitative life-cycle models for fish can often be referred to as age-, size-, or stage-structured models. Such a definition includes the quantitative population dynamics models used for estimating fish abundance for commercial fisheries using catch landings and catch per unit effort indices. Examples include assessments for species such as pollock, cod, herring, and various flatfish. However, for anadromous fish such as salmon, sturgeon, and some smelt species, the riparian or estuarine elements are often highlighted separately from the oceanic life stages to appropriately characterize differences in how survivorship occurs and how strongly various anthropogenic influences transpire. These anthropogenic influences include changes to the landscape, climate change, and harvest and, more recently for the species in consideration here, influences occurring through population supplementation efforts. The breakout between rearing stages in riparian and estuarine habitats and the adult oceanic stages also represents differences in temporal and spatial scales as well as life-history stage.
The life-cycle models listed in Table D-2 for some of the listed species are simulation models as opposed to estimation models such as those described above for stock assessment. This means that input parameters for processes such as survivorship, growth, movement, and reproductive rates as well as abiotic environmental factors
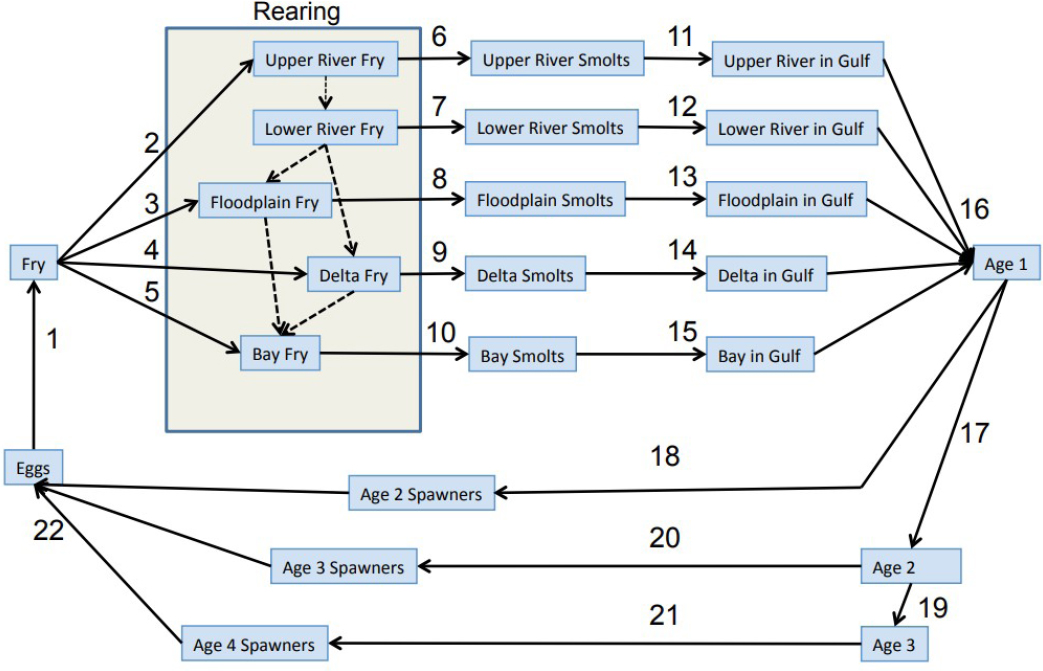
SOURCE: Hendrix et al. (2019).
such as temperature and habitat preferences are needed to run the model. Although several of the papers cited in Table D-2 indicate gaps in this information, additional information has been collected over time and the life-cycle models have grown in sophistication.
Other Models and Tools in Support of Coldwater Pool Management
Redd Dewatering Tools
Redd dewatering tools simulate the interaction between river stage and the spatial distribution of salmon redds to assess the risk that developing eggs become exposed during flow recession (USBR, 2024b). These tools help evaluate tradeoffs between early-season flow stability and coldwater pool conservation for later use. Although conceptually straightforward, they are sensitive to the resolution of topographic data, accuracy of stage-discharge relationships, and the timing and location of spawning. The primary approach uses stage-discharge relationships developed by USFWS for key spawning reaches in the upper Sacramento River. Redds mapped through ground and aerial surveys are assigned to elevation bands based on high-resolution topographic and bathymetric data. Projected river stages under different flow scenarios—modeled with HEC-River Analysis System—identify redds at risk of dewatering during drawdown. This knowledge informs operational decisions on ramping rates, fall flow targets, and stabilization periods in the early spawning season (USBR, 2024b).
While operationally useful, these tools have several limitations. They assume that redd elevation is fixed and accurately mapped, yet ground surveys may be incomplete, and aerial surveys can miss or misclassify redds in complex habitats. Elevation data often lack the vertical precision needed to capture biologically meaningful inundation thresholds. Dewatering is typically treated categorically (CDFW, 2014; USFWS, 2006) or modeled as a binary outcome (either inundated or not; USBR, 2024b), ignoring sublethal risks such as thermal exposure, partial drying, or behavioral avoidance by spawners associated with hydrological gradients (Dudley et al., 2022). Most tools also assume static stage-discharge relationships, which may shift due to sedimentation, bed mobility, or vegetation growth. These simplifications limit predictive accuracy in dynamic channels, especially in low-flow
TABLE D-2 Select Quantitative Biological Models Used in the Long-Term Operations of the CVP and SWP
| Citation | Model Type | Fish Species |
|---|---|---|
| Newman, 2003 | Bayesian nonlinear hierarchical model | Winter-run Chinook |
| Lindley et al., 2007 | Quantitative extinction model | Spring-run and Winter-run Chinook, Steelhead |
| Crozier et al., 2008 | Stochastic, density-dependent life-cycle model | Spring-run Chinook |
| Maunder and Deriso, 2011 | State-space multistage life-cycle model | Delta smelt |
| Zeug et al., 2012 | Stochastic life-cycle simulation model | Winter-run Chinook |
| Rose et al., 2013a,b | Individual-based population model | Delta smelt |
| Hendrix et al., 2014, 2019 | Winter-Run Life-Cycle Model, a stage structured, stochastic model | Winter-run Chinook |
| Johnson et al., 2017 | Uses same life-stage-dependent conceptual models as Windell et al. | Winter-run Chinook |
| Windell et al., 2017 | SAIL effort that looked at conceptual models | Winter-run Chinook, green and white sturgeon |
| Castillo, 2019 | Community matrix model | Delta smelt |
| Cordoleani et al., 2020 | Spatially explicit stage-structured model (similar to Windell et al. and Hendrix et al.) | Spring-run Chinook |
| Polansky et al., 2021 | Nonlinear state-space model | Delta smelt |
| Chen et al., 2023 | Stage-structured model | Winter-run Chinook |
years when small discharge changes cause large shifts in wetted area (Gosselin and Beer, 2024). Despite these constraints, redd dewatering models remain a valuable component of Shasta operations planning. Their outputs are regularly used alongside temperature forecasts and spawning surveys to assess risks to early-incubating eggs, especially when considering flow reductions after spawning onset (USBR, 2024b).
Juvenile Stranding Tools
Juvenile stranding tools estimate the likelihood that outmigrating Chinook salmon become trapped in disconnected pools or side channels following rapid declines in river flow. Risk curves developed by USFWS (2006) are used to evaluate the risk of stranding to the rate and magnitude of stage decline associated with operational changes such as pulse flow recession or hydrograph drawdown (USBR, 2024b). In most cases, these tools are implemented as categorical or threshold-based tools to guide operational decision making. These tools are most applicable during periods of high flow variability—such as storm events or managed pulses—when the margin between accessible and isolated habitat changes rapidly.
Because the tools are based on empirical observations, they are effective in identifying high-risk discharge scenarios. However, the tools have several constraints. They do not simulate fish behavior or spatial habitat dynamics mechanistically. For example, they cannot account for localized variations in channel complexity, substrate permeability, or hydraulic roughness that influence whether stranding occurs. Nor do they differentiate between the risks faced by fry versus smolts, which differ in mobility and habitat selection. Another limitation is the static nature of the risk curves. Stranding risk is not necessarily fixed across years, because it can be influenced by antecedent flow patterns, sediment deposition, riparian vegetation encroachment, and changing fish distributions.
Floodplain Inundation and Habitat Models
Floodplain inundation and rearing habitat models estimate how variations in river discharge regulate access to off-channel habitats that support juvenile salmon growth and survival. These habitats offer increased foraging opportunities, thermal buffering, and predator refuge, and are particularly important for early life stages. Inundation models are used as tools to identify the timing, duration, and spatial extent of floodplain access under different flow scenarios. Modeling typically relies on HEC-RAS in combination with digital elevation models and hydrologic time series from CalSim2 or CalSim3 (USBR, 2024a). These models simulate the timing and extent of overbank flow and water surface elevations across various floodplain areas (e.g., Yolo and Sutter bypasses).
These models support scenario comparisons across water-year types, helping quantify the biological benefits of proposed spring flow pulses or increased baseflows. For example, model outputs are used to estimate the number of acres inundated during juvenile outmigration windows and the duration of access to productive habitats (Yarnell et al., 2012). This knowledge enables managers to evaluate the tradeoffs between flow magnitude and rearing opportunity, and to design pulse events that align with peak rearing periods or life stage transitions. Empirical validation is supported by remote sensing, aerial imagery, and field-deployed temperature and velocity loggers. Validation data are often limited in spatial and temporal coverage, however, and may not fully capture intra-annual variation in habitat accessibility or quality.
These models have substantive limitations. Most assume static topography and land cover, even though sediment deposition, vegetation encroachment, and infrastructure changes can alter floodplain hydrodynamics over time (Jeffres et al., 2008). Most models treat floodplain habitat as a binary (inundated or not), with limited ability to account for variation in food availability, predator pressure, or connectivity to mainstem channels. Moreover, most simulations do not dynamically model juvenile fish behavior, movement, or bioenergetics. Empirical evidence that floodplain benefits to juvenile salmon growth diminish when inundation is shorter or less extensive (Sommer et al., 2001) suggests that models may overestimate habitat value when access is intermittent or when thermal or predation conditions are suboptimal.
Despite their limitations, these models are a core component of seasonal flow planning and are especially important in wet and above-normal years when larger volumes of water are available for managed inundation. They are also used to support justification for spring pulse flows under habitat-based objectives in Endangered
Species Act (ESA) consultations and flow standard evaluations. Continued refinement of floodplain modeling is focused on coupling hydrodynamics with ecological response models that include growth, survival, or condition factors. There is also growing interest in integrating these models with temperature-dependent mortality or life-cycle models to improve cumulative impact assessment under different operational regimes.
REFERENCES
Anderson, J. 2004. Calculating Net Delta Outflow Using CALSIM II and DSM2: Methodology for Flow and Salinity Estimates in the Sacramento-San Joaquin Delta and Suisun Marsh. Sacramento, CA: California Department of Water Resources.
Anderson, M. L., Z. Q. Chen, M. L. Kavvas, and A. Feldman. 2002. “Coupling HEC-HMS with Atmospheric Models for Prediction of Watershed Runoff.” Journal of Hydrologic Engineering 7(4):312–318. https://doi.org/10.1061/(ASCE)1084-0699(2002)7:4(312).
Brush, C. F., E. C. Dogrul, and T. N. Kadir. 2013. Development and Calibration of the California Central Valley Groundwater-Surface Water Simulation model (C2VSim). Version 3.02-CG. Sacramento, CA: Bay-Delta Office, California Department of Water Resources.
CalSim3. 2022. California Simulation Model 3. https://water.ca.gov/Library/Modeling-and-Analysis/Central-Valley-models-and-tools/CalSim-3.
Castillo, G. C. 2019. “Modeling the Influence of Outflow and Community Structure on an Endangered Fish Population in the Upper San Francisco Estuary.” Water 11(6):1162. https://doi.org/10.3390/w11061162.
Casulli, V., and P. Zanolli. 2002. “Semi-Implicit Numerical Modelling of Non-Hydrostatic Free-Surface Flows for Environmental Problems.” Mathematical and Computer Modelling 36:1131–1149. https://doi.org/10.1016/S0895-7177(02)00264-9.
CDFW (California Department of Fish and Wildlife). 2014. Redd Dewatering and Juvenile Stranding in the Upper Sacramento River, 2013–2014. California Department of Fish and Wildlife, Red Bluff Fisheries Office, Red Bluff, California. RBFO Technical Report No. 01-2014. https://www.noaa.gov/sites/default/files/legacy/document/2020/Oct/07354626387.pdf.
CDWR-DSM2. 2019. “DSM2: Delta Simulation Model II.” Bay Delta Office, California Dept. of Water Resources, Sacramento, CA. https://water.ca.gov/Library/Modeling-and-Analysis/Bay-Delta-Region-models-and-tools/Delta-Simulation-Model-II.
Chen, E. K., N. A. Som, J. D. Deibner-Hanson, D. G. Anderson, and M. J. Henderson. 2023. “A Life Cycle Model for Evaluating Estuary Residency and Recovery Potential in Chinook Salmon.” Fisheries Research 257:106511. https://doi.org/10.1016/j.fishres.2022.106511.
Conrad, L., and J. Moffett. 2022. Collaborative Adaptive Management Team: Assessment of Reviews of Long-term Monitoring Programs and Objectives Final Summary Report for Task 1: Compile and Communicate Information from Past and Ongoing Reviews. Prepared for Delta Science Program of the Delta Stewardship Council for the Collaborative Adaptive Management Team. https://csamp.baydeltalive.com/docs/25921.
Cordoleani, F., W. H. Satterthwaite, M. E. Daniels, and M. R. Johnson. 2020. “Using Life-Cycle Models to Identify Monitoring Gaps for Central Valley Spring-Run Chinook Salmon.” San Francisco Estuary & Watershed Science 18(4). https://doi.org/10.15447/sfews.2020v18iss4art3.
Crozier, L. G., R. W. Zabel, and A. F. Hamlet. 2008. “Predicting Differential Effects of Climate Change at the Population Level with Life-Cycle Models of Spring Chinook Salmon.” Global Change Biology 14(2):236–249. https://doi.org/10.1111/j.1365-2486.2007.01497.x.
DISB (Delta Independent Science Board). 2022. Review of the Monitoring Enterprise of the Sacramento-San Joaquin Delta. https://deltacouncil.ca.gov/pdf/isb/products/2022-03-22-isb-monitoring-enterprise-review.pdf.
Draper, A. J., A. Munévar, S. Arora, et al. 2004. “CalSim: A Generalized Model for Reservoir System Analysis.” Journal of Water Resources and Planning and Management 130(6):480–489. https://doi.org/10.1061/(ASCE)0733-9496(2004)130:6(480).
Dudley, P. N., S. N. John, M. E. Daniels, and E. M. Danner. 2022. “Using Decades of Spawning Data and Hydraulic Models to Construct a Temperature-Dependent Resource Selection Function for Management of an Endangered Salmonid.” Canadian Journal of Fisheries and Aquatic Sciences 79(1):73–81. https://doi.org/10.1139/cjfas-2021-0022.
Egan, D. 2017. The Death and Life of the Great Lakes. New York: W.W. Norton and Co.
Gosselin, J. L., and W. N. Beer. 2024. Sacramento River Winter-run Chinook Salmon Redd Dewatering: A Note on Comparing Observed and Predicted. https://www.cbr.washington.edu/sacramento/fm/pdf/Note_on_Redd_Dewatering_Observed_v_Predicted.pdf.
Hendrix, N., A. Criss, E. Danner, et al. 2014. Life Cycle Modeling Framework for Sacramento River Winter-run Chinook Salmon. NOAA-TM-NMFS-SWFSC-530.
Hendrix, N., A. M. K. Osterback, E. Jennings, et al. 2019. “Model Description for the Sacramento River Winter-run Chinook Salmon Life Cycle Model.” NOAA NMFS. https://www.noaa.gov/sites/default/files/legacy/document/2020/Oct/0.7.115.5960-000001.pdf.
IEP Long-term Survey Review Team. 2021. Interagency Ecological Program Long-term Monitoring Element Review: Pilot Approach and Methods Development (2020). Interagency Ecological Program. Sacramento, CA. https://cadwr.app.box.com/s/5y13dz3wg04t5abkprvjfj9lmwz29a96.
Jayasundara, N., S Seneviratne, E. Reyes, and F. Chung. 2020. “Artificial Neural Network for Sacramento-San Joaquin Delta Flow-Salinity Relationship for CalSim 3.0.” Journal of Water Resources Planning and Management 146(4). https://doi.org/10.1061/(ASCE)WR.1943-5452.0001192.
Jeffres, C. A., J. J. Opperman, and P. B. Moyle. 2008. “Ephemeral Floodplain Habitats Provide Best Growth Conditions for Juvenile Chinook Salmon in a California River.” Environmental Biology of Fishes 83:449–458. https://doi.org/10.1007/s10641-008-9367-1.
Johnson, R. C., S. Windell, P. L. Brandes, et al. 2017. “Science Advancements Key to Increasing Management Value of Life Stage Monitoring Networks for Endangered Sacramento River Winter-Run Chinook Salmon in California.” San Francisco Estuary & Watershed Science 15(3). https://doi.org/10.15447/sfews.2017v15iss3art1.
Lindley, S. T., R. S. Schick, E. Mora, et al. 2007. “Framework for Assessing Viability of Threatened and Endangered Chinook Salmon and Steelhead in the Sacramento–San Joaquin Basin.” San Francisco Estuary and Watershed Science 5(1). https://doi.org/10.15447/sfews.2007v5iss1art4.
MacWilliams, M. L., E. S. Ateljevich, S. G. Monismith, and C. Enright. 2016. “An Overview of Multi-Dimensional Models of the Sacramento–San Joaquin Delta.” San Francisco Estuary & Watershed Science 14(4). http://dx.doi.org/10.15447/sfews.2016v14iss4art2.
Maunder, M. N., and R. B. Deriso. 2011. “A State–Space Multistage Life Cycle Model to Evaluate Population Impacts in the Presence of Density Dependence: Illustrated with Application to Delta Smelt (Hyposmesus Transpacificus).” Canadian Journal of Fisheries and Aquatic Sciences 68(7):1285–1306. https://doi.org/10.1139/f2011-071.
Namadi, P., M. He, and P. Sandhu. 2023. “Modeling Ion Constituents in the Sacramento-San Joaquin Delta Using Multiple Machine Learning Approaches.” Journal of Hydroinformatics 25(6):2541–2560. https://doi.org/10.2166/hydro.2023.158.
Nelitz, M., C. Semmens, N. Tamburello, J. Singh, and H. MacInnes. 2019. Monitoring Enterprise Review: Lessons and Methodology Report. Final report prepared by ESSA Technologies Ltd., CBEC eco engineering, and PAX Environmental, Inc. for the Delta Independent Science Board.
Nelitz, M., C. Semmens, G. Shellenbarger, et al. 2020a. Monitoring Enterprise Review: Monitoring Inventory Report. Final report prepared by ESSA Technologies Ltd., CBEC eco engineering, and PAX Environmental, Inc. for the Delta Independent Science Board.
Nelitz, M., C. Morton, N. Tamburello, et al. 2020b. Monitoring Enterprise Review: Comprehensive Synthesis Report. Final report prepared by ESSA Technologies Ltd., CBEC eco engineering, and PAX Environmental, Inc. for the Delta Independent Science Board.
Newman, K. B. 2003. “Modelling Paired Release-Recovery Data in the Presence of Survival and Capture Heterogeneity with Application to Marked Juvenile Salmon.” Statistical Modelling 3:157–177. https://doi.org/10.1191/1471082X03st055oa.
Polansky, L., K. B. Newman, and L. Mitchell. 2021. “Improving Inference for Nonlinear State-Space Models of Animal Population Dynamics Given Biased Sequential Life Stage Data.” Biometrics 77(1):352–361. https://doi.org/10.1111/biom.13267.
Qi, S., Z. Bai, Z. Ding, et al. 2021. “Enhanced Artificial Neural Networks for Salinity Estimation and Forecasting in the Sacramento San Joaquin Delta of California.” Journal of Water Resources Planning and Management 147(10):04021069. https://doi.org/10.1061/(ASCE)WR.1943-5452.0001445.
Qi, S., M. He, Z. Bai, et al. 2022. “Novel Salinity Modeling Using Deep Learning for the Sacramento–San Joaquin Delta of California.” Water 14(22):3628. https://doi.org/10.3390/w14223628.
Rose, K., H. Jager, N. Monsen, Z. Bai, and E. Howe. 2024. Peer Review of the Fish and Aquatic Effects Analysis for the Long-Term Operations of the Central Valley Project and State Water Project. A report to the Delta Science Program. DSP.
Rose, K. A., W. J. Kimmerer, K. P. Edwards, and W. A. Bennett. 2013a. “Individual-Based Modeling of Delta Smelt Population Dynamics in the Upper San Francisco Estuary: I. Model Description and Baseline Results.” Transactions of the American Fisheries Society 142(5):1238–1259. https://doi.org/10.1080/00028487.2013.799518.
Rose, K. A., W. J. Kimmerer, K. P. Edwards, and W. A. Bennett. 2013b. “Individual-Based Modeling of Delta Smelt Population Dynamics in the Upper San Francisco Estuary: II. Alternative Baselines and Good Versus Bad Years.” Transactions of the American Fisheries Society 142(5):1260–1272. https://doi.org/10.1080/00028487.2013.799519.
Sandhu, N., D. Wilson, R. Finch, and F. Chung. 1999. Modeling Flow-Salinity Relationships in the Sacramento-San Joaquin Delta Using Artificial Neural Networks. Technical Information Record OSP-99-1. California Department of Water Resources. Sacramento, CA.
Sommer, T. R., M. L. Nobriga, W. C. Harrell, W. Batham, and W. J. Kimmerer. 2001. “Floodplain Rearing of Juvenile Chinook Salmon: Evidence of Enhanced Growth and Survival.” Canadian Journal of Fisheries and Aquatic Sciences 58:325–333.
Sridharan, V. K., S. G. Monismith, O. B. Fringer, and D. A. Fong. 2018. “Evaluation of the Delta Simulation Model-2 in Computing Tidally Driven Flows in the Sacramento-San Joaquin Delta.” San Francisco Estuary & Watershed Science 16(2). https://doi.org/10.15447/sfews.2018v16iss2art6.
USBR (U.S. Bureau of Reclamation). 2024a. Final Environmental Impact Statement. Long-Term Operations of the Central Valley Project and State Water Project – Biological Assessment Appendix F – Modeling Part 1. https://www.usbr.gov/mp/nepa/includes/documentShow.php?Doc_ID=55394.
USBR. 2024b. Final Environmental Impact Statement. Long-Term Operations of the Central Valley Project and State Water Project – Biological Assessment Appendix AB-L: Shasta Coldwater Pool Management. https://www.usbr.gov/mp/nepa/includes/documentShow.php?Doc_ID=55318.
USBR. 2024c. Final Environmental Impact Statement. Long-Term Operations of the Central Valley Project and State Water Project – Biological Assessment. Appendix AB- I: Old and Middle River Flow Management. https://www.usbr.gov/mp/nepa/includes/documentShow.php?Doc_ID=55321.
U.S. Fish and Wildlife Service (USFWS). 2006. Relationships Between Flow Fluctuations and Redd Dewatering and Juvenile Stranding for Chinook Salmon and Steelhead in the Sacramento River Between Keswick Dam and Battle Creek. U.S. Fish and Wildlife Service, Sacramento Fish and Wildlife Office, Sacramento, California. https://www.noaa.gov/sites/default/files/legacy/document/2020/Oct/07354626849.pdf.
Wang, Z., F. Chai, R. Dugdale, et al. 2020. “The Interannual Variabilities of Chlorophyll and Nutrients in San Francisco Bay: A Modeling Study.” Ocean Dynamics 70:1169–1186. https://doi.org/10.1007/s10236-020-01386-0.
Wilbur, R., and A. Munevar. 2001. “Chapter 7: Integration of CALSIM and Artificial Neural Networks Models for Sacramento-San Joaquin Delta Flow-Salinity Relationships.” Methodology for Flow and Salinity Estimates in the Sacramento-San Joaquin Delta and Suisun Marsh. 22nd Annual Progress Report to the State Water Resources Control Board. California Department of Water Resources, Sacramento, California.
Windell, S., P. L. Brandes, J. L. Conrad, et al. 2017. Scientific Framework for Assessing Factors Influencing Endangered Sacramento River Winter-Run Chinook Salmon (Oncorhynchus Tshawytscha) Across the Life Cycle. NOAA-TM-NMFS-SWFSC-586. https://repository.library.noaa.gov/view/noaa/15458.
Yarnell, S., A. J. Lind, and J. F. Mount. 2012. “Dynamic Flow Modelling of Riverine Amphibian Habitat with Application to Regulated Flow Management.” River Research and Applications 28(2):177–191. https://doi.org/10.1002/rra.1447.
Zeug, S. C., P. S. Bergman, B. J. Cavallo, and K. S. Jones. 2012. “Application of a Life Cycle Simulation Model to Evaluate Impacts of Water Management and Conservation Actions on an Endangered Population of Chinook Salmon.” Environmental Modeling & Assessment 17(5):455–467. https://doi.org/10.1007/s10666-012-9306-6.


