Reference Manual on Scientific Evidence: Fourth Edition (2025)
Chapter: Reference Guide on Climate Science
Reference Guide on Climate Science*
JESSICA WENTZ AND RADLEY HORTON
Jessica Wentz, LL.M., is a Non-Resident Senior Fellow at the Sabin Center for Climate Change Law, Columbia Law School.
Radley Horton, Ph.D., is a Professor at the Columbia Climate School, Columbia University.
CONTENTS
Foundational Components of Climate Science
The greenhouse effect and radiative forcing
Atmospheric and ocean circulation and the hydrological cycle
Feedback loops, tipping points, and cascading impacts in the climate system
Statistical Techniques and Climate Models
Managing and Communicating Uncertainty
Scientific and Consensus Reports
Climate Change Detection, Attribution, and Projections
General Methods and Parameters
Attribution to anthropogenic climate change
Challenges associated with downscaling and exogenous variables
Climate Change Detection and Attribution
*Following the December 31, 2025, publication of the Fourth Edition of Reference Manual on Scientific Evidence, on February 6, 2026, the Federal Judicial Center decided to omit the climate science chapter from their website.
Extreme Event Detection and Attribution
Impact Detection and Attribution
Projections of Future Climate Change
How Climate Science Factors into Litigation
Overview of Climate Litigation
Legal Applications of Climate Science
Legal Obligations and Authorities
Select References on Climate Science
Select References on Climate Science and the Law
World Meteorological Organization (WMO)
Intergovernmental Panel on Climate Change (IPCC)
Other Major Scientific Organizations
FIGURES
1. Changes in global surface temperature relative to 1850–1900
Introduction
Climate science examines the structure and dynamics of the Earth’s climate system and how that system is influenced by human and natural processes.1 The climate system consists of five interacting systems: the atmosphere, hydrosphere, cryosphere, lithosphere, and biosphere.2 Thus, climate science spans multiple disciplines, including atmospheric science, physical geography, and oceanography. It also encompasses research on the interactions between the global climate system and other natural and human systems, which implicates fields such as biology, economics, and social sciences. Owing to the complexity and pervasiveness of the climate system, it is difficult to establish precise boundaries for this field—but for the purposes of this reference guide, we focus on the physical science aspects of climate science.3
Climate scientists use observational data, physical understanding, statistical analysis, and climate models to understand and characterize the complex interactions among different components of the climate system. One key focus of this research is to understand the mechanisms of observed climate change and to characterize how humans are affecting the global climate system through greenhouse gas (GHG) emissions and other climate forcing factors.4 The Intergovernmental Panel on Climate Change (IPCC), an intergovernmental organization tasked with assessing scientific knowledge about climate change, is generally viewed as the leading scientific authority in this field.5 The IPCC periodically publishes assessment reports synthesizing the latest research on climate change. The IPCC’s Sixth Assessment Report (AR6) found that: “[i]t is unequivocal that human influence has warmed the atmosphere, ocean and land,” and this has caused “[w]idespread changes in the atmosphere, ocean, cryosphere, and
1. For a more detailed definition, see Climate Science, in Stanford Encyclopedia of Philosophy (May 11, 2018), https://perma.cc/SCN3-5Y4M.
2. “Climate” describes weather conditions averaged over a period of time, typically decades or more. The atmosphere is the gaseous envelope surrounding the Earth; the hydrosphere refers to the components of the earth system composed of water; the cryosphere refers to the components of the earth system composed of ice; the lithosphere is the rocky outer portion of the Earth; and the biosphere refers to all life on Earth. Please refer to the glossary for more detailed definitions of these and other technical terms used in this chapter.
3. Although our focus is on physical climate science, it is necessary to discuss the interactions between physical climate science and other fields when discussing certain areas of the science. See, e.g., sections titled “Impact Detection and Attribution” and “Source Attribution” below.
4. A climate forcing factor is any substance, activity, or event that affects the flow of energy coming into or out of the global climate system, thus affecting the amount of heat retained within the system. Anthropogenic climate forcers include GHGs, aerosols, and changes in land use that make land reflect more or less solar energy. There are also natural climate forcers, such as solar radiation and the particulate matter from volcanic eruptions.
5. For more information about the IPCC and its assessment methodology, see section titled “Scientific and Consensus Reports” and Appendix below.
biosphere.”6 The global warming attributable to human activities is unprecedented in the last 2,000 years7 and “is already affecting every inhabited region across the globe, with human influence contributing to many observed changes in weather and climate extremes.”8
The increasing effect of anthropogenic climate change has contributed to growth in climate-change-related litigation in the United States and other jurisdictions. Much of this litigation seeks to establish legal obligations on the part of governments to control GHG emissions, prepare for the effects of climate change, and disclose climate-change-related risks in government documents; some litigation seeks the opposite. There are several ways in which climate science may factor into the resolution of climate-related lawsuits. First, climate science can be used to assess causation—for example, whether and to what extent an actor has caused or contributed to climate-change-related risks or injuries. Second, climate science can be used to assess whether climate-related impacts or risks are foreseeable, which is potentially relevant to determining whether a defendant is required or authorized to take some action in response to climate change. Third, climate science can be used to determine the scope of a defendant’s legal obligations and authorities—for example, whether the defendant has an obligation to reduce GHG emissions or take measures to prepare for the impacts of climate change.
The purpose of this reference guide is to help judges evaluate the admissibility and weight of expert testimony and documentary evidence involving climate science.
The second part of this reference guide, “Foundational Components of Climate Science,” describes the data and methodologies used in climate research, the scientific disciplines that constitute this field, the types of qualifications held by experts in this field, and the primary sources of climate research.
The third part of this reference guide, “Climate Change Detection, Attribution, and Projections,” provides a more in-depth discussion of research on anthropogenic climate change. It describes research methodologies and the status of scientific knowledge across three disciplines: (1) climate change detection and attribution research, which examines whether observed changes in natural and human systems can be attributed to human influence on climate; (2) source attribution research, which examines the relative contributions of different entities to
6. IPCC, Climate Change 2021: The Physical Science Basis, Contribution of Working Group I to the Sixth Assessment Report of the IPCC (Valérie Masson-Delmotte et al. eds.) [hereinafter IPCC AR6 WGI], https://perma.cc/D93G-EPRC. Other scientific bodies have also found unequivocal evidence of anthropogenic climate change. See National Academy of Sciences, Climate Change: Evidence and Causes: Update 2020 [hereinafter NAS Update], https://perma.cc/9XTW-S7DA; U.S. Global Change Research Program, Fourth National Climate Assessment, Vol. 1, Climate Science Special Report (Donald J. Wuebbles et al. eds., 2017) [hereinafter NCA4 Vol. I], https://perma.cc/EQ2X-AMEP.
7. IPCC AR6 WGI, supra note 6.
8. Id. at 10.
anthropogenic climate change; and (3) predictive research, which provides insights on future climate change and its impacts under different emissions trajectories and warming scenarios.
The last part of this reference guide, “How Climate Science Factors into Litigation,” discusses the role of climate science in litigation. It provides a brief overview of the types of legal claims that implicate climate science, focusing on federal claims, and describes how different areas of climate research may factor into judicial assessments of causation, foreseeability, and legal obligations and authorities. There are various contexts where judges may confront genuine scientific questions and areas of uncertainty in this field—for example, when tasked with determining whether a specific plaintiff’s injuries were caused by climate change, and whether and to what extent a defendant contributed to those injuries. This reference guide seeks to provide the scientific context necessary for answering such questions, while also recognizing the normative and legal considerations that will factor into this type of analysis.
Foundational Components of Climate Science
Scope of Research
The Earth’s climate system is enormous and complex, consisting of many nested and interlinked subsystems, including the atmosphere, hydrosphere, cryosphere, lithosphere, and biosphere. The interactions between these components produce the conditions known as “climate”—i.e., weather conditions averaged over a period of time, typically decades or longer. Although the climate system is global, climate is typically characterized in reference to a particular region or locale as a result of spatial variations in climatological conditions.
Climate science is the field of study aimed at characterizing the climate system and understanding the physical processes and parameters that ultimately determine climate conditions. Owing to the breadth and complexity of the climate system, climate research spans many different scientific disciplines. For example, research on the physical science of climate and climate change (i.e., understanding of the physical properties of the climate system and how it is changing) encompasses: (1) mathematics and statistics; (2) basic sciences, e.g., physics and chemistry; (3) earth sciences, e.g., atmospheric sciences, climatology, physical geography, oceanography, meteorology, hydrology, biogeochemistry, and cryospheric sciences; and (4) computer sciences and data analysis. Most climate research involves collaboration across these different fields.
Climate science also encompasses research on the interactions between the climate and other natural and human systems, with a significant body of work
aimed at characterizing the effects of climate change on people, infrastructure, and ecosystems. Research on climate change impacts implicates both physical climate science (including the subfields noted above) and other disciplines, such as (1) biological and ecological sciences; (2) social sciences and economics; (3) epidemiology, population health, and health impact research; (4) fire dynamics; and (5) engineering and other fields relevant to assessing impacts to transportation, energy, and other infrastructure systems. Although studies on climate impacts vary considerably in terms of their focus (i.e., the impact(s) being studied), these studies typically utilize common methodologies, datasets, and models, as discussed below.
Core Concepts and Methods
The foundational components of climate science are:
- Physical understanding of the climate system, i.e., understanding of the physical properties of the climate, including the different component systems and interactions between those systems, as well as the effect of exogenous variables on the system.
- Climate datasets, which include direct observations of climate variables, paleoclimate reconstructions, and reanalysis datasets.
- Statistical techniques and climate models, which are used to evaluate patterns, trends, causal relationships, variability, and uncertainty within the climate system, and to develop projections of future climate change.
These components are interconnected and mutually reinforcing—for example, physical understanding of the climate system is based on observations and statistical analysis, and climate models incorporate a combination of physical understanding, observational evidence, and statistical techniques in order to derive insights on how changes in a particular input to the climate system can affect other variables within the system. The sections below provide more detailed explanations of each component and its role in climate research.
Physical Understanding
In the early 1800s, physicists and other scientists began conducting experiments and developing theories to explain the physical mechanisms behind global and regional climate conditions. It was hypothesized that the Earth had undergone significant climate changes in the past based on observations of the natural
world, but the mechanism behind these changes had yet to be discovered.9 In the 1820s, the physicist Joseph Fourier developed an early theory of what would eventually be recognized as the “greenhouse effect.” Fourier had calculated that an object that is the same size as the Earth and same distance from the sun would be considerably colder than the Earth if it were heated by incoming solar radiation alone. Fourier hypothesized that the Earth’s atmosphere trapped incoming solar radiation in the form of heat, thus causing the planet to be warmer than would otherwise be the case.10 Several decades later, scientists such as Eunice Foote and John Tyndall recognized that atmospheric gases, particularly carbon dioxide (CO2) and water vapor, may be responsible for this warming effect. They correctly hypothesized that these gases absorbed incoming solar radiation—preventing it from being re-emitted to space—thus increasing the energy and heat content of the Earth’s atmosphere. These scientists were also able to demonstrate and measure the greenhouse effect of CO2 through lab experiments in the 1850s and 1860s.11 Subsequently, in the late nineteenth century, the Swedish chemist Svante Arrhenius hypothesized that human-caused GHG emissions from fossil fuel use and other combustion sources were large enough to cause global warming.12
Since those early experiments, scientific knowledge of the climate has advanced significantly. IPCC AR6 found that physical understanding of the fundamental features of the climate system is “robust and well established,”13 and scientists can explain many of the core processes that determine climate conditions. Some areas of physical understanding that are integral to climate research include: (1) the greenhouse effect and radiative forcing; (2) the carbon cycle and other biogeochemical cycles that govern the movement of chemical elements among different parts of the climate system and connected systems; (3) the mechanisms of atmospheric and ocean circulation and their relationship to the hydrological cycle; (4) the role of feedback loops, tipping points, and cascading impacts in the climate system; and (5) natural variability in the system.
9. For example, in the early 1800s, Jean-Pierre Perraudin hypothesized that glaciers might be responsible for giant boulders seen in alpine valleys, and Luis Agassiz subsequently hypothesized that glaciers had covered much of Europe and North America during what he referred to as an “Ice Age.” See E. P. Evans, The Authorship of the Glacial Theory, 145 N. Am. Rev. 94 (1887), https://perma.cc/Y9AG-4P9P.
10. Thomas R. Anderson et al., CO2, The Greenhouse Effect and Global Warming: From the Pioneering Work of Arrhenius and Callendar to Today’s Earth System Models, 40 Endeavour 178 (2016), https://doi.org/10.1016/j.endeavour.2016.07.002.
11. W.F. Barrett, Contributions to Molecular Physics in the Domain of Radiant Heat, 7 Nature 66 (1872), https://doi.org/10.1038/007066a0; Eunice N. Foote, Circumstances Affecting the Heat of the Sun’s Rays, 22 Am. J. of Sci. & Arts 382 (1856), https://perma.cc/X6F9-UVT6.
12. Svante Arrhenius, On the Influence of Carbonic Acid in the Air upon the Temperature of the Ground, 41 London, Edinburgh, & Dublin Phil. Mag. & J. Sci. 237 (1896), https://perma.cc/MV2A-UCJT.
13. IPCC AR6 WGI, supra note 6, at 44, 150.
The greenhouse effect and radiative forcing
The greenhouse effect plays a fundamental role in shaping climate conditions, as it ultimately determines the amount of incoming solar energy that is retained within the system. The heat-trapping properties of GHGs are now well understood and can be quantified over different time horizons. Water vapor is the most abundant naturally occurring GHG in the atmosphere and is responsible for approximately half of the Earth’s natural greenhouse effect. Other common GHGs in the atmosphere include CO2, methane (CH4), nitrous oxide (N2O), fluorinated gases, chlorofluorocarbons (CFCs), and hydrochlorofluorocarbons (HCFCs). As discussed in the second part of this reference guide, “Climate Change Detection, Attribution, and Projections,” large increases in GHG concentrations due to fossil fuel emissions and other human activities are the dominant cause of observed global warming and climate change.14
The effects of anthropogenic GHG emissions on the atmosphere are an example of radiative forcing—a change in the energy flux within the Earth’s atmosphere. Positive radiative forcing occurs when the Earth receives more incoming energy from sunlight than it radiates into space, and this net gain of energy causes warming. There are a number of natural processes that can affect net radiative forcing—these include changes in the percentage of incoming solar radiation absorbed by the Earth, volcanic activity, orbital cycles, and changes in global biogeochemical cycles (discussed below). There are also other human drivers that can affect atmospheric energy flux—for example, land use changes can have positive or negative effects on radiative forcing, and aerosol emissions have negative radiative forcing and thus contribute to cooling of the climate system.
Scientists have been systematically studying the interactions between both human and natural forcing since the early 20th century.15 Although the heat-trapping properties of specific substances are fairly well understood, there is still some uncertainty about the effect of certain processes (e.g., land use changes) on climate forcing, as well as the relative contributions of different forcing agents to observed climate changes, especially at regional scales. Nonetheless, physical understanding of radiative forcing associated with GHGs is sufficiently robust to
14. Observations have demonstrated that atmospheric moisture content (water vapor) is increasing along with other GHGs, and this amplifies the greenhouse effect. However, the increase in atmospheric moisture content is directly attributable to human-induced global warming (from GHG emissions). In other words: increased water vapor is a consequence of anthropogenic climate forcing; it is not an indicator of “natural” climate change. Were these other GHG concentrations to somehow drop to pre-industrial levels, water vapor would almost instantaneously return to preindustrial levels as well. See B.D. Santer et al., Identification of Human-Induced Changes in Atmospheric Moisture Content, 104 Proc. Nat’l Acads. Scis. [hereinafter PNAS] 15248 (2007), https://doi.org/10.1073/pnas.0702872104.
15. IPCC AR6 WGI, supra note 6, at 150.
support assessments and projections of global warming. For example, each additional increment of CO2 added over the past century and projected to be added for the coming decades is expected to yield a comparable change in direct radiative forcing. Furthermore, past projections of global temperature change in response to radiative forcing have been broadly consistent with subsequent observations.16
Biogeochemical cycles
Biogeochemical cycles govern the transfer of chemicals among different components of the climate system and other earth systems. Some of the cycles that are integral to the study of climate include the carbon cycle, nitrogen cycle, water cycle, and phosphorus cycle. Here we focus on the carbon cycle owing to the dominant role of CO2 in global climate change. The water (or hydrological) cycle is also integral to the study of climate, as discussed in various contexts below.
The carbon cycle describes how carbon moves between the atmosphere, hydrosphere, biosphere, cryosphere, and lithosphere.17 Most of the carbon on the planet is stored in the lithosphere, primarily in sedimentary rock deposits, and a small fraction stored in fossil fuels. Carbon is also stored in the atmosphere (as CO2),18 in the oceans (as dissolved atmospheric carbon and in carbonate sediments), and in the biosphere (as organic molecules in organisms and soil). Oceans and terrestrial systems are generally characterized as “sinks” or “reservoirs” of carbon because, at today’s high atmospheric concentrations of CO2, they typically absorb more carbon than they release into the atmosphere.
The primary pathways through which carbon is released into the atmosphere include human combustion of fossil fuels, industrial processes, wildfires, volcanic eruptions, biological respiration, and decomposition of organic matter. Once CO2 enters the atmosphere, it can remain there for a very long time—potentially thousands of years or more—but there is significant variation in the atmospheric lifetime of individual CO2 molecules.19 A large proportion (20–30%) of the CO2 that enters the atmosphere is absorbed by the oceans, where it dissolves into seawater and forms carbonic acid (resulting in ocean acidification). The initial process of ocean absorption can occur within a relatively short time frame (e.g., within five years), but much of that carbon is circulated back into the
16. Id. at 150.
17. For a more detailed overview of the carbon cycle and how it is influenced by human activities, see U.S. Global Change Research Program, Second State of the Carbon Cycle Report, (N. Cavallaro et al. eds., 2018), https://perma.cc/KT2H-GTUK.
18. Atmospheric carbon also comes from methane (CH4), which is converted into CO2 as it combines with oxygen.
19. Because of variation, the IPCC does not recognize a specific lifetime for CO2 molecules. See IPCC AR6 WGI, supra note 6, at 302.
atmosphere on a short time frame as well (e.g., within ten years or less).20 Thus, carbon is constantly cycling between the oceans and atmosphere.
Carbon is also constantly cycling between the atmosphere and biological systems on land (i.e., forests, grasslands, and other ecosystems). The amount of carbon stored in the terrestrial sinks is largely based on the carbon uptake of vegetation through photosynthesis, with large interannual variability due to natural changes in vegetation as well as human land uses. There are some instances in which terrestrial sinks may become carbon sources—specifically, when the amount of carbon that is released is greater than the amount of carbon that is absorbed. This may occur, for example, as a consequence of wildfires or ecosystem degradation.21
Human activities, including land use changes and the burning of fossil fuels, have disturbed the natural carbon cycle, releasing more than two trillion metric tons of CO2 and methane (CH4) into the atmosphere since the onset of the industrial revolution. A portion of those emissions remains in the atmosphere; the remainder is absorbed by ocean and terrestrial sinks. The “airborne” fraction of anthropogenic carbon emissions has remained constant at approximately 44% over the past six decades,22 but the capacity of ocean and terrestrial sinks to absorb carbon is expected to decline as the CO2 concentrations increase.23
Atmospheric and ocean circulation and the hydrological cycle
The movement of air, water, and heat in the climate system plays an integral role in shaping regional climate conditions, including regional temperature, precipitation, humidity, and aridity, as well as extreme weather events. In particular, regional climate is influenced by atmospheric circulation (the large-scale movement of air and heat in the atmosphere), ocean circulation (the large-scale movement of water in oceans), and the hydrological cycle (the circulation of water between different earth systems), in addition to other factors.24 Understanding
20. Mason Inman, Carbon Is Forever, 1 Nature Climate Change 156 (2008), https://doi.org/10.1038/climate.2008.122.
21. See, e.g., Sirui Wang et al., Potential Shift From a Carbon Sink to a Source in Amazonian Peat-lands Under a Changing Climate, 115 PNAS 12407 (2018), https://doi.org/10.1073/pnas.1801317115.
22. IPCC AR6 WG1, supra note 6, at 676.
23. Id. at 677.
24. Some of the other factors that shape regional climate include the amount of sunlight the area receives (which depends, in large part, on latitude); altitude, topographical features, and the shape of the land (i.e., “relief”); and proximity to oceans and large water bodies.
the mechanisms and relationships between these large-scale processes is key to understanding the climate system and climate change.25
These circulatory processes are governed by thermodynamics as well as other physical processes (e.g., gravity, surface friction, planetary rotation).26 Thermodynamic processes are those that involve the exchange of heat, work, temperature, and energy. There is strong theoretical understanding of how thermodynamics influence certain aspects of the climate system, which contributes to high confidence findings for certain trends and impacts, particularly those that are directly attributable to temperature changes.27 Radiative forcing is an example of a thermodynamic process that is well understood. Dynamic processes are those that deal with the movement of bodies in response to physical forces (e.g., the physical transport of air masses of a given temperature and moisture content).28 As noted by Screen et al. (2018), the dynamic manifestations of climate change are not as well understood as thermodynamic aspects, but they are strongly constrained by well-understood principles, especially the conservation of energy and mass, and the knowledge gap is narrowing as a result of recent research unpacking the causal mechanisms behind observed changes in circulation patterns.29 More limited understanding of dynamic processes contributes to uncertainty about certain aspects of climate and climate change, including uncertainties about the relationships between increasing GHG concentrations, changes in hydrological and cryospheric processes, and changes in clouds.30
Feedback loops, tipping points, and cascading impacts in the climate system
Understanding the climate system and anthropogenic influence on that system requires understanding of feedback loops, cascading impacts, and tipping points. Feedback loops are causal processes that occur when outputs of a system are routed back as inputs, resulting in acceleration of a process or change (positive
25. Coupled models have been developed to simulate the interactions between atmospheric and ocean circulation and other components of the climate system. See section titled “Statistical Techniques and Climate Models” below.
26. The hydrological cycle is also influenced by chemical and biological interactions, which is why it is characterized as a biogeochemical process.
27. IPCC AR6 WGI, supra note 6, at 430.
28. The term “dynamic” is also used in climate science to describe systems that are characterized by change and complexity. Here, we specifically refer to dynamics as a subdivision of physical mechanics.
29. J.A. Screen et al., Polar Climate Change as Manifest in Atmospheric Circulation, 4 Current Climate Change Reps. 383 (2018), https://doi.org/10.1007/s40641-018-0111-4.
30. See, e.g., Eilat Elbaum et al., Uncertainty in Projected Changes in Precipitation Minus Evaporation: Dominant Role of Dynamic Circulation Changes and Weak Role for Thermodynamic Changes, 49 Geophysical Rsch. Letters e2022GL097725 (2022), https://doi.org/10.1029/2022GL097725.
feedback) or deceleration (negative feedback).31 One key example of a feedback loop in the climate system is water-vapor feedback: warmer temperatures increase water vapor in the atmosphere, and the water vapor, which is a GHG, traps additional heat. Researchers believe that this may play an important role in current and future warming trends.32 Another important feedback loop is the ice-albedo feedback loop, whereby warmer temperatures result in the melting of ice caps, glaciers, and sea ice (all of which have high albedo, i.e., they reflect more sunlight back to space), thus decreasing the albedo of land and ocean surfaces, and accelerating the warming process.
The term “tipping point” describes a threshold that, when surpassed, will result in large and typically irreversible changes.33 Tipping points are common throughout the climate system as well as other systems that are affected by climate change. Key examples of important tipping points within the climate system are the temperature at which the melting of the Greenland ice sheet becomes irreversible (a process that would ultimately trigger meters of sea-level rise as well as changes in atmospheric and ocean dynamics), the collapse of Arctic winter sea ice, the dieback of the Amazon rainforest, the irreversible loss of mountain glaciers, and the collapse of boreal permafrost. Generally speaking, the existence of tipping points is known with much higher confidence than the temperature thresholds at which they will occur. Some critical tipping point thresholds may have already been surpassed, although the full effects have not yet manifested because of time lags and/or incomplete understanding.34 This highlights an important aspect of tipping points: critical thresholds can be “locked in” before the actual event occurs (e.g., the near complete melting of the Greenland ice sheet may already be inevitable because of existing warming).35 Although much is unknown about the timing and potential consequences of climate tipping points, there are significant risks associated with surpassing these thresholds, since consequences can be so large.36
Cascading impacts are a related concept. These can be conceptualized as a series of impacts that occur together due to interdependencies within a
31. Dennis L. Hartmann, Climate Sensitivity and Feedback Mechanisms, in Global Physical Climatology (2d ed. 2016).
32. A.E. Dessler et al., Stratospheric Water Vapor Feedback, 110 PNAS 18087 (2013), https://doi.org/10.1073/pnas.1310344110.
33. The IPCC defines a tipping point as a “critical threshold beyond which a system reorganizes, often abruptly and/or irreversibly.” IPCC AR6 WG1, supra note 6, at 95.
34. David I. Armstrong McKay et al., Exceeding 1.5° Global Warming Could Trigger Multiple Climate Tipping Points, 377 Sci. 1171 (2022), https://doi.org/10.1126/science.abn7950.
35. Niklas Boers & Martin Rypdal, Critical Slowing Down Suggests that the Western Greenland Ice Sheet Is Close to a Tipping Point, 118 PNAS e2024192118 (2021), https://doi.org/10.1073/pnas.2024192118 (finding that the Greenland ice sheet melt tipping point is between 0.8°C and 3.2°C of warming above pre-industrial levels).
36. Timothy M. Lenton et al., Climate Tipping Points—Too Risky to Bet Against, 575 Nature 592 (2019), https://doi.org/10.1038/d41586-019-03595-0.
system, flowing out to other domains, and potentially amplifying risks and hazards.37 Cascading impacts can occur as a result of feedback loops and surpassing tipping points. Cascading impacts are a particular concern when evaluating the effects of climate change on human and natural systems. For example, changes in bioclimatic conditions caused by global warming can result in a cascade of ecosystem alterations (e.g., extinctions leading to alterations in food webs that have cascading effects on other species, potentially even triggering further extinctions).
Natural variability
Natural variability in the climate system refers to those variations in climate that are caused by events and processes of nonhuman origin, in conjunction with the chaotic nature of the system. It includes variability that is internally generated within the system, like the El Niño Southern Oscillation (ENSO),38 as well as variability driven by natural external factors, such as variations in solar activity and volcanic eruptions. Natural variability can play a prominent role in explaining variations in global climate over certain time spans (years, months, days). Put another way, the chaotic nature of the climate system—whereby small differences in initial conditions can ultimately “excite” different patterns of internal variability at different points in time leading to large differences in climate states—means that even in the presence of anthropogenic forcing, a broad range of temperature trends ranging from positive to negative can be experienced in models—and presumably observations as well if we had more than one sample to draw from—on a timescale of years at the global scale, and decades at the regional scale. However, the influence of natural variability tends to be small when evaluating recent large-scale trends over periods of multiple decades or longer.39 Understanding natural variability is important for climate change attribution and projections, insofar as it is necessary to ascertain whether an observed trend, impact, or event is a consequence of anthropogenic forcing rather than natural variability within the system. Some patterns of natural variability, like ENSO, may themselves be impacted by anthropogenic warming in ways that are not yet completely understood.
Although there is still some uncertainty about the physical drivers of natural climate variability, researchers have developed techniques for reproducing many aspects of variability in climate models based on increasing physical
37. See Judy Lawrence et al., Cascading Climate Change Impacts and Implications, 29 Climate Risk Mgmt. 1000234 (2020), https://doi.org/10.1016/j.crm.2020.100234.
38. ENSO is an interaction between the tropical Pacific atmosphere and ocean that produces roughly year-long global impacts approximately every five to seven years.
39. See IPCC AR6 WGI, supra note 6, at ch. 3.
understanding of the climate system.40 The effects of natural variability are sometimes quantified using a signal-to-noise ratio, which compares the strength of an anthropogenic climate change signal against natural variability noise. The challenge of distinguishing the anthropogenic signal is more pronounced in regional climate assessments because natural variability plays a larger role in shaping regional (in contrast to global) climates (i.e., there is a larger signal-to-noise ratio at global scales, where some variability tends to cancel out). There can also be additional sources of internal variability at even finer scales, such as variations in ocean current location that can impact weather and climate at the scale of a nearby coastal city, for example. The accuracy with which scientists can distinguish anthropogenic signals from natural variability noise also depends on the type of impact being studied, and the temporal boundaries of the study.
Climate Datasets
In order to study climate and climate change, scientists need to be able to characterize past and present climate conditions across different geographic and temporal scales. They rely on climate datasets that provide quantitative information for various climate variables (e.g., sea surface temperature) over a given period. These datasets serve multiple purposes: they are used to develop and assess physical understanding of the climate system, to establish a baseline for evaluating changes in the climate system, and to develop, refine, and calibrate climate models.
Observational data are data that can be observed and measured. Much of the observational data used in climate research comes from instrumental records of climate variables. Examples include ground measurements of CO2 concentrations, surface temperatures, and sea levels; satellite measurements of sea surface temperature, water vapor, precipitation, and sea ice; and aircraft measurements of cyclone wind speed.41 The first quasi-global instrumental datasets for land and sea surface temperature can be traced back to the mid-1800s (when national
40. See, e.g., Feng Zhu et al., Climate Models Can Correctly Simulate the Continuum of Global-Average Temperature Variability, 116 PNAS 8728 (2019), https://doi.org/10.1073/pnas.180995911.
41. Instrumental records are sometimes described as “direct” measurements of climate variables, but the directness of the measurement depends on the instrument being used. For example, surface thermometers provide relatively direct measurements of temperatures, whereas satellite microwave sensors record microwave emissions from which scientists can derive measurements of climate variables such as temperature and columnar water vapor. It is also important to keep in mind that instrumental records are not perfect—they may be subject to errors (e.g., calibration errors, sources of systematic error in the instrument, or interpretation techniques). However, scientists use calibration, validation, and verification techniques, often involving cross-comparison between different datasets, to ensure the accuracy of instrumental records.
and colonial weather services built networks of surface stations and began maintaining standardized weather logs).42 Since then, the instrumental record has grown significantly as a result of the expansion of ground measurement stations, as well as the advent of satellite remote sensing of climate variables in the 1980s. The instrumental record of current climate variables is now fairly comprehensive, but there are still spatial and temporal gaps in the instrumental record, particularly with regard to historical climate conditions and sea-level rise.
Paleoclimate reconstructions are used to evaluate climate conditions in periods prior to instrumental records. Paleoclimate research uses geological and biological evidence to reconstruct historical climate conditions for which direct measurements are not available. Paleoclimate researchers can obtain data on past climate conditions (e.g., precipitation and temperature) from sediments, rocks, tree rings, corals, ice sheets, and other physical formations. Paleoclimate reconstructions provide insights on baseline climate conditions and natural variability in those conditions before humans began influencing the atmosphere or using instruments to measure different climate variables.
Statistical Techniques and Climate Models
Statistical analysis refers to the mathematical formulas and techniques that are used in empirical analysis of data. Scientists use statistical techniques to fill gaps in observational datasets. Reanalysis datasets are generated by combining available observations with statistical analyses and climate models to infer climate conditions where direct observational data are not available. For example, interpolation can be used to fill in gaps in space and time for a climate variable based on the locations and times for the data that are available for the given variable, and thus plays a key role in data reanalysis.43 Reanalysis datasets can be used to create “a coherent, long-term record of past weather by compensating for the inherent limitations of the different instruments used to take measurements at different points in the history of weather observation.”44
Statistical analysis is also used in conjunction with observational data and climate models to detect changes in the climate system and other interconnected systems, is used to determine whether these changes are attributable to human influence (“detection and attribution” research),45 and is used to predict
42. IPCC AR6 WG1, supra note 6, at 175.
43. Statistical interpolation involves estimating an unknown value based on related known values. There are many interpolation techniques, but the simplest example is linear interpolation—i.e., if observations show a linear increase in a variable over time, scientists can infer the value of that variable at a specific point in time even without a direct measurement.
44. National Oceanic and Atmospheric Administration National Centers for Environmental Information, Reanalysis, https://www.ncei.noaa.gov/products/weather-climate-models/reanalysis.
45. See section titled “Detection and Attribution” below.
future changes based on different warming trajectories.46 For example, scientists will use statistical trend detection to determine whether there have been statistically significant changes in climate variables (e.g., precipitation) and related variables (e.g., crop yield).47
Climate models use quantitative methods, including predictive equations and statistical techniques, to simulate interactions within the climate system. Scientists can set up different model experiments to evaluate the effect of one or more climate drivers (e.g., GHGs, aerosols, and solar flux) on one or more variables. As with statistical analysis, climate models can be used for the purposes of climate change detection and attribution as well as the projections of future climate change. Generally speaking, climate models are based on “well-established physical principles and have been demonstrated to reproduce observed features of recent climate . . . and past climate changes.”48 Well-understood physical laws that are solved mathematically through space and time in climate models include the conservation of mass and energy. Indeed, many aspects of climate change can be modeled with a fair degree of accuracy, particularly at continental and global scales.49 Climate models reproduce key planetary features like jet streams and ocean currents, as well as the relatively rapid warming of the northern hemisphere high latitudes in recent decades. Furthermore, a recent study found that past climate models had accurately predicted subsequent increases in global mean surface temperature (GMST), particularly when accounting for differences in projected and actual future forcings.50 However, because of the complexity of the climate system with its nonlinear interactions and hyperlocal nature of important physical processes (e.g., thunderstorms, or shear stress at the edge of an ice sheet), there are limitations in the ability of models to accurately and precisely simulate causal relationships and processes, particularly when predicting effects of climate change at smaller spatial and/or temporal scales. Many of these complexities are partially addressed using parameterizations, which are simplified statistical estimates of complex phenomena.
There are several types of climate models with different applications, including the following: global circulation models (GCMs), which simulate general circulation of the Earth’s atmosphere and oceans; energy balance models (EBMs), which simulate changes in temperature based on the balance between incoming
46. See section titled “Projections of Future Climate Change” below.
47. R.K. Jaiswal et al., Statistical Analysis for Change Detection and Trend Assessment in Climatological Parameters, 2 Env’t Processes 729 (2015), https://doi.org/10.1007/s40710-015-0105-3.
48. David A. Randall et al., Climate Models and Their Evaluation, in IPCC, Climate Change 2007: The Physical Science Basis, Contribution of Working Group I to the Fourth Assessment Report of the Intergovernmental Panel on Climate Change 591 (Susan Solomon et al. eds.), https://perma.cc/GG2X-AEPE.
49. See, generally, id. at 589–648.
50. Zeke Hausfather et al., Evaluating the Performance of Past Climate Model Projections, 47 Geophysical Rsch. Letters e2019GL095378 (2020), https://doi.org/10.1029/2019GL085378.
and outgoing solar radiation; earth system models (ESMs), which simulate the interactions of the atmosphere, hydrosphere, geosphere, biosphere, and cryosphere to assess how changes in climate (e.g., warmer temperatures) affect and are affected by other interconnected systems such as changes in vegetation; and regional climate models (RCMs), which simulate the interactions between the climate and other earth systems at a finer resolution than ESMs. Coupled GCM and ESM models use understanding of thermodynamics, fluid motion, and other physical processes to simulate interactions between multiple components of the climate system, including atmospheric and ocean circulation. The Coupled Model Intercomparison Project (CMIP) of the World Climate Research Programme is an international initiative that combines, synthesizes, and compares different climate models in order to develop more accurate climate simulations. The CMIP model ensembles are updated periodically—the latest IPCC assessment uses results from CMIP Phase 6 (CMIP6) models, which “include new and better representations of physical, chemical, and biological processes, as well as higher resolution” compared to past climate models.51
Generally speaking, model-based approaches can support more robust findings than the use of observational data and statistical analysis alone. However, models have limitations that should be kept in mind when evaluating their results. The usefulness and accuracy of a model depends on how well the model can reproduce patterns associated with each climate forcing, and there are uncertainties in our knowledge about how individual climate forcings affect different aspects of the climate system. Comparing model results to observations can help assess the accuracy of the model, but observations cannot tell us all we need to know for several reasons. First, there is uncertainty in observational measurements for reasons discussed above. Second, internal climate variability, unrelated to climate forcing, is difficult to disentangle from climate forcing. Third, because multiple anthropogenic and natural forcings have occurred simultaneously in the past, unpacking the relative contribution of each forcing is a major challenge.
The above challenges exist to a certain degree even for variables like global average temperature where the relationship between rising GHG concentrations and average temperatures is fairly direct. Inevitably, there will be some degree of uncertainty and room for error in model results due to the complexity of the physical systems being modeled, so scientists have tools for managing and communicating uncertainty and error rates.52 Scientists are also constantly refining the techniques used to reduce uncertainty in their analyses, such as
51. According to the IPCC, the use of CMIP6 “has improved the simulation of the recent mean state of most large-scale indicators of climate change and many other aspects across the climate system.” However, there are still some differences between CMIP6 model results and observations, particularly with regard to regional precipitation. IPCC AR6 WGI, supra note 6, at 12.
52. See section titled “Managing and Communicating Uncertainty” below.
through additional and lengthened observational datasets, improvements to models, new analytical methods, and expert judgment. For example, new statistical approaches are being used to better account for internal climate variability and uncertainties in models and observations.53
Another limitation to GCMs and other large-scale models is that they produce results at large spatial scales and thus cannot simulate local climate features and their impacts with precision. To address this issue, researchers are developing dynamical and statistical downscaling techniques that can be used to transform climate model outputs into more localized data products for regional or local climate impact assessments, although these approaches can run up against inherent uncertainties at fine spatial scales.54
Managing and Communicating Uncertainty
Owing to the complexity of the climate system, researchers inevitably confront uncertainty when evaluating causal relationships and processes within the system. This is not unique to the field of climate science: uncertainty exists across all scientific disciplines, and understanding sources of uncertainty is part of the scientific process. Climate scientists use standard techniques and practices for managing and communicating uncertainty and ensuring the validity of research findings. These include statistical- and model-based approaches that actually reduce uncertainty in research findings,55 as well as methods of framing and communicating uncertainty along with findings.
The IPCC, for example, uses probabilistic language to describe the assessed likelihood of an outcome or result and uses other language to communicate confidence and level of agreement in findings. Specifically, the IPCC describes (1) the assessed likelihood of an outcome or result (very likely, likely, etc.); (2) the availability of evidence to support particular findings (limited, medium, robust); (3) the level of agreement about findings (low, medium, high); and (4) scientific confidence in the findings (very low, low, medium, high, very high), which is based on both the level of agreement and availability of evidence for the
53. IPCC AR6 WGI, supra note 6, at 205. See also id. § 3.2.
54. “Dynamical downscaling refers to the use of high-resolution regional simulations to dynamically extrapolate the effects of large-scale climate processes to regional or local scales of interest. Statistical downscaling encompasses the use of various statistics-based techniques to determine relationships between large-scale climate patterns resolved by global climate models and observed local climate responses.” NOAA Geophysical Fluid Dynamics Lab’y, Climate Model Downscaling, https://perma.cc/7ZBZ-NQ9D.
55. See, e.g., Flavio Lehner et al., The Potential to Reduce Uncertainty in Regional Runoff Projections from Climate Models, 9 Nature Climate Change 926 (2019), https://doi.org/10.1038/s41558-019-0639-x.
finding.56 The full list of terms used to communicate likelihood in the most recent IPCC report is as follows: virtually certain, 99–100% probability; very likely, 90–100%; likely, 66–100%; about as likely as not, 33–66%; unlikely, 0–33%; very unlikely, 0–10%; and exceptionally unlikely, 0–1%. Additional terms (extremely likely, 95–100%; more likely than not, >50–100%; and extremely unlikely, 0–5%) are also used when appropriate.57 The use of such calibrated uncertainty language can make scientific findings more accessible to scientists and nonscientists alike.
Importantly, a finding of “low evidence” or “low confidence” does not equate to a finding that a particular proposition is not true or valid—it simply means that there is not enough evidence for IPCC scientists to reach agreement on the proposition. As new scientific data become available for subsequent assessments, the IPCC often revises these statements to reflect greater levels of confidence (e.g., the IPCC expressed greater confidence in the attribution of extreme events to climate change in AR6 than it had in past assessments).58
In individual studies, uncertainty is typically managed using similar statements about probabilities as well as confidence levels and intervals. A confidence interval reflects a range of possible true values for the parameter being studied. Confidence intervals are typically expressed as the mean estimate of the parameter ± variation in the estimate at a designated confidence level (typically 95%, although 90% and 99% are also used). The confidence level reflects the likelihood that the parameter will fall within the upper and lower bounds of the confidence interval. For example, a study may conclude with 95% confidence that anthropogenic climate forcing increased the likelihood of a specific extreme event by a factor of 4 ± 1 (with 4x being the mean estimate, and 3–5x being the confidence interval). Some studies will present findings at lower confidence bounds to provide additional insights on likely or probable findings (e.g., a 66% confidence level, corresponding with a “likely” finding).59
Scientific studies also typically include information about Type I (false positive) and Type II (false negative) errors. If Type I errors are high, then the study may have produced a spurious association between anthropogenic forcing and an observed trend. Conversely, if Type II errors are high, then the study may be underestimating or wholly missing the effects of anthropogenic forcing on an observed trend. Climate researchers, and academic researchers more generally, tend to be more concerned with avoiding Type I errors to ensure that they do
56. A. Kause et al., Confidence Levels and Likelihood Terms in IPCC Reports: A Survey of Experts from Different Scientific Disciplines, 173 Climatic Change 1 (2022), https://doi.org/10.1007/s10584-022-03382-3.
57. IPCC AR6 WG1, supra note 6, at 4.
58. See section titled “Extreme Event Detection and Attribution” below.
59. See, e.g., Mark D. Risser & Michael F. Wehner, Attributable Human-Induced Changes in the Likelihood and Magnitude of the Observed Extreme Precipitation During Hurricane Harvey, 44 Geophysical Rsch. Letters 12,457 (2017), https://doi.org/10.1002/2017GL075888.
not overstate the magnitude of anthropogenic climate change. Indeed, the high burden of proof assumed in standard statistical tests leads to researchers being very conservative in their estimates of climate change and its effects.60
A metric known as the p-value provides further insights on the validity of climate studies. The p-value is the quantification of the probability of a Type I error, such as the probability that an observed trend such as global surface warming would occur due to chance alone. A p-value of 5% or less is commonly used as a threshold of validity in climate studies and other areas of natural science.61 The frequent use of such a low p-value thus reflects the aversion of scientists to false positives/Type I errors.
Sources of Climate Research
Because of the breadth and complexity of climate science, scientific organizations like the IPCC play an important role in the synthesis and dissemination of climate research. The U.S. federal government also funds research and publishes reports on climate science, and there are thousands of individual researchers, academic institutions, and NGOs contributing to this field. This section provides context on different sources of climate research and highlights some considerations to help judges assess the credibility, weight, and admissibility of research depending on the source. The Appendix to this reference guide provides additional information about some of the organizations and sources discussed herein.
Scientific and Consensus Reports
There are several major organizations that periodically publish reports on the state of climate science. These include the IPCC, the World Meteorological Organization (WMO), the American Meteorological Society (AMS), the American Geophysical Union (AGU), the National Academies of Sciences, Engineering, and Medicine (National Academies or NASEM), and the U.S. Global Change Research Program (USGCRP). The WMO, for example, is a leading source of climate data products and it publishes an annual State of the Global Climate Report
60. William R.L. Anderegg et al., Awareness of Both Type I and 2 Errors in Climate Science and Assessment, 95 Bull. Am. Meteorological Soc’y 1445 (2014), https://doi.org/10.1175/BAMS-D-13-00115.1.
61. A p-value less than or equal to 5% is often described as the threshold for statistical significance, but this does not relate to the magnitude of impact—rather it is associated with probability. If the p-value is > 5%, then there is a reasonable probability that an observed trend (for example) might be due to chance alone.
that summarizes the latest observations and findings for various global climate indicators including GHGs, global temperature, ocean heat content, sea level, marine heat waves, the cryosphere, and precipitation.62
The IPCC is widely considered to be the leading scientific body for the assessment and synthesis of research on climate change. The IPCC does not conduct new research. Rather, it publishes assessment reports based on a synthesis of thousands of published, peer-reviewed studies from scientific journals.63 These assessment reports are prepared with input from thousands of scientists with diverse expertise across the field of climate research.64 A key benefit of the IPCC reports is that they identify scientific findings that have multiple lines of evidence, have been replicated, and have stood the test of time. There is a robust process for analyzing existing research and reaching conclusions on the basis of the reviewed science, as detailed in the Appendix to this reference guide. Thus, the IPCC reports and findings contained therein reflect a level of scientific scrutiny and agreement that is unique in this field.
Taking into account the procedures underpinning IPCC reports, the U.S. Supreme Court and federal appellate courts have recognized these reports as an authoritative and credible source of climate science.65 However, it is possible that judges may confront disputes regarding the accuracy of IPCC findings, particularly if there is more recent and credible scientific research that calls those findings into question.66 Although IPCC reports are typically afforded greater weight in the scientific community than individual studies, the science is constantly evolving, and subsequent research may provide new insights on the nature of climate change and its consequences. This progression toward greater scientific confidence
62. See WMO, State of the Global Climate, https://perma.cc/B4X9-9SDV.
63. The reports also draw on so-called “grey literature” (i.e., non-peer-reviewed reports, including technical reports, conference proceedings, statistics, and observational datasets), but there are strict guidelines for its inclusion.
64. The scientists involved in the assessments are selected through a nomination process. Prior to initiating an assessment, the IPCC issues a call to governments and IPCC observer organizations for nominations; the authors are then selected by the Bureau of Scientists on the basis of their expertise. The IPCC seeks to build author teams that reflect a range of scientific, technical, and socioeconomic expertise. See IPCC, Factsheet: How Does the IPCC Select Its Authors? (2021), https://perma.cc/8MGL-R9LL.
65. See Massachusetts v. EPA, 549 U.S. 497 (2007); Coal. for Responsible Regul. v. EPA, 684 F.3d 102 (D.C. Cir. 2012); Ctr. for Biological Diversity v. Nat’l Highway Traffic Safety Admin., 538 F.3d 1172, 1189 (9th Cir. 2008); Diné Citizens Against Ruining Our Env’t v. Haaland, 59 F.4th 1016 (10th Cir. 2023).
66. By “more recent” research, we mean research that was published after information was collected for the latest IPCC assessment (and therefore could not have been incorporated into the assessment).
in both the attribution and prediction of climate change impacts is evident across IPCC assessments.67
There are other synthesis reports that serve as important sources of climate data; some of these reports provide more targeted assessments of specific topics and/or geographic regions. For example, the USGCRP periodically publishes National Climate Assessments (NCAs) that integrate, evaluate, and interpret scientific findings related to climate change and its effects on the United States, including effects on the natural environment, agriculture, energy production and use, land and water resources, transportation, human health and welfare, human social systems, and biological diversity. The reports also analyze broader trends in global climate change, both human-induced and natural, and projections for the subsequent 25 to 100 years.
Peer-Reviewed Research
The assessments performed by the IPCC and other authoritative science bodies are based primarily on syntheses of peer-reviewed climate research. Litigants may also rely on individual peer-reviewed studies and articles to support scientific claims. The benefit of peer review is that it ensures that research has been examined by one or more scholars with expertise in the subject matter (although it does not generally involve repeating any of the measures or calculations or otherwise reproducing the work). Examples of peer-reviewed research include original research studies (i.e., primary research), review articles, and expert judgment reports.68 The most robust climate studies tend to be those that combine good observational data, physical understanding, rigorous statistical analysis, and detailed models to generate findings, along with clear communication and transparency with respect to research parameters, assumptions made, confidence in findings, and potential areas of uncertainty or bias.
Importantly, different publications have different standards for what qualifies as peer review, and there are some journals that purport to publish peer-reviewed research that do not actually have a legitimate peer-review process—these are sometimes referred to as “predatory journals.” In order to distinguish between legitimate and illegitimate publications, judges can refer
67. See, e.g., IPCC AR6 WGI, supra note 6, at 52 (“new techniques developed since AR5, including attribution of individual events, have provided greater confidence in attributing changes in climate extremes to climate change”).
68. Here, “expert judgment reports” specifically refers to peer-reviewed articles containing findings based on expert judgment and expert surveys (not to be confused with expert reports submitted as part of litigation). See, e.g., Jonathan L. Bamber et al., Ice Sheet Contributions to Future Sea-Level Rise from Structured Expert Judgment, 116 PNAS 11195 (2019), https://doi.org/10.1073/pnas.1817205116.
to online lists of such journals;69 judges can also examine the credentials of the journal editors, the authors of the particular study at issue in the case, and the authors of other studies published in that same journal.70 Another indication of the quality of a journal is whether the publication has been indexed by major journal-indexing groups such as Scopus, Web of Science, PubMed, and Google Scholar.
Individual studies and reports are typically not afforded the same weight within the scientific community as IPCC assessments and other major scientific reports, but they can serve as important supplements to such reports, as they may provide insights on areas of climate science that are not covered elsewhere (e.g., assessments of climate change impacts at a more local or granular scale, or findings based on data that are too recent to have been included in a prior synthesis report).
It is also important to note that the fact that a scientific resource is not peer reviewed does not in and of itself mean that the resource is faulty or illegitimate. There are credible scientific data and research products that do not undergo formal peer review—this includes, for example, some of the data and research products published by government agencies. Courts can consider other factors when evaluating the credibility of such resources, including the credentials of the publishing organizations and scientists, whether the findings are consistent with those from expert bodies like the IPCC, and whether the underlying methodologies have been subject to peer review.
Expert Testimony and Reports
Expert witnesses can play an important role in communicating and interpreting scientific evidence in climate litigation. Part of this role may involve simply summarizing findings from the IPCC and other authoritative bodies and explaining the relevance of those findings to a particular case. Expert witnesses may be needed to support or refute factual claims that are beyond the scope of broad-scale climate assessments like IPCC reports—e.g., claims about the effects of climate change on a particular locale or individual. When that is the case, expert witnesses may provide testimony and reports based on individual studies or impact assessments (including government assessments). They can also answer questions to help clarify the methods and findings from specific studies—for example, explaining why a particular time frame or historical baseline was used
69. See, e.g., Beall’s List of Potentially Predatory Journals and Publishers, https://perma.cc/63GD-ZS25.
70. See section titled “Expert Testimony and Reports” for further insights on engaging with expert witnesses.
in a study, or explaining the level of uncertainty inherent in a particular finding.
There are contexts where expert witnesses may draw inferences about the effects of climate change in the absence of a targeted study on those effects.71 For example, an expert may infer that climate change has contributed to more severe heat waves in a particular location based on regional analyses of climate impacts and physical understanding of the strong causal relationship between climate change and extreme heat.72 The reasonableness of such inferences would depend on factors such as the nature and location of the impact, the strength of the “signal” of anthropogenic climate change relative to natural variability, and the level of spatial or temporal variability in the impact. In particular, when evaluating the potential causal link between climate change and a specific event or impact, a judge could consider whether (1) a widespread pattern in a geographic area has been observed and attributed to climate change, (2) there is not too much spatial or temporal variability in the impact, and (3) the expert is inferring that this pattern applies to a particular locale.
There are some threshold considerations when assessing the admissibility of expert testimony on climate science.73 First, the field of climate science is so broad that it is impossible to articulate general criteria for expert qualifications in this field—whether a witness is qualified to speak will be a case-by-case determination that is entirely dependent on the scope of their testimony. For example, an expert who is testifying on the reliability of global climate models should have expertise on the physical processes that drive global climate change (which could be gleaned through, e.g., research in atmospheric sciences or meteorology) and/or the statistical and mathematical techniques deployed in those climate models; an expert who is testifying on the biological impacts of climate change should have expertise in biological sciences; and so forth.
Second, when evaluating whether the testimony would pass the Daubert test (i.e., whether it is based on reliable principles and methods), courts may consider factors such as: (1) whether the testimony is based on principles,
71. See Elisabeth A. Lloyd & Theodore G. Shepherd, Climate Change Attribution and Legal Contexts: Evidence and the Role of Storylines, 167 Climatic Change 27 (2021), https://doi.org/10.1007/s10584-021-03177-y. The authors note that “proceeding from the general to the specific is a process of deduction and is an entirely legitimate form of scientific reasoning” and “well aligned with the concept of legal evidence.” Id. (abstract).
72. See section titled “Extreme Event Detection and Attribution” below.
73. As discussed in Liesa L. Richter and Daniel J. Capra, The Admissibility of Expert Testimony, in this manual, when such disputes arise, judges must find that the expert witness is qualified to provide testimony on the subject matter, that the witness’s scientific and technical knowledge will help the trier of fact understand the subject matter, that the expert’s opinion is based on sufficient facts or data, that the expert’s opinion is the product of reliable principles and methods, and that the witness has reliably applied those principles and methods to the facts of the case. See also Fed. R. Evid. 702; Fed. R. Evid. 104(a).
methodologies, or findings that have been accepted as credible by the IPCC and other scientific institutions; (2) whether the underlying methods and findings have been subjected to peer-review processes; and (3) whether the research is accompanied by information about confidence levels and error rates.74 When confronted with novel research findings or methodologies, judges can consider whether the novel aspects are rooted in existing and accepted scientific techniques to determine whether they represent a significant departure from general practices. In many cases, so-called “novel” techniques used in climate studies are based on minor changes to (or advances in) well-established research methods (and in some cases, they are adapted from other disciplines). For example, extreme-event attribution generally relies on the same climate models used in past studies to attribute changes in average conditions and to predict future changes,75 and probabilistic or risk-based extreme-event studies also use concepts and methods developed in epidemiological research.76
Climate Change Detection, Attribution, and Projections
Litigants typically use climate science to support or refute claims about the causes and impacts of climate change. For example, a plaintiff may use climate science to demonstrate that the GHG emissions attributable to a defendant’s conduct have caused or contributed to an injury incurred by the plaintiff or society at large. There are several areas of climate research that are particularly relevant to litigation. First, detection and attribution research examines whether and to what extent specific trends, events, and impacts can be attributed to human influence on the climate system. Second, source attribution research evaluates the respective contributions of different actors, activities, sectors, and jurisdictions to anthropogenic climate change and its impacts. Third, projections of future climate change
74. As discussed above, studies often include information about Type I (false positive) and Type II (false negative) errors, as well as the p-value (the probability of obtaining results at least as extreme as the observed result, assuming that the null hypothesis is correct). A 5% p-value cutoff is commonly used to ensure the validity of results. In addition, climate studies and IPCC reports use confidence levels to communicate the likelihood that a finding is valid, and most individual studies use a high confidence level (e.g., ≥ 90%) corresponding with a low margin of error. These confidence statements may not be directly relevant to the Daubert inquiry insofar as they deal with the validity of findings rather than methodologies. However, they are relevant when assessing the credibility and probative value of expert testimony. See Daubert v. Merrell Dow Pharms., Inc., 509 U.S. 579 (1993) (listing nonexhaustive factors in determining reliability of a scientific expert method).
75. See section titled “Impact Detection and Attribution” below.
76. See Theodore G. Shepherd, A Common Framework for Approaches to Extreme Event Attribution, 2 Current Climate Change Reps. 28 (2016), https://doi.org/10.1007/s40641-016-0033-y.
provide insights on the scope and magnitude of future climate change under different warming and emissions trajectories. Finally, there is research aimed at estimating remaining carbon budgets that would limit global warming to targets such as 1.5°C, 2.0°C, or “well below” 2.0°C. For each of these research areas, we describe the underpinning methods and parameters, and we summarize key research findings, focusing on findings from the IPCC and other scientific bodies.
As detailed below, there is scientific consensus on the reality of anthropogenic climate change, and scientists can detect, attribute, and predict many of the trends and impacts caused by climate change with a high level of confidence. But some gaps remain in scientific knowledge of the climate system and uncertainty about the effects of climate change, particularly when looking at the regional or local impacts of climate change.
Detection and Attribution
Detection and attribution research examines the causal links between human activities, changes in the climate system, and corresponding impacts on other interconnected systems.77 Research in this field has demonstrated that human activities are the dominant cause of observed climate change,78 and that human-induced climate change is causing pervasive impacts to human and natural environments around the world.79 Some of the observed changes include rising sea levels, ocean warming and acidification, melting sea ice, thawing permafrost, increases in the frequency and severity of many types of extreme events, and corresponding impacts on people, communities, and ecosystems.80 These findings are based on multiple lines of evidence, including physical understanding of the climate system and the greenhouse effect, comparisons between observational data and climate models, paleoclimate reconstructions, and “fingerprinting”
77. This discussion of attribution research has been adapted and, in some cases, excerpted from the authors’ prior publication on this topic. See Michael Burger et al., The Law & Science of Climate Change Attribution, 5 Colum. J. of Env’t Law 57 (2020), https://perma.cc/N7A7-4XMP. The discussion of scientific findings has been updated to reflect new resources, including the latest IPCC assessment (AR6).
78. NAS Update, supra note 6, at ch. 2. See also IPCC AR6 WGI, supra note 6; NCA4 Vol. I, supra note 6.
79. The weight of the scientific evidence demonstrates that anthropogenic climate change “is already affecting every inhabited region across the globe, with human influence contributing to many observed changes in weather and climate extremes.” IPCC AR6 WGI, supra note 6, at 10. See also NCA4 Vol. I, supra note 6, at 36 (“Evidence for a changing climate abounds, from the top of the atmosphere to the depths of the oceans.”).
80. See sections titled “Source Attribution” and “Projections of Future Climate Change” below.
studies that examine the influence of anthropogenic forcing on specific climatological trends and events.81
Detection and attribution research can be categorized into different subfields, each of which corresponds with a different link in the causal chain connecting human activities to climate-change-related harms:
- Detection and attribution of climate change focuses on the link between anthropogenic climate forcing and corresponding changes in the climate system, including the atmosphere, hydrosphere, cryosphere, land surface, and biosphere.
- Extreme-event attribution examines how global climate change has affected the probability, frequency, severity, and other characteristics of extreme events such as heat waves, storms, floods, droughts, and wildfires.82
- Impact attribution examines how global climate change is affecting human and natural systems. This research deals with a broad range of physical, social, health, economic, and biological impacts at global, regional, and local scales.83
Below, we provide a general overview of methods and parameters used in attribution research. This is followed by a more targeted discussion of the three subfields identified above (climate change, extreme-event, and impact attribution).
81. IPCC AR6 WGI, supra note 6; NAS Update, supra note 6, at ch. 2. For additional information on fingerprinting studies, see generally this section and the subsection titled “Attribution to anthropogenic climate change” below.
82. We discuss extreme-event attribution as a separate category of attribution research because extreme events do not fit neatly into the “global climate change” or “impact” attribution categories. Weather is part of the climate system, but extreme events are often discussed as impacts of climate change, and there are unique challenges associated with efforts to ascertain the effect of climate change on a particular extreme event.
83. The distinction between “changes in the global climate system” and “the impacts of climate change” is not always clear because of the broad definition of the global climate system. The IPCC defines impacts or effects to include physical impacts such as floods, droughts, and local sea-level rise, as well as any other “effects on lives, livelihoods, health and well-being, ecosystems and species, economic, social and cultural assets, services (including ecosystem services), and infrastructure.” IPCC AR6 WGI, supra note 6, at 201. In many cases, a change in an essential climate variable (e.g., sea-level rise) could be viewed as a physical impact of climate change. For the purposes of this reference guide, we classify studies on regional changes in essential climate variables as “climate change attribution” where the primary goal of the study is to better understand how humans are affecting the global climate system, and we classify studies on floods, droughts, and local sea-level rise as “impact attribution,” where the primary goal of the study is to better understand how climate change is affecting a particular region or locale.
General Methods and Parameters
Detection of change
Detection and attribution is a two-step process used to identify a causal relationship between one or more drivers and a responding system. The first step—detection of change—involves demonstrating that a particular variable has changed in a statistically significant way without assigning cause.84 To accomplish this, scientists will compare historical climate data with contemporary observations to assess the magnitude of change, and they will also evaluate whether the observed change may be due to internal variability or external forcing on the climate system. An identified change is detected in observations if the likelihood that it occurred because of internal variability (i.e., chance) alone is determined to be small, for example, less than 10%.85
Scientists typically use instrumental records to identify an event or process that will be the subject of the detection and attribution study. The subject could be a gradual process, such as increases in average sea surface temperature or global mean sea level, or it could be a sudden-onset event, such as a heat wave. Scientists will also use instrumental records in conjunction with other sources of climate data (e.g., reanalysis datasets and paleoclimate reconstructions) to characterize baseline climate conditions and to evaluate how those conditions have changed over time.
Attribution to anthropogenic climate change
The second step—attribution—involves sifting through a range of possible causative factors to determine the role of one or more drivers with respect to the detected change. This is typically accomplished by using physical understanding, as well as climate models and/or statistical analysis, to compare how the variable responds when certain drivers are changed or eliminated entirely. The goal of such studies is to determine whether, how, and to what extent anthropogenic drivers have contributed to the observed change.
Many attribution studies use a probabilistic approach—i.e., researchers will seek to quantify the probability of a particular outcome (e.g., how likely is the occurrence of three inches of rainfall in a day at a given locale) occurring with and without anthropogenic influence on climate. However, researchers can
84. David R. Easterling et al., Detection and Attribution of Climate Extremes in the Observed Record, 11 Weather & Climate Extremes 17 (2016), https://doi.org/10.1016/j.wace.2016.01.001; Gabriele Hegerl, Towards Detection and Attribution of Impact-Relevant Climate Change: The WG1 Perspective, in IPCC Expert Meeting on Detection and Attribution Related to Anthropogenic Climate Change, Meeting Report 25–27 (Thomas Stocker et al. eds., 2010), https://perma.cc/X3HY-VR9L.
85. IPCC AR6 WGI, supra note 6, at 196.
also use a mechanistic approach to attribution, whereby they seek to examine how climate change has influenced one or more physical characteristics of an event or process.86 Mechanistic studies can provide insights on, for example, the change in magnitude or severity of an extreme event that can be attributed to climate change.87 In the rainfall example above, a mechanistic approach might look at the weather system that produced the heavy rain and describe how one part of climate change that we understand well—e.g., the warming of the atmosphere and its resulting increase in the amount of moisture the atmosphere can hold—contributed to the event. Mechanistic and probabilistic analyses can be combined in order to develop a more complete picture of whether and to what extent climate change is influencing various processes and events.88
Researchers use both statistical techniques and climate models when detecting and attributing change. As an example of statistical techniques, scientists use linear regression methods89 and variants such as “optimal fingerprinting” to determine whether a change in a climate variable is statistically significant or simply part of natural variability.90 This analysis is part of the detection of climate change and corresponding impacts, but it can also be used to support attribution statements (e.g., a finding that the spatial pattern of warming in the atmosphere was likely caused by anthropogenic emissions because it is statistically unlikely that the spatial pattern would have occurred in the absence of anthropogenic forcing on the climate). This is sometimes referred to as observation-based attribution.91
86. See section titled “Projections of Future Climate Change” below for further discussion of the mechanistic approach and its role in extreme-event attribution (also referred to as the “storyline” approach to extreme-event attribution).
87. See, e.g., Michael Wehner & Christopher Samson, Attributable Human-Induced Changes in the Magnitude of Flooding in the Houston, Texas Region During Hurricane Harvey, 166 Climatic Change 19 (2021), https://doi.org/10.1007/s10584-021-03114-z. See also Luke J. Harrington et al., Integrating Attribution with Adaptation for Unprecedented Future Heatwaves, 172 Climatic Change 1 (2022), https://doi.org/10.1007/s10584-022-03357-4 (discussing the differences and similarities between probabilistic and mechanistic approaches to extreme-event attribution).
88. For example, findings from both probabilistic and mechanistic studies are synthesized in IPCC assessments and other climate reports.
89. Linear regression is a statistical method used to summarize and study relationships between two continuous (quantitative) variables.
90. Optimal fingerprinting regresses observed climate variables on expected responses to, or signals of, specific forcings to determine whether and to what extent the signals are present in the observation. See Zhuo Wang et al., Toward Optimal Fingerprinting in Detection and Attribution of Changes in Climate Extremes, 116 J. Am. Stat. Ass’n 1 (2021), https://doi.org/10.1080/01621459.2020.1730852; K. Hasselmann, Optimal Fingerprints for the Detection of Time-Dependent Climate Change, 6 J. Climate 1957 (1993), https://doi.org/10.1175/1520-0442(1993)006<1957:OFFTDO>2.0.CO;2.
91. Nat’l Acads. of Sci., Eng’g, & Med. (NASEM), Attribution of Extreme Weather Events in the Context of Climate Change (2016), https://perma.cc/D56R-G9DJ.
However, in practice, most studies do not rely exclusively on observation-based statistical analysis for attribution because of short observation records and complex forcing changes over the historical period.92 Climate models are typically used for attribution because they allow scientists to separate out the effects of different forcings and processes on the observed variable. That said, observation-based attribution findings can serve as a useful supplement to model-based findings.93
Attribution studies utilizing climate models generally involve at least two sets of simulations: one that reflects the actual world, and another that reflects a counterfactual world without anthropogenic climate change (or without some component of anthropogenic climate change). These model simulations are ideally run at least several times based on differing initial conditions and for long duration, allowing scientists to better differentiate the climate change signal from the noise of natural variability. Observational data and physical understanding provide the basis for calibrating and verifying models.
Several modeling centers have now developed standardized climate simulations designed for detection and attribution specifically, based on different parameters (e.g., researchers can evaluate the probability of an event or impact occurring both with and without certain observed changes in the climate, such as changes in sea surface temperature). Owing to advances in parallel computing and model simplifications, these can be run rapidly and at high spatial resolution, yielding quick results. Indeed, when the above packages are combined with forecasts of variables with high predictability, such as sea surface temperature, projected results can be made available in advance of actual events. Furthermore, the tools and outputs, and models themselves, are increasingly being made publicly available. This has furthered the proliferation of attribution research in recent years.
Challenges associated with downscaling and exogenous variables
Attribution becomes increasingly complex and challenging as the focus of research moves away from long-term, broad-scale changes in the climate system and toward more localized, discrete events and impacts. One key challenge is conducting the analysis at the appropriate spatial and temporal scale. Natural variability, unrelated to changes in anthropogenic climate forcing, is larger at fine spatial and temporal scales, making it harder to identify signals associated
92. Id.
93. Andrew D. King et al., Attribution of the Record High Central England Temperature of 2014 to Anthropogenic Influences, 10 Env’t Rsch. Letters 1 (2015), https://doi.org/10.1088/1748-9326/10/5/054002; Gabriele C. Hegerl, Use of Models and Observations in Event Attribution, 10 Env’t Rsch. Letters 1 (2015), https://doi.org/10.1088/1748-9326/10/7/071001.
with anthropogenic or other forcings.94 When models are used to assess extreme events or impacts that occur at finer spatial and temporal scales than the models themselves, some type of downscaling or error correction is needed, which can introduce additional uncertainties.95
Impact attribution studies must also account for nonclimate or exogenous variables, that is, characteristics of human and natural systems that are not part of the climate system.96 Consider a study examining the relationship between climate change, a heat wave, and public health impacts: the study would need to account for both climate variables at a fairly discrete geographic and temporal scale (e.g., temperature and humidity during the event) as well as nonclimate variables (e.g., population risk factors for heat-related morbidity, access to air-conditioned facilities and emergency services) to ascertain the extent to which climate change caused or contributed to observed health outcomes. Confounding variables (e.g., air quality), which influence both dependent and independent variables in a study, are of special concern, as they can lead to spurious associations between a driver and an event or impact.97 The number of exogenous and confounding variables increases as attribution research moves toward an analysis of discrete impacts on humans, communities, and ecosystems.
To manage exogenous variables, some studies use a single-step attribution approach, i.e., “a single modelling setup to relate changes in drivers to changes in some aspect of a climate, natural, or human system.”98 As an example, single-step attribution has been used to evaluate the relationship between very warm regional temperatures and human influence on the climate.99 Other studies use a multistep approach that links separate single-step analyses into an overall attribution assessment. Multistep studies often examine how one or more core climate variables have changed in response to human activities, and then explore
94. See IPCC AR6 WGI, supra note 6, at 117 (discussing how internal variability is stronger and uncertainties in observations, models, and external forcings are larger at the regional scale, as compared with the global scale).
95. . See, e.g., NOAA Geophysical Fluid Dynamics Lab’y, Climate Model Downscaling, https://perma.cc/7ZBZ-NQ9D.
96. This may be somewhat of an oversimplification, as many variables that may appear to be outside of the climate system are still, to some extent, interdependent with that system.
97. In an impact or event attribution study, the dependent variable would be the impact or event under examination (e.g., a heat wave or an uptick in hospitalizations) and the independent variable would be the climate-change-related driver of the impact or event (e.g., increases in GHG concentrations or, in some studies, increases in climate variables such as mean temperature).
98. Dáithí Stone et al., The Challenge to Detect and Attribute Effects of Climate Change on Human and Natural Systems, 121 Climatic Change 381, 390–91 (2013), https://doi.org/10.1007/s10584-013-0873-6.
99. See Peter A. Stott et al., Single-Step Attribution of Increasing Frequencies of Very Warm Regional Temperatures to Human Influence, 12 Atmospheric Sci. Letters 220 (2011), https://doi.org/10.1002/asl.315.
the implications of that change with respect to one or more specific impacts.100 Multistep attribution is useful for examining causal relationships in complex systems, but one potential drawback of this approach is that additional, cascading uncertainty and potential for error is introduced with each new step that is added to the analysis. Attribution researchers can also use an indirect two-step approach by referencing findings from other studies or IPCC reports to establish the first step in their causation analysis (e.g., the link between anthropogenic forcing and warmer average temperatures), and then they can focus on the second step (e.g., the link between warmer average temperatures and heat waves).101
Climate Change Detection and Attribution
Studies in this category examine the effects of anthropogenic climate forcing on specific components of the climate system and metrics such as average temperature and precipitation. This research provides foundational knowledge about global climate change that is subsequently used in extreme-event and impact attribution studies.
Methods and parameters
Scientists detect changes in the climate system through instrumental records, such as the CO2 readings from the Mauna Loa Observatory in Hawaii, remote sensing from satellites, and other platforms. Some of the key variables being monitored include atmospheric concentrations of GHGs and other radiative forcers, atmospheric and surface temperature, water vapor (humidity), precipitation, sea ice, sea levels, ocean heat content, and ocean acidity. Scientists also use climate reanalysis datasets to fill gaps in instrumental records, as well as paleoclimate reconstructions to provide a perspective on longer-term climate change and variability. Paleoclimate reconstructions provide a means of comparing the current climate with that of past periods in Earth’s history. The reconstructions
100. See, e.g., Yixin Mao et al., Is Climate Change Implicated in the 2013–2014 California Drought? A Hydrologic Perspective, 42 Geophysical Rsch. Letters 2805 (2015), https://doi.org/10.1002/2015GL063456; A. Park Williams et al., Contribution of Anthropogenic Warming to California Drought During 2012–2014, 42 Geophysical Rsch. Letters 6819 (2015), https://doi.org/10.1002/2015GL064924.
101. See, e.g., Peter Stott et al., Future Challenges in Event Attribution Methodologies, in Explaining Extreme Events of 2016 from a Climate Perspective, 99 Bull. Am. Meteorological Soc’y S1, S155 (2018), https://doi.org/10.1175/BAMS-D-17-0118.1 [hereinafter BAMS 2016], referencing Russell E. Brainard et al., Ecological Impacts of the 2015/16 El Niño in the Central Equatorial Pacific, in BAMS 2016 at S21, https://doi.org/10.1175/BAMS-D-17-0128.1. See also David J. Frame et al., The Economic Costs of Hurricane Harvey Attributable to Climate Change, 160 Climatic Change 271 (2020), https://doi.org/10.1007/s10584-020-02692-8.
offer important insights, including: (1) how sensitive different aspects of the climate system are to different climate forcings at various timescales and (2) more robust estimates of natural variability than can be gleaned from the relatively short observational and instrumental record.
In order to attribute changes in the climate system to human influence, researchers must demonstrate that a detected change is “consistent with the estimated responses to the given combination of anthropogenic and natural forcing” and “not consistent with alternative, physically plausible explanations of recent climate change that exclude important elements of the given combinations of forcings.”102 The foundation for this analysis is physical understanding of how the climate system reacts to different radiative forcings, such as GHGs, atmospheric aerosols, solar radiation, and reflectivity (albedo), all of which influence the balance of energy in the global climate system. Scientists must also account for the global carbon cycle in order to ascertain how changes in radiative forcings will affect different components of the climate system (e.g., the relative uptake of heat and carbon dioxide by oceans). Finally, scientists must account for natural variability within the climate system in order to ascertain whether an observed change is caused by human forcing or natural variability.
The CMIP model ensembles (discussed in the section titled “Statistical Techniques and Climate Models” above) are commonly used in climate change attribution studies. Owing to ongoing advances in physical understanding, observations, and computational power, climate models now operate at finer and finer spatial scales, include interactions across more and more components of the climate system, and generate thousands of years of model output under different forcings and initial conditions. As models have grown in sophistication and complexity, their utility for climate attribution has grown—in 2014, IPCC AR5 found that models driven by historical greenhouse gas emissions and natural forcings (e.g., volcanoes and solar variability) could already “reproduce observed continental-scale surface temperature patterns and trends over many decades, including the more rapid warming since the mid-20th century and the cooling immediately following large volcanic eruptions.”103 Models have continued to improve since then.
IPCC AR6 assessed results from climate models participating in CMIP6 and found that:
102. IPCC, Climate Change 2001: The Scientific Basis, Working Group I Contribution to the Third Assessment Report of the IPCC 56 (J.T. Houghton et al. eds.), https://perma.cc/3GBS-NLYT [hereinafter IPCC TAR WGI].
103. The IPCC issued this statement with very high confidence. IPCC, Climate Change 2013: The Physical Science Basis, Working Group I Contribution to the Fifth Assessment Report of the IPCC 15 (Thomas F. Stocker et al. eds., 2013) [hereinafter IPCC AR5 WGI], https://perma.cc/3LKN-28W5.
[The CMIP6 models] include new and better representations of physical, chemical and biological processes, as well as higher resolution, compared to climate models considered in previous IPCC assessment reports. This has improved the simulation of the recent mean state of most large-scale indicators of climate change and many other aspects across the climate system. Some differences from observations remain, for example in regional precipitation patterns.104
However, there are still some significant differences between model results and some observations, particularly with regard to the hydrological cycle and precipitation patterns, and remaining uncertainties in cloud cover and cloud types. Global and even regional models are often too coarse in resolution to accurately and precisely simulate certain aspects of precipitation, particularly heavy precipitation (as there is significant variation in precipitation at relatively small spatial and temporal scales). This is a good example of a “downscaling” challenge in climate science that researchers are actively seeking to address.105 Such downscaling challenges are most apparent in extreme-event and impact attribution, but they also appear, to a lesser extent, in climate change attribution studies. This is because many of the observed changes in the global climate system vary on a regional basis, the result of factors including differences in forcings and the higher natural variability at finer spatial scales.
Status of research
The existing body of research shows that human activities have unequivocally warmed the climate, and this has caused “[w]idespread changes in the atmosphere, ocean, cryosphere, and biosphere.”106 Scientists have also made considerable
104. IPCC AR6 WGI, supra note 6, at 285.
105. See, e.g., Jie Chen & Xunchang John Zhang, Challenges and Potential Solutions in Statistical Downscaling of Precipitation, 165 Climatic Change 1 (2021), https://doi.org/10.1007/s10584-021-03083-3.
106. IPCC AR6 WGI, supra note 6, at 148. See also USGCRP, Fifth National Climate Assessment, chs. 2–4 (A.R. Crimmins et al. eds., 2023), https://doi.org/10.7930/NCA5.2023 [hereinafter NCA5] (“[t]he evidence for warming across multiple aspects of the Earth system is incontrovertible, and the science is unequivocal that increase in atmospheric greenhouse gases are driving many observed trends and changes”). The finding that human activities have “unequivocally” caused climate change is based on the continuing upward trend in GHG emissions and related trends in climate variables such as temperature increases, ice-mass loss, and sea-level rise. Scientific confidence in this finding has increased with each subsequent IPCC assessment. See IPCC AR6 WGI, supra note 6, at 182 (“The Second Assessment Report (SAR) stated that ‘the balance of evidence suggests a discernible human influence on global climate.’ Five years later, the Third Assessment Report (TAR) concluded that ‘there is new and stronger evidence that most of the warming observed over the last 50 years is attributable to human activities.’ The AR4 further strengthened previous statements, concluding that ‘most of the observed increase in global average temperatures
progress toward quantifying the effect of human activities on different components of the climate system, although there is still uncertainty about some precipitation and hydrological changes attributable to climate change. There is also some uncertainty about the respective influence of different climate forcings on observed changes, including the influence of nonhuman forcings, as well as the magnitude of internal variability and its influence on observed changes. The following paragraphs provide an overview of key findings for specific variables and components within the climate system.
Chemical composition of the climate: Since the onset of the Industrial Revolution, human activities have caused significant increases in atmospheric GHG concentrations. Between 1750 and 2019, CO2 concentrations increased 47% to 410 parts per million (ppm); CH4 concentrations increased 156% to 1,866 parts per billion (ppb); and N2O concentrations increased 23% to 332 ppb.107 The current levels of these GHGs in the atmosphere are unprecedented on timescales spanning from thousands to millions of years.108 Because of the global carbon cycle, not all GHGs remain in the atmosphere. Approximately 44% of anthropogenic CO2 emissions have accumulated in the atmosphere, with the remainder absorbed by land and ocean CO2 sinks.109 Scientists predict that the fraction of CO2 absorbed by land and oceans will decrease as cumulative CO2 emissions increase.110
Atmospheric and surface temperature: IPCC AR6 found “unequivocal” evidence that human influence has warmed the atmosphere, oceans, and land; this warming trend is unprecedented in at least the last 2,000 years and cannot be explained by natural drivers or internal variability.111 The USGCRP, National Academies, and other major scientific organizations have reached
since the mid-20th century is very likely due to the observed increase in anthropogenic greenhouse gas concentrations.’ The AR5 assessed that a human contribution had been detected in: changes in warming of the atmosphere and ocean; changes in the global water cycle; reductions in snow and ice; global mean sea level rise; and changes in some climate extremes. The AR5 concluded that ‘it is extremely likely that human influence has been the dominant cause of the observed warming since the mid-20th century.’”) (citations omitted).
107. IPCC AR6 WGI, supra note 6, at 281. This rate of change in CO2 and CH4 concentrations is unprecedented in at least the past 800,000 years. Id. at 69. GHG concentrations have continued to rise since AR6. In 2022, CO2 concentrations reached 418 ppm, CH4 concentrations reached 1,923 ppb, and N2O concentrations reached 336.16 ppb. NOAA Glob. Monitoring Lab’y, Carbon Cycle Greenhouse Gases, https://perma.cc/U45E-HU3R.
108. NAS Update, supra note 6, at 9. IPCC AR6 found that in 2019, atmospheric CO2 concentrations were higher than at any time in at least 2 million years (high confidence) and atmospheric CH4 and N2O concentrations were higher than at any time in at least 800,000 years (very high confidence). IPCC AR6 WGI, supra note 6, at 8.
109. IPCC AR6 WGI, supra note 6, at 690. Specifically, the IPCC estimates that 23% of anthropogenic CO2 emissions have been taken up by ocean sinks, and 31% have been taken up by terrestrial ecosystems (or “land sinks”). Id. at 80.
110. Id. at 744.
111. Id. at 4, 6.
similar conclusions.112 As of 2019, the decadal average global surface temperature had increased approximately 1.09 [0.95–1.20] °C over preindustrial levels, with larger increases over land (1.59 [1.34–1.83] °C) than the ocean (0.88 [0.68–1.01] °C).113 The observed warming trend is consistent with physical understanding and model simulations of the climate forcing effects of human drivers (see Figure 1). IPCC AR6 found that it is likely that humans are responsible for approximately 1.07 [0.8–1.3] °C of the observed increase in global surface temperature, with well-mixed GHGs contributing to a warming of 1.0–2.0 °C and other human drivers (primarily aerosols) contributing to a cooling of 0.0–0.8 °C.114
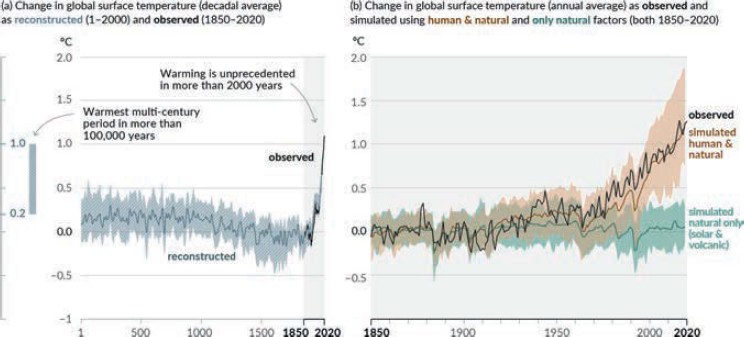 Panel (a) shows changes in global surface temperature reconstructed from paleoclimate archives (solid gray line, years 1–2000) and from direct observations (solid black line, 1850–2020), both relative to 1850–1900 and decadally averaged.
Source: Figure SPM.1 in IPCC, Summary for Policymakers, in Climate Change 2021: The Physical Science Basis, Contribution of Working Group I to the Sixth Assessment Report of the Intergovernmental Panel on Climate Change 3–32 (Masson-Delmotte et al. eds.), http://doi.org/10.1017/9781009157896.001.
112. See NCA5, supra note 106; NAS Update, supra note 6.
113. IPCC AR6 WGI, supra note 6, at 5. The figures cited here include average estimates as well as ranges (in square brackets). These ranges reflect the 90% confidence interval (meaning that there is an estimated 90% likelihood of the value being within that range). Id. at 41. The IPCC AR6 uses the period of 1850–1900 as a proxy for pre-industrial temperature levels (as well as other pre-industrial climate conditions). Id. at 163 (see Cross-Chapter Box 11.1).
114. Id. at 5. Similarly, NCA4 found that there was “a likely human contribution of 93%–123% of the observed 1951–2010 change” in global temperature. NCA4 Vol. I, supra note 6, at 14.
The gray shading with white diagonal lines shows the very likely ranges for the temperature reconstructions. Panel (b) shows changes in global surface temperature over the past 170 years (black line) relative to 1850–1900 and annually averaged, compared to CMIP6 climate model simulations of the temperature response to both human and natural drivers (brown) and to only natural drivers (solar and volcanic activity, green). Solid colored lines show the multimodel average, and colored shades show the very likely range of simulations.
Ocean warming: As the atmosphere has warmed, so too have the oceans. IPCC AR6 found, with high confidence, that approximately 91% of the extra heat added to the climate system had been added to the ocean.115 The total ocean heat content has increased substantially, and ocean surface temperature has increased, on average, by 0.88 [0.68–1.01] °C since preindustrial times. It is extremely likely that human influence is the primary driver of ocean warming.116
Sea-level rise: Global sea levels have risen as a result of the melting of land-based ice and the increase in ocean heat content (since warmer waters occupy more volume from thermal expansion). Global mean sea level increased by 0.20 [0.15–0.25] meters between 1901 and 2018, and the rate of sea-level rise has been accelerating since the 1990s.117 It is very likely that human influence was the main driver of these increases, at least since 1971.118
Ocean deoxygenation: Ocean deoxygenation (oxygen decline) is another consequence of ocean warming (the solubility of dissolved oxygen decreases as sea water becomes warmer). There is high confidence that oxygen levels have dropped in many upper ocean regions since the mid-20th century, and medium confidence that human-induced ocean warming contributed to this drop.119
Ocean acidification: Researchers estimate that the surface ocean has absorbed approximately one quarter of all human CO2 emissions,120 causing the pH of the ocean surface to decrease. Researchers are virtually certain that human-caused CO2 emissions are the main driver of ocean acidification.121
Cryosphere: There has been a substantial decline in sea ice, terrestrial glaciers, and snowpack in the past century, with considerable geographic variation in the magnitude and rate of decline. For example, IPCC AR6 concluded that (1) there has been a substantial reduction in Arctic sea ice over the period of 1979–2019, and in 2011–2022, average annual Arctic sea ice reached its lowest
115. This is consistent with the IPCC’s prior assessment (AR5), in which it found that approximately 90% of the accumulated energy from human-induced climate change was stored within the oceans. See IPCC AR6 WGI, supra note 6, at 283 (comparing statements from AR5 and AR6).
116. Id. at 5, 1214.
117. Id.
118. Id.
119. Id. at 5, 714.
120. Id. at 714.
121. Id. at 5.
level since at least 1850 (high confidence); (2) there have also been substantial reductions in ice sheets: between 1992 and 2020, the Greenland ice sheet lost 4,890 [4,180–5,640] billion metric tons of mass, and the Antarctic ice sheet lost 2,670 [1,800–3,540] billion metric tons of mass; (3) glaciers lost 6,200 [4,600–7,800] billion metric tons of mass between 1993 and 2019 (very high confidence), and glaciers lost more mass in 2010–2019 than in any other decade since the beginning of the observational record (very high confidence); (4) permafrost temperatures have been increasing around the world (high confidence) resulting in permafrost thaw in some regions (medium confidence); and (5) Northern Hemisphere spring snow cover has decreased since 1978 (very high confidence), and Northern Hemisphere spring snow cover has likely decreased since 1950 (high confidence).122
Hydrological cycle and precipitation: Ascertaining the effect of anthropogenic forcings on the hydrologic cycle and precipitation is one of the more challenging areas of climate change attribution,123 but there is evidence that the global hydrological cycle is intensifying as a result of anthropogenic climate change. IPCC AR6 expressed high confidence that climate change has contributed to an overall increase in atmospheric moisture content (i.e., water vapor) as well as precipitation intensity.124 Scientists also expect that global warming will cause an overall increase in global precipitation,125 but this “has not yet been detected and attributed to human activities given large observational uncertainties and low signal-to-noise ratio.”126 There is evidence that climate change is causing regional increases or decreases in average precipitation, with some areas becoming wetter and others becoming more arid.127 Increases in the frequency and intensity of heavy precipitation events have also been attributed to human influence.128
122. Id. at 1215–16.
123. Part of the challenge is detecting change—spatial gradients of precipitation can be quite large in some regions, and historical rainfall records are incomplete and contain mixed findings about the extent to which precipitation patterns have (or have not) changed since the preindustrial era. It is also difficult to attribute precipitation changes to human influence on climate because precipitation is characterized by large natural variability across a range of timescales, ranging from the intra-annual to the centennial.
124. IPCC AR6 WGI, supra note 6, at 1057, 1080–81. It is also extremely likely that climate change has driven more evaporation over the oceans, which contributes to increased water vapor as well as heavier precipitation. Id. at 1080.
125. Id. § 8.2.1.
126. Id. at 1079.
127. Id. at 1057. See also WMO (2022), supra note 62 (finding that many of the world’s regions experienced above-normal precipitation in 2022, without specifying the extent to which this trend is attributable to anthropogenic climate forcing).
128. IPCC AR6 WGI, supra note 6, at 8.
Extreme Event Detection and Attribution
There are multiple pathways through which climate change can influence the intensity, duration, frequency, and other characteristics of extreme events. A warmer climate increases the probability and frequency of very hot days and nights, thus contributing to heat waves. A warmer climate also contributes to increased land evaporation and drier conditions, potentially increasing the severity of droughts and wildfire conditions. The intensification of the global hydrological cycle and increases in atmospheric moisture content contribute to more severe precipitation events. Increases in atmospheric moisture content and heat, coupled with increases in sea-surface and ocean temperature, also contribute to more severe tropical cyclones. All things being equal, more heat in the climate system corresponds with more energy to power storms, since atmospheric heat can be converted into kinetic energy (e.g., in the form of high winds).
Methods and parameters
An “extreme” weather or climate event is defined by the IPCC as “the occurrence of a value of a weather or climate variable above (or below) a threshold value near the upper (or lower) ends (tails) of the range of observed values of the variable.”129 Attribution of extremes tends to be more challenging than attribution of means for several reasons: (1) the local nature and short duration of any extremes makes them more difficult to model given the coarse resolution of climate models, (2) the relative rarity of extreme events at a given location makes it more difficult to detect and attribute a climate change “signal” amid the large “noise” of internal variability, and (3) the causal chains for extremes can be quite complicated (e.g., highly nonlinear).130 There are also some modeling challenges relevant to extreme-event attribution. For example, models may be too Gaussian in their extreme events (i.e., they don’t produce enough of them).131 Scientists
129. Id. at 111.
130. Sebastian Sippel et al., Warm Winter, Wet Spring, and an Extreme Response in Ecosystem Functioning on the Iberian Peninsula, in BAMS 2016, supra note 101, at S80, https://doi.org/10.1175/BAMS-D-17-0135.1 (citing Dorothea Frank et al., Effects of Climate Extremes on the Terrestrial Carbon Cycle: Concepts, Processes and Potential Future Impacts, 21 Glob. Climate Change Biology 2861 (2015), https://doi.org/10.1111/gcb.12916, and John A. Arnone III et al., Prolonged Suppression of Ecosystem Carbon Dioxide Uptake After an Anomalously Warm Year, 455 Nature 383 (2008), https://doi.org/10.1038/nature07296).
131. Bo Christiansen, The Role of the Selection Problem and Non-Gaussianity in Attribution of Single Events to Climate Change, 28 J. Climate 9873 (2015), https://doi.org/10.1175/JCLI-D-15-0318.1. “Gaussian” refers to having the shape of a normal curve or normal distribution, and extreme events may not adhere to a Gaussian distribution. A normal distribution is characterized by a relatively large frequency of values near the mean, with a relatively small frequency of values far from the mean.
have devised statistical approaches to avoid the problems and limitations associated with climate models, but these approaches rely on simplifying assumptions.132 Despite these complicating factors, extreme-event studies can generate reliable results for many extreme events, though confidence in attribution findings depends on the type of extreme and the location.
The results of extreme-event studies are sensitive to how the research question is framed, and what methodological approaches and datasets are used. Some studies focus on individual events; others deal with a class of events over a time frame (e.g., the 2020 North Atlantic hurricane season).133 One critical framing question is how to define the event parameters for the purposes of the study. These parameters include the physical threshold for the extreme event (e.g., a certain temperature threshold for a heat wave) as well as the time frame and spatial scale for the study. There are often multiple metrics that could be used for any given event—for example, a heat wave could be defined based on absolute maximum temperature, average maximum temperature over a duration of time, or a combination of temperature and humidity. These framing decisions can affect the results of the study. For example, if researchers were to use the maximum temperature during a heat wave as the temperature threshold, and then focus their analysis on the location that reached the highest temperature during the event, the heat wave may appear more exceptional (or “extreme”) than if the temperature and spatial scale were selected in a more generic way. This is an example of how event framing could introduce selection bias into an attribution study. This is not an insurmountable obstacle—for example, efforts are underway to standardize how extreme events are defined and selected for analysis, and this would have the added benefit of facilitating more systematic comparison between extreme-event studies.134
As discussed earlier in this reference guide, there are also different approaches to attribution.135 Some studies use a probabilistic or risk-based approach, examining whether and to what extent climate change increased the probability (or risk) of an extreme event. Other studies use a storyline or mechanistic approach, examining how a well-understood aspect of climate change may have affected
132. NASEM (2016), supra note 91; Christiansen, supra note 131.
133. See, e.g., Kevin A. Reed et al., Attribution of 2020 Hurricane Season Extreme Rainfall to Human-Induced Climate Change, 13 Nature Commc’ns 1 (2022), https://doi.org/10.1038/s41467-022-29379-1.
134. NASEM (2016), supra note 91.
135. Although many extreme-event attribution studies clearly fall within one of these two categories, there are also some other approaches in the literature. As one example, Mann et al. suggested a modification to traditional frequentist statistical inference approach, that builds in prior physical understanding and updates based on experience. Michael E. Mann et al., Assessing Climate Change Impacts on Extreme Weather Events: The Case for an Alternative (Bayesian) Approach, 144 Climatic Change 131 (2017), https://doi.org/10.1007/s10584-017-2048-3.
the magnitude and/or other characteristics of an extreme event. Both approaches have benefits and drawbacks.
In probabilistic studies, researchers evaluate the likelihood of a narrowly defined climatological extreme (e.g., a temperature of 95°F) occurring with and without human influence on the climate system. This is typically accomplished by using climate models to run two types of simulations: one that represents the world as it is and another that represents a hypothetical world without anthropogenic climate forcing. Researchers will then evaluate the probability of the extreme occurring in both simulations. The results are often expressed in terms of the relative risk of the extreme occurring with and without human influence on climate, which may be expressed using a risk ratio, which is the ratio of the probability of an event occurring with and without climate change,136 or fraction of attributable risk (FAR). In mathematical terms:137
FAR = 1 − P0/P1
P1 equals the probability of a climatic event (such as a heat wave) occurring in the presence of anthropogenic forcing of the climate system, and P0 equals the probability of the event occurring if the anthropogenic forcing were not present. If FAR equals zero, it means that anthropogenic climate change had no effect on the probability of the event occurring; if FAR equals one, it means that the event could not have happened in the absence of anthropogenic climate change; if FAR equals 0.5, it means that anthropogenic climate change doubled the probability of the event occurring. In multi-event studies, a FAR of 0.5 can be interpreted as meaning that half of the events would not have happened in a world without anthropogenic climate change.138
This approach was pioneered by Myles Allen in a 2003 study in which he introduced the concept of FAR as a potential basis for liability for climate damages.139 Many other studies have since replicated Allen’s approach, estimating the FAR for a range of extreme events including heat waves, droughts, and floods. This methodology derives from common approaches used in epidemiological
136. Multiple risk ratios may also be used to express probabilities of occurrence at varying levels of climate change or global warming, See, e.g., V.V. Kharin et al., Risks from Climate Extremes Change Differently from 1.5°C to 2.0° Depending on Rarity, 6 Earth’s Future 704 (2018), https://doi.org/10.1002/2018EF000813.
137. IPCC, Climate Change 2007, supra note 48; Myles Allen, Liability for Climate Change, 421 Nature 891 (2003), https://doi.org/10.1038/421891a.
138. While the term FAR is typically used in extreme-event attribution, probabilistic analysis is prevalent across all forms of attribution, and the concept of attributable risk can in principle be applied to both mean changes in climate and a variety of climate impacts. See, e.g., Thomas Knutson et al., CMIP5 Model-Based Assessment of Anthropogenic Influence on Record Global Warmth During 2016, in BAMS 2016, supra note 101, at S11.
139. Allen, supra note 137.
studies and other risk-focused research. The advantages of this approach are that it is relatively well established, understood, and accepted by the scientific community,140 and it provides quantitative (probabilistic) findings similar to those that are often dealt with by policy makers, planners, and courts. Drawbacks include: (1) overreliance on climate models, which as noted earlier may not be able to simulate some types of extremes with fidelity in a baseline climate, and could have blind spots with respect to how climate change may be modifying key processes influencing the extreme event, and (2) susceptibility to Type II errors (i.e., false negatives), where the signal-to-noise ratio for an event is small because of large internal variability of the atmosphere, which is often the case for dynamically driven events such as extreme precipitation and storms.141 Thus the probabilistic approach, like all approaches, is an imperfect measure of the precise degree to which anthropogenic influence has increased the likelihood of an event.
The mechanistic or storyline approach, introduced by Trenberth et al. (2015),142 focuses on how anthropogenic forcing may have modified the characteristics of a given event, like a regional heat wave. This involves reconstructing the causal chain of events that resulted in the extreme event, typically focusing on a few central causal factors to establish attribution.143 Mechanistic studies tend to focus on the relationship between the observed event and well-understood components of climate change, such as warming temperatures and thermodynamics. Because of this, mechanistic studies can generate higher confidence statements with regard to those specific components. The results of this analysis may be quantitative or qualitative—for example, “warming of the upper ocean and atmosphere enabled more rainfall during event Y than otherwise would have occurred” or “caused a 30% increase in rainfall over what would have occurred.”
As with the probabilistic approach, there are advantages and drawbacks to the mechanistic approach. The chief advantages are that the mechanistic approach provides additional insights on how climate change is affecting physical characteristics of extreme events, and it allows for higher confidence attribution regarding the influence of certain aspects of climate change on certain types of events. But there are also criticisms of this approach, as articulated by Otto (2016).144 First, mechanistic studies may not have the same broad relevance as probabilistic studies because they focus on how climate change has influenced
140. See NASEM (2016), supra note 91, at 3.
141. Kevin E. Trenberth et al., Attribution of Climate Extreme Events, 5 Nature Climate Change 725 (2015), https://doi.org/10.1038/nclimate2657.
142. Id.
143. Lloyd & Shepherd, supra note 71; Linda van Garderen et al., A Methodology for Attributing the Role of Climate Change in Extreme Events: A Global Spectrally Nudged Storyline, 21 Nat. Hazards & Earth Sys. Scis. 171 (2021), https://doi.org/10.5194/nhess-21-171-2021.
144. Friederike E.L. Otto et al., The Attribution Question, 6 Nature Climate Change 813 (2016), https://doi.org/10.1038/nclimate3089.
the specific characteristics of a particular event (whereas the findings from probabilistic studies are more easily applied to a class of events—e.g., all heat waves with temperatures above a certain threshold in a region). Second, it is an oversimplification to assume that some aspects of the climate system (and climate change) are well understood and others are not—rather, there is a gradient of understanding across the various components of the climate system, and that understanding is constantly evolving with new research.145 Neglecting certain aspects of or processes within the climate system can render these studies incomplete.146
While there is some debate about the relative merits of these two approaches, the reality is that they are complementary—they each provide different insights on the effect of anthropogenic climate change on extreme events, and one approach can be used to fill gaps where the other is unsuitable. For example, the probabilistic/risk-based approach may be more justifiable for analyzing all events above or below a certain threshold, for a class of events that are relatively well simulated by climate models (e.g., temperature extremes), whereas the storyline approach may be more appropriate for complex, iconic, multivariate events.147
Status of research
In early IPCC assessments, scientists recognized that climate change would affect the frequency, intensity, spatial extent, duration and timing of weather and climate extremes, but there was low confidence in the attribution of specific extreme events to human influence on climate.148 Since then, scientific
145. For example, Michael E. Mann notes that dynamical changes with warming are starting to come into focus: more specifically, a growing body of work based on observations and simple models supports the idea that the latitudinal pattern of mean temperature changes (including Arctic amplification) may facilitate changes in atmospheric dynamics that increase wave resonance and “stuck” weather, which enhances the magnitude and duration of extremes. It should be noted that global climate models generally do not reproduce this pattern of wave resonance and “stuck” weather with warming. Michael E. Mann et al., Influence of Anthropogenic Climate Change on Planetary Wave Resonance and Extreme Weather Events, 7 Sci. Reps. 45242 (2017), https://doi.org/10.1038/srep45242.
146. More specifically, focusing on thermodynamics—but not dynamics—within the climate system can result in an incomplete analysis, in part because of the failure to capture interactions between thermodynamics and dynamics. Otto shows how the dynamics and thermodynamics counteracted each other in 2013 German floods. See Otto et al., supra note 144, at 815. Similarly, a study in Western Australia found dynamics/circulation changes that favor less rain, but thermodynamic (specifically sea surface temperature) changes that favor increase in rain. Thomas L. Del-worth & Fanrong Zeng, Regional Rainfall Decline in Australia Attributed to Anthropogenic Greenhouse Gases and Ozone Levels, 7 Nature Geoscience 583 (2014), https://doi.org/10.1038/ngeo2201.
147. Elisabeth A. Lloyd & Naomi Oreskes, Climate Change Attribution: When Is It Appropriate to Accept New Methods?, 6 Earth’s Future 311 (2018), https://doi.org/10.1002/2017EF000665.
148. See IPCC TAR WGI, supra note 102, at ch. 3.
confidence in extreme-event attribution has advanced significantly as a result of “better physical understanding of processes, an increasing proportion of the scientific literature combining different lines of evidence, and improved accessibility to different types of climate models (high confidence).”149 IPCC AR6 noted that the evidence of observed changes in extremes such as heat waves, heavy precipitation, droughts, and tropical cyclones, and their attribution to climate change, had strengthened since AR5.150 According to IPCC AR6, it is “now an established fact that human-induced greenhouse gas emissions have led to an increased frequency and/or intensity of some weather and climate extremes,” particularly temperature extremes.151
The following paragraphs provide a summary of recent attribution findings for different classes of extreme events, drawing primarily on IPCC AR6 and findings from the U.S. Fifth National Climate Assessment (NCA5).
Extreme heat: An increase in the magnitude, frequency, and duration of extreme heat events is a direct and foreseeable consequence of a warming climate.152 NCA5 concluded, with very high confidence, that the frequency and intensity of extreme heat events are increasing in most continental regions of the world, consistent with expected physical responses to a warming climate.153 IPCC AR6 similarly found that it is “virtually certain that hot extremes (including heatwaves) have become more frequent and more intense across most land regions since the 1950s,” and there is “high confidence that human-induced climate change is the main driver of these changes.”154 Moreover, “[s]ome recent hot extremes observed over the past decade would have been extremely unlikely to occur without human influence on the climate system.”155 Importantly, climate change is not only contributing to extreme heat events over land—according to IPCC AR6, marine heat waves have “approximately doubled in frequency since the 1980s (high confidence) and human influence has very likely contributed to most of them since at least 2006.”156 The USGCRP and IPCC findings are consistent with a growing number of studies on extreme heat and climate change, many of which have demonstrated a very strong anthropogenic signal in such events.157
149. IPCC AR6 WGI, supra note 6, at 1517. See also NASEM (2016), supra note 91 (discussing advances in extreme-event attribution).
150. IPCC, AR6 Synthesis Report: Climate Change 2023, https://perma.cc/PBK3-NMUD.
151. IPCC AR6 WGI, supra note 6, at 1517.
152. These core characteristics of extreme heat events (magnitude, duration, frequency) are all highly sensitive to changes in mean temperatures. Radley M. Horton et al., A Review of Recent Advances in Research on Extreme Heat Events, 2 Current Climate Change Reps. 242 (2016), https://doi.org/10.1007/s40641-016-0042-x.
153. NCA5, supra note 106, at 2–38; NCA4 Vol. I, supra note 6, at 19.
154. IPCC AR6 WGI, supra note 6, at 8.
155. Id.
156. Id.
157. See, e.g., Peter Stott et al., Human Contribution to the European Heatwave of 2003, 432 Nature 610 (2004), https://doi.org/10.1038/nature03089; Noah S. Diffenbaugh et al., Quantifying
Droughts and aridity: Although warmer temperatures are one relatively well-understood factor that can contribute to droughts, it is more challenging to isolate the effect of anthropogenic climate change on dryness and drought conditions. Droughts are highly complex meteorological events with many different factors affecting their likelihood, severity, duration, and other characteristics, and there is significant natural variability in precipitation, which makes it difficult to identify the anthropogenic signal through the noise of variability.158 However, researchers have identified evidence of an anthropogenic signal in the heat-related aspects of drought (e.g., increased evapotranspiration) and have been able to estimate the extent to which warmer temperatures have intensified drought conditions.159 Based on this research, IPCC AR6 expressed medium confidence that human-induced climate change had contributed to ecological and agricultural droughts in some regions due to increased land evapotranspiration.160 IPCC AR6 did not find clear evidence that anthropogenic climate change was causing an increase in meteorological or hydrological droughts in most regions
the Influence of Global Warming on Unprecedented Extreme Climate Events, 114 PNAS 4881 (2017), https://doi.org/10.1073/pnas.1618082114; Yukiko Imada et al., Climate Change Increased the Likelihood of the 2016 Heat Extremes in Asia, in BAMS 2016, supra note 101, at S97, https://doi.org/10.1175/BAMS-D-17-0109.1; John Walsh et al., The High Latitude Marine Heat Wave of 2016 and Its Impacts on Alaska, in BAMS 2016, supra note 101, at S39, https://doi.org/10.1175/BAMS-D-17-0105.1; S.E. Perkins-Kirkpatrick et al., The Role of Natural Variability and Anthropogenic Climate Change in the 2017/18 Tasman Sea Marine Heatwave, 100 Bull. Am. Meteorological Soc’y S105 (2019), https://doi.org/10.1175/BAMS-D-18-0116.1; Alexander Robinson et al., Increasing Heat and Rainfall Extremes Now Far Outside the Historical Climate, 4 NPJ Climate & Atmospheric Sci. 45 (2021), https://doi.org/10.1038/s41612-021-00202-w.
158. There are several different types of droughts recognized in the literature, including: (1) meteorological droughts, which are defined by the degree and duration of dryness or rainfall deficit (in comparison to a normal or average amount); (2) hydrological droughts, which are defined by the impact of dryness and rainfall deficits on water supplies such as lakes, rivers, streams, reservoirs, and aquifers; (3) agricultural droughts, which are defined by the effect of dryness and rainfall deficits on agricultural systems; and (4) ecological droughts, which are defined by the effect of dryness and rainfall deficits on ecosystems. Attribution for hydrological droughts is particularly challenging becaue of the complexity of these events, limited data about historical trends, and the fact that human water consumption and management decisions are leading mechanisms behind such droughts (potentially making it harder to detect a climate change signal). See IPCC AR6 WGI, supra note 6, at 1576–78.
159. See, e.g., T.R. Marthews et al., The 2014 Drought in the Horn of Africa: Attribution of Meteorological Drivers, in Explaining Extreme Events of 2014 from a Climate Perspective, 96 Bull. Am. Meteorological Soc’y S1, S83 (2015), https://doi.org/10.1175/BAMS-D-15-00115.1 [hereinafter BAMS 2014]. See also Eduardo S.P.R. Martins et al., A Multimethod Attribution Analysis of the Prolonged Northeast Brazil Hydrometeorological Drought (2012–16), in BAMS 2016, supra note 101, at S65, https://doi.org/10.1175/BAMS-D-17-0102.1; Xing Yuan et al., Anthropogenic Intensification of Southern African Flash Droughts as Exemplified by the 2015/16 Season, in BAMS 2016, supra note 101, at S86, https://doi.org/10.1175/BAMS-D-17-0077.1; Chris Funk et al., Anthropogenic Enhancement of Moderate-to-Strong El Niño Events Likely Contributed to Drought and Poor Harvests in Southern Africa During 2016, in BAMS 2016, supra note 101, at S91, https://doi.org/10.1175/BAMS-D-17-0112.1.
160. IPCC AR6 WGI, supra note 6, at 8.
of the world; however, it did express medium confidence that precipitation deficits had increased in several regions across all continents.161
Extreme precipitation: The IPCC and NCAs have both found clear evidence that heavy rainfall events are increasing around the world and in the United States, and this is generally consistent with expected physical responses to a warming climate.162 IPCC AR6 specifically found that the “frequency and intensity of heavy precipitation events have increased since the 1950s over most land areas for which observational data are sufficient for trend analysis (high confidence), and human-induced climate change is likely the main driver.”163 This is another area where there have been significant advances in detection and attribution research: whereas IPCC AR5 only expressed medium confidence in the attribution of extreme precipitation events, IPCC AR6 found that there was “new and robust evidence of human influence on extreme precipitation.”164
The IPCC’s assessment relates to an overall increase in extreme precipitation at a global scale, but there are important regional and seasonal variations in rainfall. The dynamic nature of extreme precipitation events and the large internal variability in precipitation can make it more difficult to attribute specific events to climate change. The storyline approach to attribution was developed in part to improve attribution for difficult-to-model events like extreme precipitation. Researchers used this approach to examine the effect of anthropogenic climate change on the 2013 floods in Boulder, Colorado, and found that anthropogenic drivers increased the magnitude of the rainfall for that week by approximately 30%.165 The scientists also conducted a probabilistic analysis of potential impacts on flooding and found that this 30% increase in rainfall approximately doubled the likelihood of flood-inducing rainfall occurring during that event. In contrast, researchers using the probabilistic approach to attribution of the Boulder floods found no evidence that anthropogenic climate change had increased the probability of the event occurring.166 This underscores the sensitivity of results to methodological choices made in extreme-event attribution.
161. Id.
162. See NCA4 Vol. I, supra note 6, at 19; IPCC AR6 WGI, supra note 6, at 8. The USGCRP has also found “robust evidence that human-caused warming has contributed to increases in the frequency and severity of the heaviest precipitation events across nearly 70% of the [United States].” NCA5, supra note 106, at 2–18.
163. IPCC AR6 WGI, supra note 6, at 8.
164. Id. at 1562.
165. Pardeep Pall et al., Diagnosing Conditional Anthropogenic Contributions to Heavy Colorado Rainfall in September 2013, 17 Weather & Climate Extremes 1 (2017), https://doi.org/10.1016/j.wace.2017.03.004.
166. See Martin Hoerling et al., Northeast Colorado Extreme Rains Interpreted in a Climate Change Context, 95 Bull. Am. Meteorological Soc’y S1, S15 (2014), https://perma.cc/6BLT-BXTZ.
Tropical and extratropical cyclones: Physical understanding suggests that tropical cyclones will become more severe in a warmer climate.167 Cyclones derive energy from sea surface temperature, and warmer sea surface temperatures, all other things being equal, will increase the intensity of storms (in terms of wind speed, precipitation, and storm surge).168 A warmer ocean also produces more evaporation, and a warmer atmosphere holds more moisture, thus contributing to heavier rainfall and flooding. IPCC AR6 expressed high confidence that anthropogenic climate change had contributed to increases in heavy precipitation associated with tropical cyclones169 and that it was likely that the global portion of major (Category 3–5) tropical occurrences had increased over the past four decades.170 There is more uncertainty about the effect of a warming climate on extratropical cyclone activity.171 Few attribution studies have found a discernible anthropogenic influence on extratropical cyclones because of factors such as large interannual-to-decadal variability in such cyclones,172 and thus the IPCC has expressed low confidence in the detection and attribution of changes in extratropical cyclones.173 However, since research was compiled for IPCC AR6, there have been some studies finding that anthropogenic forcings likely have contributed to more severe extratropical cyclones.174
Compound extremes: Compound extreme events are those that occur because of the interaction of multiple climate-related extremes. While multiple typologies of compound extremes have been identified, including sequences of events, and simultaneous events in multiple regions,175 we focus here on the most studied category: multivariate (multivariable) extreme events at a single time and location. Examples include fire weather conditions (a combination of hot, dry, and windy conditions), compound flooding (e.g., flooding caused by a
167. See IPCC AR6 WGI, supra note 6, at 70 (“The proportion of tropical cyclones that are intense is expected to increase (high confidence), but the total global number of tropical cyclones is expected to decrease or remain unchanged (medium confidence).”). Some of the other factors that can influence tropical cyclones include aerosols and dust, wind shear, temperatures in the upper atmosphere, and wave disturbances.
168. See, e.g., Sally L. Lavender et al., The Influence of Sea Surface Temperature on the Intensity and Associated Storm Surge of Tropical Cyclone Yasi: A Sensitivity Study, 18 Nat. Hazards & Earth Sys. Scis. 795 (2018), https://doi.org/10.5194/nhess-18-795-2018.
169. IPCC AR6 Synthesis Report, supra note 150, at 51; IPCC AR6 WGI, supra note 6, at 67 (Table TS.2).
170. IPCC AR6 WGI, supra note 6, at 9, 67 (Table TS.2).
171. Id. at 70.
172. See, e.g., Frauke Feser et al., Hurricane Gonzalo and Its Extratropical Transition to a Strong European Storm, in BAMS 2014, supra note 159, at S51, https://doi.org/10.1175/BAMS-D-15-00122.1.
173. IPCC AR6 WGI, supra note 6, at 70, 338.
174. See, e.g., Mireia Ginesta et al., A Methodology for Attributing Severe Extratropical Cyclones to Climate Change Based on Reanalysis Data: The Case Study of Storm Alex 2020, 61 Climate Dynamics 229 (2023), https://doi.org/10.1007/s00382-022-06565-x.
175. Jakob Zscheischler et al., A Typology of Compound Weather and Climate Events, 1 Nature Revs. Earth & Env’t 333 (2020), https://doi.org/10.1038/s43017-020-0060-z.
combination of storm surge and heavy rainfall, or rapid snowmelt and heavy rainfall), and concurrent heat waves and droughts.176 Scientific understanding of anthropogenic influence on such events largely depends on understanding of the various component events. IPCC AR6 found that human influence has likely increased the probability of various compound extreme events since the 1950s.177 There is high confidence that anthropogenic climate change has increased the frequency of concurrent heat waves and droughts on a global scale and medium confidence that it has increased the frequency of fire weather and compound flooding in some regions.178 There is also high confidence that regions and connected sectors will experience multiple regional extreme events at the same time,179 placing greater stress on both human and natural systems.180
Impact Detection and Attribution
Many of the processes and phenomena described in the sections above could be characterized as “impacts” of climate change (e.g., sea-level rise, more severe extreme events). However, for the purposes of this reference guide, we use the term “impact attribution” to describe research on the effects of climate change on humans and ecosystems. This is consistent with the approach taken in recent IPCC assessments, specifically the division between Working Group I (WGI), which synthesizes research on the physical science basis for anthropogenic climate change, and Working Group II (WGII), which synthesizes research on the impacts of climate change.181
176. See IPCC AR6 WGI, supra note 6, at 9 n.18.
177. Id. at 9.
178. Id. Research published after AR6 has identified a strong causal association between climate change and increases in fire weather in some regions. See, e.g., Zhongwei Liu et al., The April 2021 Cape Town Wildfire: Has Anthropogenic Climate Change Altered the Likelihood of Extreme Fire Weather?, 104 Bull. Am. Meteorological Soc’y E298 (2023), https://doi.org/10.1175/BAMS-D-22-0204.1; Michael Goss et al., Climate Change Is Increasing the Likelihood of Extreme Autumn Wildfire Conditions Across California, 15 Env’t Rsch. Letters 094016 (2020), https://doi.org/10.1088/1748-9326/ab83a7; Simon F.B. Tett et al., Anthropogenic Forcings and Associated Changes in Fire Risk in Western North America and Australia During 2015/16, in BAMS 2016, supra note 101, at S60, https://doi.org/10.1175/BAMS-D-17-0096.1.
179. IPCC AR6 WGI, supra note 6, at 135.
180. See section titled “Impact Detection and Attribution.”
181. See IPCC, Climate Change 2022: Impacts, Adaptation, and Vulnerability, Working Group II Contribution to the Sixth Assessment Report of the IPCC 2912 (Hans Otto Pörtner, et al. eds., 2022), https://perma.cc/VL7D-TMET [hereinafter IPCC AR6 WGII] (the term “impacts” refers to the effects of climate change on “natural and human systems” including effects on “lives, livelihoods, health and well-being, ecosystems and species, economic, social and cultural assets, services (including ecosystem services), and infrastructure”).
Impact attribution deals with the consequences and outcomes that are most relevant in legal discourse and litigation—specifically, the question of who will be harmed by climate change and to what extent.182 Impact attribution deals with consequences that are further along the causal chain, and this adds a layer of complexity to the attribution analysis. Nonetheless, there are many impacts that have been attributed to anthropogenic climate forcing with a high level of confidence and certainty.
Methods and parameters
As with other areas of detection and attribution, researchers use physical understanding, observational data, statistical analysis, and climate models to detect and attribute impacts to anthropogenic climate forcing. However, as discussed earlier in this reference guide, there are some unique challenges associated with impact attribution.183 In particular, impact attribution researchers must account for a larger number of exogenous variables and processes (i.e., those not related to the climate system) that influence the impact being studied. For example, in order to attribute monetary damages or human casualties from an extreme event to anthropogenic climate change, researchers must account for other factors that contributed to those damages. Data on these exogenous variables and processes may be limited, thus contributing to uncertainty about the relative roles of climate change and other drivers in explaining an observed impact. Furthermore, in most cases there is not a linear cause-and-effect relationship between changes in the climate system and specific impacts on humans and ecosystems. Each additional degree of warming may cause far more damage than the previous degree of warming, and climate change impacts on human and ecosystems may feed back on the climate in complex ways (for example, irrigation of crops in response to extreme temperature may itself impact temperature). Some of the challenges associated with extreme-event attribution also apply to impact attribution (potentially to an even greater extent)—for example, the spatial and temporal scale of an impact may be too fine to capture with existing climate or sectoral impact models.
Nonetheless, researchers can draw fairly robust conclusions about the general causal connection between climate change and many types of impacts, and in some cases, it is possible to quantify the contribution of anthropogenic forcing to specific damages, harms, and economic and noneconomic losses.184 The use of fixed-effect regression methods to infer causation in large datasets, initially for
182. See Burger et al., supra note 77, at 111.
183. See section titled “Challenges Associated with Downscaling and Exogenous Variables” above.
184. IPCC AR6 WGII, supra note 181, at 8.
microeconomic applications, has been particularly noteworthy.185 For example, researchers have developed techniques for estimating the proportion of monetary damages incurred during an extreme event that is attributable to climate change186 and the public health impacts attributable to climate change.187 Qualitative analyses can also provide valuable insights, including explanations of the processes and mechanisms by which climate change is affecting a particular system or outcome.188 Qualitative analyses can be used where there are exogenous and confounding variables that would impede precise quantification of impacts associated with climate change.
Status of research
In recent assessments, the IPCC has found increasingly robust evidence of substantial and wide-ranging impacts of climate change across all climate zones and continents. In particular, observed increases in the frequency and intensity of climate and weather extremes have caused “widespread, pervasive impacts to ecosystems, people, settlements, and infrastructure” (high confidence).189 Slow-onset processes, such as increases in atmospheric and ocean temperatures, ocean acidification, sea-level rise, and regional decreases in average precipitation have also affected human and natural systems across the world (high confidence).190 Some of the impacts that have been attributed to anthropogenic climate forcing include increases in heat-related human mortality (medium confidence), coral bleaching and mortality (high confidence), increased drought-related tree mortality (high confidence), increases in areas burned by wildfires (medium to high confidence, depending on the region), and increases in storm-related losses and damages due to sea-level rise and increases in heavy precipitation (medium confidence).191 These impacts are disproportionately affecting “the most vulnerable people and
185. See, e.g., Christopher W. Callahan & Justin S. Mankin, National Attribution of Historical Climate Damages, 172 Climatic Change 1 (2022), https://doi.org/10.1007/s10584-022-03387-y. For a broader review of climate econometrics, see Solomon Hsiang, Climate Econometrics, 8 Ann. Rev. Res. Econ. 43 (2016), https://perma.cc/EG9G-G7ZA.
186. See, e.g., Benjamin H. Strauss et al., Economic Damages from Hurricane Sandy Attributable to Sea Level Rise Caused by Anthropogenic Climate Change, 12 Nature Commc’ns 2720 (2021), https://doi.org/10.1038/s41467-021-22838-1; Frame et al., supra note 101.
187. See, e.g., Kristie L. Ebi et al., Using Detection and Attribution to Quantify How Climate Change Is Affecting Health, 39 Health Affs. 2168 (2020), https://doi.org/10.1377/hlthaff.2020.01004.
188. See, e.g., Tom H. Oliver & Mike D. Morecroft, Interactions Between Climate Change and Land Use Change on Biodiversity: Attribution Problems, Risks, and Opportunities, 5 WIREs Climate Change 317 (2014), https://doi.org/10.1002/wcc.271.
189. IPCC AR6 WGII, supra note 181, at 9.
190. Id.
191. Id.
systems” across different regions, and some natural and human systems have been “pushed beyond their ability to adapt” (high confidence).192
Ecosystems, species, and ecological indicators: There is robust evidence that climate change is adversely affecting ecosystems and species in every region of the world, and the extent and magnitude of these impacts are larger than estimated in previous assessments. IPCC AR6 found, with high confidence, that climate change has caused “substantial damage, and increasingly irreversible losses, in terrestrial, freshwater and coastal and open marine ecosystems.”193 Some ecosystems are already “reaching or surpassing hard adaptation limits,” including warm-water coral reefs, some coastal wetlands, some rainforests, and some polar and mountain ecosystems (high confidence).194 Climate change is also leading to changes in the geographic distribution of some species and the spread of insect pests and invasive species. Climate-change-fueled ecosystem deterioration is having “adverse socioeconomic consequences” on the communities and sectors that depend on these ecosystems (high confidence).195 For example, impacts on marine ecosystems affect fisheries’ health and productivity, and phenological changes associated with climate change, such as longer growing seasons, affect agriculture and food-production systems.
Physical impacts of extreme weather: Many attribution studies straddle the line between extreme-event and impact attribution, examining the effect of anthropogenic forcing on climatological extremes (e.g., heavy precipitation) and corresponding physical hazards (e.g., floods). In some cases, the effect of climate change on physical hazards is quite clear. For example, IPCC AR6 expressed high confidence that sea-level rise has contributed to increased coastal flooding in low-lying areas.196 However, there is less certainty regarding how climate change is affecting inland flooding conditions, owing to the many different factors (both climatological and nonclimatological) that influence river hydrology and flood conditions. Research has also demonstrated a robust link between increased “wildfire weather” caused by climate change and more severe wildfires (e.g., increases in fuel aridity and acres burned) as a result of the strong effect of hotter, drier conditions on wildfire behavior.197
Food and water security: Climate change has impaired food and water security in many regions of the world as a result of both slow-onset phenomena and extreme events.198 Some of the slow-onset phenomena with the largest
192. Id.
193. Id.
194. Id. at 26.
195. Id. at 9.
196. IPCC AR6 WGI, supra note 6, at 120.
197. See, e.g., John T. Abatzoglou & A. Park Williams, Impact of Anthropogenic Climate Change on Wildfire Across Western US Forests, 113 PNAS 11770 (2016), https://doi.org/10.1073/pnas.1607171113.
198. IPCC AR6 WGII, supra note 181, at 9; ch. 4 (551–712).
impacts on food and water security include increasing temperatures, desertification, decreasing precipitation, land and forest degradation, and loss of biodiversity and ecosystem function. Extreme events such as acute droughts, floods, storms, and heat waves can also cause acute food and water stress (e.g., when drinking water systems are contaminated during storms). The effect of climate change on food and water security is evident across most regions of the world, particularly with respect to fisheries’ yield and aquaculture production.199
Public health and well-being: Attribution of public health outcomes from climate change can be challenging owing to data requirements and the complexity of isolating causal factors that contribute to health outcomes. As noted by Ebi et al. (2017), robust detection and attribution of health impacts require reliable long-term datasets, in-depth knowledge of the many drivers and confounding factors that affect public health outcomes, and refinement of analytic techniques to better capture the effect of anthropogenic forcing on health outcomes.200 Two key challenges are the fact that high-quality, long-term public health data are not available for many parts of the world and that there are many confounding factors that influence public health outcomes in any given region. Despite these limitations, the overall body of attribution research demonstrates a clear causal nexus between climate change and health outcomes.201 IPCC AR6 expressed very high confidence in research showing that climate change is adversely affecting
199. Id. at 46, Fig. TS.3 (“Observed Global and Regional Impacts on Ecosystems and Human Systems Attributed to Climate Change”).
200. Kristie L. Ebi et al., Detecting and Attributing Health Burdens to Climate Change, 125 Env’t Health Persps. 085004–1 (2017), https://doi.org/10.1289/EHP1509.
201. “[A]dvances are possible in the absence of complete data and statistical certainty: there is a place for well-informed judgments, based on understanding of underlying processes and matching of patterns of health, climate, and other determinants of human well-being.” Id. at 085004–7. To illustrate this point, the researchers discuss several contexts in which it is possible to show that a “proportion of the current burden of climate-sensitive health outcomes can be attributed to climate change”: (1) heat waves, (2) the emergence of tick vectors of Lyme disease in Canada, and (3) the emergence of Vibrio (bacteria) in northern Europe. For heat waves, the researchers described several approaches for estimating the number of heat wave deaths attributable to anthropogenic climate change. These included two variants on multistep attribution that would combine either the risk-based or storyline approach to extreme-event attribution with an assessment of how changes in exposure to heat waves affect mortality, as well as a single-step attribution approach, which would combine observations of the changes in the incidence and severity of heat waves with the exposure analysis. For Vibrio, the researchers found that it was possible to attribute increases in the incidence of Vibrio to incremental increases in sea surface temperatures, which could then be attributed to climate change. For tick vectors and Lyme disease, the researchers found that there was indirect evidence that higher temperatures were one of the forces leading to the expansion of these vectors, but that more detailed analyses of longer-term surveillance data were needed to actually quantify the relationship between climate change and tick vectors. One key takeaway from the authors of that study was that there are many different approaches to health impact attribution, including qualitative approaches. See, generally, id.
the physical and mental health of people around the world.202 For example, extreme heat events are resulting in human mortality and morbidity across all regions (very high confidence),203 and studies on individual heat events have demonstrated that anthropogenic climate forcing can have a major effect on associated mortality and other health indicators.204 There are many other pathways through which climate change affects physical health. For example, climate change contributes to an increase in the prevalence of food-borne, water-borne, and vector-borne diseases that cause death and illness (very high confidence to high confidence).205 Climate change also exacerbates air pollution—for example, an increase in wildfire weather translates to increased wildfire smoke. Heat waves also contribute to air pollution, particularly in urban regions. The effects of climate change on air quality have been connected to increases in cardiovascular and respiratory disease.206
Cities, settlements, and infrastructure: The effects of climate change on human settlements and infrastructure are already apparent. IPCC AR6 found that sea-level rise, hydrological changes, permafrost thaw, and extreme events such as heat waves, droughts, wildfires, and floods are already causing disruptions of key infrastructure and services such as energy supply and transmission, communications, food and water supply (see above), and transportation systems (high confidence).207 In addition, cities and settlements are experiencing effects that have “extended from direct, climate-driven impacts to compound, cascading and systematic impacts (high confidence).” The nature and magnitude of these impacts vary considerably depending on the region, level of exposure to climate impacts, and vulnerability of affected populations and physical infrastructure. Coastal settlements and infrastructure are particularly vulnerable to compounding climate change impacts because of their exposure to sea-level rise, more intense storms and storm surge, and the associated risks of flooding, inundation, saltwater
202. IPCC AR6 WGII, supra note 181, at 11.
203. Id.
204. See, e.g., Daniel Oudin Åström et al., Attributing Mortality from Extreme Temperatures to Climate Change in Stockholm, Sweden, 3 Nature Climate Change 1050, 1051 (2013), https://doi.org/10.1038/nclimate2022 (climate change doubled mortality during heat extremes in Sweden from 1980 to 2009); Daniel Mitchell et al., Attributing Human Mortality During Extreme Heat Waves to Anthropogenic Climate Change, 11 Env’t Rsch. Letters 1 (2016), https://doi.org/10.1088/1748-9326/11/7/074006 (climate change had increased the risk of heat-related deaths during the 2003 European heat wave by approximately 70% in central Paris and 20% in London, and approximately 506 (± 51) deaths were attributable to climate change in Paris, and 64 (± 3) deaths were attributable in London).
205. IPCC AR6 WGII, supra note 181, at 11. See also id. at 50 (finding that changes in temperature, precipitation, and water-related disasters are linked to increased incidences of waterborne diseases such as cholera, especially in regions with limited access to safe water, sanitation, and hygiene infrastructure (high confidence)).
206. Id. at 11.
207. Id. at 53.
intrusion, and land subsidence.208 Many of these communities also depend on coastal and marine ecosystems for food security, livelihoods, and socioeconomic development—and they are thus uniquely affected by ecosystem alterations brought about by ocean warming, ocean acidification, and other aspects of climate change.209
Socioeconomic development and humanitarian impacts: All of the impacts described above have important implications for socioeconomic development, although attributing socioeconomic impacts to anthropogenic climate change can be tricky because of the fact that there are so many nonclimate factors that also influence development trajectories. Nonetheless, attribution studies have identified clear connections between both mean and extreme changes in the global climate system and adverse economic consequences across many regions and sectors, particularly in “climate-exposed” sectors and regions that experience high exposure and vulnerability to climate change impacts (medium to high confidence, depending on the sector and region).210 Economic impacts are not uniform; some areas are disproportionately affected by adverse impacts,211 and some positive economic effects have been identified—for example, in “regions that have benefitted from lower energy demand as well as comparative advantages in agricultural markets and tourism” (high confidence).212 In addition, climate change is contributing to humanitarian disasters and human displacement, particularly in areas of high vulnerability to climate impacts (high confidence).213 Extreme events are increasingly driving displacement across all regions of the world (high confidence), with disproportionate effects on Small Island Developing States
208. Id. (“Coastal cities are disproportionately affected by interacting, cascading and climate-compounding climate- and ocean-driven impacts, in part because of the exposure of multiple assets, economic activities and large populations concentrated in narrow coastal zones (high confidence)”).
209. See section titled “Socioeconomic development and humanitarian impacts.”
210. See IPCC AR6 WGII, supra note 181, at 11 (“Overall adverse economic impacts attributable to climate change, including slow-onset and extreme weather events, have been increasingly identified (medium confidence). . . . Economic damages from climate change have been detected in climate-exposed sectors, with regional effects to agriculture, forestry, fishery, energy, and tourism (high confidence), and through outdoor labour productivity (high confidence). Some extreme weather events, such as tropical cyclones, have reduced economic growth in the short-term (high confidence)”). See also id. at 54 (“The effects of climate change impacts have been observed across economic sectors, although the magnitude of the damage varies by sector and by region (high confidence). Recent extreme weather and climate-induced events have been associated with large costs through damaged property, infrastructure and supply chain disruptions, although development patterns have driven much of these increases (high confidence). Adverse impacts on economic growth have been identified from extreme weather events (high confidence) with large effects in developing countries (high confidence).”).
211. See, e.g., IPCC AR6 WGII, supra note 181, at 54 (discussing disproportionate adverse impacts on Small Island Developing States).
212. Id. at 11.
213. Id.
(high confidence).214 Impacts on food and water security, discussed above, are also adversely affecting humanitarian outcomes and socioeconomic development.
Source Attribution
The field of source attribution encompasses research aimed at identifying and attributing climate change to specific sources. A source could be a particular actor (e.g., a country or a company), a sector, or an activity. In climate litigation, this research is used to answer questions such as: (1) whether and to what extent a particular entity has contributed to emissions and climate change impacts, (2) whether a source category generates a sufficient quantity of emissions such that a regulatory threshold is triggered, and (3) whether a government agency has adequately disclosed emissions and climate impacts from its projects and activities. As noted above, source attribution has been, and remains, a distinct discipline from what is commonly labeled “detection and attribution” in the climate science community. However, these research streams have begun to converge in recent years, and there is now a growing body of research aimed at linking specific entities (e.g., countries and private actors) to observed changes, such as sea-level rise and extreme events.215
Methods and Parameters
The IPCC does not have a working group that serves as a direct analog for source attribution research like other issues discussed in this reference guide. IPCC Working Group III (WGIII) does synthesize some research on GHG emissions sources (e.g., estimates of regional and sectoral GHG contributions); however, the WGIII reports do not include data on the specific contributions of particular entities to global emissions, as may be required to support a legal finding of responsibility for or obligation to address climate change. Thus, source attribution data in climate litigation are often derived from sources other than IPCC reports.
214. Id.
215. See, e.g., David J. Frame et al., Emissions and Emergence: A New Index Comparing Relative Contributions to Climate Change With Relative Climatic Consequences, 14 Env’t Rsch. Letters 084009 (2019), https://doi.org/10.1088/1748-9326/ab27fc; R. Licker et al., Attributing Ocean Acidification to Major Carbon Producers, 14 Env’t Rsch. Letters 124060 (2019), https://doi.org/10.1088/1748-9326/ab5abc; Friederike E.L. Otto et al., Assigning Historical Responsibilities for Extreme Weather Events, 7 Nature Climate Change 757 (2017), https://doi.org/10.1038/nclimate3419; B. Ekwurzel et al., The Rise in Global Atmospheric CO2, Surface Temperature, and Sea Level from Emissions Traced to Major Carbon Producers, 144 Climatic Change 579 (2017), https://doi.org/10.1007/s10584-017-1978-0.
The data used in source attribution come from direct measurements of emissions, which can be performed in situ or remotely from satellites, as well as documentary evidence of emissions contained in corporate reports, government inventories, and other sources.216 Where direct emissions data are lacking, scientists can use indirect methods, such as models, to estimate emissions from sources and activities. Indirect methods are particularly important for estimating emissions from land use changes and nonpoint sources such as agricultural operations.
Establishing causation in the source attribution context involves quantifying the emissions contribution of the source and ascertaining the proportional contribution of those emissions to: (1) concentrations of greenhouse gases and other forcings and (2) how those changes in concentrations ultimately impact, for example, sea-level rise, extreme weather events, and the resultant impacts on ecosystems and/or communities. As noted above, there are some recent studies linking specific sources to global climate change and extreme events. However, most of the existing research on source attribution focuses on quantifying emissions from sources and determining the proportional contribution to increases in atmospheric greenhouse gases.
There are several factors that must be considered when making this calculation. First, climate change is not a product of a single pollutant or polluting activity, and different GHGs and other forcing agents have different effects on climate in terms of magnitude, duration, location, and type of effect. Second, there are some gaps in knowledge pertaining to total emissions of certain forcing agents, including historical emissions, as well as a good deal of uncertainty about the extent and timing of historical land use changes and their impact on atmospheric concentrations of greenhouse gases.217 Some of these land use changes, like deforestation, also impact climate in other ways—for example, by altering the amount of sunlight converted to heat at the surface.218
Nonetheless, scientists have endeavored to calculate the relative contributions of emissions and land use change, and, within the category of emissions, of
216. Because such reports are prepared by humans, sometimes pursuant to a political or social agenda, they may contain biases or errors of a different type than those found in raw data or instrumental records.
217. For additional context on the state of knowledge on different GHG emission sources and their relative contribution to global climate change, see NASEM, Greenhouse Gas Emissions Information For Decision Making: A Framework Going Forward (2022), https://doi.org/10.17226/26641.
218. For example, land use decisions that change the amount of sunlight absorbed at the surface can have an important or negligible effect on climate, depending on factors such as the latitude at which the deforestation occurs and the reflective properties of the surface underneath the previously forested area. Another complicating factor is that climate change itself directly impacts the magnitude of sources and sinks for greenhouse gases (e.g., a warmer ocean is less able to take up carbon dioxide, and changes in vegetation with climate change could switch some natural systems from net sources to net sinks, and vice versa).
different pollutants. In climate change attribution studies, scientists can bolster emissions data with actual measurements of atmospheric greenhouse gases (such as those taken at Mauna Loa in Hawaii) to determine the overall effect of human activity on climate, with the aforementioned caveats. Climate models can also be used both to evaluate the proportional contribution to atmospheric forcing agents and to ascertain the effect of that contribution on other aspects of climate change.
Finally, it is important to recognize that source attribution involves questions that cut across different social and scientific disciplines. Certainly, there is a physical science component to source attribution, as the ultimate goal is to ascertain the physical contribution of the source to anthropogenic climate change. But there are also social and normative questions that come into play when attributing emissions (or sequestration) to a particular source, particularly when trying to assign “responsibility” for emissions. Consider the many different ways that emissions can be “divvied up” across different lines—by stage of economic development, global region, country, sector, company, consumer, etc. Even within these categories, there are different ways of assigning emissions responsibility. For example, when assessing national responsibility for climate change, one can look at emissions that are generated within the country (territorial emissions), emissions embodied in products consumed within the country (consumption-based emissions), or emissions from fossil fuels produced within the country (production-based emissions). Similarly, when assessing corporate responsibility for climate change, there are important questions about the relative responsibility of upstream entities (e.g., fossil fuel producers) and downstream entities (e.g., manufacturers and end users of carbon-intensive products and consumers of fossil fuels) in addition to the entities that directly generate emissions.219
Granted, it is entirely possible to avoid such normative questions when publishing information about source attribution. For example, a study could simply provide a breakdown of emissions across different countries using different accounting approaches (territorial, consumption-based, and production-based) without reaching any conclusions about the responsibility of different actors or source categories. But in practice, when attribution science is used in the courtroom, the question of responsibility may be of paramount importance.
International climate negotiations have historically focused on using national responsibility as the basis for allocating emission reduction burdens. This focus is evident in the United Nations Framework Convention on Climate Change (UNFCCC), which places the responsibility for reporting on and reducing
219. These types of considerations also factor into assessments of how to allocate the global carbon budget among different actors. See section titled “Impact Detection and Attribution” above.
emissions on national governments;220 the “Brazilian Proposal,” which emerged from UNFCCC negotiations in the mid-1990s and holds that greenhouse gas emission reduction targets should be set according to each country’s historical contribution to climate change;221 and the Paris Agreement, which relies on nationally determined contributions (NDCs) as the primary basis for mitigating emissions.222 The UNFCCC reporting framework has historically focused on territorial emissions (i.e., emissions generated within the country) as the metric for gauging national responsibility. However, in recent years there has been a strong push in both international and domestic forums to account for consumption-based emissions (i.e., emissions embodied in products consumed within the country) and extraction-based emissions (i.e., emissions from fossil fuels produced within the country) in additional to territorial emissions when assessing national obligations.223
While most national emissions inventories currently focus on territorial emissions, researchers have found that it would be relatively easy for countries to produce extraction-based and consumption-based inventories utilizing readily available data.224 In other words, pursuing these alternative accounting methodologies would not be significantly more expensive or technically challenging than the territorial approach. These alternative accounting methodologies also provide valuable insights that are not captured in the territorial approach—for
220. United Nations Framework Convention on Climate Change, May 9, 1992, S. Treaty Doc. No. 102–38, 1771 U.N.T.S. 107.
221. Emilio L. La Rovere et al., The Brazilian Proposal on Relative Responsibility for Global Warming, in Building on the Kyoto Protocol: Options for Protecting the Climate (Kevin A. Baumert et al. eds., 2002), https://perma.cc/3ZJB-SQW5.
222. Paris Agreement to the United Nations Framework Convention on Climate Change, Dec. 12, 2015, T.I.A.S. No. 16–1104.
223. For more information on these emissions accounting techniques, see Peter Erickson & Michael Lazarus, Stockholm Environment Institute, Accounting for Greenhouse Gas Emissions Associated with the Supply of Fossil Fuels (2013), https://perma.cc/32VR-WLFQ.
224. Glen P. Peters, From Production-Based to Consumption-Based National Emission Inventories, 65 Ecological Econ. 13 (2008), https://doi.org/10.1016/j.ecolecon.2007.10.014; Steven J. Davis & Ken Caldeira, Consumption-Based Accounting of CO2 Emissions, 107 PNAS 5687 (2010), https://doi.org/10.1073/pnas.0906974107; Manfred Lenzen et al., Building EORA: A Global Multi-Region Input–Output Database at High Country and Sector Resolution, 25 Econ. Sys. Res. 20 (2013), https://doi.org/10.1080/09535314.2013.769938; Stavros Afionis et al., Consumption-Based Carbon Accounting: Does It Have a Future?, 8 Wires Climate Change 1 (2017), https://doi.org/10.1002/wcc.438;G.P. Peters et al., A Synthesis of Carbon in International Trade, 9 Biogeosciences 3247 (2012), https://doi.org/10.5194/bg-9-3247-2012; Kirsten S. Wiebe & Norihiko Yamano, Estimating CO2 Emissions Embodied in Final Demand and Trade Using the OECD ICIO 2015: Methodology and Results, 2016/05 OECD Sci., Tech. & Indus. Working Papers 1 (2016), https://doi.org/10.1787/5jlrcm216xkl-en; Steven J. Davis et al., The Supply Chain of CO2 Emissions, 108 PNAS 18554 (2011), https://doi.org/10.1073/pnas.1107409108; Thomas M. Power & Donovan S. Power, The Impact of Powder River Basin Coal Exports on Global Greenhouse Gas Emissions, Energy Found. (2013), https://perma.cc/RV4A-SCH3.
example, the consumption-based approach accounts for “leakage” of GHG emissions to other countries via trade and helps countries understand the importance of developing policies aimed at reducing consumption of carbon-intensive products. Ultimately, though they may carry different legal weight, all three methodologies are useful in addressing the question of who is “responsible” for climate change.
In addition, researchers have compiled detailed historical inventories of emissions attributable to some corporate actors and industries. Corporate emissions inventories and disclosures also serve as a source of data for assessing corporate contributions to climate change.
Status of Research
National contributions
Since the 1990s, countries, including the United States, have been preparing national GHG inventories pursuant to guidelines articulated by the UNFCCC. These inventories encompass emissions from energy, industrial processes and product use, agriculture, land use practices, and waste. Emission estimates are based on territorial emissions. The inventories are publicly available and frequently used as a data source by researchers who analyze emission trends. They provide somewhat comprehensive coverage of recent emissions from countries, but they do not provide a complete picture of historical emissions before the 1990s and early 2000s (for some countries). There are also accounting inconsistencies in the inventories owing to the issuance of different standards and reporting requirements for countries with different capacities.225
Governmental agencies, scientific organizations, and researchers have helped to fill these gaps through further research on national and sectoral emissions. Two key sources of data for this research are (1) atmospheric emission measurements, and (2) information about production and activities that contribute to GHG emissions. As noted by the National Academies, “[t]he most accurate and precise estimates are available for emission-producing activities that have explicit economic value (e.g., energy production),” and “[n]ational CO2 emissions from fossil fuel burning are typically well characterized by economic data on fossil fuel trade and production.”226 In comparison, there is a good deal of uncertainty about CO2 emissions estimates from land use and land use change,
225. For a more detailed discussion of limitations in UNFCCC emission inventories, see NASEM, supra note 217.
226. Id. at 50.
as well as emissions of non-CO2 GHGs from both industry and land use.227 For example, recent research indicates that methane emissions from fossil fuel infrastructure are 50% larger than inventory estimates, and there is additional uncertainty regarding methane emissions from wetlands, reservoirs, agriculture, waste, and other sources.228 Nitrous oxide (N2O) emissions, primarily from agriculture, are another important source of anthropogenic climate forcing, and measurements of atmospheric N2O suggest that these emissions are underestimated globally.229
There are different accounting approaches for estimating national emissions. For example, researchers have developed national estimates of consumption- and extraction-based emissions in addition to territorial emissions.230 With respect to cumulative contributions, there is more uncertainty about the attribution of consumption-based emissions to individual countries as the result of limited data about historical emissions embodied in trade. Work has also been done to quantify emissions at different scales and to evaluate emissions by different metrics (e.g., per capita emissions within a country).231 Overall, there is a large body of emissions data that litigants and other actors can draw on—especially for U.S. CO2 emissions, which are well documented by both government agencies and independent researchers.232
There is also a growing body of research aimed at linking national emissions contributions to specific aspects of climate change. These studies use many of the same general techniques and climate models that are used when studying the aggregate effects of anthropogenic climate forcings; however, because these studies deal with a smaller quantity of emissions (national rather than global emissions), it can be more difficult to ascertain the impact of those emissions with precision and certainty. Accordingly, attribution studies for individual countries
227. Id. As a point of reference, the uncertainty for global fossil fuel CO2 emissions is thought to be less than ±8%, whereas the uncertainty for land use CO2 emissions is estimated at roughly ±75%. At the national level, these uncertainty estimates vary depending on the quality of data systems.
228. Id. See also NASEM, Improving Characterization of Anthropogenic Methane Emissions in the United States (2018), https://doi.org/10.17226/24987.
229. NASEM, supra note 217, at 51. See also Efisio Solazzo et al., Uncertainties in the Emissions Database for Global Atmospheric Research (EDGAR) Emission Inventory of Greenhouse Gases, 21 Atmospheric Chemistry & Physics 5655 (2021), https://doi.org/10.5194/acp-21-5655-2021.
230. See, e.g., Davis et al., supra note 224; Glen P. Peters et al., Growth in Emission Transfers Via International Trade from 1990 to 2008, 108 PNAS 8903 (2011), https://doi.org/10.1073/pnas.1006388108; Daniel Moran et al., The Carbon Loophole in Climate Policy: Quantifying the Embodied Carbon in Traded Products (2018), https://perma.cc/2VDL-CGT2.
231. H. Damon Matthews, Quantifying Historical Carbon and Climate Debts Among Nations, 6 Nature Climate Change 60 (2016), https://doi.org/10.1038/nclimate2774.
232. See, e.g., Hannah Ritchie et al., United States: CO2 Country Profile, OurWorldinData (2020), https://perma.cc/7WRT-XKSV (cumulative emissions are important owing to the long atmospheric lifetime of CO2); Hannah Ritchie, Where in the World Do People Emit the Most CO2?, OurWorldinData (2019), https://perma.cc/282X-UNUL.
(or other individual sources) may result in a relatively broad range of possible values (i.e., a large confidence interval) as compared with attribution studies that deal with climate change in the aggregate. It is also important that such studies include a robust discussion of uncertainty.
Many national attribution studies deal with contributions to global mean surface temperature (GMST) increases, as there is robust physical understanding of the relationship between anthropogenic forcings and GMST.233 For example, Skeie et al. (2017) used a climate model to link the territorial emissions between 1850 and 2012 from multiple countries to GMST change, taking into account historical emissions and focusing on the largest emitters.234 In a similar study, Jones et al. (2023) calculated changes in GMST attributable to national CO2, methane (CH4), and nitrous oxide (N2O) emissions from 1850 to 2021.235
Researchers are also examining the causal relationship between national emissions and a range of other impacts, including regional/country-specific impacts, and changes in extreme events. Otto et al. (2017) was the first study to apply the nation-based emissions framework to individual extreme-event attribution, focusing on a heat wave in Argentina.236 The researchers used two
233. See Nathan P. Gillett et al., Constraining the Ratio of Global Warming to Cumulative CO2 Emissions Using CMIP5 Simulations, 26 J. Climate 6844 (2013), https://doi.org/10.1175/JCLI-D-12-00476.1; Pierre Friedlingstein & Susan Solomon, Contributions of Past and Present Human Generations to Committed Warming Caused by Carbon Dioxide, 102 PNAS 10832 (2005), https://doi.org/10.1073/pnas.0504755102; Ting Wei et al., Developed and Developing World Responsibilities for Historical Climate Change and CO2 Mitigation, 109 PNAS 12911 (2012), https://doi.org/10.1073/pnas.1203282109; Julia Pongratz & Ken Caldeira, Attribution of Atmospheric CO2 and Temperature Increases to Regions: Importance of Preindustrial Land Use Change, 7 Env’t Rsch. Letters 034001 (2012), https://doi.org/10.1088/1748-9326/7/3/034001; Sophie C. Lewis et al., Assessing Contributions of Major Emitters’ Paris-Era Decisions to Future Temperature Extremes, 46 Geophysical Rsch. Letters 3936 (2019), https://doi.org/10.1029/2018GL081608; Niklas Höhne et al., Contributions of Individual Countries’ Emissions to Climate Change and Their Uncertainty, 106 Climatic Change 359 (2011), https://doi.org/10.1007/s10584-010-9930-6; Bo Fu et al., The Contributions of Individual Countries and Regions to the Global Radiative Forcing, 118 PNAS e2018211118 (2021), https://doi.org/10.1073/pnas.2018211118.
234. Ragnhild B. Skeie et al., Perspective Has a Strong Effect on the Calculation of Historical Contributions to Global Warming, 12 Env’t Rsch. Letters 024022 (2017), https://doi.org/10.1088/1748-9326/aa5b0a. Skeie et al. noted that these findings were very sensitive to the parameters of the study, including technical decisions such as the time frame for the analysis, as well as more normative decisions about the basis for attributing emissions (e.g., place of extraction vs. place of burning vs. place of final consumption) and about whether to look at per capita or total emissions. They also emphasized that, in nonlinear systems, the proportional contribution to emissions will differ from the proportional contribution to impacts. Id.
235. Matthew W. Jones et al., National Contributions to Climate Change Due to Historical Emissions of Carbon Dioxide, Methane, and Nitrous Oxide Since 1850, 10 Sci. Data 155 (2023), https://doi.org/10.1038/s41597-023-02041-1. Note that Jones et al. and Skeie et al., supra note 234, use different time frames for the emissions analysis (1850–2012 and 1850–2021), which is one factor contributing to the different findings in these studies.
236. Otto et al., supra note 215.
different statistical methodologies237 to assess historical responsibility.238 This research provides useful initial insights on possible measures of national responsibility, but the large uncertainty ranges reported in the study illustrate the difficulty of attributing specific extreme events or climate impacts to specific emitters with a high level of precision.
Corporate contributions
Much of the research on corporate contributions to climate change has focused on corporations involved in fossil fuel production, energy, and other emissions-intensive industries. In the foundational Carbon Majors study, Heede (2014) developed estimates of historical emissions for ninety producers of oil, gas, coal, and cement based on their production records.239 Corporate emissions estimates can also be obtained through voluntary disclosures through initiatives like the Climate Disclosure Project, as well as legally mandated disclosures, which are becoming increasingly common.240 The IPCC and government agencies also compile emissions data for specific sectors (energy, transport, buildings, industry, forestry, agriculture, and waste). Sectoral data are potentially relevant when assessing government legal obligations related to the regulation of GHG emissions, or for comparing corporate emissions to industry norms.
Researchers have also begun conducting attribution studies aimed at linking corporate emissions to specific climate impacts (as with national emissions), for example, using findings from the Carbon Majors study to assess the impacts of emission contributions to global temperature change, sea-level rise,241 and ocean acidification.242 As noted in the discussion above, such studies rely on
237. As explained by the authors, the first methodology, the distribution method, “fits a distribution to the raw model data for both ensembles and estimates the percentage change in the distribution characteristics for individual regions by applying the [national] contributions to GMST.” The second methodology, the gradient method, “differs in that the return time curve is used directly to calculate the gradient of the curve at the threshold of the event in both ensembles, and scale between the two gradients according to the [percentage contributions].” Id.
238. The study also examined EU responsibility, but we focus on U.S. findings for the purposes of this reference guide. Id.
239. Richard Heede, Tracing Anthropogenic Carbon Dioxide and Methane Emissions to Fossil Fuel and Cement Producers, 1854–2010, 122 Climatic Change 229 (2014), https://doi.org/10.1007/s10584-013-0986-y; Richard Heede, Carbon Majors: Accounting for Carbon and Methane Emissions 1854–2010: Methods and Results Report, Climate Mitigation Servs. (2014), https://perma.cc/3ZKX-Z7VZ; Paul Griffin et al., The Carbon Majors Database: Methodology Report 2017, CDP (2017), https://perma.cc/L7AR-BA89.
240. See, e.g., EPA, Greenhouse Gas Reporting Program, https://perma.cc/BV3G-JYQ9; Calif. Air Resource Bd., Mandatory Greenhouse Gas Emissions Reporting, https://perma.cc/L5A6-YTN4.
241. Ekwurzel et al., supra note 215.
242. Licker et al., supra note 215.
well-established attribution techniques and climate models, but there tends to be more uncertainty (often expressed as a broader confidence interval) when attributing impacts to specific emitters and sources.
Projections of Future Climate Change
Climate change projections provide insights on the magnitude and scope of changes and impacts that could occur under different emission trajectories and warming scenarios. It is generally understood that the effects of climate change will become increasingly severe and pervasive as GHGs continue to accumulate in the atmosphere. However, the relationship among emissions, changes in the global climate system, and corresponding impacts is not always linear—for example, there are potential tipping points, feedback cycles, and cascading impacts that could result in acceleration of certain trends such as sea-level rise. Scientists have developed sophisticated methods for predicting future changes and impacts based on anthropogenic forcing and levels of atmospheric warming. Importantly, these projections are not intended to convey the world as it will be but rather the world as it could be depending on future human activities.
Methods and Parameters
Like attribution research, projections of climate change are based on physical understanding, climate datasets, statistical methods, and modeling tools. In addition, the findings from detection and attribution research, discussed above, provide the foundation for predicting future trends, insofar as they characterize the changes that are already underway as a result of anthropogenic climate forcing. Climate change projections are typically used in climate litigation to establish the foreseeability of future climate harms and to assess legal obligations to control GHG emissions and/or adapt to the effects of climate change.
The projections in IPCC assessments and many other studies rely heavily on the CMIP model ensemble to simulate how changes in climate forcers, such as GHGs, may affect the global climate system. IPCC AR6 relies on CMIP Phase 6 (CMIP6), which has better representations of physical processes as well as higher resolution compared to climate models used in previous IPCC assessments.243 The climate projections in IPCC AR6 are based on five illustrative scenarios that reflect potential changes in GHG emissions and land uses as well as natural climate forcers. They include near-term (2021–2040), mid-term (2041–2060), and long-term (2081–2100) projections.
243. IPCC AR6 WGI, supra note 6, at 12.
There is considerable confidence in the ability of global climate models to provide credible quantitative estimates of future climate change at large geographic scales.244 Confidence in global projections is higher for some climate variables (e.g., global mean temperature) than for others (e.g., precipitation). To evaluate the credibility and robustness of model projections, scientists will assess how well the model is able to simulate observed climate conditions. For example, the CMIP6 multimodel ensemble underwent a diagnostic evaluation that revealed that it captured most aspects of observed climate change well.245 One key improvement in global climate models is that they are now better at simulating natural climate variability, which can play a significant role in shaping future climate conditions.
Global climate models deal with large-scale weather patterns; they do not have the spatial resolution to simulate the effects of anthropogenic climate change at a regional or local scale. Scientists can use regional models to simulate the interactions between changes in large-scale weather patterns and regional or local conditions. Regional climate models have much finer spatial resolution (e.g., 1–50 km grid spacing, as opposed to 100–300 km grid spacing in a global model).246 There is generally more uncertainty and less confidence in projections at the regional scale because of the challenges with regional climate analysis and downscaling described above. In particular, internal variability tends to play a larger role in shaping regional climate conditions, and this complicates the identification of forced climate signals at the regional level. There are methods for reducing uncertainty in regional projections—for example, by combining and comparing results from different regional models, or by using initial-condition ensembles, where the same model is run repeatedly under identical forcing but with small variations in initial conditions (which helps researchers quantify uncertainty owing to internal variability).247
Even where models are unable to provide robust quantitative projections of future climate conditions, it may be possible to qualitatively predict trends with a fairly high level of confidence. Such qualitative projections can be used to assess climate risk and to define legal obligations related to climate change mitigation and adaptation. However, there are some variables for which it may be difficult to even reach qualitative conclusions about the direction of future trends. For example, it is unclear whether average precipitation will increase or decrease in some regions as a result of anthropogenic climate change.248
244. See id. at ch. 4. See also Randall et al., supra note 48.
245. IPCC AR6 WGI, supra note 6, at 561.
246. Eric P. Salathé Jr. et al., Regional Climate Model Projections for the State of Washington, 102 Climatic Change 51 (2010), https://doi.org/10.1007/s10584-010-9849-y.
247. IPCC AR6 WGI, supra note 6, at 562.
248. At the global scale, models project that there will be greater contrast in mean precipitation between dry and wet regions (i.e., dry areas will become drier; wet areas will become wetter) but with large regional variations and low confidence in projections. Id. at 1109. Some regions, such
As noted above, climate projections must be issued in reference to future emissions (or anthropogenic forcings) and/or warming scenarios. These future emissions, which will depend primarily on future human decisions, thus include an additional type of uncertainty relative to attribution research. In its latest assessment, the IPCC used the following emission scenarios based on Shared Socio-economic Pathways (SSPs) to frame its analysis: (1) a “very low” emissions scenario, where GHG emissions decline sharply, reaching net zero around 2050, followed by net negative emissions (SSP1–1.9); (2) a “low” emissions scenario, where emissions decline quickly (but not as fast as the very low scenario), reaching net zero emissions after 2050, followed by net negative emissions (SSP1–2.6); (3) an “intermediate” emissions scenario, where CO2 emissions remain at current levels until mid-century and then decline to net zero by 2100 (SSP2–4.5); (4) a “high” scenario where emissions continue to increase through the century (SSP3–7.0); and (5) a “very high” scenario with larger emission increases, followed by a slight decline in emissions toward the end of the century (SSP5–8.5).249 These five scenarios correspond with different temperature increases (see Figure 2), and they have been used as the basis for climate modeling in CMIP6 ensembles.
Status of Research
Using the emissions scenarios described above, IPCC AR6 projected future changes in global surface temperature250 and other aspects of the climate system, including (1) mean sea level, (2) ocean acidification and deoxygenation, (3) intensity and variability of the global hydrological cycle, (4) the extent and volume of all cryosphere resources such as sea ice and glaciers, and (5) climatological extremes.251 It also projected changes in climate hazards and impacts under future emissions scenarios, such as changes in heat-related mortality and morbidity; food-borne, water-borne, and vector-borne diseases; flooding in coastal and low-lying areas; biodiversity loss; impacts on food and water security; and mental health impacts.252 IPCC AR6 concluded that the loss and damage caused by anthropogenic climate change will be severe even if we limit global warming to 1.5°C or “well below” 2.0°C (the Paris Agreement targets for averting dangerous anthropogenic climate change, which are often used to formulate
as the western United States, are projected to have increased precipitation in some models and decreased precipitation in other models. Id. at 1110 (Fig. 8.14). However, this is not the case for most regions. There are other regions for which there is more pervasive uncertainty about the trajectory of future impacts (e.g., ice storms and tornadoes).
249. IPCC AR6 WGI, supra note 6, at 232 (Cross-Chapter Box 1.4).
250. Id. at 13–14.
251. Id. See also IPCC AR6 Synthesis Report, supra note 150.
252. Id.
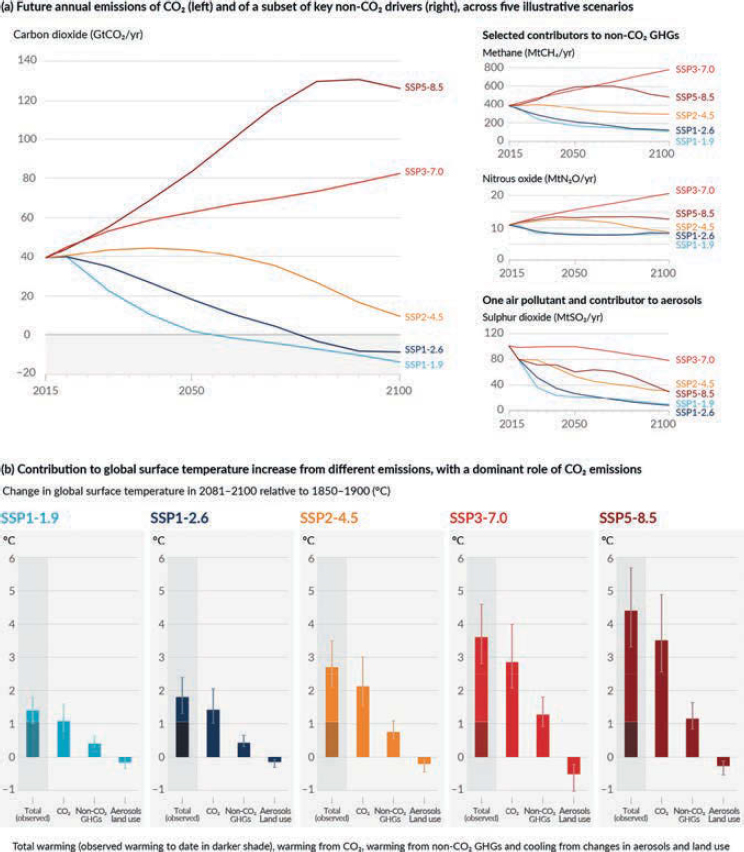 Source: Figure SPM.4 in IPCC, 2021: Summary for Policymakers. In: Climate Change 2021: The Physical Science Basis. Contribution of Working Group I to the Sixth Assessment Report of the Intergovernmental Panel on Climate Change [Masson-Delmotte, V., P. Zhai, A. Pirani, S.L. Connors, C. Péan, S. Berger, N. Caud, Y. Chen, L. Goldfarb, M.I. Gomis, M. Huang, K. Leitzell, E. Lonnoy, J.B.R. Matthews, T.K. Maycock, T. Waterfield, O. Yelekçi, R. Yu, and B. Zhou (eds.). Cambridge University Press, Cambridge, UK, and New York, NY, USA, pp. 3−32, doi: 10.1017/9781009157896.001.]
scenarios for climate projections and shape emissions reduction efforts).253 Many of the projected changes in the climate system will be “irreversible on centennial to millennial timescales,” particularly changes in the ocean, ice sheets, and global sea level.254
Notably, for any given future warming level, many climate-related risks are higher than those assessed in AR5, and the severity of projected long-term impacts is often significantly higher than currently observed impacts like those described above (high confidence).255 The effects of climate change will also interact with nonclimatic risks, creating “compound and cascading risks that are more complex and difficult to manage” (high confidence).256 The relationship between impacts and global warming is often not linear, and small temperature increases can result in dramatically more severe impacts. IPCC AR6 also found that the planet is already very close to surpassing many critical thresholds within the climate system, and some of these thresholds will likely be surpassed if global warming exceeds 1.5°C.257 More recent studies on tipping points that were published after evidence was compiled for IPCC AR6 indicate that we are close to surpassing certain thresholds, and may have already surpassed some, particularly those associated with cryosphere impacts (e.g., the melting of ice sheets).258
Adaptation measures can play a significant role in mitigating certain risks, such as the risks associated with extreme precipitation and flooding. However, adaptation may not be as effective at mitigating other harmful impacts, such as those on biodiversity and ecosystems. Moreover, the effect of climate change on vulnerable populations and ecosystems often reduces their adaptive capacity, thus creating a compounding problem where adaptation becomes increasingly challenging and costly as climate change becomes more severe. Additionally, most adaptations involve tradeoffs, and there is a risk of maladaptation and inequitable adaptation.
How Climate Science Factors into Litigation
The United States has seen considerable growth in the field of climate litigation, that is, cases that involve legal claims related to climate change mitigation,
253. IPCC, Global Warming of 1.5°C: An IPCC Special Report on the Impacts of Global Warming of 1.5°C Above Pre-Industrial Levels and Related Global Greenhouse Gas Emission Pathways 5 (Valérie Masson-Delmotte et al. eds., 2018), http://doi.org/10.1017/9781009157940.001 [hereinafter IPCC 1.5°C Report].
254. IPCC AR6 Synthesis Report, supra note 150, at 24.
255. Id. at 14.
256. Id.
257. Id. at 77.
258. See, e.g., McKay et al., supra note 34. Once a tipping point is reached, it can take hundreds or thousands of years to reach a new equilibrium.
adaptation, compensation, and disclosures.259 This section provides an overview of the types of climate cases that are being filed in U.S. courts, particularly federal courts, and describes how different areas of climate science may factor into judicial assessments of causation, foreseeability, and legal obligations and authorities. It also discusses some considerations that are relevant when evaluating the admissibility, probative value, and weight of scientific evidence and expert testimony on matters related to climate change.
Overview of Climate Litigation
Many different types of climate-related claims have been filed in federal and state courts over the past several decades. Most of the federal cases involve questions about government obligations or authorities with respect to climate change mitigation, adaptation, and disclosures, as detailed below. These are typically administrative law claims, where judges may encounter questions about climate science when assessing (1) the scope of scientific evidence that must be considered by the agency before it decides on a course of action and (2) whether the agency has made a decision based on that evidence that meets the applicable legal standard.260 There are some exceptions, including constitutional claims against governments261 and statutory and tort law claims against corporate defendants.262 But the majority of federal claims involve government defendants and tend to fall in one of the following broad categories.
259. Mitigation refers to actions to reduce greenhouse gas emissions and other anthropogenic drivers of climate change. Adaptation refers to actions to prepare for and respond to the effects of climate change on human and natural systems. Compensation refers to payments or other resources given to people who have experienced damages as a result of anthropogenic climate change. Disclosures refer to the analysis and disclosure of information related to climate change (particularly climate-change-related risks) in government and corporate documents, such as environmental impact statements and financial reports.
260. . See, e.g., 5 U.S.C. § 706(2)(A) (directing courts to hold unlawful and set aside agency action, findings, and conclusions that are “arbitrary, capricious, an abuse of discretion, or otherwise not in accordance with law”); 5 U.S.C. § 706(2)(E) (directing courts to set aside a formal rulemaking or adjudication if it is not supported by “substantial evidence”). See also Motor Vehicles Mfrs. Ass’n v. State Farm Mut. Auto. Ins. Co., 463 U.S. 29, 43 (1983) (when applying the arbitrary and capricious standard, courts evaluate whether the agency “examine[d] the relevant data and articulate[d] a satisfactory explanation for its action, including a rational connection between the facts found and the choice made”).
261. See infra note 273.
262. For example, federal cases have been filed against corporate actors seeking to establish liability for climate-change-related damages. See, e.g., Native Village of Kivalina v. ExxonMobil Corp., 696 F.3d 849 (9th Cir. 2012); Complaint, Municipalities of Puerto Rico v. ExxonMobil Corp., No. 3:22-cv-01550 (D.P.R. Nov. 22, 2022). However, most corporate liability cases in the United States involve state law claims. See, e.g., City of Oakland v. BP PLC, No. 22–16810, 2023
First, there are legal disputes about the scope of government obligations or authorities to regulate GHG emissions (i.e., mitigation). This category includes administrative lawsuits seeking regulatory action for GHG emissions pursuant to the Clean Air Act or other federal and state statutes, as well as lawsuits where agencies are defending GHG regulations against industry and/or state challenges.263 It also includes constitutional claims alleging that the government has violated fundamental rights through inadequate control of GHG emissions (these are sometimes called “atmospheric trust” cases, as the public trust doctrine is typically invoked alongside substantive due process).264 Constitutional claims have also been filed in opposition to government actions aimed at controlling GHG emissions and activities that contribute to GHG emissions (e.g., government restrictions on fossil fuel infrastructure).265
Second, many of the federal lawsuits filed against government agencies involve questions about procedural obligations to analyze and disclose climate-change-related considerations in administrative decision-making. These typically take the form of Administrative Procedure Act and National Environmental Policy Act (NEPA) claims alleging that federal agencies have not adequately accounted for climate-change-related considerations in administrative documentation prior to undertaking final agency action.266 Cases in this category may focus on agency obligations to account for GHG emissions and associated impacts attributable to federal actions, such as fossil fuel leases, natural gas pipeline approvals,
WL 8179286 (9th Cir. Nov. 27, 2023) (affirming remand to state court); City & Cnty. of Honolulu v. Sunoco LP, 39 F.4th 1101 (9th Cir. 2022), cert. denied, 143 S. Ct. 1795 (2023) (affirming remand to state court). Corporate actors may also be sued for the “failure to adapt” to climate change (e.g., the failure to prepare a coastal facility that stores hazardous substances for the effects of sea-level rise and more severe storms), or the “failure to disclose” known climate risks (e.g., in federal securities filings). See, e.g., Complaint, Conservation Law Found. v. Shell Oil Prods. US, No. 1:17-cv-00396 (D.R.I. Aug. 28, 2017); Complaint, Conservation Law Found. v. ExxonMobil Corp., No. 1:16-cv-11950 (D. Mass. Sept. 29, 2016).
263. See, e.g., Massachusetts v. EPA, 549 U.S. 497 (2007); Coal. for Responsible Regul. v. EPA, 684 F.3d 102 (D.C. Cir. 2012), aff’d in part, rev’d in part on other grounds by Util. Air. Regul. Grp. v. EPA, 573 U.S. 302 (2014).
264. See, e.g., Juliana v. United States, No. 6:15-cv-01517, 2023 WL 9023339 (D. Or. Dec. 29, 2023); Animal Legal Defense Fund v. United States, No. 19–35708, 2022 WL 5241274 (9th Cir. Feb. 9, 2022); Komor v. United States, No. 22–15851, 2023 WL 4313136 (9th Cir. July 3, 2023). State courts have also confronted constitutional and public trust claims about government obligations with regard to GHG emissions. See, e.g., Held v. Montana, No. CDV-2020-307, 2023 WL 5229257 (Mont. Dist. Ct. Aug. 14, 2023).
265. See, e.g., Montana v. City of Portland, No. 3:23-cv-00219, 2023 WL 8452447 (D. Or. Oct. 12, 2023); Levin Richmond Terminal Corp. v. City of Richmond, 482 F. Supp. 3d 944 (N.D. Cal. 2020).
266. See, e.g., Diné Citizens Against Ruining Our Env’t v. Haaland, 59 F.4th 1016 (10th Cir. 2023); Ctr. for Biological Diversity v. Nat’l Highway Traffic Safety Admin., 538 F.3d 1172, 1189 (9th Cir. 2008).
and forest management decisions.267 They may also focus on agency obligations to account for the effects of climate change on the action and its affected environment—for example, parties to a lawsuit may argue that an agency is obliged to account for observed and predicted hydrological changes in its assessment of a water management project.268
Third, there are cases that deal with government obligations or authorities to prepare for and respond to the effects of climate change on physical infrastructure, natural resources, or other matters under agency jurisdiction (i.e., adaptation). For example, there have been over 100 Endangered Species Act (ESA) cases that involve climate-change-related claims.269 These include cases where plaintiffs are trying to compel the federal government to conduct assessments of climate-change-related risks and/or issue protections for climate-change-imperiled species, as well as cases where the government is defending ESA protections for climate-change-imperiled species against legal challenges.270 Government agencies may also be sued regarding the treatment of climate change and climate science in decisions about land management plans, quotas for the sustainable use of resources, and government approvals for infrastructure and facilities that may be affected by climate change.271 Finally, there are some examples of lawsuits aimed at blocking government adaptation measures (e.g., on the grounds that such measures constitute a regulatory taking or are in violation of federal law).272
267. See, e.g., Diné Citizens, 59 F.4th at 1016; 350 Montana v. Haaland, 50 F.4th 1254 (9th Cir. 2022); Sierra Club v. Fed. Energy Regul. Comm’n, 867 F.3d 1357 (D.C. Cir. 2017); Ctr. for Biological Diversity v. U.S. Forest Serv., No. CV 22-114-M-DWM, 687 F. Supp. 3d 1053 (D. Mont. 2023); High Country Conservation Advocs. v. U.S. Forest Serv., 333 F. Supp. 3d 1107 (D. Colo. 2018). Some cases specifically challenge the failure to employ a “social cost of carbon” metric to estimate the significance of GHG emissions. See, e.g., Ctr. for Biological Diversity v. Fed. Energy Regul. Comm’n, 67 F.4th 1176 (D.C. Cir. 2023); Utah Physicians for a Healthy Env’t v. U.S. Bureau of Land Mgmt., 528 F. Supp. 3d 1222, 1228 (D. Utah 2021).
268. See, e.g., AquAlliance v. U.S. Bureau of Reclamation, 287 F. Supp. 3d 969 (E.D. Cal. 2018).
269. Sabin Ctr. for Climate Change Law, Federal Statutory Claims: Endangered Species Act and Other Wildlife Protection Statutes, U.S. Climate Change Litig., https://perma.cc/B9RT-VH3V.
270. See, e.g., Alaska Oil & Gas Ass’n v. Ross, 722 F. App’x 666 (9th Cir. 2018); Ctr. for Biological Diversity v. Zinke, 900 F.3d 1053 (9th Cir. 2018); Alaska Oil & Gas Ass’n v. Pritzker, 840 F.3d 671 (9th Cir. 2016); In re Polar Bear Endangered Species Act Listing & 4(d) Rule Litig., 709 F.3d 1 (D.C. Cir. 2013); Buffalo Field Campaign v. Williams, 579 F. Supp. 3d 186 (D.D.C. 2022), appeal dismissed sub nom. Buffalo Field Campaign v. Haaland, No. 22–5064, 2022 WL 2135456 (D.C. Cir. June 14, 2022)).
271. See, e.g., Maine Lobsterman’s Ass’n, Inc. v. Nat’l Marine Fisheries Serv., 70 F.4th 582 (D.C. Cir. 2023); New York v. Raimondo, 594 F. Supp. 3d 588 (S.D.N.Y. 2022); Sound Action v. U.S. Army Corps of Eng’rs, No. C18–0733JLR, 2019 WL 446614 (W.D. Wash Feb. 5, 2019); Ctr. for Biological Diversity v. Nat’l Marine Fisheries Serv., 977 F. Supp. 2d 55 (D.P.R. 2013), as amended (Oct. 23, 2013), adhered to on reconsideration, 191 F. Supp. 3d 157 (D.P.R. 2016).
272. See, e.g., Complaint, Casa Mira Homeowners Ass’n v. Cal. Coastal Comm’n, No. 19-civ-04677 (Cal. Super. Ct. Dec. 13, 2019); Complaint, Jurisich Oysters, LLC v. U.S. Army Corps of Eng’rs, No. 2:24-cv-00106 (E.D. La. Jan. 11, 2024).
These three categories encompass most but not all of the federal climate claims that have been filed to date. Some examples of lawsuits falling outside of these categories include: (1) legal challenges to federal and state regulations requiring disclosure of GHG emissions and climate-related risks from private companies;273 (2) legal challenges to the federal government’s use of “social cost of carbon” metrics in regulatory programs and other agency actions;274 (3) legal challenges to regulatory approvals of clean energy projects;275 (4) lawsuits seeking to establish liability on the part of corporations for climate-change-related damages;276 and (5) lawsuits seeking to establish obligations on the part of corporate actors to prepare for and respond to the effects of climate change on facilities, operations, or resources under their control.277
Legal Applications of Climate Science
There are several ways in which climate science may factor into the resolution of climate lawsuits. First, climate science may be used to evaluate claims of causation and harm, e.g., whether the GHG emissions at issue in a case cause or contribute to public endangerment or injury to a specific plaintiff. Second, climate science may be used to evaluate whether climate-related risks or harms were or are foreseeable. Finally, climate science may be used to determine the scope of a defendant’s legal obligations and authorities with regard to GHG mitigation, climate change adaptation, climate-related disclosures, and other matters.
Causation and Harm
Disputes about causation and harm arise in different types of climate lawsuits. For example, in cases where plaintiffs are seeking to compel government regulation of GHG emissions from a sector or activity, the parties may dispute the nature and/or magnitude of harm that can be attributed to those emissions, and whether the harm is substantial enough to trigger a regulatory obligation on the part of the government defendant.278 Causation may also be an issue in cases
273. See, e.g., Iowa v. Sec. & Exch. Comm’n, No. 24–1522 and consolidated cases (8th Cir. Mar. 12, 2024); Chamber of Commerce v. California, No. 2:24-cv-00801 (C.D. Cal. Jan. 30, 2024).
274. See Missouri v. Biden, 52 F.4th 362 (8th Cir. 2022), cert. denied, 144 S. Ct. 278 (2023).
275. See, e.g., Seafreeze Shoreside, Inc. v. U.S. Dep’t of the Interior, No. 1:22-CV-11091-IT, 2023 WL 6691015 (D. Mass. Oct. 12, 2023).
276. See supra note 262.
277. Id.
278. See, e.g., Juliana v. United States, 339 F. Supp. 3d 1062, 1096 (D. Or. 2018), rev’d and remanded, 947 F.3d 1159 (9th Cir. 2020). In the foregoing case, a group of youth plaintiffs claimed
where government agencies are defending GHG regulations against legal challenges, insofar as it may be necessary to demonstrate that those emissions cause some form of environmental or public harm in order to justify the regulatory action.279 Finally, the issue of causation and harm tends to be a major element of the standing analysis in cases where the plaintiff is alleging that they have experienced an injury as a result of the defendant’s actions or inaction with regard to GHG emissions and climate change.280
As discussed in the sections of this reference guide titled “Foundational Components of Climate Science” and “Climate Change Detection, Attribution, and Projections,” there is scientific agreement that human GHG emissions are the dominant cause of global climate change. Thus, causation disputes in recent climate cases typically deal with one or both ends of the causation chain linking emissions to impacts (i.e., questions of source attribution and impact attribution). The source attribution questions pertain to the defendant’s contribution to climate change—for example, what are the emissions attributable to the defendant’s conduct, and do those emissions surpass a threshold of materiality or substantiality as may be necessary to establish legal causation? The impact attribution questions pertain to the nature of the alleged harm—for example, has the plaintiff experienced a specific and concrete injury that is attributable to climate change?281 These two sets of questions combine into the overarching question of whether the defendant is responsible for the climate-change-related harms that are at issue in the case.
The contours of this analysis will differ depending on the nature of the claim and the status of the litigants. One important consideration is whether the case requires a showing of particularized injury as opposed to generalized
that the federal government had violated their constitutional rights by permitting, authorizing, and subsidizing fossil fuel extraction and consumption that contributed to climate change. They sought both declaratory and injunctive relief requiring the federal government to reduce emissions from fossil fuels. The district court held that plaintiffs had Article III standing because they had alleged sufficiently personalized and concrete injuries that were fairly traceable to the GHG emissions resulting from U.S. fossil fuel production and use. The Ninth Circuit reversed, holding that plaintiffs had failed to satisfy the redressability prong of standing because the injunctive relief they sought was outside the power of an Article III court.
279. See, e.g., Coalition for Responsible Regulation v. EPA, 684 F.3d 102 (D.C. Cir. 2012).
280. See, e.g., Massachusetts v. EPA, 549 U.S. 497 (2007); Wash. Env’t Council v. Bellon, 732 F.3d 1131 (9th Cir. 2013), reh’g en banc denied, 741 F.3d 1075 (9th Cir. 2014); Comer v. Murphy Oil USA, 585 F.3d 855 (5th Cir. 2009), rev’d and remanded in part, on other grounds, 585 F.3d 855 (5th Cir. 2009); Amigos Bravos v. U.S. Bureau of Land Mgmt., 816 F. Supp. 2d 1118, 1136 (D.N.M. 2011); Juliana, 339 F. Supp. 3d at 1062.
281. These questions of source attribution may implicate questions about climate change and extreme-event attribution. For example, if a plaintiff alleges injury based on exposure to an extreme event, the court would need to refer to extreme-event attribution research to evaluate the relationship between global climate change and the extreme event (what is the attributable risk?), as well as impact attribution data to evaluate the relationship between the plaintiff’s injury and the event.
harm. A showing of particularized injury is required for standing. Specifically, for Article III standing, plaintiffs must demonstrate that: (1) they have experienced an injury-in-fact that is concrete and particularized, and actual or imminent, not conjectural or hypothetical; (2) the injury-in-fact is fairly traceable to the defendants’ allegedly unlawful actions; and (3) the injury could be redressed by a favorable court decision.282 Plaintiffs who are suing on the basis of climate-change-related injuries may attempt to establish these elements by presenting evidence that they are experiencing a unique injury as a result of climate change and that the defendant has made a substantial enough contribution to global climate change such that the injury can be fairly traced to the defendant’s conduct.283
The Supreme Court’s 5–4 decision in Massachusetts v. EPA is illustrative.284 The state of Massachusetts and other petitioners had filed a lawsuit challenging EPA’s denial of a petition to regulate GHG emissions from motor vehicles under the Clean Air Act. One of EPA’s stated rationales for declining the petition was that “a causal link between greenhouse gases and the increase in global surface air temperatures was not unequivocally established.”285 EPA also argued that the petitioners lacked standing because they could not demonstrate a particularized injury that could be fairly traced to its decision to not regulate GHG emissions from motor vehicles. However, the Supreme Court disagreed, finding that:
The harms associated with climate change are serious and well recognized. The Government’s own objective assessment of the relevant science and a strong consensus among qualified experts indicate that global warming threatens, inter alia, a precipitate rise in sea levels, severe and irreversible changes to natural ecosystems, a significant reduction in winter snowpack with direct and important economic consequences, and increases in the spread of disease and the ferocity of weather events. That these changes are widely shared does not minimize Massachusetts’ interest in the outcome of this litigation.286
282. Lujan v. Defs. of Wildlife, 504 U.S. 555 (1992). In addition to these constitutional requirements, there is also a prudential requirement that the complaint be in the zone of interests of the applicable statute in order for the plaintiff to have standing. Bennett v. Spear, 520 U.S. 154 (1997).
283. The second and third elements of standing (causation and redressability) are closely related, sometimes referred to as “two sides of the same coin.” See FDA v. All. for Hippocratic Med., 602 U.S. 367, 380–81 (2024); Ctr. for Biological Diversity v. EPA, 90 F. Supp. 3d 1177, 1190 (W.D. Wash. 2015); Gonzales v. Gorsuch, 688 F.2d 1263, 1267 (9th Cir. 1982); Duke Power Co. v. Carolina Env’t Study Grp., 438 U.S. 59, 74 (1978). Thus, if plaintiffs establish that their injury can be “fairly traced” to the defendant’s conduct, then there is a reasonable prospect that a court order that compels a change in that conduct will at least partially mitigate the injury. However, if the court does not have the authority to issue a remedy, then it may find that plaintiffs lack standing based on this third element. See section titled “Legal Obligations and Authorities” below.
284. Massachusetts v. EPA, 549 U.S. 497 (2007).
285. Id. at 497.
286. Id. at 499.
The Court also went on to find that Massachusetts had suffered a particularized and cognizable injury based on documentary evidence and expert testimony describing climate-related impacts such as the loss of state-owned property to rising sea levels; the added costs to deal with emergency response measures caused by more frequent intense storm surge flooding events; damage to state-owned historic, archaeological, and natural resources; and damage to state-owned facilities and infrastructure along the coast.287 The Court held that this injury could be fairly traced to EPA’s decision not to regulate based on IPCC reports, which demonstrated a clear causal nexus between GHG emissions and climate change impacts as a general matter, and emissions data showing that the unregulated source category (U.S. motor vehicles) generated approximately 1.7 billion metric tons of CO2 in 1999 (more than 6% of worldwide emissions). The Court noted that this was a “meaningful contribution” to global emissions by any metric.288 With regard to redressability, the Court acknowledged that Clean Air Act regulation would not fully mitigate the problem, but the prospect of partial redress was all that was required for Article III standing.289
Turning to the merits of the lawsuit, the Court held that GHG emissions qualified as “air pollutants” within the meaning of the Clean Air Act and that EPA had an obligation to regulate those emissions unless it “determine[d] that greenhouse gases do not contribute to climate change” or otherwise provided “some reasonable explanation as to why it cannot or will not exercise its discretion to determine whether they do.”290 Although the Court remanded to EPA to make its own determination on these issues, the Court’s own decision contained ample information indicating that those GHG emissions did endanger public health and welfare (e.g., the Court’s assertion that the “harms associated with climate change are serious and well recognized” and the Court’s finding that GHG emissions from motor vehicles qualified as a meaningful contribution to global climate change). EPA issued an affirmative endangerment finding for GHG emissions from this source category shortly after the Court issued this judgment, which was subsequently challenged and upheld in Coalition for Responsible Regulation v. EPA, discussed below.291
287. The Court noted that Massachusetts had a “special position and interest” in the case, in part because “it actually owns a great deal of the territory alleged to be affected” by climate change, and in part because of its status as a sovereign state. Id. at 520–23. The Court referred to data in the petitioners’ affidavits showing that “global sea levels rose between 10 and 20 centimeters over the 20th century as a result of global warming and have already begun to swallow Massachusetts’ coastal land” and that “[r]emediation costs alone . . . could reach hundreds of millions of dollars.” Id. at 521–23.
288. Id. at 525.
289. Id. at 525–26.
290. Id. at 501 (“EPA can avoid promulgating regulations only if it determines that greenhouse gases do not contribute to climate change or if it provides some reasonable explanation as to why it cannot or will not exercise its discretion to determine whether they do.”).
291. Shortly before publication of this Manual, EPA issued a proposed rule to rescind the endangerment finding and associated regulations for GHG emissions from motor vehicles. See Reconsideration of 2009 Endangerment Finding and Greenhouse Gas Vehicle Standards, 90 Fed.
Courts may confront questions about whether the GHG emissions at issue in a case are substantial enough to cause legally cognizable harm when adjudicating both standing and the merits of cases (i.e., do the emissions represent a “meaningful” or “material” contribution to climate-change-related harms?).292 The threshold of legal relevance, significance, or materiality will depend on the nature of the claim and the applicable legal standard.293 Attribution research and predictive research can provide technical insights to help answer this question, including insights on the scope and magnitude of impacts that could be attributed to those emissions, but this is ultimately a legal determination.
Questions about whether specific harms can be attributable to global climate change may also arise as part of the standing or the merits analysis. The evidence required to demonstrate such causation depends on the type of injury and, for standing purposes, the scope of the plaintiff’s affected interests. Attribution data tend to be more robust for impacts at a broader spatial and temporal scale, and for certain types of impacts (e.g., heat-related impacts). A plaintiff like the state of Massachusetts will experience many climate impacts at a relatively broad spatial scale, making it easier to demonstrate that at least some of those injuries can be attributed to climate change with reasonable confidence. This is also true for many cities and communities—the breadth of local interests affected by climate change can be quite large, and some communities are directly exposed to trends and events that have been attributed to climate change with high confidence.294 It
Reg. 36288 (proposed Aug. 1, 2025) (to be codified at 40 C.F.R. pts. 85, 86, 600, 1036, 1037, 1039). EPA also issued a proposed rule to rescind the “cause or contribute” findings and associated regulations for GHG emissions from fossil fuel-fired power plants. See Repeal of Greenhouse Gas Emissions Standards for Fossil Fuel-Fired Electric Generating Units, 90 Fed. Reg. 25752 (proposed June 17, 2025) (to be codified at 40 C.F.R. pt. 60). EPA initiated both rulemaking processes pursuant to Exec. Order No. 14154, 90 Fed. Reg. 8353 (Jan. 20, 2025).
292. Some courts have cast doubt on whether the GHG impacts of smaller regulatory decisions and agency actions are sufficiently large to establish standing for specific plaintiffs. See, e.g., Wash. Env’t Council v. Bellon, 732 F.3d 1131, 1135 (9th Cir. 2013) (emissions from Washington power plants amounting to 6% of state’s total GHG emissions not a “meaningful contribution” to climate change), reh’g en banc denied, 741 F.3d 1075 (9th Cir. 2014); Amigos Bravos v. U.S. Bureau of Land Mgmt., 816 F. Supp. 2d 1118, 1136 (D.N.M. 2011) (254,730 metric tons of GHGs per year that might result from the approval of 92 oil and gas leases were not a “meaningful contribution” to global climate change).
293. For example, to support tort claims, plaintiffs may need to demonstrate that defendants made a “substantial contribution” to their injury (although the precise standard depends on the jurisdiction). Under the Clean Air Act, EPA has a legal obligation to regulate air pollution that will “cause or contribute” to the endangerment of public health and welfare. Under NEPA, the federal government has a legal obligation to conduct a comprehensive analysis of “significant” environmental impacts. These vague textual standards have been fleshed out, to some extent, through litigation—but as with standing, there are no firm quantitative thresholds for such standards, and these are ultimately subjective, case-specific determinations.
294. For example, many communities are already experiencing frequent floods and inundation as a result of sea-level rise. William Sweet et al., Sea Level Rise and Nuisance Flood Frequency
is potentially more difficult to downscale impact attribution claims to the level of individual injury, but this depends on the specific injury at issue.295
There are some cases where litigants do not need to demonstrate particularized harm as a result of climate change, but it is necessary for a plaintiff or defendant to establish a link between climate change and more generalized harm. This may be the case when a government agency is defending GHG regulations or other climate policies in court.296 For example, in Coalition for Responsible Regulation v. EPA, the D.C. Circuit Court of Appeals was tasked with evaluating the legality of a Clean Air Act endangerment finding in which EPA had determined that GHG emissions from motor vehicles “cause, or contribute to, air pollution which may reasonably be anticipated to endanger public health or welfare.”297 One critical question was whether EPA could rely on IPCC, USGCRP, and NRC reports to establish a causal link between motor vehicle GHG emissions and public endangerment. The court held that EPA’s reliance on these external studies was entirely proper and that the endangerment finding was supported by a “substantial” body of evidence amassed through decades of scientific research on climate change.298
The court specifically confronted arguments that there was “too much uncertainty” about the science underpinning climate change, and that EPA had improperly “delegated” its judgment to the IPCC, USGCRP, and NRC by relying on those assessments of climate science.299 The court disagreed on both
Changes Around the United States, NOAA Tech. Rep., NOS CO-OPS 073 (2014), https://perma.cc/F4SM-BERS; Kristina A. Dahl et al., Effective Inundation of Continental United States Communities with 21st Century Sea Level Rise, 5 Elementa: Sci. of the Anthropocene 1 (2017), https://doi.org/10.1525/elementa.234. Many communities have also been adversely affected by extreme events that were likely exacerbated by climate change, such as Hurricane Harvey. See Wehner & Samson, supra note 87.
295. The court in Juliana v. United States, 339 F. Supp. 3d 1062, 1096 (D. Or. 2018), rev’d and remanded, 947 F.3d 1159 (9th Cir. 2020), provides an example of how attribution research can factor into standing disputes as well as the merits of cases involving government obligations and individual rights. For a detailed discussion of that case, see Burger et al., supra note 77, at 164–66. See also Jessica Wentz, Climate Science and Litigation, in Research Handbook on Climate Change Litigation (Francesco Sindico et al. eds., 2024).
296. Another example would be NEPA lawsuits where plaintiffs are seeking to compel federal agencies to account for GHG impacts from federal actions. Although plaintiffs must establish standing in such cases, the causation requirements are relaxed for procedural claims under NEPA, and plaintiffs can also establish standing on the basis of injuries flowing from other deficiencies in the NEPA documentation. See, e.g., WildEarth Guardians v. Jewell, 738 F.3d 298 (D.C. Cir. 2013); WildEarth Guardians v. Bureau of Land Mgmt., 8 F. Supp. 3d 17 (D.D.C. 2014). See also Jessica Wentz, Environmental Impact Assessment, in Global Climate Change and U.S. Law (Michael B. Gerrard et al. eds., 3d ed. 2023); Wentz, supra note 295; Massachusetts v. EPA, 549 U.S. 497, 498 (2007) (holding that standing requirements are relaxed where plaintiffs are seeking to enforce procedural rights created by Congress); TransUnion LLC v. Ramirez, 594 U.S. 413, 414 (2021) (holding that, even in the context of a statutory violation, the asserted injury must have a “close historical or common-law analogue”).
297. Coal. for Responsible Regul. v. EPA, 684 F.3d 102 (D.C. Cir. 2012); Clean Air Act § 202(a)(1), codified as amended at 42 U.S.C. 7521(a)(1).
298. Coal. for Responsible Regul., 684 F.3d at 120.
299. Id. at 119–21.
counts. In upholding EPA’s reliance on the external studies, it noted that these “peer-reviewed assessments synthesized thousands of individual studies on various aspects of greenhouse gases and climate change” and that EPA was “not required to re-prove the existence of the atom every time it approaches a scientific question.”300 The court also rejected petitioners’ argument that EPA could not rely on IPCC assessments because some of the studies referenced therein were not peer reviewed—it noted that the IPCC assessment relied on approximately 18,000 studies that were peer reviewed, and petitioners had not “uncovered a ‘pattern’ of flawed science” in the assessments that undermined the endangerment finding.301 On the more general issue of whether there was too much uncertainty about climate change impacts to justify the endangerment finding, the court found that EPA had supported its determination through three key lines of evidence: (1) “basic physical understanding” of the greenhouse effect, (2) observational evidence of past climate change, and (3) models predicting how the climate will respond to GHG concentrations in the future.302
Foreseeability
There are many different types of climate cases that implicate questions about the foreseeability of climate change impacts. Such questions tend to be prominent in cases involving adaptation and disclosure-related claims, where the core factual dispute may center on whether certain risks or impacts are “reasonably foreseeable” or “speculative,” as this is relevant to determining whether a defendant is required or authorized to take some action or make a disclosure in response to climate change. For example, disputes about the foreseeability of impacts are common in NEPA and ESA litigation. Questions about foreseeability may also arise in the context of causation inquiries—for example, where plaintiffs seek to establish standing based on an “imminent” injury, or when a government agency defends regulatory action based on the risk of future harm.
Both attribution research and predictive research can be used to evaluate the foreseeability of climate change impacts. Attribution research provides insights on the trends and impacts that are already occurring as a result of anthropogenic climate change, thus allowing a court to determine whether specific trends and impacts are hypothetical or speculative. Predictive research provides insights on the future trajectory of those trends and impacts under different emissions and warming scenarios. Courts can refer to scientific assessments of confidence and likelihood when evaluating whether specific trends and impacts are foreseeable as opposed to speculative or hypothetical.
300. Id. at 120.
301. Id. at 125.
302. Id. at 120–21.
Some of the most detailed scientific disputes involving the foreseeability of climate impacts have arisen in the context of ESA litigation.303 Many of the ESA cases address how federal agencies should deal with scientific uncertainty when evaluating the foreseeability and likelihood of specific trends and impacts that may pose a threat to a species (e.g., warmer ocean temperatures, the loss of Arctic sea ice, declines in food sources). Although courts are generally deferential to agency conclusions about climate change and scientific uncertainty,304 courts have also held that an agency cannot simply ignore climate-change-related threats on the basis of uncertainty or imprecision—the agency must formulate a rationale finding about the probability of threats, taking into account the “best scientific evidence,” including available climate research.305
There are also cases where parties may dispute the foreseeability of GHG emissions. Such disputes may arise, for example, in the context of NEPA litigation where plaintiffs are seeking disclosure of emissions from federal actions, and in the context of lawsuits involving corporate climate disclosures. In this context, courts can refer to source attribution data to determine whether emissions are reasonably foreseeable and should be addressed in NEPA documentation or other planning and disclosure documents.
Legal Obligations and Authorities
Climate science can also inform judicial determinations about the scope of a defendant’s legal obligations and/or authorities with regard to climate change mitigation, disclosure, and adaptation. Where climate science factors into such determinations, it is typically in relation to the analysis of causation and foreseeability, as discussed above.306 For example, whether a government agency is authorized or required to regulate GHG emissions from a particular source category may depend
303. See Daniel Kim et al., Judicial Review of Scientific Uncertainty in Climate Change Lawsuits: Deferential and Nondeferential Evaluation of Agency Factual and Policy Determinations, 46 Harvard Env’t L. Rev. 367 (2022), https://perma.cc/YQ5E-BZY6; Jessica Wentz, Climate Change Attribution Science and the Endangered Species Act, 39 Yale J. Regul. 1043 (2022), https://perma.cc/YW2Y-QB4C. Some significant scientific disputes have also arisen in the context of other wildlife protection statutes, such as the Marine Mammal Protection Act (MMPA). See, e.g., Ctr. for Biological Diversity v. Kempthorne, 588 F.3d 701 (9th Cir. 2009).
304. See, e.g., Nat. Res. Def. Council, Inc. v. Coit, 597 F. Supp. 3d 73 (D.D.C. 2022); Ctr. for Biological Diversity v. Lubchenco, 758 F. Supp. 2d 945 (N.D. Cal. 2010). See also Kempthorne, 588 F.3d 701 (upholding federal government’s conclusions about climate-change-related threats to species in the context of an MMPA claim).
305. See, e.g., Ctr. for Biological Diversity v. Zinke, 900 F.3d 1053 (9th Cir. 2018); Greater Yellowstone Coal. Inc. v. Servheen, 665 F.3d 1015 (9th Cir. 2011); Defs. of Wildlife v. Jewell, 176 F. Supp. 3d 975 (D. Mont. 2016). See also Wentz, supra note 303; Kim, supra note 303.
306. This analysis would encompass questions related to whether emissions represent a material or substantial contribution to global climate change.
on whether there is sufficient record evidence that those emissions are contributing to public endangerment.307 Alternatively, whether a federal agency has an obligation to disclose GHG emissions and climate-change-related impacts under NEPA depends on whether those impacts are reasonably foreseeable, caused by the action under review, and sufficiently large such that they represent a material contribution to climate change.308 Federal agencies may also have NEPA obligations to disclose climate change impacts that are not caused by the action under review, specifically insofar as those impacts may affect baseline environmental conditions and influence the environmental outcomes of the project.309
The analysis of foreseeability also plays a prominent role in judicial assessments of legal obligations to assess, prepare for, and respond to the effects of climate change. For example, whether the federal government is required or authorized to issue protections for species under the ESA depends, in part, on whether there is a foreseeable risk of harm to those species. In ESA cases, courts have consistently held that climate science qualifies as the “best available science” that must be considered when agencies are making decisions about listing determinations, critical habitat designations, and other decisions involving the management and protection of endangered and threatened species.310 Courts have also upheld the federal government’s use of climate science to support ESA protections for species that are at risk of extinction because of climate change, specifically rejecting arguments that projections of future climate change are “too speculative” to support the government’s assessment of risk.311
307. See, e.g., Coal. for Responsible Regul. v. EPA, 684 F.3d 102, 122 (D.C. Cir. 2012).
308. See, e.g., Food & Water Watch v. Fed. Energy Regul. Comm’n, 28 F.4th 277 (D.C. Cir. 2022); Montana v. Haaland, 50 F.4th 1254 (9th Cir. 2022); Ctr. for Biological Diversity v. Bernhardt, 982 F.3d 723 (9th Cir. 2020); Sierra Club v. Fed. Energy Regul. Comm’n, 867 F.3d 1357 (D.C. Cir. 2017); Ctr. for Biological Diversity v. Nat’l Highway Traffic Safety Admin., 538 F.3d 1172 (9th Cir. 2008). For examples of cases where courts did not require disclosures for actions with smaller GHG impacts, see Hapner v. Tidwell, 621 F.3d 1239 (9th Cir. 2010); Senville v. Peters, 327 F. Supp. 2d 335 (D. Vt. 2004). See also Wentz (2023), supra note 296; Michael Burger & Jessica Wentz, Evaluating the Effects of Fossil Fuel Supply Projects on Greenhouse Gas Emissions and Climate Change Under NEPA, 44 Wm. & Mary Env’t L. & Pol’y Rev. 423 (2020), https://perma.cc/P87F-RTYL.
309. See, e.g., AquAlliance v. U.S. Bureau of Reclamation, 287 F. Supp. 3d 969, 1023–24 (E.D. Cal. 2018); Conservation Cong. v. U.S. Forest Serv., No. 2:13-CV-01977-JAM-DB, 2018 WL 1142199 (E.D. Cal. Mar. 2, 2018).
310. See Alejandro E. Camacho, Endangered Species Act, in Global Climate Change and U.S. Law 237–54 (Michael B. Gerrard et al. eds., 2023); Wentz (2022), supra note 303. See also Greater Yellowstone Coal., Inc. v. Servheen, 665 F.3d 1015 (9th Cir. 2011); Defs. of Wildlife v. Jewell, 176 F. Supp. 3d 975 (D. Mont. 2016); Nat’l Res. Def. Council v. Kempthorne, 506 F. Supp. 2d 322 (E.D. Cal. 2007); Pac. Coast Fed’n Fishermen’s Ass’ns v. Gutierrez, 606 F. Supp. 2d 1122, 1184 (E.D. Cal. 2008); S. Yuba River Citizens League v. Nat’l Marine Fisheries Serv., 723 F. Supp. 2d 1247, 1274 (E.D. Cal. 2010); Ctr. for Biological Diversity v. Salazar, 804 F. Supp. 2d 987, 1008 (D. Ariz. 2011).
311. See, e.g., Alaska Oil & Gas Ass’n, 722 F. App’x 666 (9th Cir. 2018); Alaska Oil & Gas Ass’n v. Pritzker, 840 F.3d 671 (9th Cir. 2016); In re Polar Bear Endangered Species Act Listing & 4(d) Rule Litig., 709 F.3d 1 (D.C. Cir. 2013).
Acknowledgments
The authors would like to acknowledge the insights and helpful feedback provided by Vivien Gornitz, Michael Gerrard, Michael Burger, and the committee responsible for development of the Reference Manual on Scientific Evidence.
Glossary of Terms
The following terms and definitions were adapted from various sources, including the Intergovernmental Panel on Climate Change (IPCC), the World Meteorological Organization (WMO), the U.S. Global Change Research Program (USGCRP), and the U.S. Environmental Protection Agency (EPA).
adaptation. The process of adjustment to actual or anticipated climate change and its effects.
anthropogenic climate change. A change in climate that can be attributed directly or indirectly to human activity.
anthropogenic emissions. Emissions of greenhouse gases (GHGs), precursors to GHGs, and aerosols caused by human activities. These activities include the burning of fossil fuels, deforestation, land use and land-use changes, livestock production, fertilization, waste management, and industrial processes.
atmosphere. The gaseous envelope surrounding the Earth that comprises five layers (troposphere, stratosphere, mesosphere, thermosphere, and exosphere). The atmosphere contains various gases, including water vapor and GHGs. The atmosphere is one component of the global climate system.
attribution. The process of evaluating the relative contributions of multiple causal factors to a change or event.
biogeochemical cycle. The biological, geological, and chemical cycling of elements such as carbon between different global systems (including living and nonliving systems). The carbon cycle is an example of a biogeochemical cycle.
biosphere. The part of the earth system comprising all ecosystems and living organisms, including within the atmosphere, on land (terrestrial biosphere), or in oceans (marine biosphere).
carbon budget. The amount of cumulative net global anthropogenic emissions that would result in limiting global warming to a given level within a given probability, taking into account the effect of other anthropogenic climate forcers. The carbon budget may be calculated in reference to carbon dioxide (CO2) emissions exclusively, or in reference to combined emissions of CO2, methane (CH4), nitrous oxide (N2O), and other gases.
carbon dioxide (CO2). A heat-trapping gas. It occurs naturally but is also a byproduct of burning fossil fuels and biomass, land-use change, and industrial processes. It is the principal anthropogenic GHG that affects the Earth’s radiative balance. It is the reference gas against which the potency of other GHGs is measured and therefore has a global warming potential (GWP) of 1.
carbon sink. A type of carbon pool (natural or human, in soil, ocean, and plants) that stores or takes up more carbon than it releases into the atmosphere.
climate. The climate can be defined, alternatively, as the state of the climate system, or the average weather conditions over a period of time ranging from months to thousands or millions of years. The World Meteorological Organization (WMO) uses a standard period of thirty years to characterize climate conditions. See also climate system.
climate change. A change in the state of the climate (or global climate system) that can be identified by changes in the mean and/or variability of properties and that persists for an extended period, typically decades or longer. The climate system changes in time under the influence of its own internal dynamics and because of external forcings, such as volcanic eruptions, solar variations, orbital forcing, and anthropogenic forcings.
climate forcer. Any substance or process that affects the flow of energy coming into or out of the global climate system, thus affecting the amount of heat retained within the system. Anthropogenic climate forcers include GHGs, aerosols, and changes in land use that make land reflect more or less solar energy. There are also natural climate forcers, such as solar radiation and the particulate matter from volcanic eruptions. See also radiative forcing.
climate forcing. The net effect of various climate forcers on the flow of energy coming into or out of the global climate system.
climate model. A qualitative or quantitative representation of the climate system based on the physical, chemical, and biological properties of its components, as well as their interactions and feedback processes. Climate models are used as research tools to study and simulate the effect of anthropogenic forcings on the climate system.
climate projection. A simulated response of the climate system to a scenario of future emissions or concentrations of greenhouse gases, aerosols, and changes in land use, generally derived using climate models.
climate system. The global system that determines climate conditions, consisting of five major components (the atmosphere, the hydrosphere, the cryosphere, the lithosphere, and the biosphere) and the interactions among them.
confidence interval. A range of values calculated from the results of a study within which the true value is likely to fall. The range of this interval depends on the confidence level—e.g., if the confidence level is 95%, then there is a 95% probability that the true value of a parameter will fall within the range of values provided in the confidence interval. The size of a confidence interval provides insight on the level of precision and range of uncertainty in study results.
confidence level. The probability that a particular value falls within a specified confidence interval.
cryosphere. The frozen components of the earth system, including sea ice, lake ice, river ice, snow cover, glaciers, ice sheets, ice caps, ice shelves, and frozen ground (permafrost). The cryosphere is part of the global climate system.
detection. The process of demonstrating that the climate system (or a system affected by the climate system) has changed in some defined statistical sense. As per IPCC definitions, an identified change is detected in observations if its likelihood of occurrence because of internal variability alone is determined to be small, for example <10%.
fraction of attributable risk. In climate change research, the fraction of attributable risk (FAR) is the ratio of a particular outcome occurring with and without human influence on climate. Mathematically speaking, FAR = 1 − P0/P1 (where P1 equals the probability of the outcome occurring in the presence of anthropogenic forcing of the climate system, and P0 equals the probability of the event occurring if the anthropogenic forcing were not present).
global warming potential (GWP). A measurement of the radiative forcing from a unit of a given substance, accumulated over a chosen time horizon, relative to that of CO2.
greenhouse gas (GHG). A gas that absorbs incoming solar radiation (i.e., heat) in the atmosphere, preventing it from escaping into space. GHGs in the Earth’s atmosphere include water vapor, carbon dioxide (CO2), methane (CH4), nitrous oxide (N2O), ozone, chlorofluorocarbons (CFCs), hydrochlorofluorocarbons (HCFCs), hydrofluorocarbons (HFCs), perfluorocarbons (PFCs), sulfur hexafluoride (SF6), and nitrogen trifluoride (NF3).
hydrosphere. The components of the earth system including liquid surface and subterranean water, such as oceans, seas, rivers, freshwater lakes, underground water, and wetlands. The hydrosphere is part of the global climate system.
lithosphere. The rocky outer portion of the Earth, composed of the crust and upper part of the mantle. The lithosphere is part of the climate system, as it absorbs and reflects solar energy, radiates heat, stores carbon, and interacts with regional climate conditions.
methane (CH4). A greenhouse gas; methane is the main constituent of natural gas, and key anthropogenic sources of methane include oil and gas systems, landfills, agricultural and livestock activities, coal mining, fossil fuel combustion, wastewater treatment, industrial processes, and land use changes. Methane is more than twenty-five times as potent as CO2, but it has a shorter atmospheric lifetime and is eventually converted into CO2 in the atmosphere. Methane is the second largest contributor to anthropogenic climate forcing, after CO2.
model ensembles. Can refer to both (1) the full set of models, for example climate models developed by different modeling centers, used by the IPCC and other bodies for risk assessment, and (2) the averaging of results across multiple such models. The averaging of multiple models is generally considered more reliable than the use of a single model, although presenting the results separately from all the models is often considered superior to showing only the average across models, since the former gives a sense of the range of possible outcomes and important uncertainties.
natural variability. Naturally occurring variations in the mean state and other statistical measures of the climate.
nitrous oxide (N2O). A greenhouse gas produced by agriculture, fuel combustion, industrial processes, and waste management systems, as well as natural systems. Nitrous oxide is approximately 300 times more potent than CO2 but it is shorter lived in the atmosphere. Nitrous oxide also contributes to ozone depletion. It is the third largest contributor to anthropogenic climate forcing, after CO2 and methane.
radiative forcing. The change in energy flux within the Earth’s atmosphere caused by natural or anthropogenic climate forcers (e.g., increasing atmospheric concentrations of CO2). Positive radiative forcing occurs when the Earth receives more incoming energy from sunlight than it radiates into space, and this net gain of energy causes warming.
relative risk. In climate studies, the relative risk is the ratio of probabilities for an event or impact occurring with and without anthropogenic influence on the climate system (or at varying levels of anthropogenic influence on the climate system).
tipping point. A critical threshold beyond which a system reorganizes, often abruptly and/or irreversibly.
References
Select References on Climate Science
American Meteorological Society, Explaining Extreme Events from a Climate Perspective, https://www.ametsoc.org/ams/index.cfm/publications/bulletin-of-the-american-meteorological-society-bams/explaining-extreme-events-from-a-climate-perspective.
Climate Science, in Stanford Encyclopedia of Philosophy (first published May 11, 2018), available at https://plato.stanford.edu/entries/climate-science.
IPCC, Climate Change 2021: The Physical Science Basis. Contribution of Working Group I to the Sixth Assessment Report of the IPCC (2021).
IPCC, Climate Change 2022: Impacts, Adaptation, and Vulnerability, Working Group II Contribution to the Sixth Assessment Report of the IPCC (2022).
IPCC, Climate Change 2022: Mitigation of Climate Change, Working Group III contribution to the Sixth Assessment Report of the IPCC (2022).
IPCC, Global Warming of 1.5°C. An IPCC Special Report on the Impacts of Global Warming of 1.5°C Above Pre-Industrial Levels and Related Global Greenhouse Gas Emission Pathways (2018).
National Academies of Science, Engineering, and Medicine, Attribution of Extreme Weather Events in the Context of Climate Change (2016).
National Research Council, Climate Change: Evidence and Causes: Update 2020 (2020).
U.S. Global Change Research Program, Fourth National Climate Assessment, Vol 1: Climate Science Special Report (2017).
U.S. Global Change Research Program, Fifth National Climate Assessment (2023).
U.S. Global Change Research Program, Second State of the Carbon Cycle Report (2018).
WMO, Provisional State of the Global Climate 2022 (Nov. 2022).
Select References on Climate Science and the Law
Myles Allen, Liability for Climate Change, 421 Nature 891 (2003).
Maria L. Banda, Climate Science and the Courts: A Review of U.S. and International Judicial Pronouncements, Environmental Law Institute (2020).
Michael Burger et al., The Law and Science of Climate Change Attribution, 5 Columbia Journal of Environmental Law 57 (2020).
Daniel Kim et al., Judicial Review of Scientific Uncertainty in Climate Change Lawsuits: Deferential and Nondeferential Evaluation of Agency Factual and Policy Determinations, 46 Harvard Environmental Law Review 367 (2022).
E.A. Lloyd & T.G. Shepherd, Climate Change Attribution and Legal Contexts: Evidence and the Role of Storylines, 167(3–4) Climatic Change 28 (2021).
Appendix: Overview of Scientific Organizations and Government Agencies Involved in the Production, Synthesis, and Dissemination of Climate Science
World Meteorological Organization (WMO)
The WMO is a United Nations (UN) agency responsible for coordinating and advancing climatological and meteorological research around the world.312 One key goal of the WMO is to promote the “free and unrestricted” exchange of data, information, and research between the 193 countries and territories that are signatories to the WMO convention.313 The WMO is governed by the World Meteorological Congress, which is composed of member states.
Although the WMO is a political organization, it is recognized as an authoritative source of climatological and meteorological data. It provides standardized data products for climate research, most notably the “Climatological Standard Normals,” which provide information on typical climate conditions averaged over thirty-year periods for thousands of locations across the world.314 The WMO also publishes an annual State of the Global Climate Report that summarizes the latest observations and findings for various “global climate indicators” including greenhouse gases, global temperature, ocean heat content, sea level, marine heat waves, the cryosphere, and precipitation.315 The report also discusses natural phenomena that are important drivers of year-to-year variability in weather patterns, such as the El Niño Southern Oscillation, and explains how these have influenced recent weather observations.
Intergovernmental Panel on Climate Change (IPCC)
The IPCC is widely considered to be the leading scientific body for the assessment and synthesis of research on climate change. It was established in 1988 by the United Nations Environment Programme (UNEP) and the WMO as an
312. The WMO originated from the International Meteorological Organization (IMO), which was a nongovernmental organization founded in the late 1800s in order to promote the exchange of meteorological research. The WMO was subsequently established as a direct successor of the IMO through an agreement of UN member states in 1950.
313. WMO, Overview, https://perma.cc/SC9L-CTSL.
314. See WMO, WMO Climatological Normals, https://perma.cc/65TT-69XV.
315. See, e.g., WMO, Provisional State of the Global Climate, https://perma.cc/X8J7-KVX7.
intergovernmental body of the UN. Its primary mandate is to provide governmental bodies and the public with regular assessments of the scientific basis for climate change, its impacts and future risks, and options for mitigation and adaptation.316 It is governed by 195 member states.317 There are also nearly 200 observer organizations that participate in IPCC activities—for example, by nominating scientists to serve as report authors, and by reviewing draft reports.318
The IPCC publishes periodic assessments of the state of the scientific knowledge on anthropogenic climate change. The IPCC does not conduct its own research; rather, it conducts systematic reviews of relevant scientific publications and then synthesizes key findings from the literature in its assessments. It does so with the assistance of thousands of scientists with diverse expertise across the field of climate research.319 There are three IPCC working groups involved in the assessment process: Working Group I synthesizes research on the physical-science basis for anthropogenic climate change, including research on the changes that are already underway as well as projections of future climate change; Working Group II synthesizes research on the physical, social, and economic impacts of climate change; and Working Group III synthesizes research on potential pathways for mitigating and adapting to climate change. The experts involved in these working groups are selected by IPCC member governments, observer organizations, and the IPCC Bureau.
The IPCC conducts a comprehensive assessment of climate science every six to seven years. During this process, each working group prepares a full “assessment report” that contains a detailed technical discussion of its respective topic.320 Each draft report undergoes an initial review by a team of scientific and technical experts and then a second review by governments and experts. A
316. See IPCC, History of the IPCC, https://perma.cc/W5K7-PT4B.
317. Representatives of IPCC member governments meet one or more times a year in plenary sessions. The member states elect a Bureau of Scientists to guide technical activities for each assessment cycle. They also review and approve draft assessments. IPCC, Structure of the IPCC, https://perma.cc/7LZ2-F9CP.
318. Any nonprofit body or agency with relevant expertise may apply to become an IPCC observer organization. The current list of observer organizations includes UN bodies and organizations, intergovernmental organizations, government agencies, universities, scientific research organizations, environmental NGOs, and industry NGOs. Representatives of observer organizations may attend sessions of the IPCC and the plenary sessions of the IPCC working groups. They are also invited to encourage experts to review draft IPCC reports. See IPCC, Structure, supra note 317; IPCC, Observer Organizations, https://perma.cc/697T-GKC7.
319. The scientists involved in the assessments are selected through a nomination process. Prior to initiating an assessment, the IPCC issues a call to governments and IPCC observer organizations for nominations; the authors are then selected by the Bureau of Scientists on the basis of their expertise. The IPCC seeks to build author teams that reflect a range of scientific, technical, and socioeconomic expertise. See IPCC, Factsheet: How Does the IPCC Select Its Authors?, https://perma.cc/45V6-W8TB.
320. For a complete explanation of the process governing IPCC assessments, see IPCC, Procedures, https://perma.cc/C39M-TW6H.
selection of scientists within each working group then produces a Summary for Policymakers (SPM), which is intended to help policy makers and nonscientists understand key findings from each report. The IPCC member states conduct a detailed review of each SPM, in consultation with scientists, and they must approve the SPM line-by-line. The IPCC member states also approve the full reports, but that approval process is less detailed and government inputs are more limited (as compared with the SPMs). At the end of the assessment process, the IPCC also prepares a Synthesis Report that combines findings from all three working groups. The Synthesis Report goes through the same type of review process as other reports, with an SPM subject to detailed review by member states.
The IPCC also publishes methodology reports, technical papers, and other special reports in response to requests for scientific and technical information from the United Nations Framework Convention on Climate Change (UNFCCC), governments, and international organizations. For example, in 2018, the IPCC issued a special report evaluating the impacts of climate change if anthropogenic emissions caused global warming at or in excess of 1.5°C.321
Although the IPCC is generally considered to be a global authority on climate science, it has been critiqued on the grounds that it is a political institution subject to the governance of member states. Concerns have also been raised about the inclusion of experts with potential bias in the assessment process (e.g., representatives from renewable energy industry associations or, conversely, from fossil fuel industry associations).322 While no organization is perfect, an argument can be made that the structure of the IPCC actually contributes to institutional legitimacy and helps mitigate individual bias on the part of report authors and government representatives.323 The assessments are prepared with the help of a large number of contributors, including the report authors (which include physical scientists as well as researchers with other expertise), governmental representatives, and observer organization representatives, and they reflect the consensus on the part of both scientific experts and governments. The assessments have also received criticism from both sides of the climate change debate (some arguing that they overestimate the severity of anthropogenic climate change, others arguing that they underestimate the severity).324 This suggests that there is not a pervasive industry or environmental bias within the IPCC.
321. IPCC 1.5°C Report, supra note 253, at 5.
322. See, e.g., Editorial: Evolving the IPCC, 1 Nature Climate Change 227 (2011), https://doi.org/10.1038/nclimate1189.
323. See, e.g., Eric Paglia & Charles Parker, The Intergovernmental Panel on Climate Change: Guardian of Climate Science, in Guardians of Public Value (A. Boin et al. eds., 2021).
324. See, e.g., Naomi Oreskes, Climate Change Will Cost Us Even More Than We Think, N.Y. Times, Oct. 23, 2019.
Other Major Scientific Organizations
There are several U.S.-based organizations that play a key role in the dissemination of climate research. These include the American Meteorological Society (AMS), the American Geophysical Union (AGU), and the National Academies of Sciences, Engineering, and Medicine (National Academies or NASEM). The scientific community views all three as credible sources of climate science.
The National Academies were established by the federal government in 1863, with a specific mandate of providing scientific assessments to help support government decision-making. Although the National Academies’ mandate is to assist the federal government, they are fully independent from the government.325 Like the IPCC, the National Academies do not conduct independent research; rather they assess and synthesize existing research in order to provide objective scientific advice. They periodically publish reports on scientific matters of national significance. They have published numerous reports on the topic of climate change, including Climate Change: Evidence and Causes326 and Attribution of Extreme Weather Events in the Context of Climate Change.327 The National Academies also maintain peer-reviewed scientific journals, most notably the Proceedings of the National Academies of Sciences (PNAS), and they are involved in reviewing the National Climate Assessments prepared by the federal government (discussed below). For many years, the National Research Council (NRC) was the operating arm of the National Academies (e.g., the NRC published many scientific reports); but the NRC has since been reorganized into seven program units with different thematic focuses.328
The AMS is a professional membership organization involved in the dissemination of atmospheric, oceanic, and hydrologic sciences. It was founded in 1919 with the mission of advancing scientific research in these fields, and since then it has grown to a membership of nearly 12,000 scientific professionals.329 The AMS maintains a number of publications that disseminate new research in climate science and related fields. These include the Bulletin of the American Meteorological Society (BAMS), the Journal of the Atmospheric Sciences, the Journal of Applied Meteorology and Climatology, Earth Interactions, and the Journal of Climate, among others. These are all peer-reviewed publications with excellent standing in the scientific community. Each year, AMS also publishes a State of the Climate report as a supplement to BAMS as well as a special edition of BAMS on Explaining Extreme Events from a Climate Perspective.330 This is an annual review of
325. NASEM, About Us, https://perma.cc/972L-WJPK.
326. NAS Update, supra note 6.
327. NASEM, supra note 91, at 51.
328. NASEM, Our Program Divisions and Units, https://perma.cc/ZXZ4-MXGG.
329. AMS, About the American Meteorological Society, https://perma.cc/Y4MA-CXCW.
330. BAMS, Explaining Extreme Events from a Climate Perspective, https://perma.cc/ZG2C-LRZS.
peer-reviewed research assessing how anthropogenic climate change has affected the magnitude, likelihood, and other characteristics of extreme events such as floods and heat waves.
The AGU is a professional membership organization involved in the dissemination of atmospheric, ocean, hydrologic, space, and planetary research. It was established in 1919 by the NRC and it operated as an affiliate of the National Academies until it was independently incorporated in 1972.331 It now has more than half a million members from around the world. Like AMS, AGU maintains various peer-reviewed publications that disseminate new research in climate science and related fields. These include the Journals of Geophysical Research, the Journal of Advances in Modeling Earth Systems, Earth and Space Science, and Geophysical Research Letters. As with AMS publications, the AGU journals have excellent standing in the scientific community.
Government Agencies
The U.S. federal government also plays a major role in both the production and dissemination of climate research.332 The federal programs and agencies that have been most heavily involved in the production of climate science outputs include the U.S. Global Change Research Program (USGCRP), the National Oceanic and Atmospheric Administration (NOAA), the National Aeronautics and Space Administration (NASA), the U.S. Geological Survey (USGS), and the Environmental Protection Agency (EPA).
The USGCRP has been the leading federal entity involved in the coordination and dissemination of research on climate change. The program began as a presidential initiative in 1989 and was subsequently codified by Congress in 1990 as “a comprehensive and integrated United States research program which will assist the Nation and the world to understand, assess, predict, and respond to human-induced and natural processes of global change.”333 Per this Congressional directive, the USGCRP has coordinated federal research on climate change and has periodically published National Climate Assessments (NCAs), which
331. AGU, Learn About AGU, https://perma.cc/RFY9-6WZ3.
332. Many states also have government agencies involved in the production and dissemination of climate research. But for the purposes of this reference guide, we focus on scientific outputs from federal agencies, as federal judges are more likely to engage with these outputs.
333. Global Change Research Act of 1990, Pub. L. 101–606, title I, § 101, 104 Stat. 3096 (codified at 15 U.S.C. § 2931). Presidential Administrations and Congress have taken various positions on the program. Kathryn G. Kynett, Cong. Rsch. Serv., R48478, U.S. Global Change Research Program (USGCRP): Overview and Considerations for Congress (2025). In April 2025, several federal contracts supporting USGCRP were reportedly canceled and federal staff previously involved in the program were reportedly dismissed. At the time of writing, the USGCRP website appears to no longer be available. See id.
summarize the latest science on anthropogenic climate change, including research on how climate change is affecting and may affect the United States now and in the future.334 These reports have been a useful supplement to IPCC assessments insofar as they focus on the U.S. context. The Fifth National Climate Assessment (NCA5) was published in 2023.
A number of other federal agencies, including NOAA, NASA, USGS, and EPA, are directly involved in climate research and the production of climate data products.335 NOAA plays a particularly important role in federal climate research and dissemination—it maintains records of climate indicators (e.g., national precipitation and temperature records) and publishes monthly reports summarizing the latest climate data for the United States and the globe.336 NASA also produces and maintains climate data products—these include satellite data as well as outputs from NASA weather and climate models.337 The USGS carries out geophysical research on climate change and its impacts as part of its Ecosystems Land Change Science Program,338 and it also maintains national and regional Climate Adaptation Science Centers, which are collaborative scientific partnerships aimed at building knowledge to help resource managers and communities prepare for and respond to the effects of climate change.339 EPA primarily conducts research on the environmental and public health effects of climate
334. Among other responsibilities, the USGCRP is required by Congress to develop an assessment of global change at least every four years, which means that the deadline to submit the Sixth National Climate Assessment to Congress is 2027. See 15 U.S.C. § 2931. A court enforced this deadline in the past, in Center for Biological Diversity v. Brennan, 571 F. Supp. 2d 1105 (N.D. Cal. 2007).
335. This is not an exhaustive list of all federal entities involved in climate research. So many agencies are involved in climate research because climate change research involves many areas of science and has such far-reaching implications for the U.S. government, citizens, and natural resources. Other departments and agencies, including but not limited to the Department of Energy (DOE), the Department of Interior (DOI), the Department of Defense (DOD), the Department of Agriculture (USDA), and agencies and services within these departments, also conduct climate-related research relevant to their respective mandates. Recently, the DOE established a Climate Working Group, consisting of five scientists assembled by the DOE Secretary. The DOE released a report written by this group, which was still in draft form at the time of this writing, in tandem with EPA’s proposed rule repealing the 2009 endangerment finding. See U.S. Dep’t of Energy, Climate Working Group, A Critical Review of Impacts of Greenhouse Gas Emissions on the U.S. Climate (July 23, 2025), https://perma.cc/KHF8-TTQR; Dep’t of Energy, Climate, https://perma.cc/647D-7224 (last visited Oct. 8, 2025) (providing a report evaluating the impact of greenhouse gasses on U.S. climate and inviting the public to comment). See also supra note 290 and accompanying text for a related discussion of the endangerment finding.
336. NOAA, National Centers for Environmental Information: Products by Category, https://perma.cc/S9U9-V7W6.
337. NASA, Data Resources, https://perma.cc/TB99-BJA7; NASA Center for Climate Simulation, Climate Data Services, https://perma.cc/72FX-U5EZ.
338. USGS, Ecosystems Land Change Science Program, https://perma.cc/N67D-3TQ3.
339. USGS, Climate Adaptation Science Centers, https://perma.cc/6W9Y-736D.
change—for example, examining how climate change will affect air quality and ecosystems.340
Nongovernmental Organizations
In addition to the international and U.S.-based organizations described above, there are many nongovernmental and academic organizations involved in the production and dissemination of climate research and data products. Some examples include the World Weather Attribution project, a collaboration of climate scientists that provides rapid assessments on the role of anthropogenic climate change in extreme weather events;341 the Climate Impact Lab, a coalition of scientists, economists, and other analysts that conduct research on the impacts and costs of climate change;342 and Climate Signals, an initiative that provides written synthesis of and data visualization products for climate attribution research.343
Many of these entities provide high-quality research products. However, these organizations do not have the same scientific standing as the major scientific organizations discussed above, and their research products do not always undergo formal peer review. There are various ways in which to evaluate the credibility of these research products. The credentials of the individuals producing the products are very important—the World Weather Attribution project, for example, consists of scientific researchers at top universities who have extensive experience in the climate and atmospheric sciences. Funding sources may also provide insights on credibility—for example, if a group is funded by fossil fuel interests or other industry actors that have a financial stake in preventing the regulation of fossil fuels, this could raise red flags about the credibility of any research findings. Finally, research products can also be evaluated for consistency with climate assessments from authoritative institutions like the IPCC.
340. EPA, Climate Change Research, https://perma.cc/HQH9-XZWH.
341. World Weather Attribution, https://perma.cc/6W6F-VRVG.
342. Climate Impact Lab, https://perma.cc/FK4H-3Z7Y.
343. Climate Signals, https://perma.cc/U8MG-927K.


