Carbon Utilization Infrastructure, Markets, and Research and Development: A Final Report (2024)
Chapter: 10 CO2 Utilization Infrastructure
10
CO2 Utilization Infrastructure
10.1 STATUS AND GOALS OF CO2 UTILIZATION INFRASTRUCTURE
As noted in the preceding chapters, CO2 utilization (i.e., conversion) can play a role in developing a circular carbon economy, in storing carbon dioxide, and in enabling a net-zero-emissions future. Expanding CO2 utilization requires developing or repurposing infrastructure for CO2 capture, transportation of CO2 and other feedstocks and inputs, CO2 conversion, and transportation of products and wastes. Such infrastructure for the full life cycle of CO2 utilization is of limited extent today. Congress and the Department of Energy (DOE) requested this study to assess infrastructure needs to enable CO2 utilization, focused on a future where carbon wastes are fundamental participants in a circular carbon economy with net-zero carbon emissions to the atmosphere (U.S. Congress 2020). Over two reports, the committee was instructed to analyze challenges in expanding carbon utilization infrastructure, mitigating environmental impacts, accessing capital, overcoming technical hurdles, and addressing geographic, community, and equity issues. The first report’s analysis, summarized below, focused on the current state of CO2 transportation, use, and storage infrastructure, and identified priority opportunities to develop, improve, and expand that infrastructure to enable utilization (NASEM 2023a). This final report builds off the first report and assesses infrastructure updates needed to ensure safe and reliable CO2 transportation, use, and storage for carbon utilization purposes. The committee considers how carbon utilization fits into larger needs and opportunities for carbon capture and storage (CCS) infrastructure and describes the economic, climate, and environmental impacts of a well-integrated CO2 pipeline system as applied to carbon utilization. The committee’s analysis includes suggestions for policies that could improve the economic impact of the system and mitigate its climate and environmental impacts.
10.1.1 Summary of First Report’s Infrastructure Analysis
The committee’s first report (NASEM 2023a) assessed the state of existing infrastructure for CO2 transportation, use, and storage; outlined considerations for developing new CO2 utilization infrastructure; and identified priority opportunities for the development of such infrastructure. Currently, CO2 utilization1 occurs on a commercial scale for the synthesis of urea, and to a lesser extent salicylic acid, methanol, and organic and inorganic carbon-
___________________
1CO2 utilization, for the purposes of this report, includes chemical conversion of CO2 into products, and excludes uses of CO2 that do not result in a chemical transformation, such as use of CO2 as a working fluid for enhanced oil recovery, or in beverage carbonation or fire suppression.
ates. Other CO2-derived products, such as hydrocarbon fuels, are the target of research or pilot-scale activities, but expanded market opportunities for CO2 conversion are limited by the high energy requirements and lack of financial incentives and policy mechanisms to use CO2 as a feedstock in place of fossil carbon. Most existing CO2 capture and transportation infrastructure has been developed for enhanced oil recovery (EOR), connecting geologic or fossil CO2 sources with depleted oil reservoirs. Limited opportunities exist to use this infrastructure for sustainable (i.e., net-zero or net-negative emissions) CO2 utilization processes. However, the anticipated build-out of additional infrastructure for CCS over the coming decades potentially could enable sustainable CO2 utilization, depending on the CO2 source, utilization product, and other energy and feedstock requirements (NASEM 2023a). Expanding CO2 utilization to produce net-zero- or net-negative-emissions materials, chemicals, and fuels would necessitate significant expansion of infrastructure for clean electricity and clean hydrogen in a safe, environmentally benign, and sustainable manner.
In its first report, the committee laid out considerations for developing CO2 utilization infrastructure to serve a net-zero future. It noted that “the economics of infrastructure placement will be dictated in part by the ease of transporting CO2, hydrogen, electricity, and other inputs, versus the ease of transporting the carbon-based products” (Finding 4.9, NASEM 2023a, p. 100) and “the optimal CO2 transport and delivery infrastructure to enable utilization depends on the product type” (Finding 4.10, NASEM 2023a, p. 100). For example, chemicals and fuels production might benefit from centralized CO2 capture, transportation, and conversion infrastructure, potentially taking advantage of existing chemical production facilities, while concrete and aggregate production preferably may occur in a distributed manner, with smaller-scale CO2 capture and distribution networks, to serve localized needs for these products. Decisions about CO2 transportation method(s) for a given project should consider the location and type of CO2 source as well as the site of utilization and estimated product volumes, with a goal of minimizing cost, environmental, and justice impacts, and addressing safety concerns.
Overarching recommendations from the committee’s first report provided opportunities to integrate CO2 utilization infrastructure with infrastructure for CCS, clean electricity, clean hydrogen, and other enabling inputs. For example, the committee recommended that CCS infrastructure be designed with the flexibility to connect to CO2 utilization processes and technologies in the future (Recommendation 6.2, NASEM 2023a, p. 134) and that studies to identify the most promising CO2 utilization opportunities “determine the value of co-locating specific CO2 utilization activities with specific source types of CO2, as well as the value of minimizing transport, identifying those that maximize climate benefits” (Recommendation 6.5, NASEM 2023a, p. 134). Additionally, DOE, as part of its industrial decarbonization efforts, should provide technical and financial support for development of carbon capture, utilization, and storage (CCUS) clusters, which “should involve best practices for community engagement and allow for flexibility in utilization scenarios over the long term, for example, by incorporating hydrogen production, chemical and fuel manufacturing, and low-carbon electricity generation” (Recommendation 6.3, NASEM 2023a).
This chapter expands on the committee’s prior findings and recommendations by providing an update on CCUS infrastructure under development in the United States, discussing opportunities and challenges for CO2 utilization infrastructure planning at the regional or national scale, including multimodal transport of the captured CO2, and evaluating potential economic, climate, environmental, health, safety, justice, and societal impacts of CO2 utilization infrastructure.
10.1.2 What Are the Infrastructure Needs for CO2 Utilization to Contribute to a Net-Zero Energy System?
As CO2 utilization is developed to enable 2050 net-zero goals, it is imperative to chart a course toward the scale of infrastructure required to meet these targets. Several analyses have examined the infrastructure capacity required, including for capture and removal of CO2, expansion of transportation networks, establishment of secure storage sites, and development of CO2 conversion facilities. Although momentum has been growing, the disparity between present capacity and the required infrastructure is evident from a comparison of different scenarios (see Table 10-1).
The largest disparity remains in CO2 capture. The current and announced capacity of point source CO2 capture facilities is 161 million tonnes per annum (MTPA), significantly lower than—and likely not on track to meet—the amount estimated to be required by 2050, which ranges from a few hundred to a few thousand MTPA in the United States (Table 10-1). Moreover, current and announced capacities for direct air capture (DAC) are less than 8 MTPA, while the
TABLE 10-1 Summary of Published Modeling and Planning for National- or Regional-Scale CCUS Infrastructure
| Infrastructure Category | Current U.S. Capacity | Announced U.S. Capacity | Required by 2050 Scale | Reference | Scope of Analysis | |
|---|---|---|---|---|---|---|
| CO2 Capture | Point source CO2 capture | 20 MTPAa | 141 MTPAa | 230 (by 2030) MTPA | McKinsey Sustainabilityb | United States |
| 380–610 MTPA | National Resources Defense Council (NRDC)c | United States | ||||
| 700–1800 MTPA | Princeton Net-Zero Americad | United States | ||||
| 669 MTPA | Great Plains Institutee | Midwest, Gulf Coast, and Rockies | ||||
| 640–1063 MTPA | Williams et al. (2021) | United States | ||||
| 300–2400 MTPA | Decarb Americaf | United States | ||||
| 14 MTPA | Net-Zero Northwestg,h | Montana, Idaho, Washington, and Oregon | ||||
| 304.7 MTPA | Great Plains Institutei | Mid-Atlantic | ||||
| Direct Air Capture | 2000 TPAj | 7.5 MTPAk | 40–320 MTPA 90–600 MTPA 690–2260 MTPA 24.5 MTPA | NRDCc Decarb Americaf Rhodium Groupl Net-Zero Northwestg | United States United States United States Montana, Idaho, Washington, and Oregon | |
| CO2 Transport | CO2 Pipelines | 5354 milesm | 2280 milesn | 65,000–70,000 miles | Princeton Net-Zero Americad | United States |
| 29,0000 miles | Great Plains Institutee | Midwest, Gulf Coast and Rockies | ||||
| 96,000 miles | Pathways to Commercial Liftoff: Carbon Managemento | United States (stress case) | ||||
| 6719 miles | Great Plains Institutei | Mid-Atlantic | ||||
| Enabling Inputs for CO2 Utilization | Carbon-free electricity | 434.3 GWp | 1250 GWq | 1600–6300 GW | Princeton Net-Zero Americad | Overall clean electricity generating capacity, not specific to CO2 utilization |
| 1160–5000 GW | Decarb Americaf,r | |||||
| 9264–15,190 TWh | Williams et al. (2021) | |||||
| 564 TWh | Net-Zero Northwest | Montana, Idaho, Washington, and Oregon | ||||
| Low-carbon hydrogen | ~0.5 MTPAs | 12 MTPAt,u | 50 MTPA | U.S. National Clean Hydrogen Strategy and Roadmapu | Overall clean hydrogen production, not specific to CO2 utilization | |
| 58–136 MTPA | Princeton Net-Zero Americad | |||||
| 68–190 MTPA | Decarb Americaf | |||||
| 3.8 MTPA | Net-Zero Northwestg | Montana, Idaho, Washington, and Oregon | ||||
| Infrastructure Category | Current U.S. Capacity | Announced U.S. Capacity | Required by 2050 Scale | Reference | Scope of Analysis | |
|---|---|---|---|---|---|---|
| CO2 Storage | Class VI wells | 1.68 MTPAv | 23.75MTPAw | 1860 MTPA | Princeton Net-Zero Americad,x | United States |
a From Figures 5 and 16 of DOE (2023a).
fDecarb America Research Initiative (2021); range reflects all modeled net-zero scenarios in 2050.
h Includes carbon capture from biogasification, cement and lime, and power generation.
iKammer et al. (2023); Mid-Atlantic region includes Delaware, Kentucky, Maryland, New Jersey, Ohio, Pennsylvania, Virginia, West Virginia, and the District of Columbia.
j As of November 2023; includes Heirloom (Heirloom 2023) and Global Thermostat facilities (Global Thermostat 2023).
k As of November 2023; includes Project Bison, Stratos, Project Cypress, and the South Texas DAC Hub.
n As of November 2023; includes Summit Carbon Solutions and Wolf Carbon Solutions projects (Summit Carbon Solutions n.d.(b); Wolf Carbon Solutions n.d.).
p From Table 4.3 of EIA (2023a).
q Total capacity from nuclear, hydro, wind (onshore and offshore, and paired with storage), and solar (including solar paired with storage) in the interconnection queue as of the end of 2022 from LBNL (n.d.).
r Includes onshore wind, offshore wind, solar, and nuclear.
s Estimated as <5 percent of 2022 hydrogen production, per Figure 2 of DOE (2023b).
t As of end of year 2022.
v Includes Archer Daniels Midland (EPA 2023a), Blue Flint (Harvestone Group 2023), and Red Trail (Red Trail Energy LLC 2022) sequestration sites.
w Includes Wabash Carbon Services (EPA 2023a), Carbon TerraVault JV Storage Company Sub 1, LLC (EPA 2023a), Eastern Wyoming Sequestration Hub (Tallgrass 2023), Sweetwater Carbon Storage Hub (Frontier Carbon Solutions LLC 2022), DCC West Center Broom Creek (DCC West Project LLC 2023), Project Tundra (Minnkota Power Cooperative 2022a), Minnkota Center MRYS Deadwood (Minnkota Power Cooperative 2022b), and Great Plains CO2 Sequestration Project (Dakota Gasification Company 2023).
x Base case storage capacity, per Annex I of Larson et al. (2021).
required capacity by 2050 is estimated to be as much as 300 times these announcements, per Larsen et al. (2019). Carbon capture continues to represent a significant cost component of CO2 utilization, as well as a large cost reduction potential. Various challenges limit widespread deployment of CO2 capture infrastructure, as described in NASEM (2023a).
Another significant gap in the CO2 utilization supply chain is CO2 transportation infrastructure, which is dominated by pipeline transport. The current capacity is just over 5000 miles, mostly supporting the transport of CO2 from natural reservoirs, power plants, and industrial sources to nearby oil fields for EOR applications in sparsely populated areas (NASEM 2023a; NPC 2019). The scale and geographic distribution of present transport capacity does not support the creation of a nationwide CO2 utilization network. Adopting mixed modes of CO2 transport, such as pipelines, ships, trains, and trucks, can be an efficient solution to address the transportation gap, and this approach is explored in Section 10.3.1.
Enabling infrastructure in the form of clean electricity and clean hydrogen production capacity must scale up significantly to achieve net-zero goals. Although most models do not establish specific electricity and hydrogen targets for CO2 utilization, these inputs are vital for converting CO2 into valuable products such as synthetic fuels and chemicals. Furthermore, the United States has significant capacity to store CO2 underground that is currently underutilized, and the infrastructure built for CO2 storage can be leveraged to support CO2 utilization projects.
Substantial amounts of capital investment are necessary to close the gap in CO2 infrastructure development. DOE has estimated that between $300 billion and $600 billion of total investment along the carbon management value chain is required until 2050 to meet net-zero decarbonization goals (DOE 2023a). The private sector’s long-term commercial investments require supportive policy measures and regulatory frameworks that can provide market certainty and encourage investments in CCUS infrastructure. Additionally, public–private partnerships offer a vital approach to leveraging the expertise, resources, and funding of both sectors to scale up CO2 utilization infrastructure to meet the net-zero targets indicated by different modeling scenarios. Section 10.2 describes numerous CCUS infrastructure announcements since the committee’s first report, indicating that plans are gaining momentum. Nonetheless, the current pace of development remains insufficient to achieve most of the referenced analysis models’ targets.
10.2 CCUS INFRASTRUCTURE UNDER DEVELOPMENT
As noted above, the committee’s first report described the status of existing infrastructure for CCUS in the United States (Chapter 2 of NASEM 2023a). This section briefly discusses new developments in infrastructure for CO2 capture, transport, utilization, and storage, as well as hydrogen production, since the first report was published.
10.2.1 Direct Air Capture Hubs
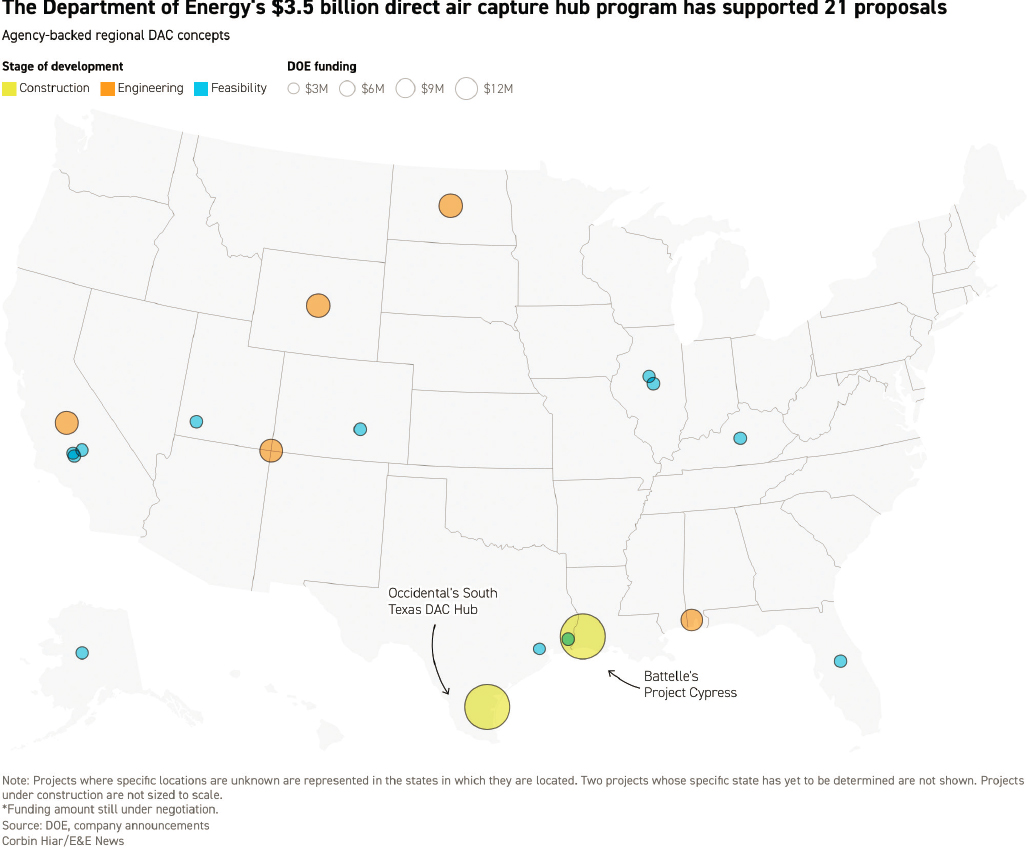
In August 2023, DOE selected two (of four total to be chosen) DAC projects for award negotiations as part of the Regional Direct Air Capture Hubs program authorized and appropriated in the Infrastructure Investment and Jobs Act (IIJA) (DOE-OCED 2023a). Both projects—Project Cypress, which will be located in Calcasieu Parish, Louisiana, and the South Texas DAC Hub, which will be located in Kleberg County, Texas—plan to capture 1 million tonnes of CO2 per year for sequestration in a saline aquifer (DOE-OCED n.d.(a)). DOE is also supporting feasibility and design studies for DAC projects located throughout the United States (DOE-FECM 2023a). Figure 10-1 shows the locations and relative funding amounts of DOE-funded DAC projects.
In addition to the DOE selections, private companies are developing commercial-scale DAC facilities in the United States. Examples include Occidental and 1PointFive’s Stratos plant under construction in the Texas Permian Basin (1PointFive 2023b; Oxy 2022), Heirloom’s operational DAC-to-concrete facility in California (Heirloom 2023), CarbonCapture, Inc.’s announced Project Bison project in Wyoming (CarbonCapture Inc. 2023), and Global Thermostat’s demonstration plant in Colorado (Global Thermostat 2023).
10.2.2 Hydrogen Hubs
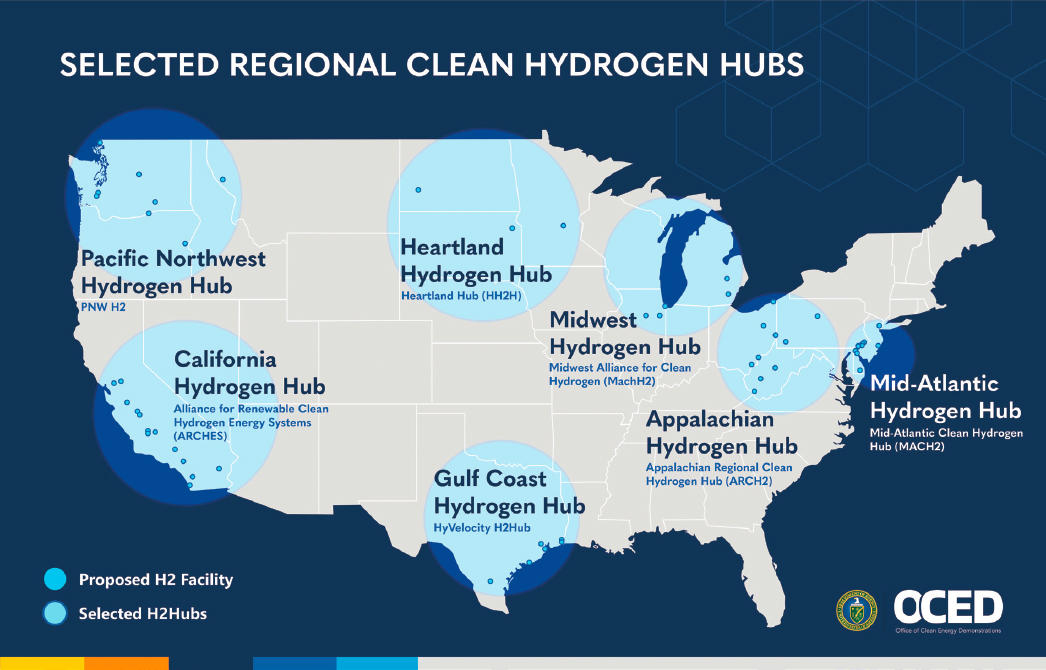
In October 2023, DOE announced the selection of seven Regional Clean Hydrogen Hubs for award negotiations, as authorized in the IIJA. Figure 10-2 shows the locations of these projects, and Table 10-2 summarizes their plans for hydrogen generation and use, expected job creation, and estimated emissions reductions. The seven hubs aim collectively to produce more than 3 million metric tons (megatonnes, Mt) of hydrogen annually and reduce CO2 emissions from end uses by 25 Mt per year (DOE-OCED 2023b; White House 2023). Given the importance of hydrogen for many CO2 utilization applications, project developers may consider proximity to hydrogen producers in their siting decisions. The committee’s first report recommended that project planners consider co-locating hydrogen generation with facilities that capture and use CO2 to reduce the need for additional costly and complex infrastructure for hydrogen storage and transport (Recommendation 4.5, NASEM 2023a). The Gulf Coast Hydrogen Hub, which is targeting the use of hydrogen as a feedstock in refineries and petrochemicals, and the South Texas DAC Hub could be considered co-located, in the sense that only short trunklines of H2 or CO2 would be required to connect facilities for H2 generation, CO2 capture, and CO2 utilization. The Midwest Hydrogen Hub lists sustainable aviation fuels as one of its use cases and is located near proposed sites for CO2 pipelines and geologic storage, so that location may be a prime opportunity for coordination of H2 and CO2 utilization infrastructure.
SOURCE: Hiar (2023).
SOURCE: DOE-OCED (n.d.(b)).
10.2.3 CO2 Pipelines
The United States currently has 5354 miles of CO2 pipeline infrastructure2 concentrated in the Gulf Coast, Permian Basin, and Wyoming, which primarily transports supercritical CO2 from geological sources to depleted oil reservoirs for EOR (PHMSA 2023a). At the start of the committee’s writing, three major new CO2 pipeline projects were under way in the Midwest, being developed by Summit Carbon Solutions, Navigator CO2 Ventures, and Wolf Carbon Solutions. Summit Carbon Solutions plans to build about 2000 miles of pipeline to transport CO2 captured from 57 ethanol plants to permanent geological storage in North Dakota (Summit Carbon Solutions n.d.(a)). The pipeline network would traverse five states—Iowa, Minnesota, Nebraska, North Dakota, and South Dakota—and transport about 18 million tons of CO2 annually for storage (Summit Carbon Solutions n.d.(b)). Navigator CO2 Ventures’ Heartland Greenway project, now canceled, would have been a 1300-mile pipeline network across Illinois, Iowa, Minnesota, Nebraska, and South Dakota that would have captured 15 Mt of CO2 per year from ethanol and fertilizer facilities for permanent geologic storage in Illinois, with the option of off-takes for CO2 use (Navigator Heartland Greenway LLC 2021; Voegele 2023). The Mt. Simon Hub project being developed by Wolf Carbon Solutions would transport 12 million tons of CO2 per year from two ethanol plants in Iowa to permanent geological storage in Illinois via 280 miles of pipeline (Wolf Carbon Solutions n.d.).
All three projects have faced legal and regulatory challenges and have seen pushback from local communities concerned about safety and use of eminent domain for pipeline siting (see, e.g., Ahmed 2023; Peterson 2023; Ramos
___________________
2For scale and context, the United States has about 190,000 miles of petroleum pipelines (API 2021) and 3 million miles of natural gas pipelines (EIA 2024).
TABLE 10-2 Summary of Hydrogen Hub Selections
| Hub Name | State(s) Involved | Source of Hydrogen | Use of Hydrogen | Estimated Job Creation | Estimated Emissions Reductions |
|---|---|---|---|---|---|
| Appalachian Hydrogen Hub | Ohio, Pennsylvania, West Virginia | Natural gas with carbon capture | Not reported | 21,000 (18,000 construction; 3000 permanent) | 9 Mt/yr |
| California Hydrogen Hub | California | Renewable electricity and biomass | Public transportation, heavy-duty trucking, port operations | 220,000 (130,000 construction; 90,000 permanent) | 2 Mt/yr |
| Gulf Coast Hydrogen Hub | Texas | Natural gas with carbon capture and renewable electricity | Fuel cell electric trucks, industrial processes, ammonia production, marine fuel, refineries and petrochemicals | 45,000 (35,000 construction; 10,000 permanent) | 7 Mt/yr |
| Heartland Hydrogen Hub | Minnesota, North Dakota, South Dakota | Not reported | Fertilizer production, power generation, cold climate space heating | 3880 (3067 construction; 703 permanent) | 1 Mt/yr |
| Mid-Atlantic Hydrogen Hub | Delaware, New Jersey, Pennsylvania | Renewable and nuclear electricity | Heavy-duty transportation, manufacturing and industrial processes, combined heat and power | 20,800 (14,400 construction; 6400 permanent) | 1 Mt/yr |
| Midwest Hydrogen Hub | Illinois, Indiana, Michigan | Renewable and nuclear electricity, natural gas with carbon capture | Steel and glass production, power generation, heavy-duty transportation, refining, sustainable aviation fuel | 13,600 (12,100 construction; 1500 permanent) | 3.9 Mt/yr |
| Pacific Northwest Hydrogen Hub | Montana, Oregon, Washington | Renewable electricity | Heavy-duty transportation, industry, ports, aviation, fertilizer production | 10,000 (8050 construction; 350 permanent) | 1 Mt/yr |
SOURCES: Based on data from DOE-OCED (n.d.(b)) and White House (2023).
2023; Soraghan 2023). For example, regulators in North and South Dakota denied permits to Summit Carbon Solutions and Navigator CO2 Ventures, respectively, although North Dakota plans to reconsider the permit request (Dura 2023a, 2023b; Dura and Karnowski 2023). In October 2023, Navigator announced its cancellation of the Heartland Greenway project (Douglas 2023), Summit announced a delay in its pipeline start-up date from 2024 to early 2026 (Anchondo 2023), and the Illinois Commerce Commission staff recommended that state regulators reject Wolf Carbon Solutions’ pipeline application (Tomich 2023).
At a public meeting on CO2 pipeline safety hosted by the Pipeline and Hazardous Materials Safety Administration (PHMSA) in Des Moines, Iowa, from May 31 to June 1, 2023, public comments centered on a lack of trust in pipeline companies, the limited capacity of volunteer emergency response teams in rural areas, appropriate setback distances, the potential for induced seismicity from CO2 injection for sequestration, and the durability of pipeline materials in Iowa’s geographic and environmental conditions (e.g., freeze/thaw cycles, soil composition, ground vibrations from farm equipment) (PHMSA 2023b). During the same meeting, members of the public made several requests of PHMSA as it develops updated safety regulations for CO2 pipelines, including (1) place a national moratorium on CO2 pipelines until the updated safety regulations are in place, (2) provide guidance on regulatory jurisdictions and clear definitions of CO2 (supercritical, gaseous, and liquid phases) in regulations, (3) establish clear guidelines on disclosure of emergency response plans and mandate that pipeline companies pay for the necessary emergency response equipment, and (4) in the case of a pipeline emergency, require that companies notify all customers and emergency planning departments within a reasonable distance of the route (PHMSA 2023b).
In addition to opposition by individuals and communities directly affected by pipeline projects, some groups also oppose CO2 pipelines as a means to block the development of CCUS projects, which they consider a moral hazard
owing to their potential to perpetuate fossil fuel development and use. Opposition is not unique to CO2 pipelines. Other net-zero energy system infrastructure projects have been opposed owing to the concerns of host or neighboring communities (e.g., solar and wind developments and transmission lines), or owing to the moral hazard of fossil fuel development, or both (e.g., H2 hubs) (Christol et al. 2021; Gordon et al. 2023; Romero-Lankao 2023). See Chapter 4 for more detail on the policy, regulatory, and societal aspects of CO2 utilization infrastructure development.
10.2.4 Update on Commercial CO2 Capture, Utilization, and Storage Projects
Since the committee’s first report was released in December 2022, additional CCUS projects have been and continue to be announced. As this is a rapidly evolving space, producing a comprehensive list of projects and facilities is impractical. Rather, the committee points the reader to resources that continually update information on carbon management projects (see Table 10-3).
In addition to individual projects, several CCS hub developments have been announced. Examples include the Midland Basin hub (Milestone Carbon 2023), Bayou Bend CCS hub (OGCI n.d.), and Bluebonnet Hub (1PointFive 2023a) in Texas; the Cameron Parish CO2 Hub offshore of Louisiana (Carbonvert and Castex 2023);
TABLE 10-3 Resources with Information on Commercial Carbon Capture, Utilization, and Storage Projects
| Resource Name | Coordinating Organization | Project Type(s) Included | Description | Link |
|---|---|---|---|---|
| Carbon Matchmaker | U.S. DOE Office of Fossil Energy and Carbon Management | Source Capture Utilization Storage Removal Transport | Map of self-reported and DOE-supported carbon capture, utilization, and storage activities. Includes brief description and status of each project. | https://www.energy.gov/fecm/carbon-matchmaker |
| CCU Activity Hub | Global CO2 Initiative, University of Michigan | Capture and Utilization | Map of carbon capture and utilization start-up companies worldwide. Ability to layer with locations of publications and research centers focused on CCU, as well as states, provinces, or countries with carbon tax or emissions trading system. | https://www.globalco2initiative.org/evaluation/carboncapture-activity-hub |
| U.S. Carbon Capture Activity and Project Map | Clean Air Task Force | Capture | Map of carbon capture projects that are operational or in development, differentiated by capture capacity and subsector. Also shows locations of CO2 storage potential. | https://www.catf.us/ccsmapus |
| Innovator Index | Circular Carbon Network | Capture Utilization Removal | List and brief description of companies involved in CO2 capture, utilization, and removal. Also includes companies that provide circular carbon market infrastructure. | https://circularcarbon.org/innovator-index |
| CCUS Companies | Carbon Utilization Alliance | Utilization | List and brief description of carbon utilization companies. | https://www.cua.earth/ccus-companies |
| CO2RE Facilities Database | Global CCS Institute | Capture Storage | Map and brief description of CCS facilities worldwide. Ability to filter by region, country, category (commercial, pilot/demonstration), and status (e.g., early development, advanced development, operational). | https://co2re.co/FacilityData |
| CCUS Projects Explorer | International Energy Agency | Capture Utilization Transport Storage | Database of CO2 capture, utilization, transport, and storage projects worldwide. Includes both planned and operational projects, with information about location, project partners, anticipated capacity, sector, and fate of CO2. | https://www.iea.org/dataand-statistics/data-tools/ccus-projects-explorer |
the Central Louisiana Regional Carbon Storage Hub (“CENLA Hub,” CapturePoint 2024), and the Eastern Wyoming Sequestration Hub (Tallgrass 2022). These could be prime locations for future CO2 utilization infrastructure development, in line with the committee’s recommendations in its first report to support development of industrial clusters for CCUS and identify opportunities to co-locate utilization with existing CO2 transport infrastructure (Recommendations 6.3 and 6.5, NASEM 2023a).
10.3 INTEGRATED CO2 UTILIZATION INFRASTRUCTURE PLANNING AND DEVELOPMENT AT THE REGIONAL OR NATIONAL SCALE
10.3.1 Optimal Multimodal, Regional CO2 Transportation Infrastructure
As part of the CCUS chain, pressurized pipelines are generally considered to be the most economical and safest method for large-scale CO2 transport. However, as indicated in Section 10.2.3, CO2 pipeline development faces regulatory challenges and public opposition. The recent cancellation of a 1300-mile CO2 pipeline project aiming to transport 15 Mt of CO2 annually from Midwest ethanol plants for geological storage (Tomich et al. 2023) owing to opposition of residents along its route highlights such barriers. As a result, ships, river barges, trucks, and trains are becoming increasingly attractive, as they have shorter timelines for implementation and likely face fewer regulatory and public acceptance barriers, especially when passing through or near more densely populated areas. Such forms of transportation also will likely be needed to collect and distribute CO2 at the origin and destination of pipelines, or for smaller, distributed sources or conversion facilities, even if a larger system of CO2 pipelines is built (Pett-Ridge et al. 2023).
The combination of different CO2 transport modes can, in many cases, represent a better alternative to a single transport mode, especially for small, dispersed emitters that are not within easy reach of industrial CCUS clusters enjoying shared transport infrastructure. From a societal perspective, the optimal design of multimodal CO2 transport infrastructure for utilization and storage involves a cost-benefit analysis of the transport network with the aim of minimizing costs and environmental impact and reducing the risk of failure, while maximizing the CO2 utilization potential in the region.
Meeting these complex challenges requires the development of dedicated mathematical optimization models that can determine key impact indices for each of the above factors, which in turn can be employed as a valuable decision-making tool for the design of the optimal CO2 transport network. Parolin et al. (2022) propose a similar analytical tool for hydrogen delivery infrastructure, but the proposed methodology does not include factors related to safety and financial risks, nor environmental impacts during transportation, and only considers land-based transport of hydrogen. Lawrence Livermore National Laboratory’s “Roads to Removal” report presents a model aimed at identifying the most economical route of multimodal CO2 transportation from the CO2 source to a storage location using established cost models and literature data (Pett-Ridge et al. 2023). However, it assumes that fluid transportation conditions (e.g., temperature, pressure) are the same across the modular transport chain and thus adopts only one levelized cost associated with liquefaction. In practice, CO2 may be transported in liquid form at different temperatures and pressures depending on transport mode, resulting in different conditioning costs and further conditioning stations when transferring across different transport modes (e.g., from trucks to barges or trains). Such requirements may significantly impact the optimal multimodal transport solution. Furthermore, although Pett-Ridge et al. (2023) discuss the need to evaluate the selected routes under different criteria—societal impact, in particular—they do not include calculations of risks and emissions associated with the different options. A more rigorous, all-encompassing, multiobjective approach is required to determine the optimal multimodal transport solution for transporting captured CO2 gathered from small, dispersed emitters for utilization. The following text describes the main steps in developing such a tool.
Step 1. Mixed-Integer Linear Programming (MILP): Minimizing the Cost of Transport
First, a set of transport configurations for determining the minimum costs is selected via the construction of a MILP problem incorporating several considerations and constraints (Lee et al. 2017). These may include
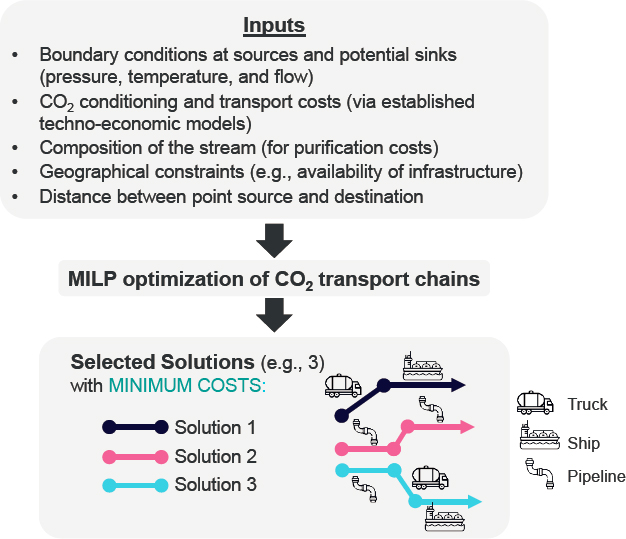
SOURCE: Icons from the Noun Project, https://thenounproject.com. CC BY 3.0.
the geographical locations of the emitters and utilization sites, the availability or accessibility of infrastructure for different modes of transport, along with the respective amounts of CO2 and corresponding temperatures and pressures. Established techno-economic models are employed to determine the CO2 transport and conditioning unit costs for the various transport modes, such as pipelines (Knoope et al. 2014), ships (Element Energy 2018; Roussanaly et al. 2021), and trucks (Stolaroff et al. 2021). The solutions proposed by MILP are expected to fall in a range of costs that are considered reasonable and might highlight different routes and a combination of different modes. A graphical representation is presented in Figure 10-3.
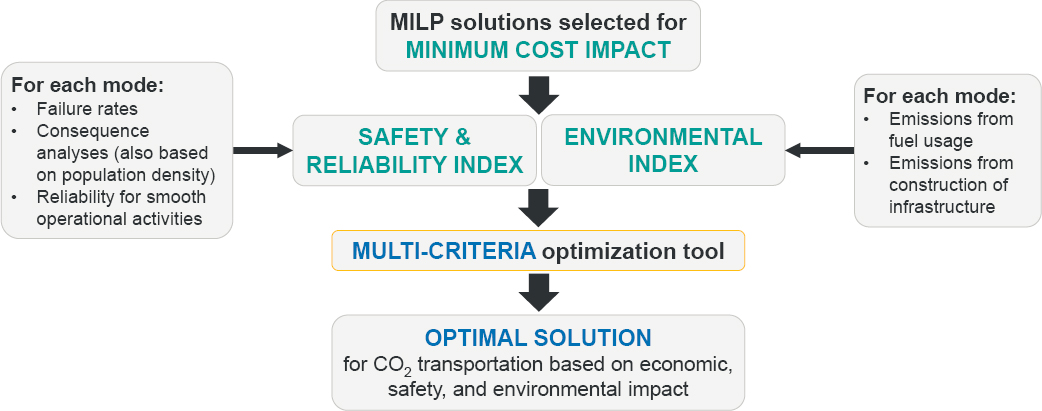
Step 2. Multimodal Transport of CO2: Incorporating Safety and Environmental Impact Costs
Step 2 involves developing tools to quantify the safety and environmental impact costs associated with different modes of transportation. These tools can be in the form of a Safety and Reliability Index and an Environmental Index, as previously developed in several studies for the transportation of different goods (e.g., H2) (Bevrani et al. 2020; d’Amore et al. 2018; Kim et al. 2011; Lee et al. 2017). The safety index considers factors such as failure rates for the various transportation modes, and failure consequence analysis takes account of the population density along the selected route. The environmental index considers emissions generated from the construction and implementation of the different transport modes, which also depends on distance covered and selected routes.
A multicriteria optimization model then has to be developed, which simultaneously analyzes the risk and environmental impact for each of the transport solutions identified by the MILP, as illustrated in Figure 10-4, and returns a set of possible solutions, indicating the necessary trade-off between the different selected criteria, covering cost, safety, and environmental impacts.
The following subsections describe a few case studies of CO2 transportation infrastructure development at different locations and CO2 emission scales, taking into account the optimization methodologies for multimodal transport described above. For each case study, implications and opportunities for CO2 utilization are discussed.
10.3.1.1 Distributed Small- to Medium-Scale CO2 Emitters
Small- to medium-scale CO2 emitters, or those that emit less than 1 Mt CO2 equivalents per year, span power plants, chemicals, minerals, breweries, paper and pulp, food, commercial, and public administration sectors. Such emitters are widely distributed across the United States, many in remote locations, and collectively contribute a significant proportion of overall U.S. CO2 emissions. As shown in Figure 10-5, 92 percent of U.S. industrial and power plant facilities reporting emissions to the U.S. Environmental Protection Agency (EPA) in 20223 emitted less than 1 Mt CO2e, and these 6955 facilities accounted for 33 percent of reported emissions (EPA 2023b). The decarbonization of small- to medium-scale emitters is imperative in successfully meeting the 2050 net-zero-emission target and could involve CO2 capture and utilization in addition to other decarbonization strategies like electrification and improvements in energy efficiency. Considering only the industrial sector, small- to medium-scale industrial emitters, defined as emitting between 12,500 and 60,000 tCO2 per year, comprise 25 percent of all U.S. industrial point-source emissions (Moniz et al. 2023). Moniz et al. (2023) identified ten regional targets for clusters of small-to-midsize emitters that could share resources and risks, and develop economies of scale and effort. Three of that report’s identified clusters are in the same regions (Midwest and Gulf Coast) discussed as possible industrial clusters in Section 10.3.1.2.
For some small- to medium-scale emitters, deployment of renewable electricity and onsite utilization of captured CO2 using modular technologies may be more cost-effective than process modification. New capture technologies based on membranes (Etxeberria-Benavides et al. 2018), enhanced adsorption processes (Crake et al. 2017; Wang et al. 2018), and molten carbonate fuel cells (FuelCell Energy 2023) are promising at small to medium scale because they are modular, able to be retrofitted on existing infrastructure, easy to scale up, and cost-competitive. They are also relatively simpler than conventional capture technologies, such as solvent-based post-combustion capture, which is not expected to be feasible at medium scale (50 ktCO2 per year) owing to its large physical footprint (Sharma et al. 2019). The Advanced Research Projects Agency–Energy’s (ARPA-E’s) GREENWELLS program is exploring the feasibility of producing chemicals and fuels from CO2 using intermittent renewable electricity and hydrogen (ARPA-E 2023), which, if successful, could be a valuable opportunity for onsite CO2 utilization at small- to medium-scale emitters.
In cases where onsite utilization of captured CO2 may not be a feasible option, deployment of optimal multimodal CO2 transport solutions and “right-size” infrastructure is an attractive addition to the mitigation portfolio
___________________
3EPA’s Greenhouse Gas Reporting Program requires facilities that emit greater than 25,000 metric tons CO2e per year to report their emissions annually.

SOURCE: EPA (2023b).
for small-to-medium emitters, allowing CO2 emissions to be substantially reduced and holistically integrated with electrification, hydrogen, and biomass technologies. This is particularly so as planned CCUS industrial clusters comprising large CO2 emitters (e.g., cement and steel production) often cannot embrace distant small-to-medium-scale emitters, given the additional CO2 transport infrastructure costs which may become unrealistic (Moniz et al. 2023). Moreover, when building pipelines for small sources is too costly, smaller companies are unable to take advantage of the 45Q tax credit, placing them at a financial disadvantage relative to larger companies. In these instances, transport of CO2 by truck, rail, barge, or ship may offer a solution and be particularly important for early CCUS adopters.
10.3.1.2 Industrial Clusters for Large Volumes of CO2
Given the multiple utility and feedstock needs for CO2 capture and utilization, and the expense, challenge, and public concern over new pipelines, sites where all needed components are co-located are distinctly advantageous for CO2 utilization deployment. Two promising opportunities for co-locating CO2 capture and utilization are around bioethanol facilities in the Midwest and heavy industry and refining in the Gulf Coast. Midwest bioethanol facilities are small- to medium-scale emitters located in close enough proximity that shared infrastructure can aggregate CO2 to obtain volumes suitable for conversion to products at scale. On the other hand, many industrial facilities in the Gulf Coast region are large emitters, each generating substantial volumes of CO2 for utilization, but likewise
SOURCE: CATF (2023).
could benefit from shared infrastructure to reduce costs. Such infrastructure could also serve the numerous small- and medium-size emitters also located in the Gulf region, functioning as an “anchor tenant” around which larger CCUS networks could develop in the longer term.
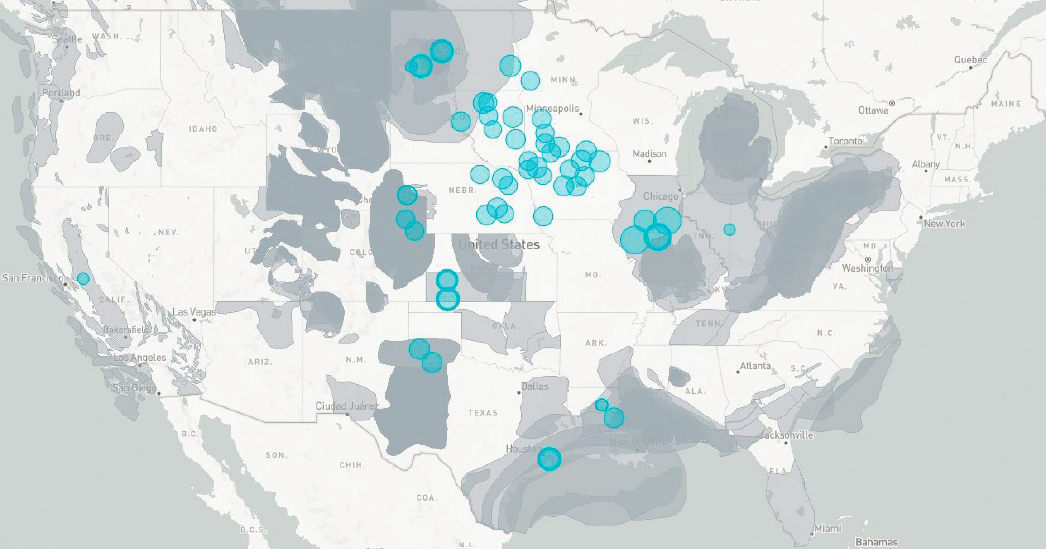
Biogenic CO2 from ethanol plants is advantaged for use in synthetic fuels and chemicals, as it is a sustainable CO2 source with relatively low capture cost, around $0–$55 per tonne of CO2 (Bennett et al. 2023; GAO 2022; Hughes et al. 2022; Moniz et al. 2023; NPC 2019). Most of the planned and operational CO2 capture projects at bioethanol facilities are located in the Midwest, primarily in Iowa, Minnesota, Nebraska, and South Dakota (Figure 10-6). As discussed in Section 10.2.3, CO2 pipeline projects are under development to transport this captured CO2 to geologic sequestration sites, although they have experienced setbacks and delays. Some of this captured CO2 instead could be diverted for utilization; however, given the small scale of individual bioethanol plants, captured CO2 will likely need to be collected in a single location to enable conversion to chemicals and fuels at economies of scale. This could be done using local pipeline networks, along with other modes of transport—especially when passing through or close to populated areas—per the methodologies described above. CO2 conversion to fuels will require hydrogen, which could be produced at the CO2 collection site using electrolysis powered by clean electricity.
The U.S. Gulf Coast region is home to nearly 50 percent of U.S. refining and petrochemicals manufacturing (EIA 2023b), making it a prime opportunity for deployment of point-source carbon capture. These refining and petrochemicals facilities are co-located with an existing array of CO2 and hydrogen pipelines; storage sites in well-characterized depleted hydrocarbon reservoirs, including offshore storage in federal waters where the U.S. government can have long-term ownership; and salt domes for low-cost hydrogen storage for use with renewable power, and are in close proximity to ports to allow export to markets (e.g., European Union, Japan) where low-carbon products are given market incentives (Bayer and Aklin 2020; Datta et al. 2020; LSU Center for Energy Studies 2023). Figure 10-7 shows planned and operational CO2 capture projects in the Gulf Coast region from a variety of point sources, which could be aggregated and utilized or transported for geological storage.
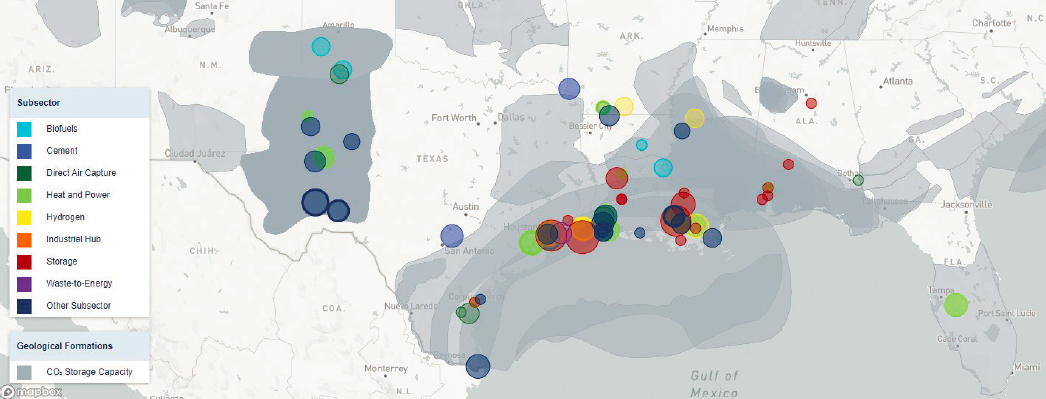
SOURCE: CATF (2023).
Because most of the captured CO2 from this region is of fossil origin, utilization products would have to be long-lived (e.g., mineral carbonates, solid carbon products) to ensure durable carbon sequestration. This could present a challenge, as mineral products are typically low value, and end-use of hydrocarbon products such as plastics typically cannot guarantee sequestration. On the other hand, carbon fibers, graphite, and other elemental carbon forms offer higher value (see Chapters 2 and 6). Use of fossil CO2 to make short-lived products from large point sources could be considered in the near term, wherein fossil CO2-based production replaces similar production from oil or natural gas in demand-limited market scenarios (see Section 10.4.5). Full market life cycle assessment (LCA) would be needed to ensure net fossil CO2 mitigation. In any case, given that there will be a mix of CO2 sources aggregated for utilization and storage, a rigorous accounting method will be required to determine the carbon intensity of utilization products. Such accounting methods for common carrier CO2 infrastructure are discussed in Chapter 4.
10.3.1.3 Shared CO2 Transport Pipeline Networks for CO2 Storage and Utilization in CCUS Industrial Clusters
As the committee recommended in its first report, DOE should consider favorably the ability of CO2 capture, transport, and storage demonstration projects to connect to future CO2 utilization opportunities because allowing for shared use of CO2 pipelines for both utilization and storage could take advantage of economies of scale (Recommendation 6.2, NASEM 2023a). In general, wider availability of CO2 through improved transportation and storage infrastructure could open the CO2 marketplace to traditional market demand dynamics and enable CO2 pull from the market where its conversion is most affordable (e.g., near low-cost clean electricity and/or hydrogen) and where the resulting product can be used. For CO2 transport pipeline networks in CCUS industrial clusters, depending on the CO2 purity and market demand, some of the CO2 stream destined for geological storage could be diverted for utilization. In addition, as the CO2 emission rates in the cluster substantially decrease because of a transition to clean energy or electrification, it may be more economical to divert the entire CO2 stream for utilization, taking account of the costs associated with any upstream CO2 purification that may be required. Such plans already exist in Europe (see, e.g., C4U Project 2020) that could set the scene for the United States.
For example, as part of a CCUS industrial cluster commencing operation in 2025, the planned Fluxys CO2 pipeline network in Belgium is expected to handle eventually more than 50 percent of the 40 MTPA total CO2 emissions captured from several major industries along its route (Fluxys Belgium 2022). Several of these emitters,
such as the steel and cement industries, plan to divert some of the CO2 for utilization to produce fuels such as e-methanol (see, e.g., the North CCU Hub; CO2 Value Europe n.d.), with future potential opportunities for producing methane, e-kerosene, and polymers. The Belgian CO2 CCUS value chain encompasses CO2 capture and purification; multimodal transport involving pipeline, ship, train, and trucks; CO2 liquefaction; CO2 utilization; and CO2 storage in disused gas fields under the North Sea seabed (Fluxys Belgium 2022).
As another example of shared CO2 transport and utilization pipelines, OCAP (Organic CO2 for Assimilation in Plants) currently supplies about 500,000 tons of CO2 per year to enhance crop growth4 for approximately 600 greenhouse companies in the western part of the Netherlands via a 97-kilometer transport pipeline and distribution network of 250 kilometers (OCAP n.d.). This CO2 is produced during the production of hydrogen at Shell in the Botlek area and during the production of bioethanol at Alco in Europoort Rotterdam. In situations where CO2 supply exceeds demand, the surplus CO2 may in future be diverted for nearby geological storage sites by joining existing CO2 pipeline infrastructure.
To this end, the Porthos (Port of Rotterdam CO2 Transport Hub and Offshore Storage) project intends to provide transport and storage infrastructure to energy-intensive industries in the Port of Rotterdam and, possibly, to industries in the Antwerp and North Rhine Westphalia areas at a later stage (Porthos 2023). The project will link CO2 capture facilities and the existing OCAP pipeline with a new onshore pipeline, which will transport the aggregated CO2 in a CO2 hub in the Port of Rotterdam and subsequently via an offshore pipeline to a depleted gas field 20 kilometers off the coast for permanent storage. The final investment decision for Porthos was made in October 2023, construction of the Porthos infrastructure will start in 2024, and the system is expected to be operational starting in 2026.
10.3.2 Retrofitting Existing Infrastructure for CO2 Capture, Transport, and Utilization
10.3.2.1 Addition of Carbon Capture to Existing Industrial Facilities to Enable CO2 Utilization
DOE’s Industrial Decarbonization Roadmap (DOE 2022b) details research needs and challenges for decarbonizing the industrial sector, addressing CO2 footprints for scope-1 and -2 emissions, which includes the process energy, heat, and utilities required for manufacturing products, but not emissions associated with use of products (e.g., as fuel) or production of feedstock. As shown in Figure 10-8, the U.S. industries with the largest energy-related CO2 emissions are chemical manufacturing and petroleum refining. One opportunity for mitigating emissions from these industries is incorporating CO2 capture paired with sequestration or utilization to form a long-lived product. Existing facilities in principle can be retrofitted for CO2 capture, but achieving significant decarbonization may require capture from several places within the process, which is one reason the industrial sector can be considered “difficult to decarbonize.”
The cost of retrofitting an industrial facility with CO2 capture is an important consideration for the feasibility of subsequent CO2 utilization or storage. The National Energy Technology Laboratory and National Petroleum Council have performed rigorous cost estimates for CO2 capture from industrial processes (Hughes et al. 2022; NPC 2019). A few processes, such as ethanol fermentation or petrochemical production of ethylene oxide, produce a relatively pure CO2 stream, and capturing that CO2 to produce a purified product has fairly low cost. For example, as mentioned earlier, costs to capture CO2 offgas from ethanol fermentation range from $0–$55 per tonne5 (Bennett et al. 2023; GAO 2022; Hughes et al. 2022; Moniz et al. 2023; NPC 2019). The CO2 stream from hydrogen production via steam reforming of natural gas, which accounts for approximately half of the CO2 footprint of the process, has a capture cost on the order of $60–$115 per tonne CO2 (DOE 2023a; NPC 2019). Capture of CO2 from process furnaces used to provide heat and power comes at an even higher cost. Commercial CO2 capture projects often only pursue capture from the most economical, high-concentration, high-pressure streams. For example, many current CO2 capture demonstration projects for hydrogen production by steam methane
___________________
4CO2 utilization for enhanced crop growth is out of scope for this report but is included here as a case example of shared utilization and storage infrastructure.
5Range includes first-of-a-kind and nth-of-a-kind facilities.

SOURCE: DOE (2022a).
reforming install a single capture unit at a point in the process that provides the lowest unit costs, and therefore only capture 40–60 percent of the overall CO2 emissions. Many industrial processes entail CO2 emissions from both process and utility streams, thus requiring capture from multiple point sources, which drives capture costs to as high as $200 per tonne CO2 (NPC 2019).
In some cases, industry has constructed facilities that are “CO2 capture ready” to facilitate tie-ins and space for CO2 capture systems. Where CO2 capture and mitigation is targeted, new technologies can be more efficient; for example, production of hydrogen from natural gas by autothermal reforming or partial oxidation can result in virtually complete decarbonization via capture from a single stream in the process unit. These technologies often require a complete rebuild of the production unit (Liu 2021; NPC 2019) or a substantial upgrade including addition of a partial oxidation reactor (Mahabir et al. 2022).
Until passage of the Inflation Reduction Act (IRA), the 45Q tax credits—at $50/tonne for geologic storage and $35/tonne for use in EOR by 2026 (Beck 2020)—were generally too low for industry to invest in CO2 capture, except where the CO2 had a coproduct value for utilization in EOR. (EOR can be economic at higher oil prices found prior to the discovery of unconventional shale oil production methods.) Recent increases in 45Q tax credits to $85 per tonne for storage and $60 per ton for utilization allow technologies with mid-range CO2 capture costs, such as those involved in hydrogen production, to be considered, but they are still too low for the $100–$200 per tonne capture costs of many of the processes in the “difficult to decarbonize” industrial sector (NPC 2019). For capturing these industrial CO2 streams for utilization or storage to be economical, there would need to be a further increase in the tax credits and/or additional research and development (R&D) on CO2 capture technologies, such solid sorbents, to reduce costs. See Chapter 4 for more detail on policy options to support CO2 utilization and Chapter 11 for more information about R&D needs for CO2 capture.
10.3.2.2 Conversion of Existing Natural Gas and Oil Pipelines for Transporting CO2, Hydrogen, or CO2-Derived Products
The committee’s first report examined the feasibility of retrofitting natural gas pipelines for transporting CO2, finding that this would have to be determined using rigorous systems analysis on a case-by-case basis given the large number of parameters involved (Finding 4.8, NASEM 2023a). Retrofit of natural gas pipelines for CO2
service can be considered over shorter distances (trunklines, see, e.g., Tallgrass 2024), but pressure capabilities of existing pipelines will not be sufficient for large-scale, long-distance transport (Kenton and Silton n.d.; NPC 2019). CO2 is normally transported as a supercritical fluid exhibiting the high density of liquid CO2 but the low viscosity of a gas. Natural gas is generally transported in pipelines in gaseous form at pressures between 800 and 1160 psi. The critical point of CO2 is at 30.9°C and 1070 psi, such that the pressure for CO2 transportation must be at least 1200 psi to avoid phase changes from temperature fluctuation, which is much higher than the standard operating parameters for existing natural gas pipelines (Kenton and Silton n.d.). All major CO2 pipelines today transport at pressures above 1900 psi. For retrofit, a dehydration system would be required to minimize water content, because wet CO2 forms carbonic acid, which offers a high risk of corrosion. High-pressure CO2 pipelines require crack arrestors to prevent catastrophic failure in the event of corrosion or external forces such as subsidence or collision damage. Modifications to the gaskets and nonferrous materials of the original pipeline may be required to prevent deterioration in the presence of concentrated CO2 (Kenton and Silton n.d.).
Pipe-in-pipe technologies may be considered for laying new CO2-compatible pipe within existing pipelines (Enbridge 2022). In principle, land used for pipeline rights of way can be used to lay new CO2-compatible pipe; however, a formal right of way for transport of a given gas (e.g., natural gas) does not translate into a right of way for transport of a new gas (e.g., CO2). CO2 pipelines and rights of way have to be approved for the new CO2 service on a case-by-case basis, including scenario modeling for release and risk of asphyxiation from release of a vapor that is heavier than air. Compatibility of pipeline metals and wetted components also has to be approved on a case-by-case basis, especially for retrofitted systems. CO2 transportation challenges, including repurposing of existing pipelines to service CO2, are described in more detail in a workshop report from DOE (DOE-FECM 2023b).
Retrofitting existing natural gas networks for hydrogen transport is also of interest, as hydrogen is an enabling input for many CO2 utilization processes. However, there are challenges associated with doing so. For example, the existing natural gas network may not be able to handle the high pressures required for hydrogen transport. Additionally, hydrogen tends to embrittle metals, which may require upgrades to existing pipelines, such as adding a copper or polymer coating by retrofit pigging operations or installing pipe-in-pipe technologies. Coating technologies present concerns about long-term robustness and safety, while pipe-in-pipe technologies allow the preferred metallurgy to be installed but reduce capacity. For both options, the cost may be greater than new pipe installation. However, studies have shown that, in some cases, converting existing natural gas pipelines into dedicated hydrogen pipelines could reduce hydrogen transmission costs by 20–60 percent compared to constructing new hydrogen pipelines because of savings across the entire value chain of materials, the permitting and time expense, land use acquisition costs, construction costs, and costs of additional infrastructure (e.g., compression, power) (Cerniauskus et al. 2020). Thus, decisions will have to be made on a site-specific basis. Despite these challenges, there has been some progress in using existing gas networks for hydrogen transport. In the United Kingdom, for example, the H21 project is exploring the feasibility of converting the gas network in northern England to run entirely on hydrogen (Northern Gas Networks 2016). In the United States, unlike in Europe, there often is enough space to lay down more pipe in existing rights of way, perhaps reducing the need to retrofit existing infrastructure.
As infrastructure is built out to transport CO2 for storage and utilization and to use hydrogen for decarbonization (including via its reaction with CO2 to make hydrocarbon products), there may be competition between CO2 and hydrogen for natural gas pipeline repurposing. Optimization of the existing gas pipeline network for future use by CO2 and/or H2 will require integrated coordination among usage options. Owing to this competition and other factors, there will likely be a need for new pipelines to transport CO2 or H2 beyond what can be accommodated by existing natural gas pipelines.
In addition to natural gas pipelines, over 190,000 miles of liquid petroleum pipelines traverse the United States (API 2021), and with the transition to renewable energy and electrification, many of these pipelines may become obsolete as demand for fossil fuels decreases. Given their extensive geographical spread, it is very likely that some will pass near CO2 utilization facilities. Depending on their locations and taking account of any additional safety concerns that might arise in the event of an accidental release, there may be opportunities to use some of these pipelines to transport CO2-derived fuels or chemicals. As with any pipeline retrofit, questions of safety, environmental impacts, technical feasibility, and economics would have to be addressed adequately before moving forward with the project.
10.3.2.3 Converting Fossil Facilities and Chemical Plants for CO2 Utilization
The conversion of existing fossil facilities and chemical plants to accommodate CO2 utilization depends on the specific project economics and thus has to be considered on a case-by-case basis. For example, converting a conventional methanol synthesis plant using syngas to one using CO2 and H2 as feedstocks would require a CO2 purification unit and redesign of the reactor and methanol distillation column to separate excess water. Project developers would have to determine if such a conversion is cost-effective compared to construction of a new facility. Converting or rebuilding on existing facility sites could allow for reuse of the connected power, feedstock, and product offtake infrastructure, as well as retain the existing workforce associated with the facility.
10.3.3 Enabling Infrastructure Needs for Water, Hydrogen, and Electricity
CO2 is a fully oxidized form of carbon, thermodynamically degraded and devoid of energy except when used for some mineralization reactions to form carbonates. Therefore, activating CO2 for conversion requires inputs of energy in the form of electricity, hydrogen, and/or heat. As described in previous chapters, there are multiple pathways for converting CO2 into useful products and chemical intermediates. For example, CO2 can be electrochemically or thermochemically reduced to CO, which can be further reacted with H2 to form hydrocarbon products, effectively reproducing the current hydrocarbon economy. Given finite conversion efficiency, using renewable wind or solar energy to power hydrogen production requires at least twice the amount of energy as current commercial processes for making hydrogen, while further conversion into hydrocarbon products requires two-fold more energy (Adolf et al. 2018, 2020). Land use can also be a significant issue for CO2 utilization in systems where renewable electricity is used to provide both the energy and hydrogen required to upgrade CO2 to valuable products (Gabrielli et al. 2023; Merrill 2021). At a national scale, water requirements for CO2 utilization do not represent a significant increase over current usage, but local impacts need to be evaluated. The committee’s first report detailed these enabling infrastructure requirements to supply clean electricity, clean hydrogen, water, land, and energy storage for CO2 utilization projects (Chapter 4 of NASEM 2023a), and the committee refers readers to that discussion for more information. This section covers additional aspects of CO2 utilization enabling infrastructure not discussed in depth in the first report (e.g., transportation of hydrogen) and highlights regional considerations for electricity, hydrogen, and water infrastructure when developing CO2 utilization facilities.
10.3.3.1 Hydrogen Pipelines
Clean hydrogen6 is a required feedstock for many approaches to convert captured CO2 into synthetic fuels and chemicals. For dispersed CO2 emitters, onsite production of clean hydrogen for CO2 utilization may not always be a viable option. In such circumstances, to take advantage of economies of scale, hydrogen may be produced at a central facility for distribution to the various emitters. Given the large volumes involved, transportation of gas-phase hydrogen using high-pressure pipelines in combination with other modes of transport may be the most viable option. Developing infrastructure to supply clean hydrogen at large scale (e.g., for use in vehicles and power generation) would require an expansive hydrogen pipeline network (Parfomak 2021). Clean hydrogen for fuel cells or combustion will compete with battery electrification of vehicles and renewable power generation technologies, so it is not yet clear how much hydrogen fuel will be needed, and hence if any extensive hydrogen fuel infrastructure will be built. If hydrogen pipelines are built, some of them may also supply hydrogen to dispersed emitters for CO2 utilization depending on their proximity.
To facilitate hydrogen infrastructure development, the Consolidated Appropriations Act, 2021 provided funding to DOE’s Hydrogen and Fuel Cell Technologies Office to support R&D for topics including hydrogen pipeline research. The IIJA appropriated $9.5 billion for clean hydrogen (DOE 2022a), including to develop the Regional Clean Hydrogen Hubs discussed in Section 10.2.2. The IRA provided additional beneficial policies and incentives for the U.S. hydrogen industry to take center stage in the clean energy transition (Webster 2022).
___________________
6DOE’s Clean Hydrogen Production Standard considers low-carbon (i.e., clean) hydrogen that which has “well-to-gate lifecycle greenhouse gas emissions of ≤4.0 kgCO2e/kgH2” (DOE 2023c, p. 2).
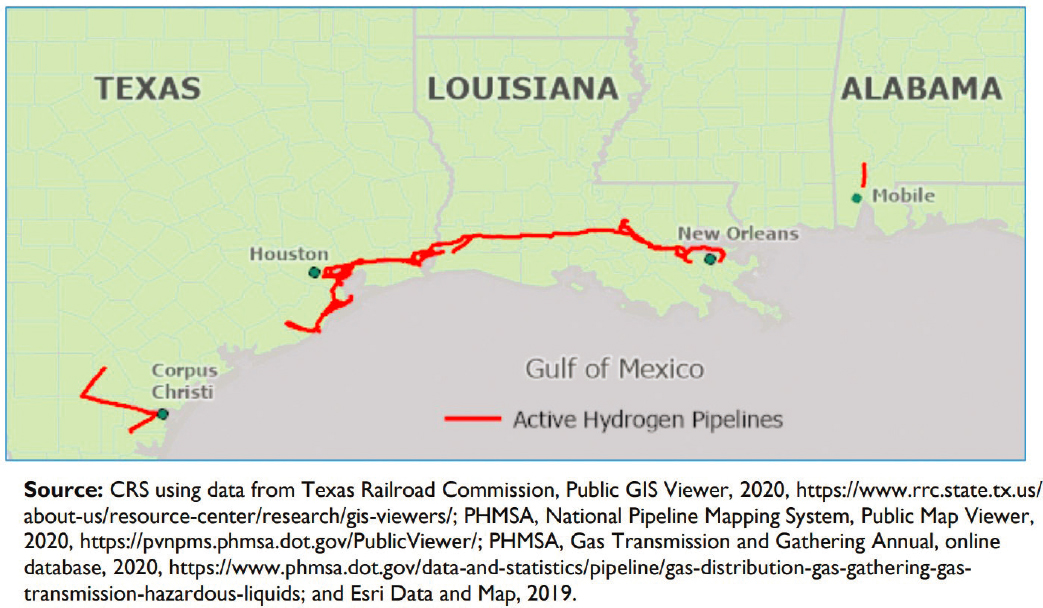
Experience with high-pressure transportation of hydrogen is relatively limited. It is currently done on a much smaller scale than other methods of transport, with only 1600 miles of pipelines in operation in the United States, mainly located in the Gulf Coast region (DOE-HFTO n.d.). More than 80 percent of these pipelines are in areas of low population density, defined as a class location unit 1 under current federal pipeline safety regulations (Kuprewicz 2022) (see Figure 10-9).
The anticipated increase in demand for hydrogen—for CO2 utilization and other fuel and feedstock applications—could require the development of a national high-pressure hydrogen transport pipeline network. NPC (2024) provides an in-depth analysis of the technology, policy, and partnerships needed to build out hydrogen infrastructure that is safe, integrated, flexible, scalable, and resilient. In a large-scale system, some hydrogen pipelines would need to pass through or nearby populated areas, so their safe operation is of paramount importance. Hydrogen has a unique hazard profile, substantially different than those for CO2 or hydrocarbons, which requires important and stringent modifications to minimum federal and state pipeline safety regulations (DOE 2023d; Kuprewicz 2022). Relevant risk factors to consider when drafting hydrogen pipeline regulations include the following (Kuprewicz 2022):
- Hydrogen has a much greater flammability range than natural gas and hence is more likely to combust.
- Because hydrogen is the smallest chemical element, it readily diffuses through most materials, and thus hydrogen pipelines are more susceptible to leaks than CO2 or natural gas pipelines.
- On a weight-for-weight basis, hydrogen has more than double the energy intensity of natural gas.
- Hydrogen has a much lower autoignition temperature and faster burn velocity than natural gas, meaning that its accidental release is much more likely to lead to detonation and explosion as compared to natural gas.
- Over time, hydrogen can cause metal embrittlement, increasing the probability of pipeline failure.
- Hydrogen is an indirect greenhouse gas, with potentially 33 times the warming power of CO2 in the first 20 years.
SOURCE: Parfomak (2021).
- Odorants are routinely added to natural gas to detect accidental leaks. Special odorants will need to be developed for hydrogen that do not lead to mixtures that adversely interact with pipeline materials, have minimal health and environmental impacts, and do not require costly separation depending on the end use (Murugan et al. 2019).
10.3.3.2 Regional Considerations for Clean Electricity, Hydrogen, and Water Infrastructure for CO2 Utilization
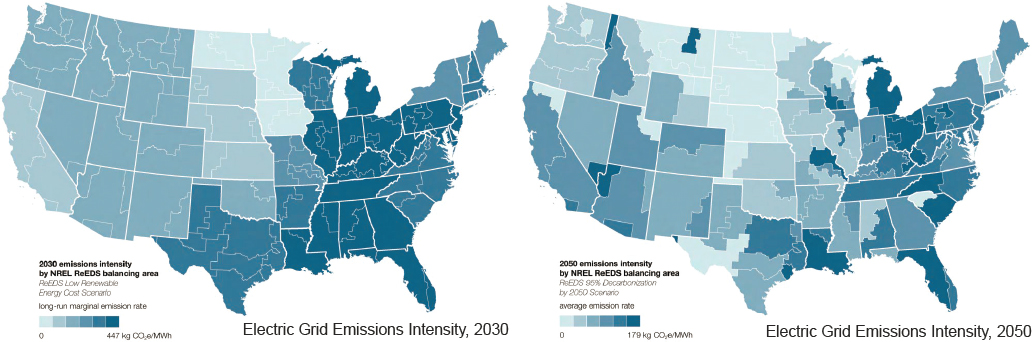
Enabling infrastructure requirements for CO2 utilization—in particular the needs for clean electricity, clean hydrogen, and water—are likely to impact siting decisions for CO2 utilization facilities. For example, clean electricity is needed to power CO2 capture and conversion, electrolytic hydrogen generation, and other processes to ensure that CO2-derived products have lower emissions than incumbent products on a lifecycle basis. Grid emissions intensity varies regionally, and such variations are projected to continue through 2030 and 2050, as illustrated in Figure 10-10. Thus, in the absence of dedicated, onsite clean energy generation for a CO2 utilization project, developers may preferentially site facilities in regions with lower average grid emissions. Alternatively, developers could contract for emissions-free electricity through a power purchase agreement or work with a utility to set up a tariff structure to obtain clean electricity for their project. In either case, robust LCA would be required to determine eligibility for renewable energy tax credits.
If a CO2 utilization project developer decides to deploy dedicated renewable resources (e.g., onsite wind or solar) to obtain clean electricity, the varying resource potential across the country (see NREL n.d.) would need to be considered in site selection. Furthermore, as discussed in the committee’s first report, many regions with abundant renewable resources are water stressed (Finding 4.14, NASEM 2023a), which could limit deployment of CO2 utilization projects that require water (e.g., some carbon capture technologies, algae cultivation, and hydrogen production).
The locations of planned hydrogen hubs (see Figure 10-2 and Section 10.2.2) could also impact CO2 utilization infrastructure siting, given that many CO2 utilization processes require clean hydrogen. To that end, the committee’s first report recommended that DOE consider co-locating hydrogen and DAC hubs (Recommendation 6.4, NASEM 2023a), which it could still consider for the two DAC hubs yet to be selected. As shown in Figure 10-11, a 2023 Great Plains Institute analysis identified promising locations for DAC technology deployment based on proximity to low-carbon electricity and heat, geological carbon storage, and existing CO2 transport, as well as appropriate climate and atmospheric conditions for DAC operation (Abramson et al. 2023). An analysis by Cai et al. (2024) examined the effects of meteorological conditions (e.g., temperature, humidity, atmospheric pressure, and local
SOURCE: Adapted from Abramson et al. (2023).
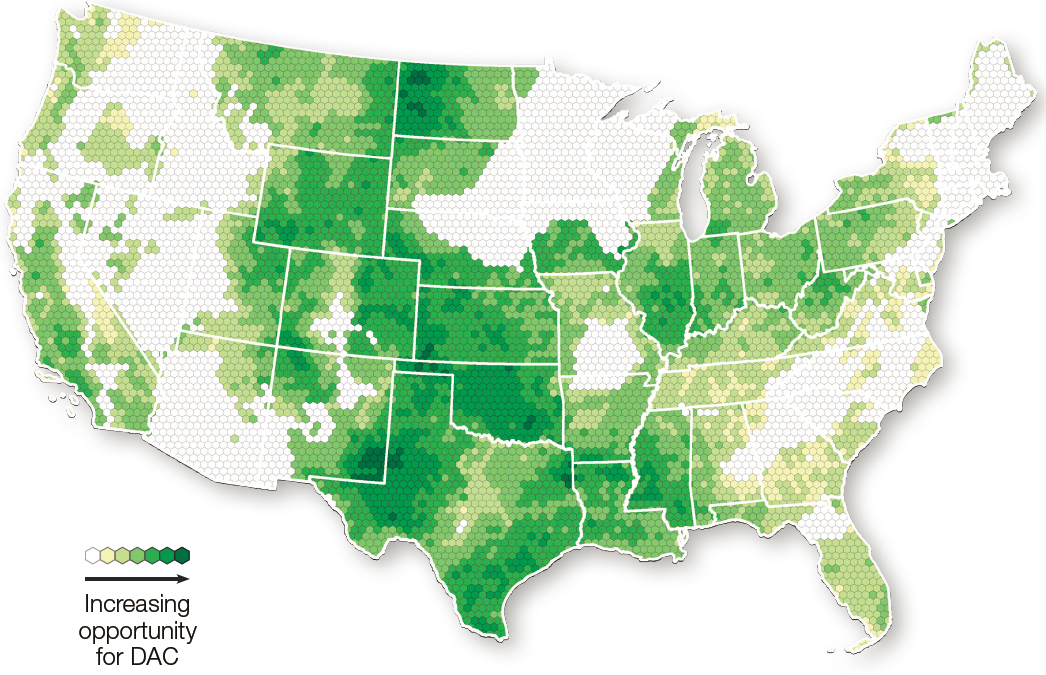
SOURCE: Abramson et al. (2023).
CO2 concentration) on the performance of amine-based DAC systems, concluding that process optimization at a specific location can significantly improve system performance and that consideration of local atmospheric conditions may impact siting decisions for DAC facilities. Overlaying these results with the hydrogen hub locations could identify promising sites to develop infrastructure for production of chemicals and fuels from CO2.
10.3.4 Timescale for Implementation and Potential Barriers
A number of factors will influence whether CO2 utilization infrastructure can be deployed on a timeline that allows it to contribute effectively to midcentury decarbonization goals. Primary barriers to CO2 utilization development are the cost of CO2 capture and, in cases where onsite CO2 utilization is not feasible, transportation infrastructure costs. The cost of CO2 capture is inversely proportional to the CO2 concentration in the gas stream, ranging from less than $20 per tonne CO2 for some high-purity streams (e.g., ethanol fermentation off-gas and natural gas processing) to upward of $1000 per tonne CO2 for low-concentration streams (e.g., DAC) (Budinis and Lo Re 2023; DOE 2023a). Transportation of captured CO2 for utilization and/or storage also adds cost, estimated at $5–$25 per tonne CO2 for pipeline transport, $14–$25 per tonne CO2 for ship transport, and $35–$60 per tonne CO2 for rail and truck transport (DOE 2023a). Purification requirements for different transport modes (see Table H-3 in Appendix H) could further increase costs.
The long lead times for developing and deploying CO2 capture, transport, and storage infrastructure, as depicted in Figure 10-12, also could slow large-scale CO2 utilization rollout. For example, a lack of operational
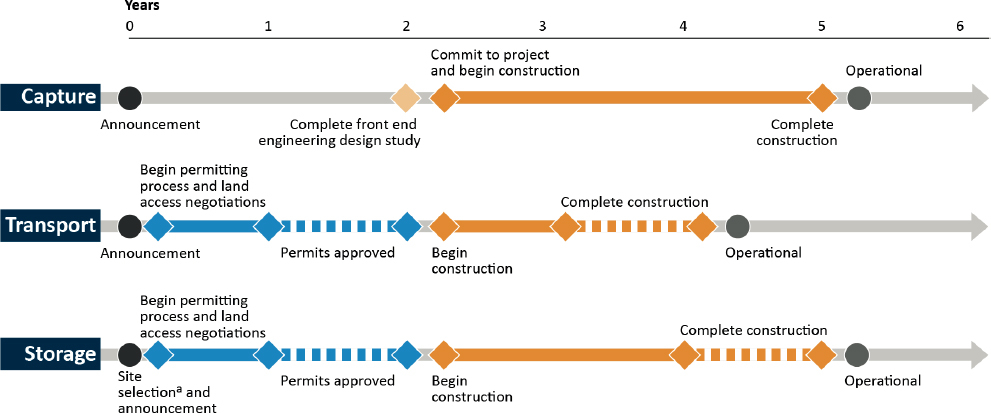
SOURCE: GAO (2022).
storage capacity may deter investments in pipeline infrastructure, which in turn could delay CO2 utilization projects that plan to obtain CO2 from a larger pipeline network. As another example, CO2 utilization projects aiming to produce hydrocarbon fuels from low-cost, high-purity, biogenic CO2 from ethanol fermentation facilities may not be feasible without a pipeline network in place that can aggregate CO2 sources to achieve economies of scale for fuel production. In addition to having long lead times, pipeline development also faces challenges with public acceptance, as discussed in Section 10.2.3. Regional or national CO2 infrastructure planning is also challenged by uncertain policy and business environments that will impact future availability and cost of CO2 and other inputs to CO2 utilization like clean electricity and hydrogen. For instance, legal challenges to EPA’s power plant emissions rule raise questions about the future availability, quantity, and location of CO2 sourced from power plants, which affects business cases and decisionmaking on how, when, and where to build CCUS infrastructure. Uncertainty in the durability of state and national policies, regulations, and incentives for CO2 pipelines, CO2 use and storage, clean electricity, and clean hydrogen also impedes long-term investment decisions for infrastructure.
10.4 INFRASTRUCTURE IMPACTS
The committee’s statement of task asks it to “[d]escribe the economic, climate, and environmental impacts of any well-integrated national carbon dioxide pipeline system as applied for carbon utilization purposes.” Recognizing that pipelines are only one component of the infrastructure needed to support CO2 utilization—and, in fact, may not be required for all CO2 utilization opportunities—this section also considers impacts of carbon capture, enabling inputs like hydrogen and water, and industrial facility siting and development.
10.4.1 Economic and Cost Impacts of Infrastructure Development for CO2 Utilization
Potential infrastructure deployment scenarios for utilization, such as those described in Section 10.3.1 above, are speculative. However, existing analyses of U.S. sources of CO2 and geological storage locations (e.g., Abramson et al. 2022; Larson et al. 2021) can inform assumptions about where these projects and their needed infrastructure might be built first. As described in previous chapters, CO2 utilization technologies have an inherent challenge of scale, making co-location with sites that are amenable to geological storage (see USGS 2013) an attractive option. Additionally, CO2 pipeline infrastructure is expensive (capital costs of recently announced projects in Table 10-4 range from $1.8 million to $2.7 million per mile), which adds incentive to develop utilization projects in close proximity to existing projects that will capture, transport, and store large quantities of CO2. As noted above, locating
CO2 utilization projects near enabling infrastructure for clean electricity and hydrogen production also could be beneficial. Multiobjective optimization models can assist project developers in determining the best options for infrastructure co-location.
In the coming months and years, continued implementation of the IIJA and IRA will provide a better sense of where and how this infrastructure will be deployed. Federal incentives will likely shape future infrastructure development, as many early movers may use federal funding programs, loans, or tax incentives to begin their projects. By one estimate, incentives in the IRA will spur $90 billion–$126 billion of investments in CO2 transport and storage infrastructure between 2023 and 2035 (Jenkins et al. 2023). Because IRA incentives improve the economic viability of carbon capture for steel, cement, refineries, and natural gas- and coal-fired power generation, around 200 million tons of CO2 could be captured from industry and power generation per year by the mid-2030s (Jenkins et al. 2023). In a net-zero future, the CO2 captured from these facilities will have to either be stored or used in long-lived products, as its use in short-lived products would result in net-positive CO2 emissions to the atmosphere. In the near term, before net-zero is reached, the lower cost of CO2 capture from fossil point sources versus DAC may enable more fossil CO2 removal per unit of investment, given that substitution of synthetic fuels or chemicals derived from CO2 reduce demand for petroleum or natural gas production. This possibility can be evaluated with a levelized cost of CO2 abatement combined with a full LCA that accounts for the initial energy services that result in fossil CO2 emissions, followed by capture and reuse.
When making net-zero infrastructure investment decisions, the levelized cost of CO2 abatement is a valuable metric. It measures the cost of a specific policy, technology, or investment per amount of CO2 reduced or removed, where the cost (including both capital and operating expenses) is annualized over the lifetime of the project. This accounting for cost of capital, amortization, and net present value across the project lifetime distinguishes the levelized cost of CO2 abatement from marginal abatement calculations and enables more relevant comparisons across options (Friedmann et al. 2020). Additionally, unlike many marginal abatement cost calculations, levelized abatement costs take into account the emissions source(s) being displaced upon implementation of the new policy, technology, or investment, which adds more local or regional specificity to the calculation (Friedmann et al. 2020). Any comparisons between levelized costs of CO2 abatement for different policy, technology, or investment options must use the same financing metrics and assumptions. Emissions reductions are estimated as the difference between the baseline condition and the “new” condition (i.e., the result of the policy, technology, or investment). As described in Friedmann et al. (2020), a simplified formula for calculating levelized cost (L) of CO2 abatement is as follows:
where C is the levelized cost of the investment or change in policy or technology, E0 is the emissions associated with the baseline condition, and E1 is the emissions upon making the investment or change in policy or technology. A smaller positive value for levelized cost of CO2 abatement indicates a more cost-effective action, although other factors beyond lowest cost (e.g., jobs, national security, equity implications) may also be important in making policy and technology decisions (Friedmann et al. 2020).
Public–private partnerships can also play a role in the development of large infrastructure such as a CCUS hub, as they facilitate sharing of resources. These partnerships can take different forms based on which entity owns and operates the various project components (e.g., capture infrastructure, utilization infrastructure, transport and storage infrastructure, possession of stored carbon, and title of stored carbon) (EFI Foundation and Horizon Climate Group 2023). As noted by the EFI Foundation and Horizon Climate Group, public–private partnerships for CCUS hubs could include “binding community benefits agreements for financial compensation, public authority or utility models for CO2 transport and storage management, or government entities assuming long-term liability and postinjection site care responsibilities” (EFI Foundation and Horizon Climate Group 2023, p. 68).
The potential economic contributions from a regional CO2 network for both storage and utilization can be substantial. CO2 infrastructure development could contribute to the U.S. economy via an expansion of the local workforce (jobs), purchase of goods and services from local businesses (direct spend), and payment of federal, state, and local taxes (taxes). These benefits can be compounded through indirect and induced impacts. Indirect impacts refer to the secondary effects of infrastructure deployment, such as the changes in output, employment, or labor earnings of industries that support CO2 utilization. Induced impacts emerge from the interaction between
the CO2 utilization sector and other sectors. While development of a regional CO2 pipeline network in the United States has been challenging (see Section 10.2.3), the experience of those project developers provides insight into the estimated economic benefits. Table 10-4 summarizes publicly available information from specific projects.
Despite these potential benefits, development of CO2 utilization infrastructure also could have some negative impacts for local communities, project developers, and the existing CO2 market. For instance, CO2 infrastructure development could result in land use changes that affect local economies owing to changes in property values and/or tax base. Project developers wanting to obtain CO2 from pipelines destined for storage could see high initial costs as pipeline capacity ramps up, which could deter investment or result in higher costs being passed along to the first customers. A nascent but growing CO2 utilization industry could also raise the cost of CO2 for direct use markets, such as food and beverage, where potential negative social impacts include an increase in cost of those products.
10.4.2 Climate and Environmental Impacts of Infrastructure for CO2 Utilization
Regional- and national-scale infrastructure for CO2 utilization will have benefits and impacts concurrent to those outlined in the committee’s first report (NASEM 2023a), which focused on enabling infrastructure. This section emphasizes the combined impacts of both CO2 utilization and enabling infrastructure, and outlines gaps.
Decisions about the design and siting of CO2 utilization facilities impact air emissions. LCA results for CO2 utilization demonstrate a large range of climate and air pollution impacts, depending on the product and the way in which the LCA was conducted (see Chapter 3 for more detail). For CO2 capture infrastructure, air pollution impacts may not be displaced unless operations are powered by renewable energy and the systems are designed
TABLE 10-4 Estimated Economic Benefits from Proposed CO2 Pipeline Projects
| Project | Location | Pipeline Distance | Estimated CO2 Captured | Costs | Estimated Job Creation | Estimated Tax Impact | |
|---|---|---|---|---|---|---|---|
| Total Capital | Annual Operating | ||||||
| Summit Carbon Solutionsa | Iowa, Minnesota, Nebraska, North Dakota, South Dakota | 1991 miles | 16 MTPA | $4.8 billion | $213 million | Construction phase (2021–2027): 6921/yr | Construction phase: $493.6 million/phase |
| Operations phase: 989 | Operations phase: $94.7 million/yr | ||||||
| Economic Impacts of CO2 Pipelines in South Dakotab | South Dakota | 361 miles (Navigator) 474 miles (Summit) | Not reported | $1.5 billion | $792 million | Construction phase (2024–2025): 5353/yr Operations phase: 436 | Not reported |
| Wolf Carbon Solutionsc | Illinois, Iowa | 280 miles | 12 MTPA | Not reported | Not reported | Construction phase (first year): 2780 | Not reported |
| Operations phase: 342 | |||||||
| Navigator CO2 Solutionsd,e | Illinois, Iowa, Minnesota, Nebraska, South Dakota | 1300 miles | 15 MTPA | $3.5 billion | Not reported | Construction phase: 8000 | $43 million/yr |
| Operations phase: 80 | |||||||
aSummit Carbon Solutions (2023, 2024).
cWolf Carbon Solutions U.S. LLC (2023).
dEller (2023); Navigator Heartland Greenway LLC (2021).
e Despite project cancellation, included for reference of potential economic impacts of CO2 pipeline projects.
to reduce or eliminate co-pollutants (Jacobson 2019). Systems designed to reduce both CO2 and co-pollutant emissions could remove at least 75 percent of NOx emissions, 98 percent of SO2 emissions, and all condensable particulate matter (PM), alongside 90 percent capture of CO2 emissions (Bennett et al. 2023). Figure 10-13 shows potential regional emissions reductions for CO2, NOx, SO2, and PM2.5 that could be achieved by deploying carbon capture on cement plants, providing a representative example of carbon capture co-benefits.
The transport of CO2 through pipelines often requires compression for gas phase and pumping for dense phase, often involving intermediate boosting in the case of long distances (Doctor et al. 2005), which in turn requires energy. For natural gas pipeline transport, such demand is typically fueled using combined cycle gas turbines, which result in CO2 emissions and other pollutants (e.g., volatile organic carbons [VOCs]); however, in the case of CO2 pipelines, electricity may serve as a less carbon-intensive source of power, depending on the localized generation mix (Doctor et al. 2005). While metering has been recommended to account for any lost and unaccounted for gas, leak detection systems for CO2 pipelines can reduce potential risks (Han et al. 2019; Santos 2012).
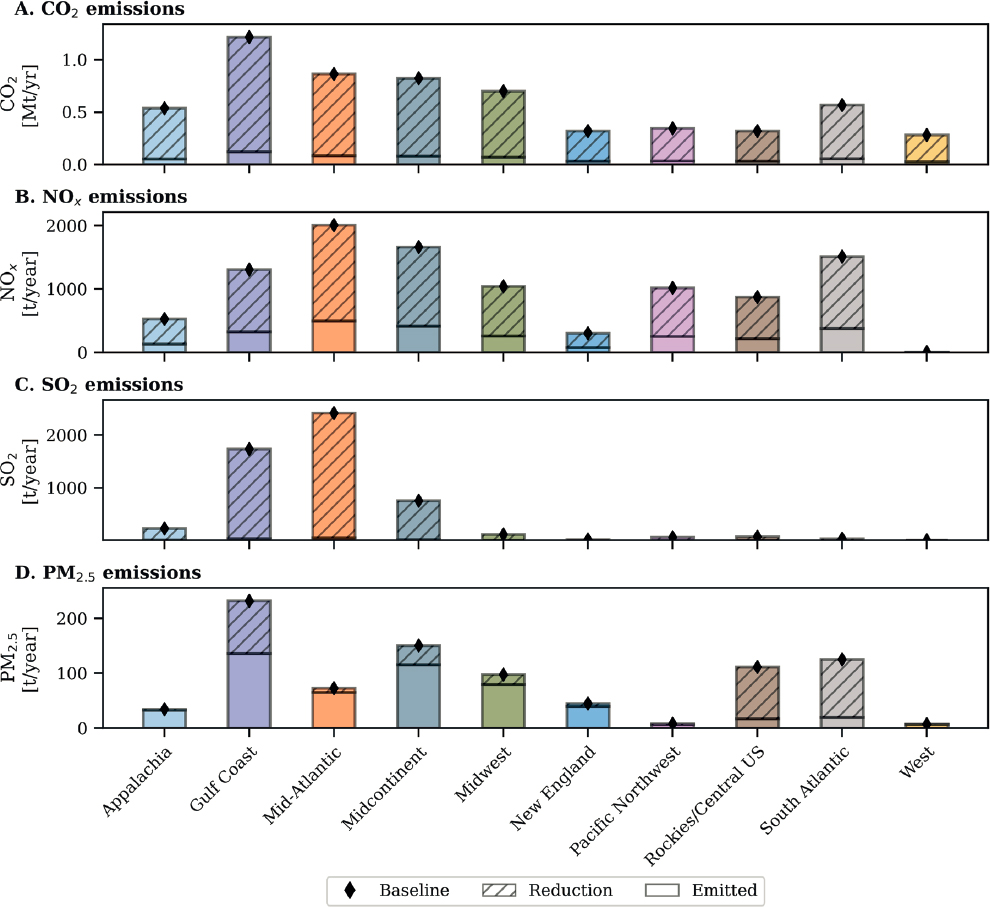
SOURCE: Bennett et al. (2023).
Hydrogen, comprising part of the enabling infrastructure for CO2 utilization, has indirect global warming impacts, with an estimated global warming potential over a 100-year time horizon (GWP100) of 11.6 ± 2.8 (one standard deviation) (Sand et al. 2023). A recent review found that documented leaks across the present and future hydrogen value chain range widely; for example, from 0.5–1.0 percent for hydrogen production by steam methane reforming, 0.0–1.5 percent for hydrogen production by steam methane reforming with carbon capture, and 0.03–9.2 percent for hydrogen production by water electrolysis (Esquivel-Elizondo et al. 2023). If hydrogen production relies on natural gas, there may be additional upstream leaks that could further confound climate benefits, but these could be avoided if hydrogen is produced using renewable energy through electrolysis or other nonfossil methods (Bertagni et al. 2022). These findings present particular significance for developing measurement programs for enabling infrastructure involving hydrogen value chains.
Different types of CO2 utilization operations can increase specific impacts other than climate change as well. For example, for CO2 capture from thermal power plants, water requirements may increase owing to additional cooling needs and process water make-up (Magneschi et al. 2017; Ou et al. 2018). Net-zero scenarios that rely on CO2 utilization may face land constraints without adequate planning, incurring ecosystem costs (Williams et al. 2021). Enabling infrastructure such as renewable power plants and transmission capacity will incur new land requirements and possibly damage to ecosystems without diligent siting analysis for new facilities (Hernandez et al. 2020). Furthermore, if the CO2 supply is sourced from biomass, development may face additional land and water constraints.
10.4.3 Health and Safety Impacts of CO2 Utilization Infrastructure
As more CO2 utilization infrastructure is deployed, care will have to be taken to ensure safe operation of all technologies throughout the value chain, from CO2 capture, to transport, to use in industry. The potential health hazards need to be understood and measures put in place to mitigate them. The sections below briefly describe health and safety considerations for CO2 capture technologies, CO2 transport in pipelines, and CO2 use in industry.
10.4.3.1 CO2 Capture Technologies
Solvent-based technologies remain one of the leading methods for large-scale post-combustion CO2 capture. Research conducted at the Technology Centre Mongstad (TCM) has shed light on the potential harmful effects of amines used in carbon capture processes (Flø et al. 2017; Morken et al. 2014, 2017). During test campaigns with monoethanolamine between 2015 and 2018, solvent degradation and associated air emissions were observed. These degradation products include nitrosamine and nitramines, which are carcinogenic, toxic, and mutagenic compounds. The same studies at TCM also investigated strategies to reduce air emissions by addressing the main mechanisms for solvent degradation, namely exposure to heat (thermal degradation), oxygen (oxidative degradation), and reactions of the amine with flue gas contaminants such as SOx, NOx, halogenated compounds, and other impurities.
Advanced approaches to solvent management, flue gas pretreatment, and optimized plant process configuration have been shown to reduce solvent degradation. The initial concentration of solvent also has been shown to have a significant impact on degradation (Azarpour and Zendehboudi 2023). It is important to keep the solvent fresh by setting strict threshold limits for key indicators, such as ammonia concentration, and performing regular solvent exchange. Advanced novel process concepts have been developed to reduce and control amine emissions. A water wash section in the absorber and Brownian diffusion filter upstream from the absorber have been shown to remove greater than 95 percent aerosol contaminants that contribute to solvent degradation (Shah et al. 2018).
Other complications associated with amine-based CO2 capture technology include the occupational hygiene risks associated with exposure of plant operators to amines, waste handling, and disposal of spent solvent and the risks associated with materials management, such as potential contamination of groundwater or surface water from unintended spills or leaks in the plant or in the chemical inventory. The absence of large-scale CCS facilities or reported data in the literature from pilot facilities make it difficult to estimate potential amine exposures and predict formation of and exposure to degradation products. Moreover, technology providers make use of proprietary amine blends that could have different impacts. However, with proper worker training and curbed containment areas surrounding the facility, these risks can be properly mitigated. Although amine solvents are the most commercially
prevalent technology today, other technologies are in various stages of development (NASEM 2023a; Pett-Ridge et al. 2023). Next-generation innovations in sorbents, membranes, looping cycles, and other novel concepts can mitigate health and safety risks associated with amine-based carbon capture systems.
A report from the Great Plains Institute highlighted health benefits of carbon capture facilities from the removal of co-pollutants and subsequent improvement of air quality (Bennett et al. 2023). As previously mentioned, amine-based capture systems require flue gas pretreatment to remove NOx, SO2, and PM2.5 to reduce solvent degradation and improve capture performance. Bennett et al. (2023) developed a methodology to evaluate the co-benefits of applying pretreatment for these co-pollutants to amine-based carbon capture for seven industries. The analysis used the EPA CO-Benefits Risk Assessment (COBRA) Health Impacts Screening and Mapping tool to quantify changes in air quality from removal of these co-pollutants and calculate the changes in 12 different health outcomes, including adult and infant mortality, asthma exacerbations, and respiratory and cardiovascular-related hospital admissions. It then calculated the total monetary value of all impacts in millions of dollars per year. The analysis showed that co-pollutant removal resulted in health benefits across all industries and regions, with an economic value ranging from $6.8 million to $481.2 million per year, with the highest potential impact in the Mid-Atlantic and Appalachia regions (Bennett et al. 2023).
10.4.3.2 CO2 Pipelines
Safety considerations for CO2 transport were discussed in detail in the committee’s first report (Section 4.3.3, NASEM 2023a). The risks and hazards differ somewhat by mode of transport owing to pressure and temperature differences but are the same whether the CO2 is being transported for utilization or storage. As noted above, for large quantities of CO2, transport by pipelines is the safest and most cost-effective approach. The United States has been operating CO2 pipelines safely since the 1970s, primarily to transport CO2 for EOR (Wallace et al. 2015). CO2 pipeline safety is overseen by PHMSA, which requires operators to follow specific guidelines for operations and maintenance, control room management, public awareness, damage prevention, operator qualification, and drug and alcohol testing (Thomley and Kammer 2023). For example, to ensure safe operation, pipeline operators have to pay attention to pipeline design, monitor for leaks, protect against corrosion, and safeguard against overpressure (Carbon Capture Coalition 2023).
While CO2 pipelines have a strong safety record overall, incidents can be and have been significant. A primary example is the rupture of a CO2 pipeline near Satartia, Mississippi, in February 2020, which required 45 individuals to seek medical attention and 200 to evacuate (Thomley and Kammer 2023). This rupture resulted in the formation of a crater owing to a high momentum CO2 jet, as illustrated in Figure 10-14. The failure investigation of this incident, led by PHMSA, found that the plume dispersion model used as part of the risk assessment underestimated the safety distances (PHMSA 2022). PHMSA’s investigation indicated needs for improvements in (1) mitigation efforts to address “integrity threats owing to changing climate, geohazards, and soil stability issues” and (2) public and emergency responder awareness of CO2 pipeline safety (PHMSA 2022, p. 2). As a result of this incident, PHMSA initiated a rulemaking process to update its safety standards for CO2 pipelines, with plans to release a Notice of Proposed Rulemaking in 2024 (Parfomak 2023). In April 2024, pipeline developer Tallgrass established a community benefits agreement with Bold Alliance that includes $600,000 in funding for emergency response equipment and training in communities along the pipeline route, among other provisions (Hammel 2024). (See Chapter 4 for more on community benefits agreements and community engagement around CO2 pipeline siting.) The Carbon Capture Coalition, a nonpartisan group working to facilitate commercial deployment of carbon management, proposed the following measures to increase CO2 pipeline safety while supporting build-out of this infrastructure to meet net-zero emissions goals: “expand first responder training for CO2 pipeline safety incidents; request that PHMSA conduct additional reporting on the public safety record of CO2 pipelines; require that project proponents more rigorously consider potential geohazard impacts on CO2 pipelines during design, siting, construction, and maintenance; carry out a national assessment of the CO2 network necessary to meet net-zero emissions” (Carbon Capture Coalition 2023, p. 2).
Additional R&D on dispersion modeling for CO2 and its typical stream impurities and on propagating brittle and ductile fractures in CO2 pipelines also could help improve CO2 pipeline safety. For example, while there are relatively accurate computer simulations that model CO2 dispersion behavior following accidental release from a pipeline, more research is needed to model the dispersion of CO2 and its impurities from a crater formed owing to the rupture of a

SOURCE: Adapted from PHMSA (2022).
buried pipeline. Such research could inform the minimum safety distance required. Additionally, as highlighted in the committee’s first report (NASEM 2023a), the risk of propagating ductile and brittle fractures in CO2 pipelines warrants significant research attention. Rigorous mathematical models need to be validated using realistic-scale test facilities to determine a pipeline’s susceptibility to these types of fractures and to identify the appropriate pipeline materials to mitigate these risks. Given the multidisciplinary nature of the expertise needed in understanding and modeling the behavior of CO2 pipelines, coupled with the significant capital investment needed to conduct realistic field tests, international collaboration of the type funded by the European Commission’s Horizon Europe program (European Commission n.d.) can be a key enabler in accelerating the safe, large-scale implementation of CO2 pipelines.
10.4.3.3 Industrial Use of CO2
Carbon dioxide is a colorless, odorless, and tasteless gas at normal temperatures and atmospheric pressures, making it undetectable without monitoring devices (Airgas 2018; FSIS Environmental Health and Safety Group 2020; Spitzenberger and Flechas 2023). With a density of 1.98 kg/m3 at standard temperature and pressure, CO2 is approximately 1.5 times heavier than air and can cause low-lying vapor clouds along the ground, or in depressed areas such as pits and cellars. CO2 is typically transported, stored, and handled in its liquid form, either in cylinders or noninsulated storage tanks at ambient temperature, or under pressure in insulated tankers and storage tanks at temperatures between −35°C and −15°C (CO2 Gas Company 2017). Many industries also utilize CO2 in its solid form (dry ice) for chilling and packing product.
Workers that handle CO2 storage or portable containers, dry ice, or operate near areas where CO2 is produced or stored, risk CO2 exposure. A CO2 cylinder may rupture (or burst) if heated or if the container is overfilled.
Compressed CO2 gas that is released from a cylinder can injure skin or eyes. Contact with solid CO2 (dry ice) and refrigerated liquid CO2 will cause frostbite upon contact owing to the extremely cold temperatures. Dry ice rapidly sublimes and off-gases CO2, and levels as high as 30,000 ppm have been measured in rooms where dry ice is handled without adequate ventilation (FSIS Environmental Health and Safety Group 2020). A potential asphyxiation hazard exists when CO2 is dispensed from transportation vessels to stationary, low-pressure storage tanks if there are inadequate transfer seals (OSHA 1996). Exposure to CO2 gas can lead to negative health effects, which range from headaches and dizziness with minimal CO2 exposure to difficulty breathing, malaise, increased heart rate, elevated blood pressure, asphyxia, convulsions, unconsciousness, and even death.
CO2 generally is not found at hazardous levels, unless there is limited ventilation where gas is being stored or produced, or in confined or enclosed spaces. The industry has developed standards and procedures to minimize the development of hazardous conditions (OSHA 1996). These include adequate employee training; CO2 safety warning signs around stored CO2; gas detection and alarm systems that can alert building occupants of a CO2 gas release; proper personal protective equipment such as cryogenic gloves and eye protection; as well as regular maintenance and inspection of CO2 equipment by qualified personnel.
Owing to its potential to create a hazardous atmosphere, the transport, storage, and handling of CO2 are regulated by several agencies, including the National Fire Protection Association, the National Board Inspection Code, the International Fire Code, the Occupational Safety and Health Administration (OSHA), and the National Institute for Occupational Safety and Health (Department of Labor 1974; EPA 2000). These organizations have agreed to workplace exposure limits for CO2 set by OSHA that would likely be applicable to future CO2 utilization markets (FSIS Environmental Health and Safety Group 2020).
10.4.4 Environmental Justice Considerations and Societal Support for CO2 Utilization Infrastructure Development and Use
As discussed in more detail in Chapter 4, CO2 utilization infrastructure development, siting, and selection will play impactful roles in determining the overall benefits of utilization projects, as well as broader societal support for them. Incorporating environmental and social justice tenets in the development of this infrastructure is not a guarantee for support but remains a foundational premise if the sector is to play an integral role in a more equitable circular economy and to avoid past and ongoing harms of linear economies that rely on extractive and disenfranchising principles.
Until the CO2 utilization sector establishes itself in a consumer market in a tangible way, it will continue to be viewed primarily in the context of other carbon management infrastructure, especially CCS. Many individuals of historically marginalized backgrounds and disenfranchised communities consider carbon management to be a part of the extractive, carbon-based industries that concentrate economic and political power and harm their communities and the global environment (Chemnick 2023; Climate Justice Alliance 2019; Earthjustice and Clean Energy Program 2023; Just Transition Alliance 2020; New Energy Economy n.d.). The opposition to emerging carbon management technologies like carbon capture and carbon removal mirrors the themes seen in opposition to other emerging industries such as advanced nuclear and hydrogen (NASEM 2023b, 2024). However, most societal acceptance research has determined that the general public lacks information about CO2 utilization and the carbon management sphere as a whole (Offermann-van Heek et al. 2018), which provides an opportunity both to embed environmental justice and community-centered principles into the build-out of the utilization sector and shape further discourse on the subject.
For infrastructure that has yet to be built out, there are opportunities for developers to consider incorporating and prioritizing specific environmental justice principles that may impact how the work gets done, including considerations around shared resources like energy, land, and water use. Best practices for community engagement around project development will differ across communities, but core tenets include avoiding past mistakes, building trust and maintaining relationships, centering enfranchising frameworks, providing resources for engagement, employing alternative ownership models, and sharing information transparently, all of which are elaborated upon further in Chapter 4.
Project siting has to take into account community history and perceptions around new infrastructure versus existing infrastructure, as well as aspects like pipelines that could substantially increase in number as the sector
builds out. The centering of strategies developed by minority and overburdened communities—especially those that have had significant intersections with resource management and pipeline development like U.S. Indigenous communities and Tribal nations—and lessons learned from past community experiences can play significant roles in ensuring that community concerns are adequately addressed. Similarly, opportunities to incorporate justice principles into permitting and workforce development in the utilization space must be considered. Lastly, the siting of utilization infrastructure needs to consider the role the end products will play in creating a more just circular economy; understand impacts from infrastructure and use frameworks, such as Community Benefit Agreements and Free, Prior, and Informed Consent, to encourage their just distribution; and incorporate these frameworks into decision-making processes.
10.4.5 CO2 Utilization Infrastructure Considerations and Trade-Offs
Infrastructure development is a critical bottleneck for CO2 utilization. Infrastructure decisions require considerations across the value chain to ensure safety and economic viability, minimize environmental impacts, engage with communities, and enable sustainable production of the chemicals and materials needed in a net-zero future. These decisions necessarily involve trade-offs—for example, where one solution might have lower cost, another might yield lower emissions—and decision makers will need to determine which factor(s) are more critical for a particular project. In this section, the committee highlights some considerations and trade-offs for CO2 utilization infrastructure deployment.
The source of CO2 utilized influences the life cycle carbon intensity and public acceptance of, and corporate investment in, different conversion processes, as well as the infrastructure required. For example, the largest point sources of CO2 today are of fossil origin. They can enable economies of scale for CO2-derived products and can avoid extensive use of CO2 pipelines via co-locating CO2 capture and production of CO2-derived products. However, using such sources for production of short-lived products like hydrocarbon fuels would not be sustainable in a net-zero future, as the fossil-derived carbon would be reemitted quickly to the atmosphere, adding net-positive emissions. As discussed in the committee’s first report, atmospheric or biogenic CO2 is a more sustainable feedstock for hydrocarbon products (NASEM 2023a). However, costs are high for CO2 produced from DAC, and supply is limited from biogenic sources, which are orders of magnitude smaller than from petroleum refineries and require extensive agricultural land (and water) for corn-derived bioethanol fuel production, which simultaneously forms the CO2 off-gas. CO2 from fossil point sources at 4–25 percent by volume will always be less expensive to collect and purify than CO2 from DAC at ~450 ppm CO2. The cost of widely available fossil CO2 from power plants or industrial heating and power applications ranges from $40–$290 per tonne (Bennett et al. 2023; GAO 2022; Hughes et al. 2022; Moniz et al. 2023; NPC 2019), compared to costs of $90–$1000 per ton CO2 for DAC (Budinis and Lo Re 2023; DOE 2023a; NASEM 2019).
Additional questions surround the long-term viability of investments in CO2 capture from fossil point sources and the related CO2 transport, use, and storage infrastructure. For example, what, if any, fossil-powered electricity generation or industrial heat and power will remain in the net-zero future, requiring CO2 capture and utilization or sequestration infrastructure? Which fossil-powered facilities will be last to be retired, thus making them better candidates for CO2 capture retrofits? Will small emitters continue to emit and capture their CO2, or change their processes to no longer emit? The answers to these questions might differ for emitters that produce pure streams of CO2 versus those with CO2 streams requiring purification prior to use or storage, or for utilization processes that can be done economically on a small scale (e.g., concrete and fertilizer production) versus those requiring larger scales for viability.
One scenario to consider is the development of a CO2-to-fuels commercial plant, where the developer has a choice of using fossil point source CO2 or DAC CO2 (assuming that low-cost biogenic CO2 is unavailable owing to volume or location constraints). The CO2-derived liquid fuel product would reduce the use of petroleum to supply final global demand for liquid fuels.7 For a given investment, more CO2-derived fuel can be made from fossil
___________________
7In the current policy environment, independent oil producers would respond to an increase in CO2-derived fuels by reducing drilling operations, which would cause oil prices to decrease owing to oversupply until existing reservoirs decline to match the lower demand. Such actions would make it even harder for additional biofuels or CO2-to-fuels projects to compete, may reduce the impetus for electrification of transportation, and could lead to enhanced liquid fuel use (assuming consumers limit gasoline or diesel use when prices are high). While relevant to note these nuances, this scenario presents investment considerations only between the two CO2 sources.
point source CO2 owing to the lower capital costs, so the lower-cost point source CO2 reduces more petroleum than DAC CO2 would. There are several risks to choosing fossil point source CO2, however:
- Climate, energy, or tax policy may lead to early retirement of assets producing fossil CO2.
- Public opinion and global policy8 favor use of DAC and biogenic CO2; thus, these sources may be incentivized over fossil point source CO2.
The net emissions reductions resulting from using either fossil or DAC CO2 also need to be considered. Use of fossil point source CO2 to produce fuel results in net positive fossil carbon emissions to the atmosphere, while producing at most twice the energy output.9 On the other hand, use of DAC CO2 for hydrocarbon fuel production can result in a net-zero emissions fuel if all other inputs are also net-zero carbon emissions. Another complication with DAC CO2-to-fuels plants is that, given the current high costs of DAC, investments in DAC CO2-to-fuels facilities may only support a small plant capacity, which may also be less efficient than a larger fuels production facility. The levelized cost of CO2 abatement (see Section 10.4.1) from fossil point sources may remain less than from DAC sources during the time when most fuel is still being produced from petroleum. Levelized cost of CO2 abatement calculations can facilitate infrastructure investment decisions by indicating which facilities are likely to abate the most CO2 per investment cost over their lifetime. Government policy and corporate climate goals may not be designed to use this relationship, and hence risk in the fossil point-source investment is higher than its levelized cost of abatement.
In general, CCUS infrastructure is best positioned in proximity to both CO2 point sources and low-cost geologic storage sites, to enable sharing of infrastructure for CO2 supply and transport (De Luna et al. 2023). Nonetheless, CO2 utilization facilities have to be sited on a case-by-case basis, considering infrastructure needs, product type, market acceptance for the carbon-mitigation potential, and community acceptance of new facilities and infrastructure, all of which will vary across the nation and globally. Thus, infrastructure siting is best decided on a project basis, after development of a fully integrated technology and market plan, and engagement with local stakeholders. Public–private partnership funding can be provided to facilitate infrastructure costs for project development, as has been seen with some CCUS hubs under development in Europe (EFI Foundation and Horizon Climate Group 2023). Infrastructure investment in CCUS can contribute to local employment and support global CO2 emissions reduction goals, although local communities may face burdens of construction, land use changes, and potential pipeline development that need to be addressed. As discussed in this committee’s first report, regulators need to assess distributional impacts, particularly for historically disadvantaged groups, in collaboration with affected communities and CO2 utilization project developers and can consider compensation for those communities negatively impacted by the project or choose not to invest in the project if there are unavoidable and unacceptable equity implications (NASEM 2023a). Section 4.4 in Chapter 4 provides more information about considerations for selecting and siting projects with community input.
10.5 CONCLUSIONS
Building on the committee’s first report, this chapter provides an update on existing CO2 utilization infrastructure and considers economic, climate, environmental, health, safety, and environmental justice impacts of further CO2 utilization infrastructure development. Government and private sector investments in carbon management infrastructure continue to increase, notably through DOE’s Regional Direct Air Capture Hubs and Regional Clean Hydrogen Hubs and private development of CO2 pipelines and CCS hubs. Nonetheless, for CO2 capture, transport, storage, and utilization infrastructure, as well as for the enabling infrastructure of clean electricity and clean
___________________
8For example, the European Union requires that greenhouse gas (GHG) emissions savings for recycled carbon fuels (including CO2-derived fuels) be at least 70 percent compared to a fossil-carbon-based fuel and notes that “capturing of emissions from nonsustainable fuels should not be considered as avoiding emissions indefinitely when determining the greenhouse gas emissions savings from the use of renewable liquid and gaseous transport fuels of nonbiological origin and recycled carbon fuels” (European Commission 2023).
9As described in the committee’s first report, “The combustion of a hydrocarbon fuel yields the lower heating value of energy release and the associated CO2 emissions. If renewable energy is used to capture the emitted CO2 and convert it back into a hydrocarbon fuel, and then the fuel is combusted again, the same net emissions result but with twice the energy output. However, that 50 percent reduction in CO2 footprint assumes that capture and conversion are 100 percent efficient, so in reality, the CO2 footprint will be reduced by less than 50 percent compared to the ‘no recycling’ case” (NASEM 2023a, p. 132).
hydrogen generation, there are significant gaps between the current and announced capacity and the projected needs to meet midcentury net-zero targets.
Development of infrastructure to transport CO2, H2, and CO2-derived products could be the limiting factor in scaling up CO2 utilization given the significant costs, long lead times, and public concern. There may be opportunities to retrofit existing pipeline infrastructure to transport CO2, H2, or CO2-derived products, but these determinations will have to be made on a case-by-case basis, as such retrofitting can be technically challenging and costly. Furthermore, additional research is needed to understand and mitigate risks with H2 and CO2 transport. This includes, for CO2 pipelines, development of mathematical models and realistic-scale experiments to analyze issues with propagating brittle and ductile fractures and to examine CO2 dispersion following accidental rupture of buried CO2 pipelines that results in formation of a crater owing to the high-momentum CO2 jet. For H2 pipelines, safety concerns requiring attention include H2 embrittlement and its propensity to leak.
Deployment of CO2 utilization technologies can be facilitated by integrated infrastructure planning and development that balances cost, safety, and environmental impacts and prioritizes public engagement. Use of mathematical models to optimize multimodal CO2 transportation networks, development of shared CO2 pipelines for utilization and storage, establishment of public–private partnerships to facilitate resource sharing, and close coordination between developers of CO2 capture, transport, utilization, and storage projects may accelerate the build-out of CO2 utilization infrastructure. At the same time, the impacts of CO2 utilization infrastructure development on pollutant emissions, human health and safety, and local communities must be taken into account. Clear, durable government policies are needed to facilitate long-term investment decisions by industry that meet these societal needs, align with net-zero objectives, and avoid stranded assets.
10.5.1 Findings and Recommendations
Finding 10-1: CO2 utilization infrastructure development for midcentury net-zero targets—Although infrastructure to support CO2 utilization (e.g., for CO2 capture, transport, and storage, and generation of clean electricity and clean hydrogen) is expanding, the existing and announced capacities are not on track to meet the projected needs for achieving midcentury net-zero emissions targets. In cases where CO2 utilization provides a competitive option to achieve net zero, CO2 infrastructure development would require substantial amounts of capital investment—for example, across the carbon management value chain encompassing CO2 capture, transport, utilization, and storage, the Department of Energy estimates upward of $300 billion–$600 billion through 2050.
Finding 10-2: Expansion of CO2 pipeline infrastructure—The successful large-scale build-out of CO2 capture and storage would require a significant increase in the current stock of CO2 pipelines. Such pipelines could also enable CO2 utilization projects. A main challenge to expanding this infrastructure is recent public concerns regarding CO2 pipeline safety and siting for host communities. Opposition to pipelines is also seen by some groups as a means to block the development of CO2 capture, utilization, and storage projects, which they consider a moral hazard that could perpetuate use of fossil fuels.
Recommendation 10-1: Enhance public engagement on CO2 pipeline safety—In updating its safety standards for CO2 pipelines, the Pipeline and Hazardous Materials Safety Administration should highlight the importance of proactively addressing public concerns regarding pipeline safety at the earliest opportunity through open forum consultations as part of the process for obtaining planning consent.
Finding 10-3: CO2 utilization as a decarbonization option for small- to medium-scale emitters—Small- to medium-scale CO2 emitters, estimated to number around 7000, are distributed throughout the United States and collectively contribute a significant amount (approximately 33 percent) of overall U.S. emissions. Given the unique challenges of small- to medium-scale emitters compared to large emitters, dedicated strategies for their decarbonization will need to be developed. In addition to other decarbonization approaches, like electrification and improvements in energy efficiency, such strategies could involve CO2 capture and utilization using modular technologies that can accommodate smaller amounts of CO2 to match the emissions of the facility.
Recommendation 10-2: Evaluate CO2 capture and utilization for small- to medium-scale emitters—Small-to medium-scale emitters that cannot eliminate emissions through energy efficiency, electrification, and
other decarbonization strategies should evaluate the economic feasibility of performing CO2 capture and utilization on site. This may involve deploying renewable electricity generation, clean hydrogen production, modular carbon capture technologies, and utilization processes suited to small-scale conversion. In cases where this is not possible, taking account of their emissions rates and geographical location, such emitters should seek multimodal transport solutions for the CO2 and, if relevant, CO2-derived product, striking a balance between cost, safety, and environmental impacts using established methodologies that also have been proposed for hydrogen delivery infrastructure development. Additionally, as recommended in this committee’s first report (Recommendation 4.2), the Department of Energy should develop dedicated methodologies for optimizing multimodal CO2 transport to assist in these infrastructure planning efforts.
Finding 10-4: Shared CO2 pipelines for utilization and storage—The development of shared CO2 pipeline transportation infrastructure for utilization and storage with the flexibility of seamless switching between the two modes of application can significantly reduce infrastructure costs and environmental impacts. Such configurations are already being implemented in several carbon capture, utilization, and storage projects in Europe.
Recommendation 10-3: Support dual use of CO2 pipelines for utilization and storage—Congress should direct the Department of Transportation to develop policies and regulations that support the dual use of CO2 pipelines for both CO2 sequestration and utilization.
Finding 10-5: Deployment of carbon capture on industrial facilities—Current industrial processes were designed without consideration of carbon capture, often leading to the need to capture CO2 from multiple points in the process, or at low concentrations or pressures, which drives up the cost of carbon capture. Future commercial deployments that redesign and reconfigure processes to improve efficiency of heat integration and CO2 capture (e.g., oxy-fuel combustion) could reduce CO2 capture costs.
Finding 10-6: Hydrogen transport to support CO2 utilization—Given the unique hazard profile of hydrogen, further research and development is needed before pressurized pipelines could play a major role as part of the hydrogen transport infrastructure for making chemicals, direct use as a fuel, or use as a CO2 utilization feedstock. If such pipelines are developed, they could supply hydrogen to CO2 utilization facilities. Examples of such planned dual purpose hydrogen pipeline transport infrastructure have already been approved in Europe.
Recommendation 10-4: Support flexible offtake agreements for hydrogen to facilitate CO2 utilization—Congress should direct the Department of Transportation and Department of Energy to develop policies and regulations that would support flexible hydrogen pipeline offtake agreements to facilitate CO2 utilization where co-location with hydrogen generation is impractical, thus avoiding the need to build dedicated hydrogen transport infrastructure for distributed CO2 utilization.
Finding 10-7: Development of transportation infrastructure may limit the scale up of CO2 utilization—Transportation infrastructure—for CO2, hydrogen, CO2-derived products, and other enabling inputs—may be the limiting factor in the scale up of the CO2 utilization industry and consequently impact siting opportunities for CO2 capture and utilization facilities. In particular, in the event of limited build-out of CO2 pipelines, given cost, environmental, and safety considerations, opportunities for CO2 utilization that do not require significant CO2 transport infrastructure, such as distributed, onsite conversion of captured CO2, would be favored.
Finding 10-8: Partnerships and coordination to accelerate build-out of CO2 infrastructure—Establishing public–private partnerships could accelerate the build-out of a shared regional or national CO2 transportation infrastructure network as a public good to achieve economies of scale for CO2 capture, utilization, and storage. Close communication and coordination between developers of CO2 capture, transport, utilization, and storage projects is necessary to develop such a regional- or national-scale network because of different costs, risks, and technical requirements across the value chain.
Finding 10-9: Modeling and experimentation needs to improve CO2 pipeline safety—Relatively accurate computer simulations are already available for modeling the dispersion behavior of CO2 following accidental releases. However, in the case of failure of buried CO2 pipelines resulting in the formation of a crater owing to the high-momentum jet, more research is needed to model the subsequent dispersion behavior of the CO2 plume exiting the crater. Preliminary evidence suggests that in such cases, the minimum safety distance is increased. A further issue related to CO2 pipeline safety is the risk of propagating ductile and brittle fractures. Here rigorous mathematical models validated using realistic-scale test facilities are needed to determine pipeline susceptibility to such types of failure and hence enable the selection of pipeline materials with sufficient mechanical strength to avoid them.
Recommendation 10-5: Fund research on modeling and testing aimed at improving CO2 pipeline safety—The Pipeline and Hazardous Materials Safety Administration should collaborate with national laboratories, university researchers, industry, and international partners to co-fund and implement research to develop rigorous mathematical models, which in turn should be extensively validated using realistic-scale experiments, to
- Simulate the fluid/structure interaction and subsequent atmospheric dispersion of the escaping overground CO2 plume following accidental rupture of buried CO2 pipelines that results in the formation of a crater owing to the high-momentum jet impingement in order to determine minimum safe distances to populated areas and emergency response planning.
- Understand and mitigate issues with propagating brittle and ductile fractures in CO2 pipelines, as described in detail in Recommendation 4.3 of the committee’s first report, in order to select pipeline materials capable of resisting such types of failures.
- Implement the validated mathematical models developed in (a) and (b) into robust and easy-to-use computer programs to be routinely used as a design and decision-making tool for pipeline developers in order to reduce and mitigate the risks associated with pipeline failures to as low as reasonably practicable.
Finding 10-10: Use of fossil CO2 for short-lived products in the near, mid-, and long term—Production of short-lived products from fossil CO2 rather than direct air capture (DAC) CO2 could provide greater emissions reductions per dollar investment during the near- to mid-term decarbonization transition (i.e., a lower levelized cost of CO2 abatement). However, in a net-zero future, short-lived products like fuels will need to be produced from biogenic, DAC, or direct ocean capture CO2 sources. Current science, policy, and public opinion favor use of nonfossil CO2 for products in which CO2 is not permanently sequestered, placing investment risk on the development of a CO2-to-fuels plant using fossil point source CO2.
Recommendation 10-6: Establish durable policies to facilitate long-term decisions by industry—To facilitate long-term investment decisions by industry that are aligned with net-zero goals and that avoid stranded assets, Congress should establish clear, durable policies and direct federal agencies to develop metrics for the use of different CO2 sources in the production of short- and long-lived products, the incentives available for enabling technologies like clean electricity and clean hydrogen, and the methodologies used to determine compliance with regulations and incentives.
10.5.2 Research Agenda for CO2 Utilization Infrastructure
Table 10-5 presents the committee’s research agenda for CO2 utilization infrastructure, including research needs (numbered by chapter), and related research agenda recommendations (a subset of research-related recommendations from the chapter). The table includes the relevant funding agencies or other actors; whether the need is for basic research, applied research, technology demonstration, or enabling technologies and processes for CO2 utilization; the research theme(s) that the research need falls into; the relevant research area and product class covered by the research need; whether the relevant product(s) are long- or short-lived; and the source of the research need (chapter section, finding, or recommendation). The committee’s full research agenda can be found in Chapter 11.
TABLE 10-5 Research Agenda for CO2 Utilization Infrastructure
| Research, Development, and Demonstration Need | Funding Agencies or Other Actors | Basic, Applied, Demonstration, or Enabling | Research Area | Product Class | Long- or Short-Lived | Research Theme | Source |
|---|---|---|---|---|---|---|---|
| 10-A. Development of robust computational tools for optimal multimodal transportation of CO2 captured from stranded emitters for centralized utilization. | DOE-FECM | Enabling | Infrastructure | All | Long-lived Short-lived | Enabling technology and infrastructure needs Computational modeling and machine learning | Rec. 10-2 |
| 10-B. Techno-economic assessment of centralized versus distributed/onsite utilization of CO2 for small- to medium-scale emitters. | Small- to medium-scale emitters | Enabling | Infrastructure | All | Long-lived Short-lived | Enabling technology and infrastructure needs | Rec. 10-2 |
| Recommendation 10-2: Evaluate CO2 capture and utilization for small- to medium-scale emitters—Small- to medium-scale emitters that cannot eliminate emissions through energy efficiency, electrification, and other decarbonization strategies should evaluate the economic feasibility of performing CO2 capture and utilization on site. This may involve deploying renewable electricity generation, clean hydrogen production, modular carbon capture technologies, and utilization processes suited to small-scale conversion. In cases where this is not possible, taking account of their emissions rates and geographical location, such emitters should seek multimodal transport solutions for the CO2 and, if relevant, CO2-derived product, striking a balance between cost, safety, and environmental impacts using established methodologies that also have been proposed for hydrogen delivery infrastructure development. Additionally, as recommended in this committee’s first report (Recommendation 4.2), the Department of Energy should develop dedicated methodologies for optimizing multimodal CO2 transport to assist in these infrastructure planning efforts. | |||||||
| 10-C. Better understanding and development of approaches to mitigate issues with propagating brittle and ductile fractures in CO2 pipelines. | PHMSA National laboratories University researchers Industry | Enabling | Infrastructure | All | Long-lived Short-lived | Enabling technology and infrastructure needs | Rec 10-5 |
| 10-D. CO2 dispersion modeling calculations for the case of accidental rupture of buried CO2 pipelines that results in formation of a crater owing to the high-momentum CO2 jet. | PHMSA National laboratories University researchers Industry | Enabling | Infrastructure | All | Long-lived Short-lived | Enabling technology and infrastructure needs Computational modeling and machine learning | Rec 10-5 |
| 10-E. Computer programs that implement validated mathematical models on dispersion modeling and propagating fractures to serve as decision-making tools for pipeline developers. | PHMSA National laboratories University researchers Industry | Enabling | Infrastructure | All | Long-lived Short-lived | Enabling technology and infrastructure needs | Rec 10-5 |
Recommendation 10-5: Fund research on modeling and testing aimed at improving CO2 pipeline safety—The Pipeline and Hazardous Materials Safety Administration should collaborate with national laboratories, university researchers, industry, and international partners to co-fund and implement research to develop rigorous mathematical models, which in turn should be extensively validated using realistic-scale experiments, to
| |||||||
NOTE: FECM = Office of Fossil Energy and Carbon Management; PHMSA = Pipeline and Hazardous Materials Safety Administration.
10.6 REFERENCES
1PointFive. 2023a. “1PointFive Announces Plan to Develop a Carbon Capture and Sequestration Hub in Southeast Texas.” Oxy. https://www.oxy.com/news/news-releases/1pointfive-announces-plan-to-develop-a-carbon-capture-and-sequestration-hub-in-southeast-texas.
1PointFive. 2023b. “Stratos.” 1PointFive. https://www.1pointfive.com/ector-county-tx.
Abramson, E., D. McFarlane, and J. Brown. 2020. “Transport Infrastructure for Carbon Capture and Storage.” Minneapolis, MN: Great Plains Institute. https://betterenergy.org/wp-content/uploads/2020/06/GPI_RegionalCO2Whitepaper.pdf.
Abramson, E., E. Thomley, and D. McFarlane. 2022. “An Atlas of Carbon and Hydrogen Hubs for United States Decarbonization.” Minneapolis, MN: Great Plains Institute. https://scripts.betterenergy.org/CarbonCaptureReady/GPI_Carbon_and_Hydrogen_Hubs_Atlas.pdf.
Abramson, E., D. McFarlane, A. Jordan, D. Rodriguez, J. Ogland-Hand, N. Holwerda, M. Fry, R. Kammer, and E. Thomley. 2023. “An Atlas of Direct Air Capture Opportunities for Negative Emissions in the United States.” Carbon Solutions LLC and Great Plains Institute. https://carboncaptureready.betterenergy.org/wp-content/uploads/2023/03/DAC-Hubs-Atlas-2023.pdf.
Adolf, J., W. Warnecke, C. Balzer, X. Fu, G. Hagenow, Y. Hemberger, A. Janssen, M. Klokkenburg, A. Made, and T. McKnight. 2018. “The Road to Sustainable Fuels for Zero-Emissions Mobility. Status of and Perspectives for Power-to-Liquids (PTL) Fuels.” Presented at the 39th International Vienna Motor Symposium.
Adolf, J., W. Warnecke, P. Karzel, A. Kolbeck, A. Made, J. Müller-Belau, J. Powell, et al. 2020. “On Route to CO2-Free Fuels. Hydrogen-Latest Developments in Its Supply Chain and Applications in Transport.” Presented at 41st Vienna Motor Symposium. https://doi.org/10.13140/RG.2.2.21744.58889.
Ahmed, T. 2023. “North Dakota Landowners at Odds in Carbon Pipeline Plans.” AP News, January 27. https://apnews.com/article/business-north-dakota-climate-and-environment-5db9f9e49f3a68687b5ecb78c1900c0f.
Airgas. 2018. “Safety Data Sheet: Carbon Dioxide.” https://www.airgas.com/msds/001013.pdf.
Anchondo, C. 2023. “CO2 Pipeline Company Delays Major Midwest Project.” Energywire, October 19. https://subscriber.politicopro.com/article/eenews/2023/10/19/co2-pipeline-company-delays-major-midwest-project-00122318.
API (American Petroleum Institute). 2021. “Where Are the Pipelines?” American Petroleum Institute. https://www.api.org/oil-and-natural-gas/wells-to-consumer/transporting-oil-natural-gas/pipeline/where-are-the-pipelines.
ARPA-E (Advanced Research Projects Agency–Energy). 2023. “Grid-Free Renewable Energy Enabling New Ways to Economical Liquids and Long-Term Storage.” ARPA-E, December 12. https://arpa-e.energy.gov/technologies/programs/greenwells.
Azarpour, A., and S. Zendehboudi. 2023. “Hybrid Smart Strategies to Predict Amine Thermal Degradation in Industrial CO2 Capture Processes.” ACS Omega 8(30):26850–26870. https://doi.org/10.1021/acsomega.3c01475.
Bayer, P., and M. Aklin. 2020. “The European Union Emissions Trading System Reduced CO2 Emissions Despite Low Prices.” Proceedings of the National Academy of Sciences 117(16):8804–8812.
Beck, L. 2020. “The US Section of 45Q Tax Credit for Carbon Oxide Sequestration: An Update.” Brief. Global CCS Institute. https://www.globalccsinstitute.com/wp-content/uploads/2020/04/45Q_Brief_in_template_LLB.pdf.
Bennett, J., R. Kammer, J. Eidbo, M. Ford, S. Henao, N. Holwerda, E. Middleton, et al. 2023. “Carbon Capture Co-Benefits.” Great Plains Institute. https://carboncaptureready.betterenergy.org/wp-content/uploads/2023/08/Carbon-Capture-CoBenefits.pdf.
Bertagni, M.B., S.W. Pacala, F. Paulot, and A. Porporato. 2022. “Risk of the Hydrogen Economy for Atmospheric Methane.” Nature Communications 13(1):7706. https://doi.org/10.1038/s41467-022-35419-7.
Bevrani, B., R. Burdett, A. Bhaskar, and P.K.D.V. Yarlagadda. 2020. “A Multi-Criteria Multi-Commodity Flow Model for Analysing Transportation Networks.” Operations Research Perspectives 7(January 1):100159. https://doi.org/10.1016/j.orp.2020.100159.
Budinis, S., and L.Lo Re. 2023. “Unlocking the Potential of Direct Air Capture: Is Scaling Up Through Carbon Markets Possible?” IEA, May 11. https://www.iea.org/commentaries/unlocking-the-potential-of-direct-air-capture-is-scaling-up-through-carbon-markets-possible.
C4U Project. 2020. “The C4U Project: Advanced Carbon Capture for Steel Industries Integrated in CCUS Clusters.” C4U. https://c4u-project.eu.
Cai, X., M.A. Coletti, D.S. Sholl, and M.R. Allen-Dumas. 2024. “Assessing Impacts of Atmospheric Conditions on Efficiency and Siting of Large-Scale Direct Air Capture Facilities.” JACS Au 4(5):1883–1891. https://doi.org/10.1021/jacsau.4c00082.
CapturePoint. 2024. “Our Projects.” CapturePoint. https://www.capturepointllc.com/projects.
Carbon Capture Coalition. 2023. “PHMSA/Pipeline Safety Fact Sheet.” https://carboncapturecoalition.org/wp-content/uploads/2023/11/Pipeline-Safety-Fact-Sheet.pdf.
CarbonCapture Inc. 2023. “Project Bison.” https://www.carboncapture.com/project-bison.
Carbonvert and Castex. 2023. “Carbonvert, Castex Joint Venture Executes Operating Agreement for Offshore Carbon Storage Hub in Louisiana.” Businesswire, September 19. https://www.businesswire.com/news/home/20230919740569/en/Carbonvert-Castex-Joint-Venture-Executes-Operating-Agreement-for-Offshore-Carbon-Storage-Hub-in-Louisiana.
CATF (Clean Air Task Force). 2023. “US Carbon Capture Activity and Project Map.” https://www.catf.us/ccsmapus.
Cerniauskas, S., A.J. Chavez Junco, T. Grube, M. Robinius, and D. Stolten. 2020. “Options of Natural Gas Pipeline Reassignment for Hydrogen: Cost Assessment for a Germany Case Study.” International Journal of Hydrogen Energy 45(21):12095–12107. https://doi.org/10.1016/j.ijhydene.2020.02.121.
CETI (Clean Energy Transition Institute). 2023. “Net-Zero Northwest: Technical and Economic Pathways to 2050.” Net-Zero Northwest. https://www.nznw.org.
Chemnick, J. 2023. “The Carbon Removal Project That Puts Communities in the Driver’s Seat.” E&E News: Climatewire. October 26. https://www.eenews.net/articles/the-carbon-removal-project-that-puts-communities-in-the-drivers-seat.
Christol, C., F. Oteri, and M. Laurienti. 2021. “Land-Based Wind Energy Siting: A Foundational and Technical Resource.” NREL/TP-5000-78591; DOE/GO-102021-5608. National Renewable Energy Laboratory (NREL), Golden, CO.
Climate Justice Alliance. 2019. “Just Transition Principles.” Berkeley, CA: Climate Justice Alliance. https://climatejusticealliance.org/wp-content/uploads/2019/11/CJA_JustTransition_highres.pdf.
Clune, R., L. Corb, W. Glazener, K. Henderson, D. Pinner, and D. Walter. 2022. “Navigating America’s Net-Zero Frontier: A Guide for Business Leaders.” McKinsey Sustainability, May 5. https://www.mckinsey.com/capabilities/sustainability/our-insights/navigating-americas-net-zero-frontier-a-guide-for-business-leaders.
CO2 Gas Company. 2017. “What Is Liquid CO2 and What Can It Be Useful for?” https://co2gas.co.uk/what-is-liquid-co2.
CO2 Value Europe. n.d. “North CCU Hub.” CO2 Value Europe. https://database.co2value.eu/projects/218.
Crake, A., K.C. Christoforidis, A. Kafizas, S. Zafeiratos, and C. Petit. 2017. “CO2 Capture and Photocatalytic Reduction Using Bifunctional TiO2/MOF Nanocomposites under UV–Vis Irradiation.” Applied Catalysis B: Environmental 210:131–140. https://doi.org/10.1016/j.apcatb.2017.03.039.
Dakota Gasification Company. 2023. “In the Matter of a Hearing Called on a Motion of the Commission to Consider the Application of Dakota Gasification Company Requesting Consideration for the Geologic Storage of Carbon Dioxide from the Great Plains Synfuels Plant Located in Sections 5, 6, 7, 8, 17, 18, 19, Township 145 North, Range 87 West, Sections 1, 2, 3, 4, 9, 10, 11, 12, 13, 14, 15, 16, 22, 23, 24, Township 145 North, Range 88 West, Sections 30, 31, 32, Township 146 North, Range 87 West, Sections 25, 26, 27, 33, 34, 35, 36, Township 146 North, Range 88 West, Mercer County, North Dakota Pursuant to North Dakota Administrative Code Section 43-05-01.” Industrial Commission of the State of North Dakota, Case No. 29450, Order No. 32250. https://www.dmr.nd.gov/dmr/sites/www/files/documents/Oil%20and%20Gas/Class%20VI/DGC/C29450.pdf.
Dakota Institute. 2023. “Economic Impacts of CO2 Pipelines in South Dakota.” Sioux Falls, SD: Dakota Institute. https://smartcarbonnetwork.com/wp-content/uploads/2023/05/Economic-Impacts-of-CO2-Pipelines-Final-Report1.pdf.
d’Amore, F., P. Mocellin, C. Vianello, G. Maschio, and F. Bezzo. 2018. “Economic Optimisation of European Supply Chains for CO2 Capture, Transport and Sequestration, Including Societal Risk Analysis and Risk Mitigation Measures.” Applied Energy 223:401–415. https://doi.org/10.1016/j.apenergy.2018.04.043.
Datta, A., R. De Leon, and R. Krishnamoorti. 2020. “Advancing Carbon Management Through the Global Commoditization of CO2: The Case for Dual-Use LNG-CO2 Shipping.” Carbon Management 11(6):611–630. https://doi.org/10.1080/17583004.2020.1840871.
DCC West Project LLC. 2023. “In the Matter of a Hearing Called on a Motion of the Commission to Consider the Application of DCC West Project LLC Requesting Consideration for the Geologic Storage of Carbon Dioxide in the Broom Creek Formation from the Milton R. Young Station and Other Sources Location in Sections 2, 3, 4, 5, 6, 7, 8, 9, 10, 11, 14, 15, 16, 17, 18, 19, 20, 21, 29, 30, 31, and 32, Township 141 North, Range 84 West, Section 1, 2, 3, 4, 9, 10, 11, 12, 13, 14, 15, 16, 22, 23, 24, 25, 26, 27, and 36, Township 141 North, Range 85 West, Sections 19, 20, 21, 28, 29, 30, 31, 32, 33, and 34, Township 142 North, Range 84 West, and Sections 24, 25, 33, 34, 35, and 36, Township 142 North, Range 85 West, Oliver County, North Dakota, Pursuant to North Dakota Administrative Code Chapter 43-05-01.” Industrial Commission of the State of North Dakota, Case No. 30122. Order No. 32806. https://www.dmr.nd.gov/dmr/sites/www/files/documents/Oil%20and%20Gas/Class%20VI/DCC%20West/C30122.pdf.
De Luna, P., L. Di Fiori, Y. Li, A. Nojek, and B. Stackhouse. 2023. “The World Needs to Capture, Use, and Store Gigatons of CO2: Where and How?” McKinsey & Company, April 5. https://www.mckinsey.com/industries/oil-and-gas/our-insights/the-world-needs-to-capture-use-and-store-gigatons-of-co2-where-and-how.
Decarb America Research Initiative. 2021. “Interactive Maps: Energy Infrastructure Needs for a Net-Zero Economy.” Decarb America. https://decarbamerica.org/interactive-maps.
Department of Labor. 1974. Occupational Safety and Health Standards, 1910 Subpart H Hazardous Materials. https://www.osha.gov/lawsregs/regulations/standardnumber/1910/1910.101.
Doctor, R., A. Palmer, D. Coleman, J. Davison, C. Hendriks, O. Kaarstad, M. Ozaki, and M. Austell. 2005. “4—Transport of CO2.” In IPCC Special Report on Carbon Dioxide Capture and Storage. Cambridge, UK: Cambridge University Press. https://www.ipcc.ch/site/assets/uploads/2018/03/srccs_chapter4-1.pdf.
DOE (Department of Energy). 2022a. “DOE Establishes Bipartisan Infrastructure Law’s $9.5 Billion Clean Hydrogen Initiatives.” Energy.gov, February 15. https://www.energy.gov/articles/doe-establishes-bipartisan-infrastructure-laws-95billion-clean-hydrogen-initiatives.
DOE. 2022b. “Industrial Decarbonization Roadmap.” DOE/EE-2635. Washington, DC: Department of Energy. https://www.energy.gov/sites/default/files/2022-09/Industrial%20Decarbonization%20Roadmap.pdf.
DOE. 2023a. “Pathways to Commercial Liftoff: Carbon Management.” Washington, DC: Department of Energy. https://liftoff.energy.gov/wp-content/uploads/2023/04/20230424-Liftoff-Carbon-Management-vPUB_update.pdf.
DOE. 2023b. “Pathways to Commercial Liftoff: Clean Hydrogen.” Washington, DC: Department of Energy. https://liftoff.energy.gov/wp-content/uploads/2023/05/20230523-Pathways-to-Commercial-Liftoff-Clean-Hydrogen.pdf.
DOE. 2023c. “U.S. Department of Energy Clean Hydrogen Production Standard (CHPS) Guidance.” Washington, DC: Department of Energy. https://www.hydrogen.energy.gov/docs/hydrogenprogramlibraries/pdfs/clean-hydrogen-productionstandard-guidance.pdf.
DOE. 2023d. “U.S. National Clean Hydrogen Strategy and Roadmap.” Washington, DC: Department of Energy. https://www.hydrogen.energy.gov/docs/hydrogenprogramlibraries/pdfs/us-national-clean-hydrogen-strategy-roadmap.pdf.
DOE-FECM (Office of Fossil Energy and Carbon Management). 2023a. “Project Selections for FOA 2735: Regional Direct Air Capture Hubs—Topic Area 1 (Feasibility) and Topic Area 2 (Design).” https://www.energy.gov/fecm/project-selections-foa-2735-regional-direct-air-capture-hubs-topic-area-1-feasibility-and.
DOE-FECM. 2023b. “Workshop on Applied Research for CO2 Transport.” Washington, DC: Department of Energy. https://www.energy.gov/sites/default/files/2023-08/Workshop-on-Applied-Research-for-CO2-Transport-Summary-Report-2023_0.pdf.
DOE-HFTO (Hydrogen and Fuel Cell Technologies Office). n.d. “Hydrogen Pipelines.” https://www.energy.gov/eere/fuelcells/hydrogen-pipelines.
DOE-OCED (Office of Clean Energy Demonstrations). 2023a. “Biden-Harris Administration Announces $7 Billion for America’s First Clean Hydrogen Hubs, Driving Clean Manufacturing and Delivering New Economic Opportunities Nationwide.” Energy.gov, October 13. https://www.energy.gov/articles/biden-harris-administration-announces-7-billion-americas-first-clean-hydrogen-hubs-driving?utm_medium=email&utm_source=govdelivery.
DOE-OCED. 2023b. “Biden-Harris Administration Announces Up to $1.2 Billion for Nation’s First Direct Air Capture Demonstrations in Texas and Louisiana.” Energy.gov, August 11. https://www.energy.gov/articles/biden-harris-administration-announces-12-billion-nations-first-direct-air-capture.
DOE-OCED. n.d.(a). “Regional Clean Hydrogen Hubs Selections for Award Negotiations.” https://www.energy.gov/oced/regional-clean-hydrogen-hubs-selections-award-negotiations.
DOE-OCED. n.d.(b). “Regional Direct Air Capture Hubs Selections for Award Negotiations.” https://www.energy.gov/oced/regional-direct-air-capture-hubs-selections-award-negotiations.
Douglas, L. 2023. “Navigator CO2 Ventures Cancels Carbon-Capture Pipeline Project in U.S. Midwest.” Reuters, October 20. https://www.reuters.com/sustainability/climate-energy/navigator-co2-ventures-cancels-carbon-capture-pipeline-project-us-midwest-2023-10-20.
Dura, J. 2023a. “North Dakota Panel Will Reconsider Denying Permit for Summit CO2 Pipeline.” AP News, September 15. https://apnews.com/article/north-dakota-midwest-co2-pipeline-summit-carbon-dioxide-13c4c1524f96e8fbf52d0dcd6ab4abd0.
Dura, J. 2023b. “North Dakota Regulators Deny Siting Permit for Summit Carbon Dioxide Pipeline; Company Will Reapply.” AP News, August 4. https://apnews.com/article/north-dakota-carbon-dioxide-pipeline-29d15d0d29782f9f28b7907b6bb1896e.
Dura, J., and S. Karnowski. 2023. “CO2 Pipeline Project Denied Key Permit in South Dakota; Another Seeks Second Chance in North Dakota.” AP News, September 6. https://apnews.com/article/south-dakota-carbon-dioxide-pipeline-665a20269d43d4aff5944969f869bb03.
Earthjustice and Clean Energy Program. 2023. “Carbon Capture: The Fossil Fuel Industry’s False Climate Solution.” Earthjustice. https://earthjustice.org/article/carbon-capture-the-fossil-fuel-industrys-false-climate-solution.
EFI Foundation and Horizon Climate Group. 2023. “A New U.S. Industrial Backbone: Exploring Regional CCUS Hubs for Small-to-Midsize Industrial Emitters.” Washington, DC: EFI Foundation and Horizon Climate Group. https://efifoundation.org/wp-content/uploads/sites/3/2023/12/CCUS-Hubs-FINAL-12142023-WITH-COVER-1.pdf.
EIA (U.S. Energy Information Administration). 2023a. “Electric Power Annual 2022.” Washington, DC: U.S. Energy Information Administration. https://www.eia.gov/electricity/annual/pdf/epa.pdf.
EIA. 2023b. “Gulf of Mexico Fact Sheet.” U.S. Energy Information Administration. https://www.eia.gov/special/gulf_of_mexico/#gulf_coast_refinery.
EIA. 2024. “Natural Gas Explained: Natural Gas Pipelines.” U.S. Energy Information Administration. https://www.eia.gov/energyexplained/natural-gas/natural-gas-pipelines.php.
Element Energy. 2018. “Shipping Carbon Dioxide (CO2): UK Cost Estimation Study.” https://www.gov.uk/government/publications/shipping-carbon-dioxide-co2-uk-cost-estimation-study.
Eller, D. 2023. “Navigator Kills Its $3.5B Carbon Capture Pipeline Across Iowa, South Dakota, Other States.” Des Moines Register, October 20, sec. Business. https://www.desmoinesregister.com/story/money/business/2023/10/20/navigator-kills-its-carbon-capture-pipeline-in-iowa-other-states-ethanol-poet/71253882007.
Enbridge. 2022. “A Novel Retrofit Solution for Existing Pipelines.” Enbridge Blog (blog), May 3. https://www.enbridge.com/stories/2022/may/enbridge-invests-in-smartpipe-pipeline-retrofit-enabling-co2-hydrogen-transportation.
Ennis, J., and A. Levin. 2023. “Clean Energy Now for a Safer Climate Future.” New York: Natural Resources Defense Council. https://www.nrdc.org/sites/default/files/2023-04/clean-energy-pathways-net-zero-2050-report.pdf.
EPA (U.S. Environmental Protection Agency). 2000. “Office of Air and Radiation. Carbon Dioxide as a Fire Suppressant: Examining The Risks.” Air and Radiation, U.S. Environmental Protection Agency.
EPA. 2023a. “GHGRP Emissions Ranges.” https://www.epa.gov/ghgreporting/ghgrp-emissions-ranges.
EPA. 2023b. “Table of EPA’s Draft and Final Class VI Well Permits.” https://www.epa.gov/uic/table-epas-draft-and-final-class-vi-well-permits.
Esquivel-Elizondo, S., A. Hormaza Mejia, T. Sun, E. Shrestha, S.P. Hamburg, and I.B. Ocko. 2023. “Wide Range in Estimates of Hydrogen Emissions from Infrastructure.” Frontiers in Energy Research 11. https://www.frontiersin.org/articles/10.3389/fenrg.2023.1207208.
Etxeberria-Benavides, M., O. David, T. Johnson, M.M. Łozińska, A. Orsi, P.A. Wright, S. Mastel, R. Hillenbrand, F. Kapteijn, and J. Gascon. 2018. “High Performance Mixed Matrix Membranes (MMMs) Composed of ZIF-94 Filler and 6FDA-DAM Polymer.” Journal of Membrane Science 550(March 15):198–207. https://doi.org/10.1016/j.memsci.2017.12.033.
European Commission. 2023. “COMMISSION DELEGATED REGULATION (EU) 2023/1185 of 10 February 2023 Supplementing Directive (EU) 2018/2001 of the European Parliament and of the Council by Establishing a Minimum Threshold for Greenhouse Gas Emissions Savings of Recycled Carbon Fuels and by Specifying a Methodology for Assessing Greenhouse Gas Emissions Savings from Renewable Liquid and Gaseous Transport Fuels of Non-Biological Origin and from Recycled Carbon Fuels.” Commission Delegated Regulation (EU) 2023/1185. Brussels, Belgium: European Commission, February 10. https://eur-lex.europa.eu/eli/reg_del/2023/1185/oj.
European Commission. n.d. “Horizon Europe.” European Commission: Research and Innovation. https://research-and-innovation.ec.europa.eu/funding/funding-opportunities/funding-programmes-and-open-calls/horizon-europe_en.
Flø, N.E., L. Faramarzi, T. de Cazenove, O.A. Hvidsten, A. Kolstad Morken, E. Steinseth Hamborg, K. Vernstad, et al. 2017. “Results from MEA Degradation and Reclaiming Processes at the CO2 Technology Centre Mongstad.” 13th International Conference on Greenhouse Gas Control Technologies, GHGT-13, 14–18 November 2016, Lausanne, Switzerland 114(July 1):1307–1324. https://doi.org/10.1016/j.egypro.2017.03.1899.
Fluxys Belgium. 2022. “Information Memorandum for CO2 Infrastructure.” Belgium: Fluxys. https://www.fluxys.com/en/about-us/energy-transition/hydrogen-carbon-infrastructure/carbon_preparing-to-build-the-network.
Friedmann, S.J., Z. Fan, Z. Byrum, E. Ochu, A. Bhardwaj, and H. Sheerazi. 2020. “Levelized Cost of Carbon Abatement: An Improved Cost-Assessment Methodology for a Net-Zero Emissions World.” New York: Columbia University Center on Global Energy Policy. https://www.eesi.org/files/Levelized_Cost_of_Carbon_Abatement.pdf.
Frontier Carbon Solutions LLC. 2022. “Underground Injection Control Carbon Sequestration Class VI Permit Application Sweetwater Carbon Storage Hub.” https://drive.google.com/file/d/10f7cqI85wYpOg6Q6HmSw72qYiEObtDjI/view.
FSIS Environmental Safety and Health Group. 2020. “Carbon Dioxide Health Hazard Information Sheet.” https://fsis.usda.gov/sites/default/files/media_file/2020-08/Carbon-Dioxide.pdf.
FuelCell Energy. 2023. “Carbonate Fuel Cell Power Plants.” https://www.fuelcellenergy.com/platform/fuel-cell-power-plants.
Gabrielli, P., L. Rosa, M. Gazzani, R. Meys, A. Bardow, M. Mazzotti, and G. Sansavini. 2023. “Net-Zero Emissions Chemical Industry in a World of Limited Resources.” One Earth 6(6):682–704. https://doi.org/10.1016/j.oneear.2023.05.006.
GAO (U.S. Government Accountability Office). 2022. “Status, Challenges, and Policy Options for Carbon Capture, Utilization, and Storage.” Technology Assessment. Washington, DC: U.S. Government Accountability Office. https://www.gao.gov/assets/730/723198.pdf.
Global Thermostat. 2023. “This Is What Confronting Climate Change Looks Like!” Global Thermostat, April 14. https://www.globalthermostat.com/news-and-updates/this-is-what-confronting-climate-change-looks-like.
Gordon, J.A., N. Balta-Ozkan, and S.A. Nabavi. 2023. “Price Promises, Trust Deficits and Energy Justice: Public Perceptions of Hydrogen Homes.” Renewable and Sustainable Energy Reviews 188:113810.
Hammel, P. 2024. “Pipeline Company, Environmental Group Strike Unique ‘Community Benefits’ Agreement.” Nebraska Examiner, April 9. https://nebraskaexaminer.com/2024/04/09/pipeline-company-environmental-group-strike-unique-community-benefits-agreement.
Han, X., S. Zhao, X. Cui, and Y. Yan. 2019. “Localization of CO2 Gas Leakages Through Acoustic Emission Multi-Sensor Fusion Based on Wavelet-RBFN Modeling.” Measurement Science and Technology 30(8):085007. https://doi.org/10.1088/1361-6501/ab1025.
Harvestone Group. 2023. “Harvestone: CO2 Injection Commences at Blue Flint Ethanol CCS Project.” Ethanol Producer Magazine. November 6. https://ethanolproducer.com/articles/harvestone-co2-injection-commences-at-blue-flint-ethanol-ccs-project.
Heirloom. 2023. “Heirloom Unveils America’s First Commercial Direct Air Capture Facility.” Heirloom, November 9. https://www.heirloomcarbon.com/news/heirloom-unveils-americas-first-commercial-direct-air-capture-facility.
Hernandez, R.R., S.M. Jordaan, B. Kaldunski, and N. Kumar. 2020. “Aligning Climate Change and Sustainable Development Goals with an Innovation Systems Roadmap for Renewable Power.” Frontiers in Sustainability 1. https://www.frontiersin.org/articles/10.3389/frsus.2020.583090.
Hiar, C. 2023. “What’s Next for Direct Air Capture?” E&E News: Climatewire, October 11. https://www.eenews.net/articles/whats-next-for-direct-air-capture.
Hughes, S., A. Zoelle, M. Woods, S. Henry, S. Homsy, S. Pidaparti, N. Kuehn, et al. 2022. “Cost of Capturing CO2 from Industrial Sources.” DOE/NETL-2022/3319. Pittsburgh, PA: National Energy Technology Laboratory. https://www.netl.doe.gov/projects/files/CostofCapturingCO2fromIndustrialSources_071522.pdf.
Jacobson, M.Z. 2019. “The Health and Climate Impacts of Carbon Capture and Direct Air Capture.” Energy and Environmental Science 12(12):3567–3574. https://doi.org/10.1039/C9EE02709B.
Jenkins, J.D., E.N. Mayfield, J. Farbes, G. Schivley, N. Patankar, and R. Jones. 2023. “Climate Progress and the 117th Congress: The Impacts of the Inflation Reduction Act and Infrastructure Investment and Jobs Act.” Princeton, NJ: Princeton University. https://repeatproject.org/docs/REPEAT_Climate_Progress_and_the_117th_Congress.pdf.
Just Transition Alliance. 2020. “False Solutions to Address Climate Change.” https://jtalliance.org/wp-content/uploads/2020/02/False-Solutions.pdf.
Kammer, R., D. Rodriguez, and D. McFarlane. 2023. “Carbon Capture and Storage Opportunities in the Mid-Atlantic.” Minneapolis, MN: Great Plains Institute. https://carboncaptureready.betterenergy.org/wp-content/uploads/2023/11/Mid-Atlantic-Report.pdf.
Kenton, C., and B. Silton. n.d. “Repurposing Natural Gas Lines: The CO2 Opportunity.” ADL Ventures (blog). https://www.adlventures.com/blogs/repurposing-natural-gas-lines-the-co2-opportunity.
Kim, J., Y. Lee, and I. Moon. 2011. “An Index-Based Risk Assessment Model for Hydrogen Infrastructure.” International Journal of Hydrogen Energy 36(11):6387–6398. https://doi.org/10.1016/j.ijhydene.2011.02.127.
Knoope, M.M.J., W. Guijt, A. Ramírez, and A.P.C. Faaij. 2014. “Improved Cost Models for Optimizing CO2 Pipeline Configuration for Point-to-Point Pipelines and Simple Networks.” International Journal of Greenhouse Gas Control 22(March 1):25–46. https://doi.org/10.1016/j.ijggc.2013.12.016.
Kuprewicz, R.B. 2022. “Safety of Hydrogen Transportation by Gas Pipelines.” Redmond, WA: Accufacts Inc. https://pstrust.org/wp-content/uploads/2022/11/11-28-22-Final-Accufacts-Hydrogen-Pipeline-Report.pdf.
Larsen, J., W. Herndon, M. Grant, and P. Marsters. 2019. “Capturing Leadership: Policies for the US to Advance Direct Air Capture Technology.” New York: Rhodium Group, LLC. https://rhg.com/wp-content/uploads/2019/05/Rhodium_CapturingLeadership_May2019-1.pdf.
Larson, E., C. Greig, J. Jenkins, E. Mayfield, A. Pascale, C. Zhang, J. Drossman, et al. 2021. “Net-Zero America: Potential Pathways, Infrastructure, and Impacts.” Princeton, NJ: Princeton University. https://www.dropbox.com/s/ptp92f65lgds5n2/Princeton%20NZA%20FINAL%20REPORT%20%2829Oct2021%29.pdf?dl=0.
LBNL (Lawrence Berkeley National Laboratory). n.d. “Generation, Storage, and Hybrid Capacity in Interconnection Queues.” https://emp.lbl.gov/generation-storage-and-hybrid-capacity.
Lee, S.-Y., J.-U. Lee, I.-B. Lee, and J. Han. 2017. “Design Under Uncertainty of Carbon Capture and Storage Infrastructure Considering Cost, Environmental Impact, and Preference on Risk.” Applied Energy 189(March 1):725–738. https://doi.org/10.1016/j.apenergy.2016.12.066.
Liu, N. 2021. “Increasing Blue Hydrogen Production Affordability.” Gulf Energy, June 1. https://gulfenergyinfo.com/h2tech/articles/2021/q2-2021/increasing-blue-hydrogen-production-affordability.
LSU (Louisiana State University) Center for Energy Studies. 2023. “The Economic Implications of Carbon Capture and Sequestration for the Gulf Coast Economy.” https://www.lsu.edu/ces/publications/2023/economic-implications-carbon-capture-sequestration-2022-online-updated.pdf.
Magneschi, G., T. Zhang, and R. Munson. 2017. “The Impact of CO2 Capture on Water Requirements of Power Plants.” 13th International Conference on Greenhouse Gas Control Technologies, GHGT-13, 14–18 November 2016, Lausanne, Switzerland 114(July 1):6337–6347. https://doi.org/10.1016/j.egypro.2017.03.1770.
Mahabir, J., N. Samaroo, M. Janardhanan, and K. Ward. 2022. “Pathways to Sustainable Methanol Operations Using Gas-Heated Reforming (GHR) Technologies.” Journal of CO2 Utilization 66(December 1):102302. https://doi.org/10.1016/j.jcou.2022.102302.
Merrill, D. 2021. “The U.S. Will Need a Lot of Land for a Zero-Carbon Economy.” Bloomberg, June 3. https://www.bloomberg.com/graphics/2021-energy-land-use-economy/#xj4y7vzkg.
Milestone Carbon. 2023. “Milestone Carbon Announces Development of Carbon Sequestration Hub in Midland Basin.” Businesswire, September 26. https://www.businesswire.com/news/home/20230926373201/en.
Minnkota Power Cooperative. 2022a. “In the Matter of a Hearing Called on a Motion of the Commission to Consider the Application of Minnkota Power Cooperative, Inc. Requesting Consideration for the Geologic Storage of Carbon Dioxide in the Broom Creek Formation from the Milton R. Young Station Location in Sections 35 and 36, T.142N, R.84W, Sections 19, 20, 21, 22, 26, 27, 28, 29, 30, 31, 32, 33, 34, and 35, T.142N, R.83W, Sections 1, 2, 12, and 13, T.141N, R.84W, Sections 1, 2, 3, 4, 5, 6, 7, 8, 9, 10, 11, 12, 14, 15, 16, 17, 18, 19, 20, and 21, T.141N, R.83W, Oliver County, ND Pursuant to NDAC Section 43-05-01.” Industrial Commission of the State of North Dakota, Case No. 29029, Order No. 31583. October 14. https://www.dmr.nd.gov/dmr/sites/www/files/documents/Oil%20and%20Gas/Class%20VI/Minnkota/BC/C29029.pdf.
Minnkota Power Cooperative. 2022b. “In the Matter of a Hearing Called on a Motion of the Commission to Consider the Application of Minnkota Power Cooperative, Inc. Requesting Consideration for the Geologic Storage of Carbon Dioxide in the Deadwood Formation from the Milton R. Young Station Located in Sections 35 and 36, T.142N, R.84W, Sections 19, 20, 21, 22, 26, 27, 28, 29, 30, 31, 32, 33, 34, and 35, T.142N, R.83W, Sections 1, 2, 12, and 13, T.141N, R.84W, Sections 1, 2, 3, 4, 5, 6, 7, 8, 9, 10, 11, 12, 14, 15, 16, 17, 18, 19, 20 and 21, T.141N, R.83W, Oliver County, ND Pursuant to NDAC Section 43-05-01.” Industrial Commission of the State of North Dakota, Case No. 29032, Order No. 31586. October 14. https://www.dmr.nd.gov/dmr/sites/www/files/documents/Oil%20and%20Gas/Class%20VI/Minnkota/DW/C29032.pdf.
Moniz, E.J., J.D. Brown, S.D. Comello, M. Jeong, M. Downey, and M.I. Cohen. 2023. “Turning CCS Projects in Heavy Industry and Power into Blue Chip Financial Investments.” Energy Future Initiative. https://efifoundation.org/wp-content/uploads/sites/3/2023/02/20230212-CCS-Final_Full-copy.pdf.
Morken, A.K., B. Nenseter, S. Pedersen, M. Chhaganlal, J.K. Feste, R. Bøe Tyborgnes, Ø. Ullestad, et al. 2014. “Emission Results of Amine Plant Operations from MEA Testing at the CO2 Technology Centre Mongstad.” 12th International Conference on Greenhouse Gas Control Technologies, GHGT-12 63(January 1):6023–6038. https://doi.org/10.1016/j.egypro.2014.11.636.
Morken, A.K., S. Pedersen, E.R. Kleppe, A. Wisthaler, K. Vernstad, Ø. Ullestad, N. Enaasen Flø, L. Faramarzi, and E. Steinseth Hamborg. 2017. “Degradation and Emission Results of Amine Plant Operations from MEA Testing at the CO2 Technology Centre Mongstad.” 13th International Conference on Greenhouse Gas Control Technologies, GHGT-13, 14–18 November 2016, Lausanne, Switzerland 114(July 1):1245–1262. https://doi.org/10.1016/j.egypro.2017.03.1379.
Murugan, A., S. Bartlett, J. Hesketh, H. Becker, and G. Hinds. 2019. “Project Closure Report: Hydrogen Odorant and Leak Detection Part 1, Hydrogen Odorant.” United Kingdom: Scotland Gas Networks. https://sgn.co.uk/sites/default/files/media-entities/documents/2020-09/Hydrogen_Odorant_and_Leak_Detection_Project_Closure_Report_SGN.pdf.
NASEM (National Academies of Sciences, Engineering, and Medicine). 2019. Negative Emissions Technologies and Reliable Sequestration: A Research Agenda. Washington, DC: The National Academies Press. https://doi.org/10.17226/25259.
NASEM. 2023a. Carbon Dioxide Utilization Markets and Infrastructure: Status and Opportunities: A First Report. Washington, DC: The National Academies Press. https://doi.org/10.17226/26703.
NASEM. 2023b. Laying the Foundation for New and Advanced Nuclear Reactors in the United States. Washington, DC: The National Academies Press. https://doi.org/10.17226/26630.
NASEM. 2024. Accelerating Decarbonization in the United States: Technology, Policy, and Societal Dimensions. Washington, DC: The National Academies Press. https://doi.org/10.17226/25931.
Navigator Heartland Greenway LLC. 2021. “Heartland Greenway: A Navigator CO2 Ventures LLC Project.” Iowa Utilities Board, HLP-2021-0003. https://wcc.efs.iowa.gov/cs/idcplg?IdcService=GET_FILE&allowInterrupt=1&RevisionSelectionMethod=latest&dDocName=2076639&noSaveAs=1.
New Energy Economy. n.d. “Opposing False Solutions.” New Energy Economy. https://www.newenergyeconomy.org/opposing-false-solutions.
Northern Gas Networks. 2016. “H21 Leeds City Gate.” United Kingdom: Northern Gas Networks. https://www.northerngasnetworks.co.uk/wp-content/uploads/2017/04/H21-Executive-Summary-Interactive-PDF-July-2016-V2.pdf.
NPC (National Petroleum Council). 2019. “Meeting the Dual Challenge: A Roadmap to At-Scale Deployment of Carbon Capture, Use, and Storage.” National Petroleum Council. https://dualchallenge.npc.org/downloads.php.
NPC. 2024. “Chapter 3—LCI Hydrogen—Connecting Infrastructure.” In Harnessing Hydrogen: A Key Element of the U.S. Energy Future. https://harnessinghydrogen.npc.org/files/H2-CH_3-Connecting_Infra-2024-04-23.pdf.
NREL (National Renewable Energy Laboratory). n.d. “RE Data Explorer.” RE Data Explorer. https://data.re-explorer.org.
OCAP (Organic CO2 for Assimilation by Plants). n.d. “Pure CO2 for Greenhouses.” https://www.ocap.nl/nl/images/OCAP_Factsheet_English_tcm978-561158.pdf;%20https://ec.europa.eu/competition/state_aid/cases/270589/270589_1965702_106_2.pdf;%20https://www.youtube.com/watch?v=0rC37N4Bbo4.
Offermann-van Heek, J., K. Arning, A. Linzenich, and M. Ziefle. 2018. “Trust and Distrust in Carbon Capture and Utilization Industry as Relevant Factors for the Acceptance of Carbon-Based Products.” Frontiers in Energy Research 6. https://www.frontiersin.org/articles/10.3389/fenrg.2018.00073.
OGCI (Oil and Gas Climate Initiative). n.d. “Bayou Bend CCS.” The CCUS Hub. https://ccushub.ogci.com/focus_hubs/bayou-bend-ccs.
OSHA (Occupational Safety and Health Administration). 1996. “OSHA Hazard Information Bulletins Potential Carbon Dioxide (CO2) Asphyxiation Hazard When Filling Stationary Low Pressure CO2 Supply Systems.” Department of Labor. https://www.osha.gov/publications/hib19960605.
Ou, Y., W. Shi, S.J. Smith, C.M. Ledna, J.J. West, C.G. Nolte, and D.H. Loughlin. 2018. “Estimating Environmental Co-Benefits of U.S. Low-Carbon Pathways Using an Integrated Assessment Model with State-Level Resolution.” Applied Energy 216(April 15):482–493. https://doi.org/10.1016/j.apenergy.2018.02.122.
Oxy. 2022. “Occidental, 1PointFive to Begin Construction of World’s Largest Direct Air Capture Plant in Texas Permian Basin.” Oxy, August 25. https://www.oxy.com/news/news-releases/occidental-1pointfive-to-begin-construction-of-worlds-largest-direct-air-capture-plant-in-the-texas-permian-basin.
Parfomak, P.W. 2021. “Pipeline Transportation of Hydrogen: Regulation, Research, and Policy.” R46700. Washington, DC: Congressional Research Service. https://www.everycrsreport.com/files/2021-03-02_R46700_294547743ff4516b1d562f7c4dae166186f1833e.pdf.
Parfomak, P.W. 2023. “Carbon Dioxide (CO2) Pipeline Development: Federal Initiatives.” Washington, DC: Congressional Research Service. https://crsreports.congress.gov/product/pdf/IN/IN12169.
Parolin, F., P. Colbertaldo, and S. Campanari. 2022. “Development of a Multi-Modality Hydrogen Delivery Infrastructure: An Optimization Model for Design and Operation.” Energy Conversion and Management 266(August 15):115650. https://doi.org/10.1016/j.enconman.2022.115650.
Peterson, T. 2023. “New Midwest Battles Brew over CO2 Pipelines.” Stateline, June 13. https://stateline.org/2023/06/13/new-midwest-battles-brew-over-co2-pipelines.
Pett-Ridge, J., H.Z. Ammad, A. Aui, M. Ashton, S.E. Baker, B. Basso, M. Bradford, et al. 2023. “Roads to Removal: Options for Carbon Dioxide Removal in the United States.” LLNL-TR-852901. Lawrence Livermore National Laboratory. https://roads2removal.org.
PHMSA (Pipeline and Hazardous Materials Safety Administration). 2022. “Failure Investigation Report—Denbury Gulf Coast Pipelines, LLC—Pipeline Rupture/Natural Force Damage.” Washington, DC: Department of Transportation. https://www.phmsa.dot.gov/sites/phmsa.dot.gov/files/2022-05/Failure%20Investigation%20Report%20-%20Denbury%20Gulf%20Coast%20Pipeline.pdf.
PHMSA. 2023a. “Annual Report Mileage for Hazardous Liquid or Carbon Dioxide Systems.” https://www.phmsa.dot.gov/data-and-statistics/pipeline/annual-report-mileage-hazardous-liquid-or-carbon-dioxide-systems.
PHMSA. 2023b. “Meeting Archive: CO2 Safety Public Meeting 2023.” https://www.onlinevideoservice.com/clients/PHMSA/053123.
Porthos. 2023. “CO2 Reduction Through Storage Under the North Sea.” Porthos: CO2 Transport and Storage. https://www.porthosco2.nl/en.
Ramos, M. 2023. “‘Carbon-Capture’Pipeline PlansAcross Central Illinois Worry Land Owners.” Chicago Sun Times, May 6. https://chicago.suntimes.com/2023/5/6/23709936/carbon-capture-pipeline-central-illinois-navigator-co2-heartland-greenway.
Red Trail Energy LLC. 2022. “Red Trail Energy Begins Carbon Capture and Storage.” Ethanol Producer Magazine, July 17. https://ethanolproducer.com/articles/red-trail-energy-begins-carbon-capture-and-storage-19447.
Romero-Lankao, P., N. Rosner, R.A. Efroymson, E.S. Parisch, L. Blanco, S. Smolinski, and K. Kline. 2023. “Community Engagement and Equity in Renewable Energy Projects: A Literature Review.”
Roussanaly, S., N. Berghout, T. Fout, M. Garcia, S. Gardarsdottir, S.M. Nazir, A. Ramirez, and E.S. Rubin. 2021. “Towards Improved Cost Evaluation of Carbon Capture and Storage from Industry.” International Journal of Greenhouse Gas Control 106(March 1):103263. https://doi.org/10.1016/j.ijggc.2021.103263.
Sand, M., R.B. Skeie, M. Sandstad, S. Krishnan, G. Myhre, H. Bryant, R. Derwent, et al. 2023. “A Multi-Model Assessment of the Global Warming Potential of Hydrogen.” Communications Earth and Environment 4(1):203. https://doi.org/10.1038/s43247-023-00857-8.
Santos, S. 2012. “CO2 Transport via Pipeline and Ship.” Presented at the CCS Opportunities in CCOP Region. September. Indonesia. https://www.ccop.or.th/eppm/projects/42/docs/(4.)%20CO2%20Transport%20-%20Overview%20(IEAGHG).pdf.
Shah, M.I., G. Lombardo, B. Fostås, C. Benquet, A. Kolstad Morken, and T. de Cazenove. 2018. “CO2 Capture from RFCC Flue Gas with 30w% MEA at Technology Centre Mongstad, Process Optimization and Performance Comparison.” Melbourne, Australia. https://dx.doi.org/10.2139/ssrn.3366149.
Sharma, I., D. Friedrich, T. Golden, and S. Brandani. 2019. “Exploring the Opportunities for Carbon Capture in Modular, Small-Scale Steam Methane Reforming: An Energetic Perspective.” International Journal of Hydrogen Energy 44(29):14732–14743. https://doi.org/10.1016/j.ijhydene.2019.04.080.
Soraghan, M. 2023. “Midwest CO2 Pipeline Rush Creates Regulatory Chaos.” E&E News, March 3. https://www.eenews.net/articles/midwest-co2-pipeline-rush-creates-regulatory-chaos.
Spitzenberger, C., and T. Flechas. 2023. “Carbon Dioxide Major Accident Hazards Awareness.” AIChE. https://www.aiche.org/resources/publications/cep/2023/june/carbon-dioxide-major-accident-hazards-awareness.
Stolaroff, J.K., S.H. Pang, W. Li, W.G. Kirkendall, H.M. Goldstein, R.D. Aines, and S.E. Baker. 2021. “Transport Cost for Carbon Removal Projects with Biomass and CO2 Storage.” Frontiers in Energy Research 9. https://www.frontiersin.org/articles/10.3389/fenrg.2021.639943.
Summit Carbon Solutions. 2023. “New Study Shows Summit Carbon Solutions Will Drive Economic Growth Across the Midwest.” https://summitcarbonsolutions.com/driving-economic-growth.
Summit Carbon Solutions. 2024. “Summit Carbon Solutions Announces New Shipper for its Carbon Capture Project.” https://summitcarbonsolutions.com/summit-carbon-solutions-announces-new-shipper-for-its-carbon-capture-project.
Summit Carbon Solutions. n.d.(a). “Project Benefits.” https://summitcarbonsolutions.com/project-benefits.
Summit Carbon Solutions. n.d.(b). “Project Footprint.” https://summitcarbonsolutions.com/project-footprint.
Tallgrass. 2022. “Tallgrass to Develop a Commercial-Scale CO2 Sequestration Hub in Wyoming.” Tallgrass, January 20. https://www.tallgrass.com/newsroom/press-releases/tallgrass-to-develop-a-commercial-scale-co2-sequestration-hub-in-wyoming.
Tallgrass. 2023. “Underground Injection Control Carbon Sequestration Class VI Permit Application.” https://drive.google.com/file/d/1DX6U1qKS809G5FnQoYFybYh8rnZc8V26/view.
Tallgrass. 2024. “CO2.” Tallgrass. https://tallgrass.com/energy-solutions/co2.
Thomley, E., and R. Kammer. 2023. “Carbon Dioxide (CO2) Pipeline Safety: Safely Building a CO2 Transportation and Storage Network.” Great Plains Institute. https://carbonactionalliance.org/wp-content/uploads/CO2-Pipeline-Safey-Fact-sheet_1_30_2023.pdf.
Tomich, J. 2023. “Another CO2 Pipeline Hurdle Surfaces in Illinois.” Energywire, October 27. https://subscriber.politicopro.com/article/eenews/2023/10/27/latest-co2-pipeline-hurdle-surfaces-in-illinois-00123747.
Tomich, J., J. Plautz, and N.H. Farah. 2023. “Scuttled CO2 Pipeline Renews Debate About State Hurdles.” Energywire, October 23. https://www.eenews.net/articles/scuttled-co2-pipeline-renews-debate-about-state-hurdles.
U.S. Congress. 2020. “Consolidated Appropriations Act, 2021.” Public Law 116-260. 116th Congress (2019–2020). https://www.congress.gov/116/plaws/publ260/PLAW-116publ260.pdf.
USGS (U.S. Geological Survey). 2013. “National Assessment of Geologic Carbon Dioxide Storage Resources—Results.” U.S. Geological Survey Circular 1386. Reston, VA: U.S. Geological Survey. https://pubs.usgs.gov/circ/1386.
Voegele, E. 2023. “Navigator Cancels Heartland Greenway CO2 Pipeline Project.” Ethanol Producer Magazine, October 20. https://ethanolproducer.com/articles/navigator-cancels-heartland-greenway-co2-pipeline-project.
Wallace, M., L. Goudarzi, K. Callahan, and R. Wallace. 2015. “A Review of the CO2 Pipeline Infrastructure in the U.S.” DOE/NETL-2014/1681. Department of Energy Office of Energy Policy and Systems Analysis and National Energy Technology Laboratory. https://www.energy.gov/policy/articles/review-co2-pipeline-infrastructure-us.
Wang, S., R.J. Farrauto, S. Karp, J.H. Jeon, and E.T. Schrunk. 2018. “Parametric, Cyclic Aging and Characterization Studies for CO2 Capture from Flue Gas and Catalytic Conversion to Synthetic Natural Gas Using a Dual Functional Material (DFM).” Journal of CO2 Utilization 27(October 1):390–397. https://doi.org/10.1016/j.jcou.2018.08.012.
Webster, J. 2022. “The Inflation Reduction Act Will Accelerate Clean Hydrogen Adoption.” Atlantic Council (blog), September 20. https://www.atlanticcouncil.org/blogs/energysource/the-inflation-reduction-act-will-accelerate-clean-hydrogen-adoption.
White House. 2023. “Biden-Harris Administration Announces Regional Clean Hydrogen Hubs to Drive Clean Manufacturing and Jobs.” https://www.whitehouse.gov/briefing-room/statements-releases/2023/10/13/biden-harris-administration-announces-regional-clean-hydrogen-hubs-to-drive-clean-manufacturing-and-jobs.
Williams, J.H., R.A. Jones, B. Haley, G. Kwok, J. Hargreaves, J. Farbes, and M.S. Torn. 2021. “Carbon-Neutral Pathways for the United States.” AGU Advances 2(1):e2020AV000284. https://doi.org/10.1029/2020AV000284.
Wolf Carbon Solutions. n.d. “Mt. Simon Hub.” https://wolfcarbonsolutions.com/mt-simon-hub.
Wolf Carbon Solutions US LLC. 2023. “Wolf Carbon Solutions US LLC Mt. Simon Hub Pipeline System Application for Certificate of Authority.” https://www.icc.illinois.gov/docket/P2023-0475/documents/339033.


