International Talent Programs in the Changing Global Environment (2024)
Chapter: 2 Background
2
Background
THE UNITED STATES IN THE GLOBAL COMPETITION FOR TALENT1
Prior to the 1930s, Americans went to Europe for advanced degrees in science and engineering (S&E), with the vast majority of these individuals returning to the United States upon completing their training. The political climate in Europe in the 1930s drove talented individuals such as Albert Einstein and Enrico Fermi to immigrate to the United States, many of whom played an important role in the war effort and the Manhattan Project (Atomic Heritage Foundation, n.d.; JASON, 2019; Moser et al., 2014; Rovito et al., 2021; Shachar and Hirschl, 2013; Watney, 2021). Vannevar Bush, director of the U.S. Office of Scientific Research and Development during World War II, emphasized the need to “remove the barriers” and “develop scientific talent” in his postwar tome Science, The Endless Frontier (Bush, 1945; Hira, 2022; Reif, 2020). He also called for the U.S. government to “take an active role in promoting the international flow of scientific information” (Bush, 1945).
Foreign talent continued to come to the United States following World War II (American Academy of Arts & Sciences, 2020). However, the launch of the satellite Sputnik by the Soviet Union in October 1957 served as a drastic wake-up call, as the nation suddenly found itself behind in the space
___________________
1The next several sections incorporate material from the commissioned paper “China’s Patterns of Cooperation in Science and Technology” by Caroline S. Wagner.
race (Deutch, 2018; Herman, 2019; Merisotis, 2015; Xie and Killewald, 2012). This sparked Congress to pass the National Defense Education Act (P.L. 85-864, September 2, 1958), which made low-cost student loans available for students pursuing studies in science, mathematics, and foreign languages (U.S. Senate, n.d.).2 Furthermore, immigrant scientists and engineers played a vital role in propelling the United States to the moon during the 1960s (Rovito et al., 2021; Steele, 2015). In addition to the steady stream of foreign talent coming to the United States, the nation maintained some level of scientific exchanges with the Soviet Union and Eastern Europe throughout the Cold War.
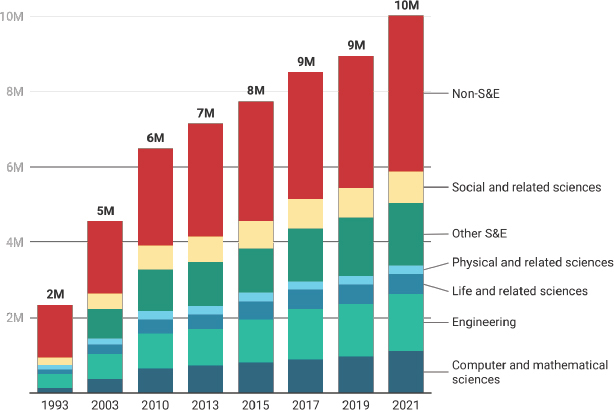
Today, the U.S. research ecosystem relies on the participation of foreign students, scholars, and professionals, as well as on international interactions and collaborations. The number of foreign-born workers holding at least a bachelor’s degree in the U.S. workforce has grown from 2 million in 1993 to 10 million in 2021, as shown in Figure 2-1.
Furthermore, international graduates have grown in both absolute terms and relative terms in their role in the U.S. skilled workforce; the science, technology, engineering, and mathematics (STEM) workforce; and the research and development (R&D) workforce. Box 2-1 provides additional insight on how STEM is defined by U.S. government agencies. In 2021, 50 percent of the 10 million international graduates in the U.S. workforce held degrees in STEM fields. While the foreign born make up only 14 percent of the U.S. general population, foreign-born degree holders make up 25 percent of workers with STEM degrees, an increase from 16 percent in 1993. The importance of foreign-born college graduates in U.S. R&D is also on the rise. According to the National Survey of College Graduates, in 1993, the foreign-born share of college graduates was only 13 percent, but this figure rose to 23 percent by 2021 (NCSES, 2021a). Among STEM graduates working in U.S. R&D, the share of foreign-born college graduates rose from 23 percent in 1993 to 36 percent in 2021 (NCSES, 2021a).
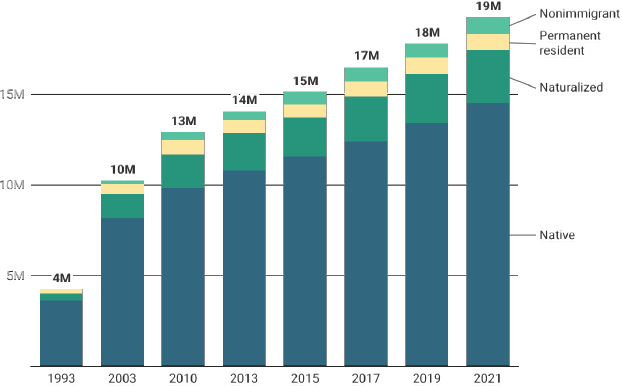
In recent years, however, the immigration status of foreign-born STEM graduates has grown more tenuous as fixed numerical limits and per-country caps established by Congress in 1990 have led to growing Green Card backlogs that prevent temporary visa holders from securing U.S. permanent residency and naturalization. In 1993, 31 percent of foreign-born
___________________
2More information about the National Defense Education Act of 1958 is presented in Box 3-2.
SOURCE: National Survey of College Graduates (NCSES, 2021a).
STEM graduates were permanent residents and only 5 percent were nonimmigrants (i.e., present in the United States on temporary visas).3 In 2021, the share of foreign-born STEM graduates who are permanent residents had fallen to 19 percent, while the share who are nonimmigrants had tripled to 15 percent. Figure 2-2 illustrates this concerning trend.
The U.S. immigration system effectively acts as a funnel, with education and exchange programs offering a wide opening to a great number of people. More competitive temporary visa programs with numerical limits set by Congress in 1990 narrow the flow considerably. In addition, capped permanent residency slots constrict the flow still further (Hunt and Zwetsloot, 2022).4 The impact of STEM workers on temporary visas being unable to secure U.S. permanent residency because of outdated numerical limits is perhaps felt most directly in projects funded by the Department of
___________________
3This study defines “nonimmigrant” as “a foreign national wishing to enter the United States on a temporary basis, whether for tourism, business, medical treatment, temporary work, or study.”
4In short, outdated immigration policy undermines the United States’ economic and national security.
BOX 2-1
Defining Science, Technology, Engineering, and Mathematics (STEM)
The acronym “STEM” was introduced by the U.S. National Science Foundation (NSF) in 2001, replacing the agency’s use of “SMET” to describe its program in education and workforce development in STEM (Donahoe, 2013; Hallinen, 2024; Loewus, 2015; McComas, 2014; Sanders, 2009). Over the succeeding decade, the use of the term became ubiquitous as calls to action to invigorate and improve K–12 and postsecondary education in these fields were published (Boyer Commission on Educating Undergraduates in the Research University, 1998; Fortenberry, 2005; NASEM, 2007b; NSB, 2005). This term also began to be applied to describe job and career roles, not just curricular fields (Butz et al., 2004; Kelly et al., 2004; Lee and Mossaad, 2010).
Ironically, there is no single U.S. government definition of STEM. In reality, defining STEM is much more complex than it might seem, as various federal agencies consider STEM to be inclusive of different academic disciplines and occupations (Gonzalez and Kuenzi, 2013; Olszewski et al., 2024). NSF supports all science and engineering (S&E) in the United States, including the social sciences but excluding medicine. The U.S. Congress Joint Economic Committee excludes medicine and health care in reporting on STEM education. The Census Bureau considers graduates with STEM degrees not to be employed in STEM if they teach mathematics, work as a patent lawyer, or practice medicine. The Department of Homeland Security Student and Exchange Visitor Program formally defines a STEM field of study as one “included in the Department of Education’s Classification of Instructional Programs taxonomy within the two-digit series containing engineering, biological sciences, mathematics, and physical sciences; or a related field. In general, related fields will include fields involving research, innovation, or development of new technologies using engineering, mathematics, computer science, or natural sciences (including physical, biological, and agricultural sciences” (Code of Federal Regulations, 2024). Finally, U.S. Citizenship and Immigration Services (USCIS) determines STEM and non-STEM job categories by classifying job titles from the Bureau of Labor Statistics’ Standard Occupational Classification into STEM and non-STEM.
SOURCE: National Survey of College Graduates (NCSES, 2021a).
Defense (DOD). While immigrants represent about 14 percent of the U.S. population, they account for 37 percent of the workforce with advanced degrees on DOD-funded projects (Nice, 2024).5 Of the high-skilled immigrants working on DOD-funded projects, 85 percent are naturalized citizens, reflecting the fact that security clearances are often necessary to work on such projects, and such naturalization is unobtainable without first getting through the Green Card queue (Nice, 2024).6
The issues described above have not gone unnoticed by foreign students, scholars, and governments. Talent recruitment programs operated by many U.S. allies date to the mid-2010s, highlighting the fierce competition for STEM talent beginning around this time (Grove, 2024; Stephan et al., 2015). International talent are voting with their feet, and there is evidence the attractiveness of the United States has shrunk relative to the rest of the
___________________
5In 2021, the American Community Survey estimated 19 percent of all U.S. STEM workers to be foreign-born. However, the 2021 National Survey of College Graduates, which uses a different occupation classification, estimated 23 percent of all U.S. STEM workers to be foreign-born. See https://ncses.nsf.gov/pubs/nsb20245/assets/nsb20245.pdf.
6The committee notes the existence of guidance for employing foreign scientists and engineers at DOD laboratories, centers, and agencies. See https://www.ida.org/-/media/feature/publications/g/gu/guidance-for-employing-foreign-citizen-scientists-and-engineers-at-department-of-defense-science-and/ida-d-4786.ashx.
SOURCE: OECD, 2023c.
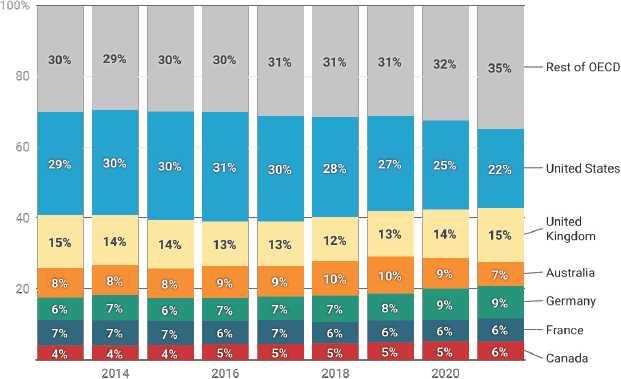
Organisation for Economic Co-operation and Development (OECD) member countries,7 as shown in Figure 2-3. 4.3 million international students were attending institutions of higher education in OECD countries in 2021, with 2.1 million or 49 percent of these students studying in a European OECD country and 833,000 or 19 percent of these students studying in the United States (OECD, 2023a). While international enrollment in U.S. colleges and universities has slowed since 2015, other OECD countries have aggressively competed for international students (Stephan et al., 2016). According to OECD data, the share of international students inbound to OECD countries who enroll in the United States has fallen since 2016, as shown in Figure 2-3. Other OECD countries, such as Canada and Germany, are competing actively for talent and have managed to expand their share of international students, cutting into the U.S. share. For example, while the United States managed to increase total enrollment of international students by 8 percent from 2013 to 2021, Germany increased its enrollment by 109 percent, not including students from the United States.
___________________
7The 38 OECD member countries are Austria, Australia, Belgium, Canada, Chile, Colombia, Costa Rica, Czechia, Denmark, Estonia, Finland, France, Germany, Greece, Hungary, Iceland, Ireland, Israel, Italy, Japan, Korea, Latvia, Lithuania, Luxembourg, Mexico, the Netherlands, New Zealand, Norway, Poland, Portugal, Slovak Republic, Slovenia, Spain, Sweden, Switzerland, Turkey, the United Kingdom, and the United States.
SOURCE: OECD, 2024a.
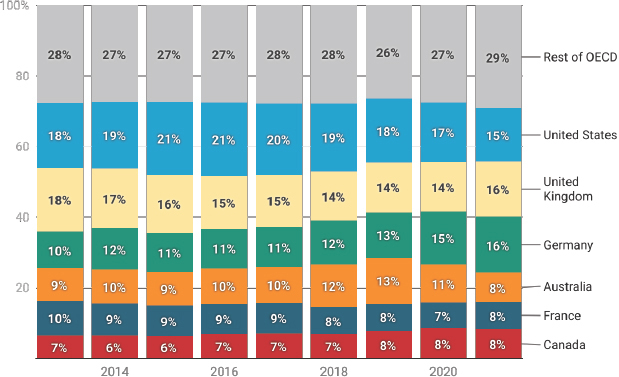
Furthermore, despite the increasing interest in STEM education by international students coming to study at U.S. colleges and universities, the United States has become a relatively less common destination in the OECD for international students pursuing STEM degrees. According to OECD data, both the United Kingdom and Germany now attract about the same number of international students to their higher education programs in STEM fields as the United States does as shown in Figure 2-4. Canada and other OECD countries have made gains, too.
The COVID-19 pandemic significantly affected the recruitment and retention of foreign talent, producing a dramatic drop in the international mobility of students and scholars during the pandemic’s most acute phase. Some measures of international mobility have recovered in the years since 2020, such as the number of students coming from India to study in the United States, while others have not, such as the number of students coming from China to study in the United States (IIE, 2023a).
The United States is clearly not in the same place today as it was in 2018 or even 2022 in recruiting and retaining foreign STEM talent. Given the current geopolitical environment, it is imperative that the nation re-double its efforts to remain a destination of choice for the world’s best and brightest students and scholars. This is absolutely necessary to ensure
the United States’ continued technological leadership, with democratic values at the forefront. The United States also must recognize that there is heterogeneity in need across diverse STEM labor markets depending on field and sector (Xue and Larson, 2015). Subsequent chapters address the ways in which the United States and other countries compete for talent. However, given the attention directed toward Chinese talent programs in particular, this report first provides background on the history of U.S.-China cooperation in science and technology (S&T), the rise of China as a science and technology power, talent flows between China and the United States and other countries, and U.S. government actions by the current and previous administrations.
HISTORICAL OVERVIEW OF CHINA-U.S. COOPERATION IN SCIENCE AND TECHNOLOGY
Although the Committee on Scholarly Communication with the People’s Republic of China (PRC) was launched in 1966 under the joint sponsorship of the U.S. National Academy of Sciences, the American Council of Learned Societies, and the Social Science Research Council, scientific collaboration between the United States and China was extremely limited in scale and scope prior to the signing of a bilateral S&T cooperation agreement in 1979 (Millwood, 2021; Smith, 1998). The cooperative relationship began in earnest with the rise to power of Deng Xiaoping and the announcement of China’s “Four Modernizations” to include S&T. Subsequently, China’s government sought out relationships and signed S&T agreements with European nations as well as with the United States during the 1970s. China’s S&T agreements had previously been limited to a handful of eastern European communist countries, including Hungary and Bulgaria, and the Soviet Union (Wagner and Simon, 2023).8
Since establishing diplomatic relations and the signing of the U.S.-China S&T Cooperation Agreement in January 1979, abundant research collaborations and student exchanges have taken place between the two countries (Nature, 2024). The nations became each other’s biggest research partner, and more than 3 million Chinese students have studied in the United States over the last 45 years (Crow, 2022; Nature, 2024; U.S.-China Education Trust, n.d.). Research collaborations with China were
___________________
8S&T agreements between China and these nations were signed during the 1950s.
encouraged by multiple sectors, with the U.S. government, universities, and industry all seeking to strengthen ties and leverage the expertise of Chinese scientists, engineers, and technologists (Crow, 2022). For example, the U.S.-China Clean Energy Research Centers promoted both academic and industrial collaborations in service of developing clean technologies and strategies applicable worldwide (Sandalow, 2010).
Many U.S. institutions established formal research agreements with Chinese institutions, with some U.S. colleges and universities initiating physical presences (joint venture universities) and degree programs (joint venture programs) in China (Cao, 2021; Diamond and Schell, 2019; Yin, 2023). Confucius Institutes, Chinese government-funded language and culture centers, were located on more than 100 American campuses during the late 2000s and 2010s (Diamond and Schell, 2019; NASEM, 2023b). These were seen by some universities as a way to meet student interest in Chinese language instruction, and a sign of their international stature, enabling the growth of academic and research partnerships (Diamond and Schell, 2019; NASEM, 2023b).9 These endeavors, along with private-sector efforts such as journals with specific outreach to and editors assigned to China, aimed to increase the quality of Chinese science and to inculcate Western research standards and values. In some cases, talent programs were considered as a positive way to accomplish this.
A paradigm shift occurred when Xi Jinping came to power in China in 2012 (Council on Foreign Relations, 2023). Xi made clear through the Chinese Communist Party’s Five-Year Plans and more broadly that “achieving superiority in science and technology is central to his vision of Chinese state power” (Lester et al., 2022; U.S. House of Representatives Committee on Science, Space, and Technology, 2023). He catalyzed a much more aggressive approach to S&T competition with the West, shifting the Chinese Communist Party to the national strategy of “Military-Civil Fusion” (DOS, n.d.a., 2020; Laskai, 2018; Levesque, 2019; O’Connor, 2019; U.S. Senate Permanent Subcommittee on Investigations, 2019b). During Xi’s tenure, China has emerged as a strong and formidable competitor to the United States in S&T as evidenced by publications and patent
___________________
9One key reason for the success of Confucius Institutes is that they filled a pedagogical gap left open by the decreasing resources allocated by the federal government to education in Chinese language (Diamond and Schell, 2019; NASEM, 2023b). American students were interested in learning Chinese, and the Chinese government was willing and able to provide funding and other resources to make this happen. The need for more Chinese language training remains in the post–Confucius Institutes environment.
output (NSB, 2024a, 2024d; Schneider et al., 2023).10 The nation is quickly approaching the global leading edge of research in many scientific disciplines and critical and emerging technologies, with Chinese advancements matching or exceeding those made by the United States in some fields (Bradsher, 2024; Gaida et al., 2023a, 2023b; Kelly, 2023; Lester et al., 2022; NASEM, 2022b; Schmidt et al., 2020; Tadjdeh, 2020; Takatsuki, 2023; The Economist, 2024a; Toney and Flagg, 2021).11
While Chinese talent recruitment programs were in place prior to 2012, under Xi Jinping these programs were redirected to serve as a mechanism to “facilitate the transfer of technology” in addition to building human capital (Lester et al., 2022; Priestap, 2018; Zwetsloot, 2020). Some of these programs had the ultimate effect of encouraging dishonesty and incentivizing behaviors “inconsistent with scientific values” held by the United States (Lester et al., 2022; Priestap, 2018; U.S. House of Representatives Committee on Science, Space, and Technology, 2021; U.S. Senate Permanent Subcommittee on Investigations, 2019b; Wray, 2020). A 2019 staff report from the U.S. Senate Permanent Subcommittee on Investigations noted how federal agencies have discovered that talent recruitment plan members “downloaded sensitive electronic research files before leaving to return to China, submitted false information when applying for grant funds, and willfully failed to disclose receiving money from the Chinese government on U.S. grant applications” (U.S. Senate Permanent Subcommittee on Investigations, 2019b).12 This report also stated that “the U.S. academic community is in the crosshairs of not only foreign competitors contending for the best and brightest but also of foreign nation states that seek to transfer valuable intellectual capital and steal intellectual property. As the academic community looks to the federal government for guidance and direction on mitigating threats, the U.S. government must provide effective, useful, timely, and specific threat information and tools to counter the
___________________
10The committee acknowledges that this is not necessarily a result of Xi’s leadership and that foundations built with Western assistance in the preceding decades enabled this emergence as a formidable competitor in STEM fields.
11The Third Plenum of China’s Communist Party’s Central Committee announced further education and research-related reforms in July 2024, including “accelerating efforts to build world-class universities and in-demand academic disciplines” and implementing “a national strategy for cultivating top talents” (Bradsher, 2024; Wang, 2024).
12The Hoover Institution’s report China’s Influence & American Interests: Promoting Constructive Vigilance notes that “[o]ne of the most glaring factors that facilitates IP theft is the fact that recipients of Chinese funding programs, such as the Thousand Talents Program…, routinely do not declare their work in China” (Diamond and Schell, 2019).
threats” (U.S. Senate Permanent Subcommittee on Investigations, 2019b). As such efforts will require a better understanding of the landscape of higher education and scientific research in the PRC, continuing to develop U.S. citizens proficient in Mandarin and to engage with PRC researchers and colleagues is essential to their effectiveness in improving research security (Haupt and Lee, 2023; Lee and Haupt, 2020; Mervis, 2024b; Mui, 2024; Nature, 2024; Richburg, 2024; Silver, 2020; Truex, 2024).13
The U.S. Department of Justice (DOJ) launched the China Initiative during the Trump administration in 2018 with the objective of “countering Chinese national security threats” and reinforcing the President’s national security strategy (DOJ, 2021). This was in response to “malign” activities China carried out, including putting in place programs aimed at encouraging Chinese science and engineering (S&E) students to master technologies that may later become critical to key military systems, as well as to growing concern regarding “foreign influence” on American universities (OTMP, 2018). Two components of the China Initiative called for (1) developing an “enforcement strategy concerning nontraditional collectors (e.g., researchers in labs, universities, and the defense industrial base) that are being coopted into transferring technology contrary to U.S. interests”; and (2) educating “colleges and universities about potential threats to academic freedom and open discourse from influence efforts on campus” (Abdelhady, 2019; DOJ, 2021).
The Biden administration ended the China Initiative in 2022 (Aloe and Guo, 2022; Gerstein, 2022a). While brief in duration, the effort had many indelible effects on academia and the research enterprise writ large, including
- fostering a period of intense focus on academia, even with few successful prosecutions and convictions, largely for offenses other than intellectual property (IP)-related issues;
- creating a climate of fear for Asian American and Pacific Islander researchers and those of Chinese descent in particular (Xie et al., 2023);
___________________
13The version of the National Defense Authorization Act for Fiscal Year 2025 (NDAA; H.R. 8070, 118th Cong. [2023–2024]) passed by the House of Representatives contains a provision that prohibits DOD from funding any U.S. university that has a research collaboration with China. At publication in August 2024, it is unclear whether this language will be included in the final version of the NDAA. See https://www.science.org/content/article/house-defense-bill-would-block-u-s-research-collaborations-china.
- damaging trust between the U.S. government and the academic research community (DHS, 2024a);
- increasing compliance burdens, for both federal agencies and institutions of higher education, given an expanded and constantly evolving regulatory landscape;
- generating a demonstrable downturn in U.S.-China research collaborations and student exchanges; and
- spurring the closure of nearly all Confucius Institutes (NASEM, 2023b).
To a considerable degree, the implementation of the China Initiative disrupted nearly 50 years of academic and scientific collaboration and student flows between the United States and PRC.
THE RISE OF CHINA AS A GLOBAL S&T LEADER
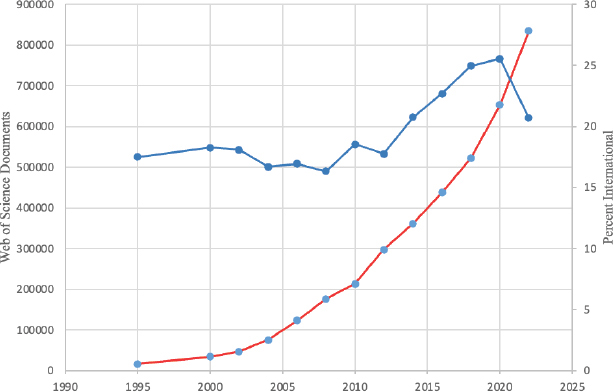
China rose to become a world leader in S&T and the leading international collaborative partner with the United States in just four decades. In 1980, China published 48 indexed scientific articles. In 2023, China was responsible for more than 25 percent of all articles indexed in the Web of Science platform that year (Adams et al., 2023). This accounts for more scientific articles than any other nation, including the United States, which previously held the lead after it surpassed the United Kingdom in 1948. Figure 2-5 shows China’s rise in the number of scholarly publications (in red) compared with its rate of participation in international cooperation (in blue). China’s share of the output has risen from 16 percent in 2016 to 27 percent in 2022, overtaking the United States, and equaling the output of the European Union (EU). This stunning achievement resulted from a mix of domestic policies and programs within China, and China’s taking advantage of the openness of the world science system (Cao et al., 2020). China’s domestic process has involved imitation, investment, innovation, technology transfer, and connection to a diaspora of Chinese scientists and engineers around the world (Cao et al., 2020).
A notable aspect of China’s growth has been its connection to the U.S. research enterprise. The United States was the world leader in S&T when China began its quest in earnest to grow its system, providing a model for China. For example, in 2000, China and the United States copublished about 2,000 papers, while in 2022, the number was over 22,000. The number of cooperating authors grew faster than the number of papers, rising
SOURCE: Web of Science, Clarivate, n.d.
__________________
a In this report, “scientific publication output” refers to the number of articles or publications and does not include other bibliometric data.
from about 40,000 cooperating authors in 2000 to more than 1 million in 2022.14 Between 1986 and 1997, Chinese-U.S. papers made up about 2.5 percent of U.S. internationally cooperative papers, but this percentage rose to more than 11 percent by 2008 and to 21 percent in 2022.
China boasts a larger population of scientists and engineers and has more registered patents than any other country. According to some quality metrics, China outperformed both the EU and the United States in 2022 in the top 1 percent of the most highly cited works (those considered to be noteworthy by others), although analyses differ depending on the commercial database utilized (Brainard and Normile, 2022; NISTEP, 2022; NSB, 2024d; Wagner et al., 2022). Cooperative papers between the
___________________
14 The American Academy of Arts & Sciences states that “much of the coauthoring is a consequence of Chinese researchers having performed their doctoral studies and/or postdoctoral research in the United States” (American Academy of Arts & Sciences, 2020).
United States and China command even greater citation attention from the scientific community, suggesting that both nations benefit from the collaborations.
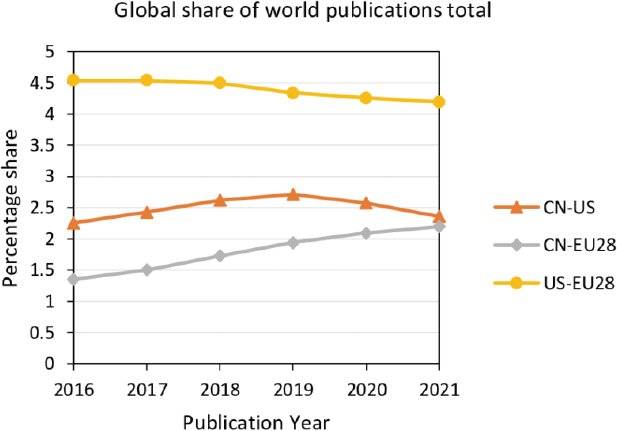
The global COVID-19 pandemic resulted in a drop in the output of scientific publications in many places around the world, although not in China. The EU and United Kingdom output remained about the same between 2021 and 2022, while China’s output grew as it has year-on-year for over a decade. China’s contributions to article counts in 2022 accounted for 27 percent of the world total, higher now than the United States’ 20 percent share and equal to that of the EU (including the United Kingdom in the historical data). China’s share of global scientific publication output grew from 16 percent in 2016 to 27 percent in 2022, while the U.S. share dropped from 23 percent in 2016 to 20 percent in 2022 (see Table 2-1). Where U.S. collaborations in Europe are flat, China-EU cooperation has increased by 60 percent since 2016 (see Figure 2-6) (Wagner and Cai, 2022a).
U.S.-China collaboration also dropped in 2022 and 2023, part of the reduced engagement that began before the pandemic, with China’s share of international collaborations dropping since 2018 and most steeply with the United States at 24 percent (Wagner, 2024a; Wagner and Cai, 2022b). Assuming a 2- to 4-year lag between initiation of research and published results, the drop in U.S.-China collaboration likely began around 2018.
Although China’s rise in S&T has been exceptional, it has followed some of the patterns of development common across the history of nations growing a science system (Cao et al., 2020; NASEM, 2010). With few exceptions, most nations copy the scientific leaders of the day as they build institutional structures, choose areas of S&T investment, and develop research and experimentation programs. These commonalities of policy action include changes to patent and IP law and protection that provide incentives for invention and innovation. It further includes sending out emissaries to study the science system in leading nations and bringing back knowledge physically or linking back at a distance through collaborative research. Domestically, most nations develop deliberate procurement policies to purchase the results of early innovation, regardless of quality, as a common strategy. Beyond these familiar patterns, China’s rapid rise also was fueled by direct transfers of technology by U.S. multinational corporations eager to reduce production costs and access the large, protected Chinese market, along with the deployment by the Chinese government of industrial policies at unprecedented scales (Bateman, 2022; Brown and Singh,
TABLE 2-1 Comparison of Chinese, U.S., and EU-28 Scholarly Publications and Percentages of World Share, 2016 to 2022
| Year | Total Articles and Reviews Indexed in Web of Science (only) | China Publications (Fractional Counts) | China Share of World Total | USA Publications (Fractional Counts) | USA Share of World Total | EU-28 Publications (Fractional Counts) | EU-28 Share of World Total | Rest of World | Rest of World Share of World Total |
|---|---|---|---|---|---|---|---|---|---|
| 2016 | 2,006,213 | 323,498 | 16% | 462,887 | 23% | 592,864 | 30% | 626,964 | 31% |
| 2017 | 2,094,213 | 359,875 | 17% | 474,768 | 23% | 608,466 | 29% | 651,104 | 31% |
| 2018 | 2,179,530 | 412,197 | 19% | 479,608 | 22% | 617,594 | 28% | 670,131 | 31% |
| 2019 | 2,068,920 | 503,209 | 24% | 516,576 | 25% | 669,083 | 32% | 380,052 | 18% |
| 2020 | 2,633,012 | 671,049 | 25% | 554,035 | 21% | 711,279 | 27% | 696,649 | 26% |
| 2021 | 2,811,357 | 678,517 | 24% | 582,442 | 21% | 677,942 | 24% | 872,456 | 31% |
| 2022 | 2,486,398 | 681,949 | 27% | 503,768 | 20% | 677,322 | 27% | 623,359 | 25% |
SOURCE: Web of Science, Clarivate.
SOURCE: Clarivate InCites online, January 28, 2022.
2018; Hannas and Tatlow, 2021; Lewis, 2023; O’Connor, 2019; Qin, 2019; Sutter and Sutherland, 2018).
Under Deng Xiaoping, policy changes and financial investments instituted by the Chinese government led to a rapid rise in the number of scientists and engineers in China. It is unknown how many scientists or engineers were employed in China in 1979, but by early 2020, the reported number of employed scientists and engineers was 5.3 million working in China, with well over 1 million working outside of China. In 2020, China awarded 1.38 million engineering bachelor’s degrees according to the Asia Times (Jones and Goldman, 2022). In 2019, the comparable U.S. number according to the National Science Board is 218,000 bachelor’s degrees—129,000 in engineering and 89,000 in computer sciences—or one-seventh of China’s total (NCES, 2020; Trapani and Hale, 2022).
China’s spending on R&D, which the government largely shouldered at first, rose from about $375 million on S&T in 1979 to $458.5 billion in 2023, an amount that is second in the world behind the United States (OECD, 2019; Xinhua News Agency, 2024). The Chinese government claims that national corporations now invest 75 percent of the national
total R&D spending, although the government provides significant direct and indirect subsidies (Dou, 2023; NSB, 2022b).15 The government reports spending about 25 percent of total R&D, although these figures cannot be validated independently.16 Furthermore, China uses different counting and reporting methods from OECD countries. Should these figures be accurate, China’s corporations would be outpacing the OECD average of a 67/33 corporate/government split in R&D spending.
Sino-Soviet Cold War Collaboration
Prior to the dramatic rise of Chinese S&T publication output (see Figure 2-5), China had a brief but intense cooperative relationship with Russia and other Soviet member states before the late 1970s. In 1955, the Soviet Union and China signed a joint diplomatic agreement to cooperate in S&T, and with it, they established a Joint Commission on S&T Cooperation, which met at least once a year to discuss and coordinate cooperative activities. Many exchanges and cooperative activities occurred as a result of the relationship, which along with the “series of triangular U.S.-Soviet-Chinese geopolitical interactions with alternating periods of alliance and hostility” reshaped China’s role in the global scientific enterprise (Wang, 2014).
China took advantage of this diplomatic relationship to learn from and emulate the Soviet science system. The Soviet model emphasized the role of centralized institutions, with less emphasis given to university research than is the case in Europe or North America. The Soviet model motivated China to establish several key scientific research institutions, including the Chinese Academy of Sciences (CAS), founded in 1949. CAS remains an important and prestigious institution and the largest research organization in China, with more than 100 institutes, 3 universities, and 69,000 full-time employees (Global Times, 2023; Leung and Sharma, 2022; Suttmeier et al., 2006). CAS trains more than 79,000 graduate students per year
___________________
15The Rhodium Group has written further on sources of S&T funding in China. See https://rhg.com/research/spread-thin-chinas-science-and-technology-spending-in-an-economic-slowdown/.
16The Chinese National Bureau of Statistics reported that the Chinese government’s investment in R&D surpassed 3 trillion yuan ($419.2 billion USD in 2024) in 2022 (Luong, 2024; Xinhua News Agency, 2003). USD calculated using an exchange rate of 1 USD = 7.156 RMB as of August 6, 2024. See https://www.xe.com/currencyconverter/convert/?Amount=1&From=USD&To=CNY.
enrolled in its institutes and universities, which include the University of Chinese Academy of Sciences, the University of Science and Technology of China, and the Graduate University of Chinese Academy of Sciences (Global Times, 2023; Leung and Sharma, 2022; Suttmeier et al., 2006).
The Soviet Union provided China with thousands of visiting scientists and engineers who helped with economic development and military modernization. One source suggested that more than 11,000 Soviet specialists were on site in Chinese factories in 1959 (Frieman, 1989). Chinese students traveled to the Soviet Union to study technical subjects, and between 1948 and 1963, China sent nearly 8,000 students to study in the Soviet Union, which constituted close to 80 percent of China’s students studying abroad (McGuire, 2010). Most Chinese students sent to the Soviet Union had attended college in China and were chosen for overseas study based upon top academic achievement. China established a school in Beijing to teach students Russian and mathematics before proceeding to study and train in Soviet institutions. Between two-thirds and three-quarters of these students studied technical subjects and business, much like the Chinese students who traveled to the West in the 1980s and 1990s.
The two countries cooperated on several major scientific and technological projects, such as the development of China’s nuclear weapons program17 and its first satellite. The Soviets also helped China develop its aerospace industry by providing the plans and parts for the MiG-15 fighter jet and training Chinese engineers to build military aircraft. The Soviets provided aid to help China develop its heavy industry sector, including its steel and machine-building industries.
Soviet-Chinese diplomatic and political tensions arose beginning in 1960, resulting in the removal from China of most Soviet experts along with their blueprints, plans, and technical libraries (Bernstein and Li, 2010). Unlike China’s experience in the West, none of China’s scientists or engineers remained in the Soviet Union. China’s cooperative educational program with the Soviet Union ended in 1967 due to ideological conflicts, territorial disputes, and political differences.
Soviet-Chinese cooperation played a significant role in the early development of China’s S&T enterprise. It helped China acquire the knowledge and skills necessary to build its own indigenous S&T capabilities. Technical
___________________
17China’s missile program was developed by U.S.-trained scientist Qian Xuesen, whose profile is in Appendix F. Qian is an early case of China realizing the “value and importance of transferring the intellectual capital of overseas technical experts” (Stoff, 2021).
literature, plans, education, training, sales of parts, the purchase of technical goods, and joint projects from the Soviet Union all aided China as it developed a scientific system. China provided the Soviet Union with raw materials in exchange for technology, training, and education, which concerned Chinese officials who worried they were not gaining enough technical knowledge from the arrangement. Mao Zedong’s Cultural Revolution of 1966–1976 disrupted, but did not completely obliterate, these capabilities and skills.
THE FLOW OF CHINESE TALENT TO AND FROM THE UNITED STATES
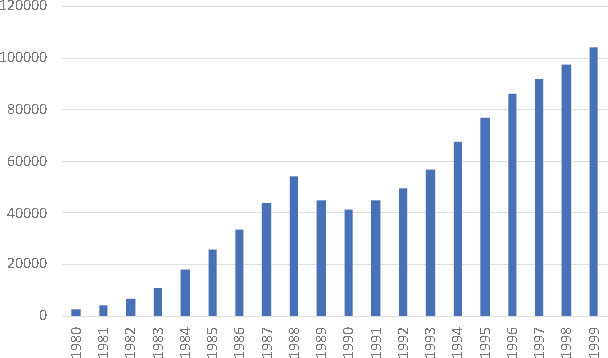
Deng Xiaoping, at the time Chairman of the Chinese People’s Political Consultative Conference, declared in June 1978 that “thousands, or even tens of thousands, [of students] should be sent abroad rather than only a handful” (China Net Education Channel, 2009; Diamond and Schell, 2019; Li, 2005; Strider, 2022).18 While China and the United States were actively negotiating a bilateral S&T agreement in July 1978, White House Science Advisor Frank Press met with Chinese counterparts to negotiate student exchange opportunities. In October 1978, the White House Office of Science and Technology Policy (OSTP) announced an accord signed in China between 11 Chinese officials and scholars and the United States, negotiated as part of a 2-week visit sponsored by the National Science Foundation (NSF). At the opening of the bilateral relationship, 500 to 700 students were expected to enroll in U.S. universities. In 1980, 2,770 arrived, with numbers increasing every year thereafter (Guo, 2003; Luo, 2013; Ma, 2014; Snyder and Hoffman, 1992; Sun, 1995; Yan and Berliner, 2016; Zhao, 1996). Figure 2-7 shows the number of students visiting the United States in the 1980s and 1990s.
Initially, the U.S.-China educational exchange agreement was meant to apply to graduate students, but undergraduate students joined the flow to the United States as early as 1980. The number of Chinese undergraduate students coming to the United States increased steadily in the 1980s and 1990s. In 1980, there were 2,770 Chinese students enrolled in institutions of higher education in the United States (Guo,
___________________
18The Hoover Institution’s report China’s Influence & American Interests: Promoting Constructive Vigilance notes that since the late 1970s, government authorities in the PRC “have seen American universities as integral to China’s economic and scientific development” (Diamond and Schell, 2019).
SOURCE: Institute of International Education (IIE, 2023b).
2003; Luo, 2013; Ma, 2014; Snyder and Hoffman, 1992; Sun, 1995; Yan and Berliner, 2016; Zhao, 1996). By 2021, the number of Chinese undergraduates in the United States had increased to 109,492, with these students accounting for 34.7 percent of all Chinese students studying in the United States (IIE, 2023d). Students chose majors in engineering (30 percent), business (25 percent), mathematics and computer science (15 percent), and physical and biological sciences (10 percent) (Achirri, 2020; IIE, 2022b, 2023d).
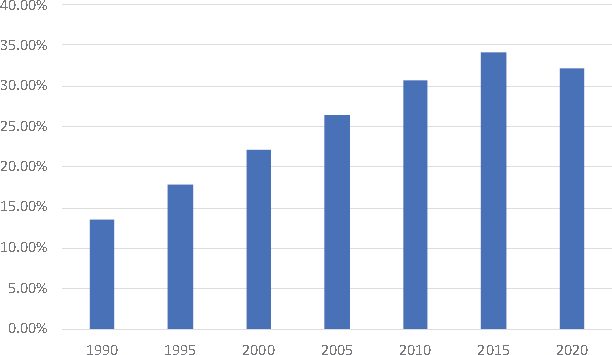
For doctoral students, the emphasis Chinese students placed on technical fields is even more pronounced than for undergraduates. In 2021, 72.9 percent of Chinese doctoral students were in STEM fields, compared with 63.7 percent of U.S. citizen doctoral students. Figure 2-8 shows the percentage of the total doctoral degrees awarded by U.S. institutions that were earned by Chinese students. According to an NSF survey, 13.6 percent of doctorates in the United States were earned by Chinese students in 1990. As shown in the figure, this percentage has increased steadily over the years, reaching 32.2 percent in 2021.
Chinese doctoral students also tend to be more likely to complete their doctorates than U.S. citizen doctoral students. In 2021, 85.5 percent of Chinese doctoral students completed their doctorates within 10 years of enrollment, compared with 78.3 percent of U.S. citizen doctoral students.
SOURCE: The State of U.S. Science and Engineering (NSB, 2024d).
Many Chinese doctoral awardees choose to remain in the United States if they can gain employment. For every 1 returnee, 1.4 Chinese scientists have remained in the United States over the past decade, while the turnover ratio of returnees to remainers in the EU is roughly 1 to 0.9 (Cao et al., 2020). The most eminent scientists tend to stay in the United States, but the opposite was true for the EU, where even prominent researchers have been returning to China (Cao et al., 2020; Chawla, 2019). This may be the result of the relative ease of assimilating into U.S. culture compared with European culture. While the majority of those Chinese students who earned doctorates in the United States have opted to remain in the country—the American Academy of Arts & Sciences finds that as high as 80 percent stay—many of the scholars who returned to China retained collaborative relationships with their U.S. counterparts (American Academy of Arts & Sciences, 2020; Brown and Singh, 2018). However, as noted previously, the China Initiative has had a demonstrable chilling effect on the continuation of these collaborations and the retention of Chinese scholars (Conroy, 2024; Jia et al., 2024). Flynn et al. discerned from a differences-in-differences approach in conjunction with CV and publication data that between 2016 and 2019, ethnically Chinese graduate students were 16 percent less likely to pursue a Ph.D. program in the United States, and that those who did
were 4 percent less likely to stay in the United States postgraduation (Flynn et al., 2024).
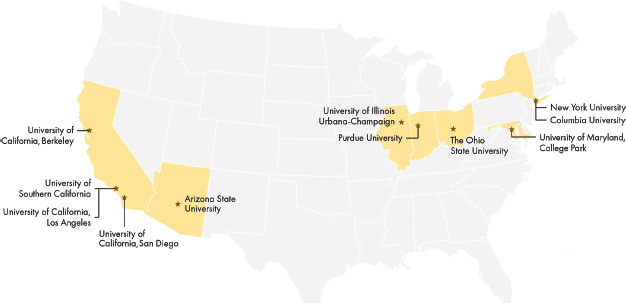
The growth in the number of Chinese students traveling to study in the United States over the past four decades is well documented. The numbers increased almost every year since 1980, although the rate of growth slowed over time and, in a few cases, fell because of economic slowdowns in the economy. Funding for Chinese students studying in the United States at all degree levels typically comes from self-financing (personal and family funding); Chinese government funding, including scholarships from the China Scholarship Council; U.S. government funding, including the Fulbright Program as well as university scholarships, research and teaching assistantships, and financial aid; and other sources, including scholarships from private companies, nongovernmental organizations, and foundations (Diamond and Schell, 2019; IIE, 2023c; Luo, 2024; Shao, 2014; US-China Education Trust, n.d.; Zhu, 2018).19 It is important to note that many undergraduate students are funded by the first two sources on this list (self-financing and Chinese government funding). Students pursuing advanced degrees in STEM fields, especially at the Ph.D. level, are typically funded by sources of research support provided to their institutions, including from the U.S. government in the form of research grants and contracts. The universities that have welcomed the greatest number of Chinese students are presented in Figure 2-9.
Visiting Scholars and Research Productivity
In addition to students, Chinese-educated researchers come to the United States to study and work as visiting scholars, postdoctoral researchers, and other roles. These scholars have been educated in China and come to the United States for a period of time to collaborate. Estimates based on studies by the China Scholarship Council suggest about 10,000 per year come to the United States, funded mainly by the Chinese government but also by private sources and the U.S. government, such as the Fulbright Program (see Box 2-2).20 These scholars are not spread evenly by state, with California,
___________________
19Some examples of foundations providing scholarships to Chinese students include the Ford Foundation, the Asia Foundation, and the Li Ka Shing Foundation.
20The U.S.-China Fulbright Program was suspended by the U.S. government in 2020. See https://www.federalregister.gov/documents/2020/07/17/2020-15646/the-presidents-executive-order-on-hong-kong-normalization and https://www.insidehighered.com/news/2020/07/16/trump-targets-fulbright-china-hong-kong.
SOURCE: Committee-generated.
Massachusetts, Ohio, Texas, and Washington hosting the greatest number of visiting scholars. The aggregate active number of Chinese scholars working and/or studying in the United States in 2019 was likely about 20,000.
In 2017, it appears that more scholars returned to China than came to the United States. Nearly 10,000 researchers from the United States—and more than 5,000 from the EU—moved to China to work and study, with the majority being researchers of Chinese origin (Chawla, 2019; Wagner et al., 2024). These figures have risen notably since 2010, when nearly 5,000 scholars moved to China from the United States and around 2,300 moved from the EU (Chawla, 2019). As returnee rates increase, the number of entrants has as well. In 2017, nearly 14,000 researchers from China were working in the United States and just under 5,000 researchers from China were working in the EU, up from more than 8,000 and 2,500, respectively, in 2010 (Chawla, 2019).
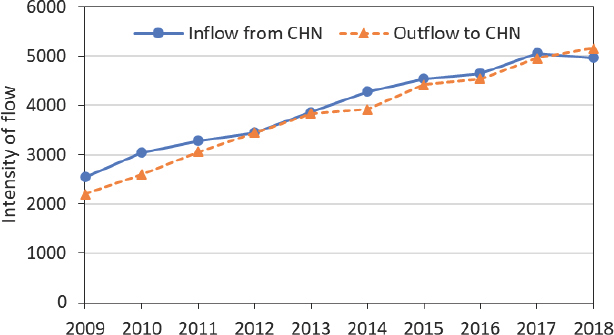
Table 2-2 shows the number of Chinese scholars visiting the United States with the inflow to China and the outflow from China noted in the additional columns. Between 2009 and 2018, the number of researchers moving between China and the United States more than doubled, from about 2,500 (total) in 2009 to about 5,000 (total) in 2018 (see Figure 2-10). The numbers for the outflow and inflow are almost equal. However, it is important to recognize that these numbers pre-date the China Initiative and the COVID-19 pandemic, and flows in both directions have been curtailed since.
BOX 2-2
The Fulbright Program
The largest U.S. government–funded program for bringing international students and researchers to the United States is the Fulbright Program, administered by the U.S. Department of State. The Fulbright Program, an international academic exchange program, was founded in 1946 to increase mutual understanding and support friendly and peaceful relations between the people of the United States and the people of other countries. It is one of the largest programs for bringing international students and researchers to the United States and sending U.S. students and scholars abroad. The program is funded by an annual appropriation from Congress to the State Department’s Bureau of Educational and Cultural Affairs and from participating governments, host institutions, corporations, nongovernmental organizations, and foundations providing direct and indirect support.
Approximately 8,000 students, scholars, teachers, artists, and professionals from the United States and 160 countries receive awards from the Fulbright Program each year. This includes approximately 2,000 domestic students and 800 domestic scholars departing the United States to study abroad, and 4,000 foreign students and 900 foreign scholars coming from abroad to study in the United States. These individuals hail from a wide variety of academic disciplines. Fulbright Program participants from abroad enter the United States on an Exchange Visitor J-1 visa subject to the 2-year home country residence requirement. This means that following the completion of a Fulbright Fellowship, foreign students and scholars are generally required to return to their home country for 2 years before they are eligible to apply for a visa to return to the United States. Thus, while Fulbright plays an important role in U.S. leadership in international education, both the number of participants and the home country return requirements mean that it is not a major contributor to STEM talent flows to the United States.
TABLE 2-2 Number of Active Researchers and Inflow and Outflow of Visiting Chinese Scholars in the United States by State, 2018
| State | # Active Researchers | Inflows | Outflows | ||||
|---|---|---|---|---|---|---|---|
| Total # of all inflows | Inflows from China | % of all inflows originating in China | Total # of all outflows | Outflows to China | % of all outflows leaving for China | ||
| CA | 129,361 | 14,787 | 739 | 5.00% | 12,372 | 740 | 5.98% |
| NY | 81,112 | 8,806 | 310 | 3.52% | 9,044 | 352 | 3.90% |
| MA | 66,624 | 8,251 | 372 | 4.51% | 7,855 | 378 | 4.81% |
| TX | 62,108 | 6,665 | 377 | 5.65% | 6,553 | 482 | 7.35% |
| PA | 49,390 | 5,409 | 243 | 4.50% | 5,828 | 250 | 4.28% |
| MD | 47,202 | 6,000 | 215 | 3.58% | 6,048 | 230 | 3.81% |
| IL | 38,072 | 4,102 | 201 | 4.90% | 4,686 | 210 | 4.49% |
| OH | 34,515 | 3,357 | 153 | 4.54% | 3,642 | 147 | 4.04% |
| FL | 32,645 | 3,725 | 141 | 3.77% | 3,467 | 110 | 3.19% |
| NC | 32,056 | 3,510 | 138 | 3.93% | 3,472 | 158 | 4.55% |
| Ml | 31,450 | 3,082 | 172 | 5.58% | 3,362 | 192 | 5.70% |
| GA | 25,908 | 2,863 | 185 | 6.45% | 2,855 | 167 | 5.83% |
| VA | 24,216 | 3,191 | 81 | 2.55% | 3,141 | 76 | 2.42% |
| WA | 22,649 | 2,809 | 143 | 5.10% | 2,601 | 159 | 6.12% |
| NJ | 21,016 | 2,923 | 99 | 3.40% | 2,725 | 123 | 4.51% |
| IN | 21,005 | 2,127 | 104 | 4.90% | 2,224 | 109 | 4.88% |
| MN | 19,194 | 2,099 | 77 | 3.68% | 2,032 | 66 | 3.24% |
| CO | 18,980 | 2,268 | 45 | 1.99% | 2,081 | 54 | 2.59% |
| TN | 17,166 | 1,786 | 90 | 5.05% | 1,879 | 95 | 5.07% |
| MO | 15,414 | 1,748 | 69 | 3.93% | 1,971 | 79 | 4.03% |
SOURCE: OECD, 2024a.
SOURCE: OECD, 2024a.
Analysis conducted on where Chinese scholars visit in the United States did not find a strong correlation between R&D spending in that state and the willingness of scholars to locate there. Instead, the study found a strong correlation between institutional academic reputation and the location of Chinese scholars. This suggests that Chinese scholars visiting the United States seek a reputational advantage in choosing an institution rather than following the largest or latest funding activities (Wagner et al., 2024). Such trends may be self-reinforcing, as students and scholars choose locations where communities of their compatriots are already present.
THE LANDSCAPE FOR INTERNATIONAL TALENT POST-CHINA INITIATIVE
U.S. leadership in S&T has benefited substantially from attracting the best global talent. At least 46 percent of S&E Ph.D. recipients in 2020 were from overseas (Xie et al., 2023). Among S&E Ph.D. recipients in 2020 who were on temporary visas, 37 percent of these individuals hailed from China—3 times the proportion from the second largest country, India (Xie et al., 2023). A substantial 87 percent of Chinese recipients of Ph.D.’s from U.S. universities between 2005 and 2015 intended to stay in the U.S. following graduation (NCSES, 2016; Xie et al., 2023).
The landscape for international talent has experienced significant changes in recent years. The DOJ’s China Initiative was perceived as targeting American academic scientists of Chinese descent, resulting in investigations, arrests, and prosecutions of some Chinese American scientists. One of the most prominent cases involved Gang Chen, a distinguished professor at the Massachusetts Institute of Technology (MIT), who was erroneously arrested for grant fraud in January 2021, sparking the nationwide “We Are All Gang Chen” movement (Fink and Huang, 2021).21 A year later, the DOJ dropped all charges against Chen and terminated the China Initiative shortly thereafter (Aloe and Guo, 2022; Barry and Benner, 2022; DOJ, 2022; Gerstein, 2022a, 2022b; Gilbert and Kozlov, 2022; Guo, 2022; Kemsley, 2022; Kivelson and Michelson, 2023; Larkin, 2022; Lucas, 2022; Mervis, 2022b; Nakashima, 2022; NASEM, 2022c).
The China Initiative, the issuance of Presidential Proclamation 10043, and other actions, including those taken by the Department of Commerce and the National Institutes of Health (NIH), have had the effect of instilling widespread fear, creating chilling effects among scientists of Chinese descent, and damaging trust between the U.S. government and the academic research community (Conroy, 2024; DHS, 2024a; Dolgin, 2019; Edmondson, 2021; Flynn et al., 2024; Jia et al., 2024; Lewis-Kraus, 2022; Ma, 2023; Mervis, 2023b; Olszewski et al., 2024; Silver et al., 2019; Widener, 2021). Many of these researchers have felt unwelcome and fearful of conducting research, and experienced pressure to either leave the United States or refrain from applying for federal grants (Dolgin, 2019; Xie et al., 2023).
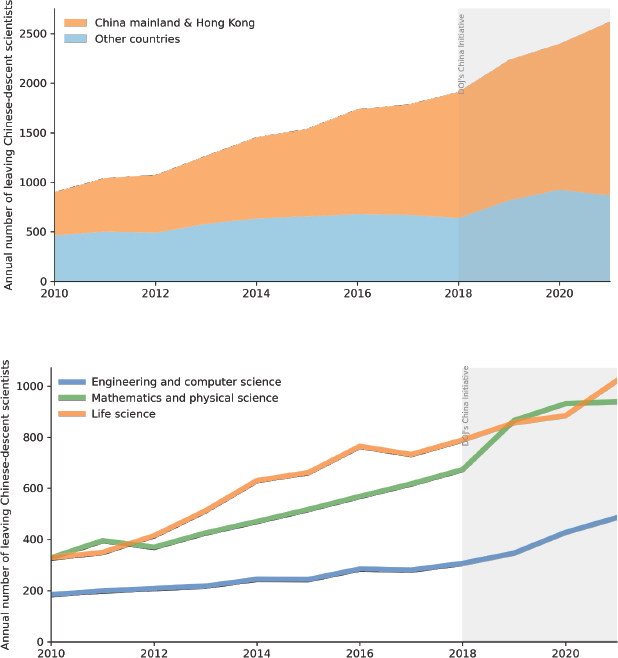
Analysis of the bibliometric data of more than 200 million scientific papers showed a steady increase in the migration of scientists of Chinese descent from the United States to China and other countries since 2018, reaching more than 1,000 per year (Xie et al., 2023). About 75 percent of the group moved to China (see Figure 2-11).
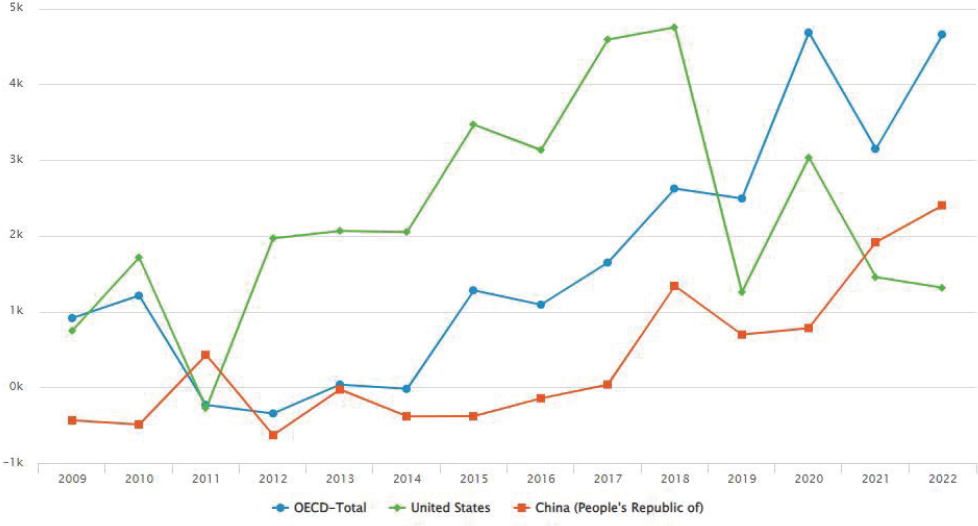
The OECD identified consistent trends in the international net flow of scientific authors (see Figure 2-12) (Bier, 2023). It shows the U.S. gain increased from 2,000 in 2012 to 4,300 in 2017. The number has dropped dramatically since 2018, and became -1,000 in 2022, indicating that the
___________________
21Gang Chen, a member of the National Academy of Sciences and the National Academy of Engineering, discovered a new semiconductor material that was named one of Physics World’s Top 10 Breakthroughs of 2022. See https://physicsworld.com/a/physics-world-reveals-its-top-10-breakthroughs-of-the-year-for-2022/.
SOURCE: Xie et al., 2023.
SOURCE: OECD Science, Technology and Innovation Scoreboard (OECD, n.d.c).
United States is losing talent and that other OECD countries and China have surpassed the United States.
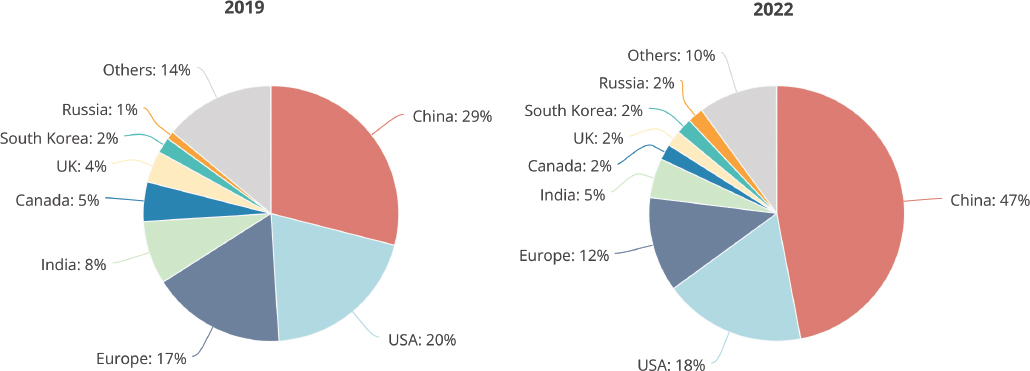
Such shifts in talent flows and the resulting distributions of researchers can be especially pronounced in critical technology fields. For example, using the author data on papers presented at Neural Information Processing Systems, or NeurIPS conferences,22 the Global Artificial Intelligence (AI) Tracker 2.0 reported that in 2019, 29 percent of the top AI researchers came from the United States, while China accounted for 20 percent (MacroPolo, 2023). However, by 2022, China emerged as the leader, producing 47 percent of the top AI talent, significantly outpacing the United States, now with 18 percent of the top AI researchers (see Figure 2-13) (MacroPolo, 2023).
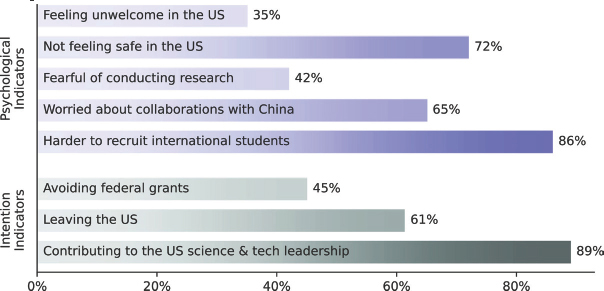
The Asian American Scholar Forum (AASF) conducted a national academic climate survey of 1,300-plus faculty of Chinese descent between December 2021 and March 2022 (Xie et al., 2023). While 89 percent of the survey participants said they would like to contribute to U.S. leadership in S&T, 72 percent felt unsafe, and 42 percent felt fearful of conducting research. This fear led 61 percent of the respondents, particularly junior faculty and federal grant awardees, to consider leaving the United States, and 45 percent, particularly engineering and computer science faculty, to consider avoiding applying for federal grants (see Figure 2-14).
Applications for NSF grants declined significantly between 2011 and 2020 (Mervis, 2022a). While the decline was 17 percent overall, it was 28 percent for Asian American scientists. In addition, there is a notable disparity in grant allocations from NSF for Asian scholars. A recent study cited by the New York Times shows that scholars of Asian descent are 20 percent less likely to receive NSF grants compared with their counterparts from other ethnic groups (Chang, 2023; Chen et al., 2022).
The departure of scientists of Chinese descent amid increasing U.S.-China geopolitical tensions has garnered significant attention both domestically and internationally (Hua and Hao, 2022; Lu and Rathi, 2023; Quinn, 2023). Numerous concerns have been raised, including a deepening sense of a suspicious domestic research climate, hurdles in academic research collaboration, the potential loss of talent from the United States to China and other nations, and the ramifications of brain drain on U.S. S&T leadership.
___________________
22NeurIPS is a prominent AI and machine learning conference that tens of thousands of researchers from academia and industry attend annually. See https://neurips.cc/.
SOURCE: MacroPolo at the Paulson Institute, 2023.
SOURCE: Xie et al., 2023.
The findings of the AASF study have attracted close attention from the White House and OSTP; federal funding agencies including the DOD, DOE, Department of Homeland Security (DHS), NSF, and NIH; the National Academies of Sciences, Engineering, and Medicine; and members of Congress. AASF has presented these findings numerous times and has worked with federal policymakers, higher education associations such as the Association of American Universities and Association of Public and Land-grant Universities, and university leaders to address these issues, provide feedback on evolving federal funding policies on research security, and develop strategies for retaining and attracting talent.
In March 2024, the White House invited AASF leaders to celebrate their contributions to the United States and to participate in a roundtable to discuss the issues and challenges facing the community. Furthermore, in June 2024, the Federal Bureau of Investigation admitted to making mistakes and vowed to build trust and improve its relationship with researchers of Asian descent at a public forum convened by Rice University’s Baker Institute for Public Policy (Franklin, 2024; Razdan, 2024; Savage, 2024a). The July 2024 OSTP Memorandum “Guidelines for Research Security Programs at Covered Institutions” emphasizes the need to “improve research security while preserving the openness that has long enabled U.S. R&D leadership throughout the world and without exacerbating xenophobia,
prejudice, or discrimination” (Prabhakar, 2024b).23 NIH Director Monica Bertagnolli released a statement supporting Asian American, Asian immigrant, and Asian research colleagues in August 2024, noting these individuals’ “extraordinary contributions to advancing science” and emphasizing that “discrimination and harassment are unacceptable” (NIH, 2024b). The statement also announced measures to repair relationships with the Asian American community and to clarify existing research security policies in the wake of the China Initiative (Mervis, 2024c).
However, recent legislative actions at the federal and state levels have intensified the fear scientists of Chinese descent are experiencing. The House of Representatives’ FY 2024 appropriations bill, H.R. 5893 (118th Congress, 2023–2024), had a significant budget for reinstating the China Initiative. Through the joint effort of 50 organizations led by AASF and the Congressional Asian Pacific American Caucus, the explanatory statement released on March 3, 2024, for the FY 2024 Commerce, Justice, Science, and Related Agencies Appropriations Act was revised with the reinstatement language of the controversial China Initiative being removed. The House passed the spending bill without this language. On May 22, 2024, the House Judiciary Committee held a markup vote on H.R. 1398 (118th Congress, 2023–2024), the Protect America’s Innovation and Economic Security from CCP Act, which would reestablish the China Initiative under a new name, the CCP Initiative (U.S. House Judiciary Committee, 2024). The passage of such a bill would likely have substantial consequences, especially for Asian American scholars, and a significant influence on the U.S. global talent competition.
Multiple states have passed land bills to prohibit Chinese immigrants from acquiring real estate. The state of Florida has gone beyond this, passing a law in May 2023 that bars Chinese students from accessing academic labs (Florida State Senate, 2023). This law prohibits Florida’s 12 public colleges and universities from accepting money from or partnering with entities in China or other designated “countries of concern,” and offering research contracts to individuals from such countries (Mervis, 2023a). According to one report, exceptions to these prohibitions are allowed only when the
___________________
23The earlier National Security Presidential Memorandum 33 (NSPM-33) implementation guidance from January 2022 contains a requirement that “[a]gencies must implement NSPM-33 provisions and related requirements in a nondiscriminatory manner that does not stigmatize or treat unfairly members of the research community, including members of ethnic or racial minority groups” (JCORE, 2022). See https://www.whitehouse.gov/wp-content/uploads/2022/01/010422-NSPM-33-Implementation-Guidance.pdf.
Board of Governors overseeing higher education in the state decides that the interaction is not detrimental to the safety or security of the United States or its residents (Qin, 2023). Waivers would be granted on a case-by-case basis for those seeking a research position as a graduate assistant or postdoc (Mervis, 2023a; Qin, 2023). Two University of Florida students and a faculty member, with backing from the American Civil Liberties Union, are currently challenging the validity of this law in court (Kumar, 2024).
International collaboration has become more challenging. Papers coauthored by researchers in the United States and China dropped by up to 25 percent in recent years (Wagner, 2024a; Wagner and Cai, 2022b). There is widespread fear and confusion among both Chinese and non-Chinese researchers regarding what constitutes permissible and impermissible activities in international collaboration, particularly for collaborations with researchers in China. Faculty members are experiencing pressure to disengage from both long-standing and new international collaborations crucial to the goals of institutions and federal agencies (Nature, 2021). What was previously one of the most vibrant, productive, and successful channels of global scientific cooperation is now dwindling rapidly (American Academy of Arts & Sciences, 2021).
U.S. Customs and Border Protection frequently stops and interrogates Chinese American scientists when they return from overseas trips (Fischer, 2023). Numerous students and postdoctoral fellows have faced intimidation and have been detained or deported as they try to enter the United States to begin or continue their training (Gewin, 2024; Prasso, 2024). There is a pressing need to develop transparent federal international travel policies and to improve coordination between the Department of State and the Department of Homeland Security on the risk factors determining admissibility of students and scholars from China and other countries of concern. Furthermore, there is a need for the U.S. government to “engage with university and Asian-American groups to limit [the] inadvertent harm of policies or enforcement actions on academic researchers” (DHS, 2024a).
International students and scholars also may encounter pressures to act on behalf of their home country or be subject to political pressures that may be considered transnational repression. Transnational repression refers to the practice by which individuals or groups are targeted by authoritarian regimes beyond their borders, often through extrajudicial means and with the intent of suppressing dissent, silencing opposition, or punishing perceived threats to their power (DHS, 2024a; Gorokhovskaia and Vaughan, 2024). This can take the form of harassment, intimidation, surveillance,
abduction, unlawful deportation, and even assassination (DHS, 2024a; Gorokhovskaia and Vaughan, 2024).
Transnational repression is an emerging and not yet fully understood facet of foreign malign influence—and a national security concern—that universities should be aware of when welcoming and supporting international students and scholars (DHS, 2024a). There are serious implications for academic freedom and for freedom of expression of targeted students and scholars (DHS, 2024a; Gorokhovskaia and Vaughan, 2024; Mandour, 2022).
THE CURRENT GEOPOLITICAL LANDSCAPE
The committee notes this report is being released in August 2024, in the lead up to the November 2024 presidential election. It is expected that congressional focus on national security concerns over China will intensify as 2024 continues, particularly given the ongoing work of the House Select Committee on the Strategic Competition between the United States and the Chinese Communist Party (Goldstein, 2024; Tollefson et al., 2024). The Select Committee released RESET, PREVENT, BUILD: A Strategy to Win America’s Economic Competition with the Chinese Communist Party, a report containing 150 policy recommendations, in December 2023 (U.S. Select Committee on the CCP, 2023). The report contains a key finding that “the PRC exploits the openness of the U.S. research environment to steal U.S. IP and transfer technology to advance its economic and security interests to the detriment of the United States,” which is tied to report Recommendation 4, “Strengthen U.S. research security and defend against malign talent recruitment,” and eight specific policy actions affecting academia and other sectors (U.S. Select Committee on the CCP, 2023). This report also notes that the United States “must bolster its unique advantages in technological development by funding research, incentivizing innovation, and attracting global talent in critical areas” (U.S. Select Committee on the CCP, 2023).
The Biden administration has adopted a bundle of international STEM talent policies designed to provide more certainty and predictability for foreign-born “STEM scholars, students, researchers and experts to contribute to innovation and job creation efforts across America” (White House, 2022). These policy-level actions by the Departments of Homeland Security and State are pursuant to agency regulations under current authorities Congress has already provided federal departments and agencies. While these actions do not replace congressional action to modernize the
governing immigration statute, such administrative actions could be consequential, at least in the aggregate. Monitoring the full implementation of such existing authorities at DHS and the State Department, and the effects thereof, could be invaluable in attracting and retaining international scientists, technologists, and engineers (Rampell, 2022; Tollefson et al., 2024).
International STEM talent policies the Biden administration has announced include the following:
- Department of State:
- Early-Career STEM Research Initiative, allowing foreign-born STEM experts, at all academic levels, to come to the United States to conduct and participate in STEM R&D efforts, hosted by industry on J-1 visas (Bureau of Educational and Cultural Affairs, n.d.a).24
- Expanding academic training for STEM graduates on J-1 visas, permitting up to 3 years of postcompletion employment authorization for international students earning STEM degrees in the United States on J-1 exchange visitor visas, on par with students with F-1 visas (Bureau of Educational and Cultural Affairs, n.d.c).25
- Department of Homeland Security:
- Update the designated fields list for postcompletion STEM Optional Practical Training in both 2022 (adding 22 fields) and 2023 (adding 8 fields), to reflect new, largely multi-disciplinary fields of study, expanding the STEM fields in which international students may remain in the United States and work, whether in industry, government, or academia, after earning their degree (DHS, 2022a, 2023c).
- Policy guidance on O-1 visas,26 providing written guidance for the first time since the O-1A category was created by
___________________
24The J-1 exchange visitor visa is for educational and cultural exchange programs designated by the Department of State, Bureau of Educational and Cultural Affairs.
25The F-1 academic student visa allows an individual to enter the United States as a full-time student at an accredited college, university, seminary, conservatory, academic high school, elementary school, or other academic institution or in a language training program.
26The O-1 nonimmigrant visa is for an individual who possesses extraordinary ability in the sciences, education, business, or athletics (O-1A), or in arts, including the motion picture or television industry (O-1B), and has been recognized nationally or internationally for those achievements. See https://www.uscis.gov/working-in-the-united-states/temporary-workers/o-1-visa-individuals-with-extraordinary-ability-or-achievement.
- Congress in 1990 as to how STEM Ph.D.s may qualify, by updating the U.S. Citizenship and Immigration Services (USCIS) Policy Manual, including an appendix table, to clarify for both agency adjudicators and stakeholders how USCIS evaluates evidence to determine eligibility for O-1A nonimmigrants of extraordinary ability (USCIS, 2024a).
- Policy guidance on national interest waivers, providing written guidance for the first time on how STEM master’s or Ph.D.s may qualify for Green Card eligibility if their work is of substantial merit and in the national interest, by updating the USCIS Policy Manual to address requests for national interest waivers for advanced STEM-degree professionals, providing some objective criteria for when work is typically in the national interest, such as when a noncitizen is working in a critical and emerging technology field27 or an endeavor tied to the annual R&D priorities28 identified by the OSTP and Office of Management and Budget directors.
President Biden’s Executive Order on the Safe, Secure, and Trustworthy Development and Use of Artificial Intelligence (October 30, 2023) also addresses the criticality of international STEM talent (Biden, 2023). This executive order includes provisions in Section 5.1 specifying that departments and agencies explore further avenues to facilitate the attraction and retention of foreign-born STEM experts working in AI and other critical and emerging technologies (Section 5.1 incorporates by reference Section 3(h) of the executive order on the Critical and Emerging Technologies List Update developed by the interagency through the National Science and Technology Council) (Biden, 2023; NSTC, 2024). In particular, Executive Order 14410 Section 5.1 mandates include the following:
- Department of Labor shall consider updating “Schedule A,” which would identify categories of STEM employment where a U.S.
___________________
27The current U.S. government list of critical and emerging technologies is available at https://www.whitehouse.gov/wp-content/uploads/2024/02/Critical-and-Emerging-Technologies-List-2024-Update.pdf.
28The U.S. government “Multi-Agency Research and Development Priorities for the FY 2025 Budget” memorandum is available at https://www.whitehouse.gov/wp-content/uploads/2023/08/FY2025-OMB-OSTP-RD-Budget-Priorities-Memo.pdf.
- employer could go directly to DHS to sponsor a foreign STEM expert for Green Card status.
- Department of State shall evaluate revising how the 2-year home residency requirement for J-1 visa holders is administered based on the “Skills List” and consider reinstating, and possibly expanding, the domestic visa reissuance program.
- DHS shall finalize “H-1B Modernization”29 and “Adjustment of Status” regulations and ensure fulsome policy implementation for O-1A and National Interest Waivers.
___________________
29The H-1B is a temporary (nonimmigrant) visa category that allows employers to petition for highly educated foreign professionals to work in “specialty occupations” that require at least a bachelor’s degree or the equivalent. Jobs in fields such as mathematics, engineering, technology, and medical sciences often qualify. Typically, the initial duration of an H-1B visa classification is 3 years, which may be extended for a maximum of 6 years.


