International Talent Programs in the Changing Global Environment (2024)
Chapter: 4 Attracting and Retaining Foreign Talent in the United States
4
Attracting and Retaining Foreign Talent in the United States1
Unlike other countries with national government programs to attract and retain foreign talent, as described in Chapters 5 and 6, the United States does not have a comparable, coordinated program that exists across the federal government, or an overarching office dedicated to this purpose (Zwetsloot, 2021). Rather, the United States attracts international science, technology, engineering, and mathematics (STEM) talent because of its research universities, open research environment, free exchange of ideas, and regional innovation clusters (Stephan et al., 2015).2 Attracting and retaining talent is thus highly distributed, but both are affected strongly by programs and policies administered by individual federal agencies and departments. These policies touch a multitude of topics, from research funding, priorities, and restrictions to visas, employment, and immigration. This chapter analyzes historical trends in the attraction and retention of foreign STEM talent in the United States, as well as the current state of play.
Graduate study in STEM fields represents a wide funnel through which many talented individuals come to the United States. The principal funding mechanism for graduate students and postdocs, both foreign
___________________
1This chapter incorporates material from the commissioned paper “International Talent Flows to the United States” by Jeremy Neufeld and Divyansh Kaushik.
2The committee notes that the Hefei Statement on The Ten Characteristics of Contemporary Research Universities, developed in 2013, is a valuable resource that articulates the key characteristics that make research universities effective. See https://www.aau.edu/sites/default/files/AAU-Files/Scholarship/Hefei_statement.pdf.
and domestic, is via grants and contracts awarded to their institutions by government agencies, nonprofit foundations, and private corporations. Given this, overall research funding levels directly affect the capacity of universities to recruit talent. Some agencies and programs may restrict participation on projects they fund to U.S. citizens and permanent residents (Elias et al., 2024). Although direct fellowship funding to individuals represents a small fraction of the total funding for students and postdocs in STEM fields, the committee compiled examples of such programs and noted which of these opportunities are open to non-U.S. citizens or permanent residents (see Appendix E). Other than early-career programs for doctoral degree holders in universities and national laboratories, direct federal funding of noncitizens is generally insignificant. The scale and strength of the U.S. research enterprise writ large is much more important to the attraction and retention of talent than are individual programs aimed at talent recruitment. Maintaining the strength of this enterprise is therefore critical to the United States’ competitiveness in attracting and retaining foreign talent.
INTERNATIONAL TALENT IN THE UNITED STATES
Why Does Foreign Talent Come to the United States?
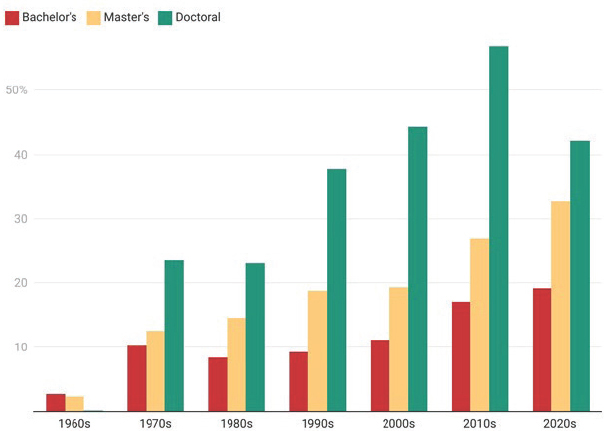
Higher education is a major recruitment tool for international talent (Chen, 2023; Stephan et al., 2015). In 2021, 49 percent of foreign-born college graduates in the United States pointed to educational opportunities as a reason for originally coming here (NCSES, 2021a). Figure 4-1 highlights how educational opportunities, particularly at the graduate level, have become an increasingly important reason for foreign college graduates to come to the United States (JASON, 2019; Olszewski et al., 2024). Among college graduates who arrived in the United States during the 2010s, 71 percent of doctoral degree holders and 59 percent of master’s degree holders pointed to education as motivation for coming to study in the United States, up from 64 percent of doctoral degree holders and 55 percent of master’s degree holders who arrived in the 1980s. The slow downward trend in bachelor’s degree recipients (i.e., those who come to the United States for undergraduate studies) attracted by educational opportunities may reflect the increasing number and quality of universities around the world, including in China and India (Belkin and Hua, 2022; Bothwell, 2023; Jack, 2023; Morrison, 2023; Nuwer, 2023; Tan, 2021).

SOURCE: National Survey of College Graduates (NCSES, 2021a).
In addition to educational opportunities, many foreign-born college graduates cite U.S. scientific and professional infrastructure and job and economic opportunities available in the United States as reasons for originally coming here, as shown in Figures 4-2 and 4-3 (Olszewski et al., 2024). Not only has the U.S. government historically invested in cutting-edge research infrastructure, but the United States is home to a vibrant technology sector. As the Global Innovation Index 2023: Innovation in the Face of Uncertainty confirms, when looking at the intensity of science and technology activity around the world, the United States boasts the most clusters of such activity in the top 25 compared with all other countries (WIPO, 2023d). The United States has eight clusters (Silicon Valley, California; Cambridge, Massachusetts; Ann Arbor, Michigan; San Diego, California; Seattle, Washington; Raleigh, North Carolina; Minneapolis, Minnesota; and Pittsburgh, Pennsylvania) in the top 25 in terms of high intensity per capita employment, patenting, and publishing in science and technology. China has one cluster, and no countries other than the United States have more than three clusters. If a STEM professional is considering
SOURCE: National Survey of College Graduates (NCSES, 2021a).
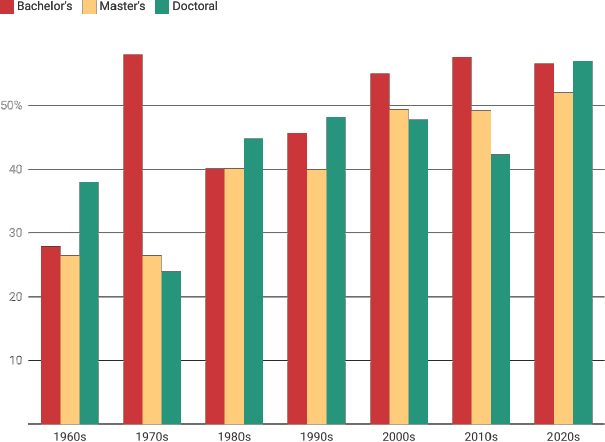
SOURCE: National Survey of College Graduates (NCSES, 2021a).
the likelihood of being able to pursue interesting work in an exciting STEM ecosystem, they have many options across the nation. Not surprisingly, it is those pursuing advanced degrees who are most strongly attracted by the United States’ extensive research and innovation infrastructure (Olszewski et al., 2024).
In contrast, as shown in Figure 4-3, both undergraduate and graduate students are attracted in roughly equal proportions by job and economic opportunities3 in the United States. However, as shown below, those with advanced degrees are much more likely to remain in the United States after completion of their degrees and any optional training.
How Much Foreign Talent Is Coming to Study in the United States and at What Educational Level?
U.S. government data on international talent are difficult to obtain online, dispersed among different data sources, and sometimes incomplete (Neufeld and Kaushik, 2024). While existing data are typically not classified, securing public access is often a long and difficult process. For example, the Student and Exchange Visitor Information System (SEVIS) data used for this analysis were received via a Freedom of Information Act (FOIA) request. In another case, a private organization also used a FOIA request to obtain data on approval rates for international student (F-1) visa applications. Ideally, a set of government metrics on international talent could be collected, organized, and made publicly available and easily accessible. The United States lacks sufficiently detailed information to assess its competitiveness relative to other countries, including data on the quality and profiles of the international students entering the country, international student outcomes in the United States, and the educational and career paths of international students after they arrive in the United States (NASEM, 2015).4
Figure 4-4 shows SEVIS data on the number of new international students enrolling in programs at U.S. universities between FY 2004 and
___________________
3The Economist posits that the quality of job opportunities in a country is the most important pull factor (The Economist, 2024b).
4The American Council on Education (ACE) convened experts to “develop a research agenda for tracking the career pathways of international students enrolled in U.S. universities” in November 2020 (Farnsworth, 2021). This culminated in the release of a report detailing career pathways for international students (Esaki-Smith, 2021). See https://www.acenet.edu/Documents/Career-Pathways-International-Students.pdf.

SOURCE: SEVIS data (DHS, 2023b).
FY 2020.5 The data show that the number of new international students commencing studies at U.S. colleges and universities doubled between 2004 (142,000 students) and 2019 (287,000 students). While this number declined in 2020 (136,000 students) because of the COVID-19 pandemic, F-1 visa issuances suggest that numbers have since recovered.
SEVIS data also show the changing composition of U.S. international enrollment. International enrollment in master’s programs has grown much faster than international enrollment in bachelor’s or doctoral programs. As a share of total international enrollment, master’s enrollment increased from 40 percent in 2004 to 46 percent in 2019. By contrast, bachelor’s enrollment declined from 43 percent to 41 percent over the same period, and doctoral enrollment fell from 17 percent to 12 percent.
___________________
5The SEVIS data provided for this analysis go through only 2020. The committee recognizes that the data from the year 2020 are likely to have been strongly influenced by the COVID-19 pandemic. Nevertheless, the committee concluded that the analysis of the available dataset was important to better understand longer-term trends in U.S. competitiveness for foreign talent.
From Where Does Foreign Talent Come to Study in the United States?
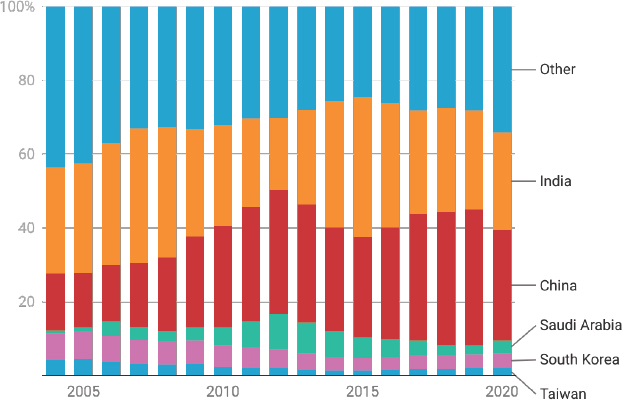
International students from around the world are drawn to study in the United States, but about half of new F-1 visa enrollees in any given year come from five locations (see Figure 4-5), which, in 2020, were China, India, South Korea, Saudi Arabia, and Taiwan. Japan used to be in the top five locations but has since declined significantly as a source for international students to the United States. Japanese F-1 visa student enrollments numbered 9,044 in 2004, falling to only 3,442 students in 2019.
China grew from the second-highest origin for new enrollees in 2004, when 13,686 Chinese F-1 visa students enrolled in U.S. programs, to become the clear leader. Surpassing India in 2009, it grew to 98,274 students in 2019, before falling to 35,375 students in 2020 because of the COVID-19 pandemic.
Talent from India makes up a significant fraction of annual student intake in the United States, second only to—and quickly approaching—the number of students coming from China (IIE, 2023b; Kerr, 2018; Rim, 2022).6 In fact, between the 2021/2022 and 2022/2023 academic years, the number of students coming from India increased by 35 percent, following a 19 percent increase between the 2020/2021 and 2021/2022 academic years. In comparison, the number of students coming from China fell by 0.2 percent between the 2021/2022 and 2022/2023 academic years, coming after a 9.4 decrease between the 2020/2021 and 2021/2022 academic years.7 The increase in the proportion of foreign students enrolled at the graduate level is due to the fact that a large number of Indian students pursue master’s degrees, while Chinese students were relatively more likely to pursue undergraduate studies when Chinese enrollment was at its peak (Fischer, 2024a, 2024b; Fischer and Bauman, 2023; IIE, 2023b; Kelchen and Barrett, 2024).
India is an attractive partner for the United States, both for its deep and rich pool of English-speaking scientific talent and its democratic governance. The Association of American Universities posits that “the United
___________________
6As of 2024, the numbers of students from China and India enrolled at U.S. institutions of higher education are very close. Different data sources disagree on whether India actually has surpassed China, with Department of Homeland Security (DHS) data (DHS, 2023a, 2024b) supporting this argument and IIE OpenDoors 2023 data (IIE, 2023b) still showing China with a slight edge.
7The committee notes the likelihood of talent flows and collaborations growing in the coming years between the United States and countries in other regions of the world, including Mexico, Brazil, and the Global South (American Academy of Arts & Sciences, 2020; Oliss et al., 2023).
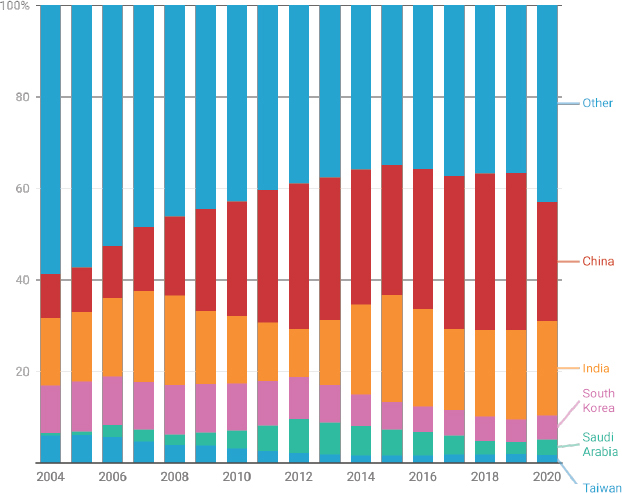
SOURCE: SEVIS data (DHS, 2023b).
States and India share an opportunity to strengthen both countries’ economies by enhancing educational attainment and investing more in research and development” (AAU, 2024). The relative lack of top, research-oriented academic and other institutions at the scale needed to satisfy demand in the country from students and employers is another reason the United States and other more developed countries are attractive to Indian talent.8
Individuals of Indian ancestry in the United States also contribute disproportionately to the innovation, commercialization, and high-tech industry in the United States. For example, as of 2022, Indian immigrants had founded 66 U.S. start-ups valued at over $1 billion, more than from any
___________________
8With this being said, the committee acknowledges the significant investment in higher education currently being made by the Central Government and State governments in India. This includes the establishment of six new Indian Institutes of Technology (IITs) in 2016, followed by an additional three new IITs in 2024 (Firstpost, 2015; Hazra, 2024; Karunakaran, 2023).
other country (Anderson, 2022). In comparison, Chinese immigrants had founded 21 companies valued at more than $1 billion (Anderson, 2022).
After China (289,526 students, or 27.4 percent of all international students, studying in the United States in 2022/2023) and India (268,923 students, or 25.4 percent of all international students studying in the United States in 2022/2023), subsequent source countries are much smaller contributors (IIE, 2023a). South Korea (43,847 students, or 4.1 percent of all international students studying in the United States in 2022/2023), Canada (27,876 students, or 2.6 percent of all international students studying in the United States in 2022/2023), and Vietnam (21,900 students, or 2.1 percent of all international students studying in the United States in 2022/2023) round out the top five nations from which international talent come to study in the United States (IIE, 2023a).9
What Are International Students Studying in the United States?
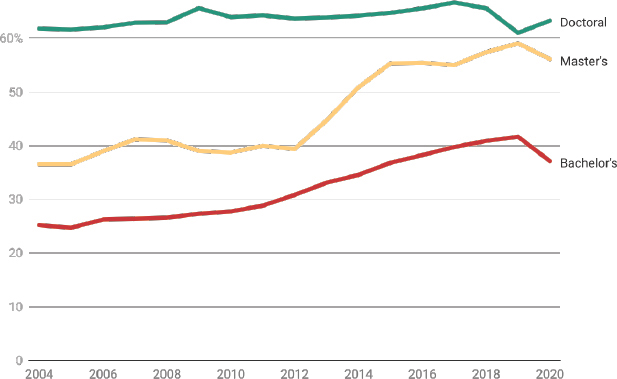
STEM education is increasingly important for foreign students studying in the United States. In 2004, only 36 percent of F-1 students enrolling in new programs were pursuing degrees in STEM fields. By 2020, that share had risen to 50 percent. As shown in Figure 4-6, interest in pursuing STEM degrees in the United States is strongest among those pursuing doctoral degrees, where over 60 percent of F-1 enrollments are in STEM programs. This share has remained fairly consistent from 2004 to 2020. The interest of master’s degree students in STEM has risen from 37 percent in 2004 to 56 percent by 2020, converging toward the STEM share in doctoral programs. The share of international students studying STEM also has increased in bachelor’s programs, rising from 25 percent to 37 percent.
Looking only at STEM fields reveals broadly similar patterns to those encountered overall (see Figure 4-7). China surpassed India in 2010 and declined from a peak in 2015 at 57,594 new enrollments in STEM fields. South Korea has grown slowly over this period, from 3,526 students studying STEM in 2004 to 5,405 students studying STEM in 2019. Regarding specific areas of study, over half the doctoral students studying engineering were non-U.S. citizens with temporary visas, and approximately half of those studying computer and mathematical sciences were non-U.S. citizens
___________________
9Taiwan is a very close sixth, with 21,834 students, or 2.1 percent of all international students studying in the United States in 2022/2023 (IIE, 2023b).
SOURCE: SEVIS data (DHS, 2023b).
SOURCE: SEVIS data (DHS, 2023b).
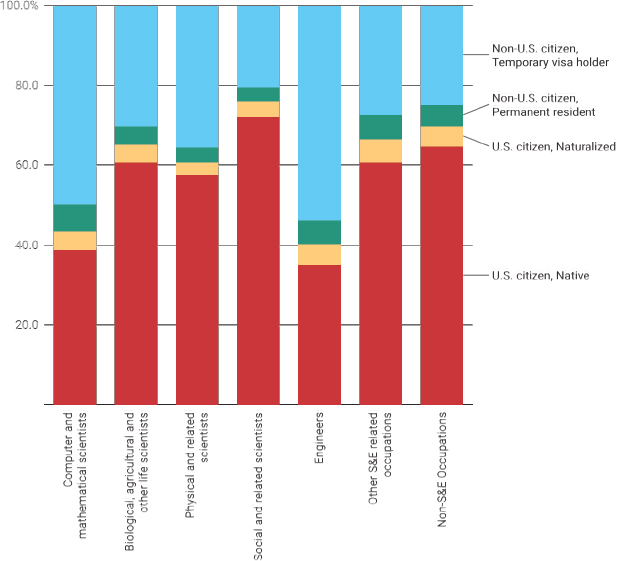
SOURCE: Survey of Doctorate Recipients (NCSES, 2021b).
on temporary visas. U.S. citizens, either native or naturalized, accounted for the majority of students pursuing Ph.D.s in other STEM fields.
Figure 4-8 presents fields of employment for U.S. doctoral recipients by citizenship and immigration status at time of degree completion.
IMMIGRATION AND VISA-RELATED PROVISIONS FOR RETAINING TALENT
International graduates of U.S. colleges and universities have grown less likely to stay in the United States as naturalized citizens or permanent residents. This is the result of a combination of factors, including the strict numerical limitations on employment-based Green Cards and the increasing foreign-born share of college graduates, given that much of the growth in
doctoral degrees in the United States since 1980 has been driven by international students, as shown in Figures 4-9 and 4-10. This trend is likely to continue for the foreseeable future, since the number of international science and engineering graduate students jumped from a pandemic-influenced low of around 200,000 in 2020 to more than 300,000 in 2022 (NSB, 2024d). This enrollment increase will result in a corresponding increase in advanced degrees awarded to international students in the second half of this decade.
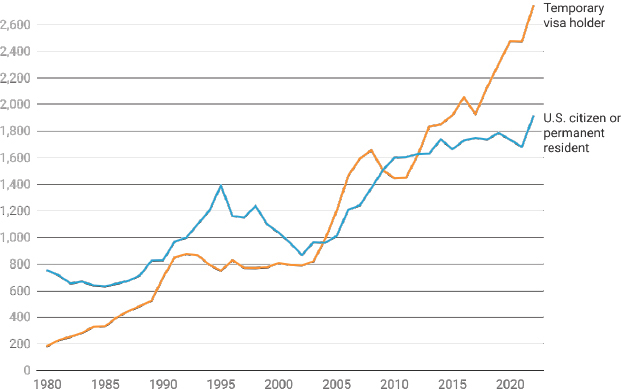
The growth of international doctoral degree recipients is not uniform across fields of study. Disciplines such as mathematics and computer science, essential to advances in critical and emerging technologies such as artificial intelligence (AI), have shown much sharper growth in the number of doctoral degrees earned by international students. As illustrated in Figure 4-10, the number of foreign recipients of doctoral degrees in math and computer science from U.S. universities now exceeds the corresponding number of U.S. citizens and permanent residents.
How Does Foreign Talent in STEM Stay in the United States?
Universities offer significant funding to international students, especially doctoral students, to attract them to their institutions (see
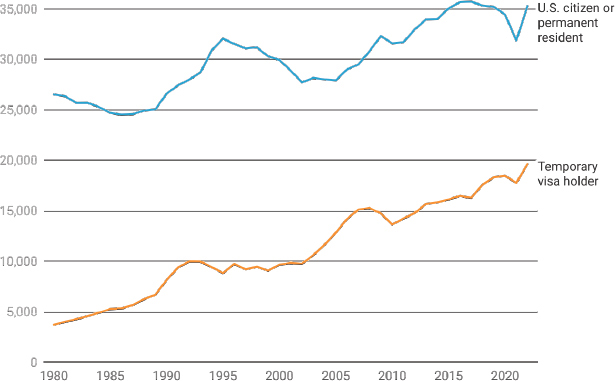
SOURCE: Survey of Earned Doctorates (NCSES, 2022).
SOURCE: Survey of Earned Doctorates (NCSES, 2022).
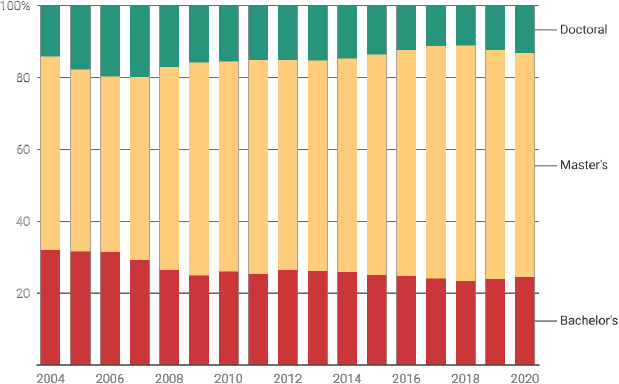
Figure 4-11). Federal research grants, funded by U.S. taxpayer dollars, support many of these students (Hoff and Kessler, 2024; NSB, 2024b). In 2021, the U.S. government provided support to 15 percent of full-time science and engineering graduate students, down from a high of 21 percent in 2004 (NSB, 2024d). A much larger share of doctoral students (26 percent) than master’s students (5 percent) are supported by federal funds (National Science Board, 2024b). These numbers reflect the focus of federal investment in research and research-based degrees. However, the overall investment in international students by U.S. universities is much broader. For example, the initial funding offered by universities to international students in the United States in 2018 amounted to $2.7 billion according to SEVIS data (see Figure 4-12), which includes funding for only that year and does not include the entire funding offered over the course of students’ degree programs. Of that $2.7 billion, $1.2 billion was for doctoral students, $700 million was for master’s students, and $900 million was for bachelor’s students. These numbers include all fields and the support of students via scholarships, non-research assistantships (e.g., teaching assistantships), and other mechanisms. Nevertheless, they are indicative of the substantial investment by domestic sources beyond the
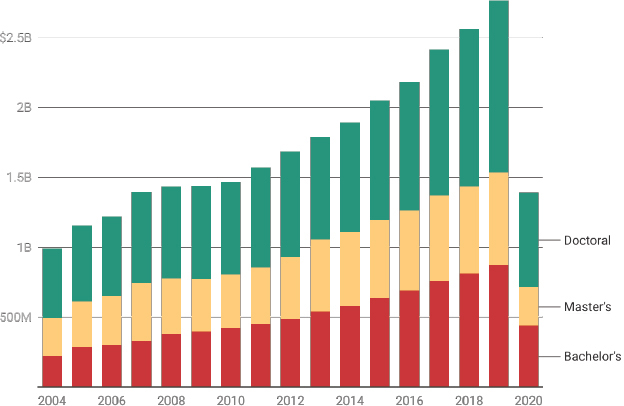
SOURCE: SEVIS data (DHS, 2023b).
federal government in international students. On the other hand, the more than one million international students studying at U.S. institutions of higher education during the 2022–2023 academic year contributed more than $40 billion to the U.S. economy and supported more than 368,000 jobs (NAFSA, 2023).10
Since the 1950s, international students can receive work authorization on their student visas during or after their courses of study, as part of their educational experience. This authorization is known as “practical training” for F-1 students and “academic training” (AT) for J-1 students. Curricular practical training (CPT) is part of the curriculum, necessary for one’s major, and must be conducted during the program. Optional practical training (OPT) must be related to the course of study but is not necessarily tied to the curriculum (Wilson, 2024). Both OPT and AT permit participants to work either while they complete their course of study or after graduation. CPT, OPT, and AT all are strictly limited in duration. CPT cannot extend past a program’s end date, AT is capped at 18 months, and OPT is capped
___________________
10This makes higher education the United States’ sixth largest service export per 2020 data (DOS and ED, 2021; Raimondo, 2021).
at 12 months, with a 24-month extension afforded to individuals with STEM degrees (U.S. ICE, n.d.). Practical training is most common among master’s degree students, then bachelor’s, followed by doctoral students as highlighted by Figure 4-12.
CPT, OPT, and AT allow students an opportunity to get valuable work experience and further develop the skills they learned in school. Furthermore, practical training acts as a critical bridge between student and work visas. These programs afford international students the opportunity to contribute to U.S.-based enterprises while they attempt to secure another visa to remain in country. With increasing numbers of master’s-level graduates from India and other countries, who are more likely to fund their degree programs through loans, OPT programs may become more important to attracting and retaining these students (Swaminathan, 2017). As explained by the Department of Homeland Security (DHS), “Many employers who hire F-1 students under the OPT program eventually file a petition on the students’ behalf” (DHS, 2008; Neufeld, 2019). The share of OPT participants requesting status rose from 31 percent in 2004 to 39 percent in 2019. The share requesting status among practical training participants in STEM fields is even higher, at 45 percent in 2019.
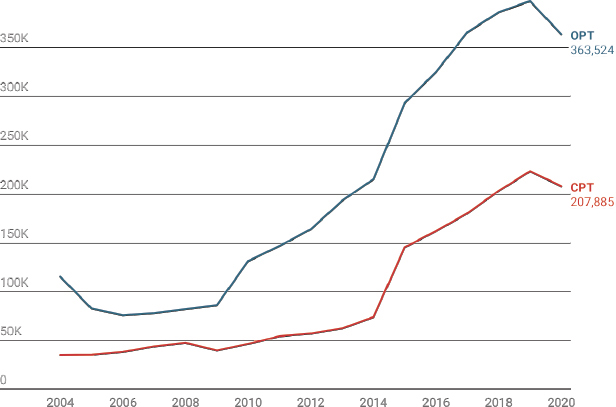
As shown in Figure 4-13, OPT and CPT have grown significantly in the last 20 years. In 2004, 149,824 foreign-born F-1 visa students were
SOURCE: SEVIS data (DHS, 2023b).
SOURCE: SEVIS data (DHS, 2023b).
working in the United States via OPT and CPT, of which 77 percent were on OPT. By 2019, 620,555 F-1 visa students were participating in practical training programs, although the share on OPT fell to 64 percent. This number declined during the COVID-19 pandemic to 571,409 F-1 visa students in 2020.
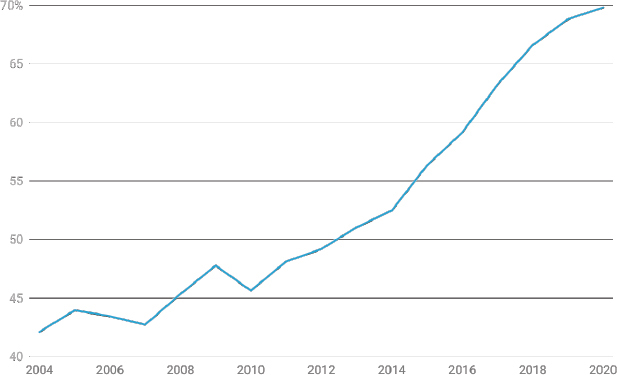
In 2008, the Bush administration established the STEM OPT extension, allowing F-1 graduates in STEM fields a longer period of work authorization—up to 29 months—on OPT. In 2015, the Obama administration increased the STEM OPT extension to 36 months. The effect has been both to increase the total number of foreign-born graduates working in the United States on OPT and to increase the STEM share of OPT participants (Demirci, 2019). The STEM share of OPT participants increased from 42 percent in 2004 to 70 percent in 2020 (see Figure 4-14).
Although practical training programs play an important role in permitting foreign recipients of STEM degrees to remain in the United States and to potentially seek visa status that would permit them to remain after their practical training, they are not without critics. Concerns expressed include the fact that employers do not pay payroll taxes on OPT workers, potentially creating an incentive for hiring such individuals over U.S. citizens,
SOURCE: SEVIS data (DHS, 2023b).
permanent residents, and those holding work visas (North, 2023). Some firms employing OPT workers have violated federal labor laws by withholding wages and utilizing restrictive employment contracts (Smith et al., 2014; Swaminathan, 2017). Other reports have suggested that the definition of STEM degrees is overly broad, and that the enlargement of the pool of OPT recipients who can subsequently apply for H-1B visas decreases the probability that those in critical and emerging technology fields will obtain work visas under the current lottery-based system, even with its carve-out for advanced degree holders (Rosenthal, 2021). Regardless of these issues, it is clear that these programs have become a significant option for international students wishing to remain in the United States after graduation, whether they ultimately seek a different visa status or not.
CHALLENGES IN RETAINING INTERNATIONAL STUDENTS
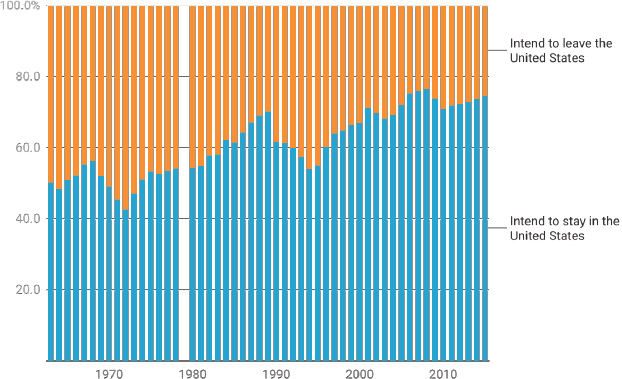
As shown earlier in this chapter, the motivating factors for international students to study in the United States vary with the level and field of the degree being pursued. It is not surprising, therefore, that the desire of international students to remain in the United States after graduation also varies significantly by degree level and field. Doctoral graduates are more likely to be in STEM fields (see Figure 4-6) and are more likely to remain
in the United States than international graduates at other levels of education. Figure 4-15 highlights that the share of foreign-born Ph.D. recipients intending to stay in the United States has increased over time to more than 70 percent. These intentions closely track with the reality of how many doctoral recipients actually remain in the United States. Of approximately 500,000 doctoral graduates from U.S. institutions in science, engineering, and health fields who were under the age of 76 in 2021, about 359,000 were still living in the United States in 2021, implying a long-term stay rate of about 72 percent. The “true” long-term stay rate may be slightly lower given that more recent graduating cohorts have had less time to depart the United States for other destinations.
One study using National Science Foundation (NSF) Survey of Doctorate Recipients (SDR) data found stay rates to be much higher for those receiving a STEM Ph.D. from a U.S. university between 2000 and 2015, with 77 percent of the 178,000 individuals in this category still in the country as of February 2017 (Corrigan et al., 2022; NCSES, 2021b). The higher stay rate for STEM Ph.D.s also holds for the 2021 NSF SDR data. Furthermore, the Institute for Defense Analyses’ Science and Technology Policy Institute found that of the 104,000 international STEM students (comprising 30,000 bachelor’s degrees, 60,000 master’s degrees, and 14,000 doctoral degrees) who graduated from U.S. colleges and universities in
SOURCE: Survey of Earned Doctorates (NCSES, 2022).
2021, approximately 75,000 to 76,000 chose to stay in the United States immediately following degree completion via the OPT program (Olszewski et al., 2024). This yields an initial stay rate of 72 to 73 percent, with long-term stay rates for international STEM doctoral recipients known to be around 75 percent (Olszewski et al., 2024).
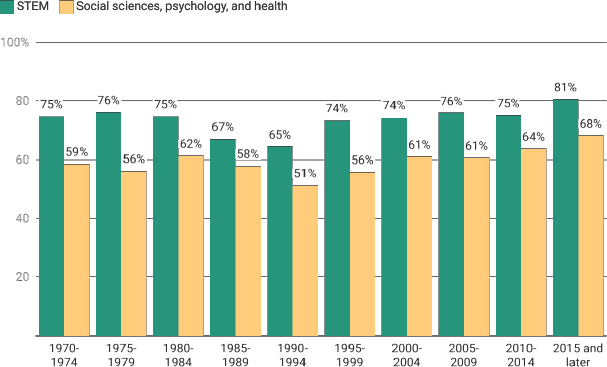
Stay rates are higher in STEM fields (minus health) than other fields. In the social sciences, psychology, and health fields, 61 percent of the approximately 102,000 graduates remain in the United States as of 2021. A breakdown by graduating cohorts is displayed in Figure 4-16 and shows a slight uptick in the stay rate of those receiving STEM degrees over time.
The data presented above demonstrate the level of success that the United States has historically enjoyed with foreign recipients of advanced degrees in STEM fields. However, because of the current lottery-based system for H-1B visas, it is important to consider the broader pool of potential H-1B applicants. Most international students do not stay in the United States following graduation, with family, personal, and cultural factors cited as the primary reasons for leaving (Olszewski et al., 2024). The difficulty of and duration associated with obtaining a temporary work visa or permanent residency can also be a factor, especially for those from China and India (Olszewski et al., 2024). According to SEVIS data, the share of F-1
SOURCE: Survey of Doctorate Recipients (NCSES, 2021b).
students requesting another status (e.g., H-1B, OPT/STEM OPT, O-1, or J-1) peaked in 2007 at 22 percent and has since fallen to 14 percent in 2020. Because students are most likely to request changes in status toward the end of their program of study, shares in recent years would be expected to be held down by students who are still pursuing their courses of study. Nevertheless, negative trends, especially for China, are still evident after taking this into account. While F-1 students may stay in the United States without requesting a change of status (e.g., after temporarily returning home), this is suggestive evidence of low stay rates. This finding is in line with existing indirect estimates of stay rates of foreign graduates in the United States, with one group of economists concluding that “only 10 to 20 percent of foreign graduates work in the United States even in the short run, likely the result of visa and policy restrictions” (Beine et al., 2022). Around 11 percent of international students receiving bachelor’s degrees and 23 percent of international students obtaining master’s degrees stay in the United States after completing their studies, in contrast to the stay rates of STEM Ph.D.s that exceed 70 percent (Beine et al., 2022; Marcus, 2023; O’Brien, 2024; Olszewski et al., 2024; Sutherland and Chakrabarti, 2023; Zwetsloot, 2021).
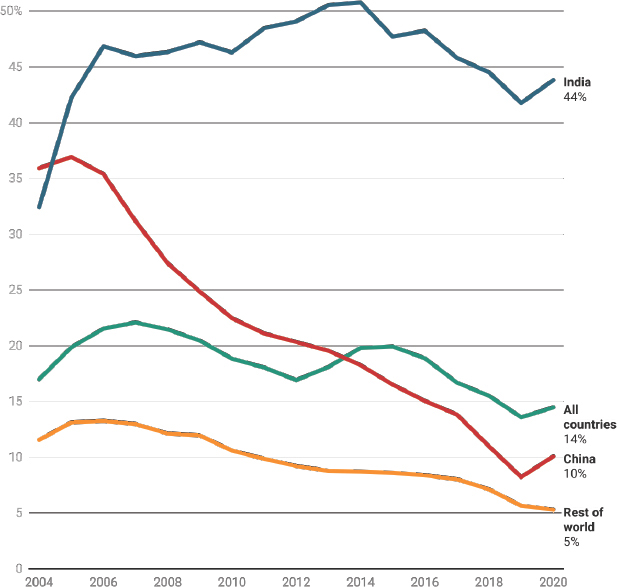
There is significant variation by country of origin in requests for changing visa status. Indian students are more likely than others to request a change in status, but less than 50 percent of F-1 students from India ever do so. Among Chinese students, the number was comparable to Indian students in 2004, when 36 percent of new Chinese F-1 enrollees went on to request another status. However, that number has declined sharply to about 10 percent.11 Only 5 to 10 percent of F-1 students from the rest of the world request a change in status, a rate which has even slightly declined. Figure 4-17 tracks the rate of students from China, India, and the rest of the world requesting another visa status from 2004 to 2010.
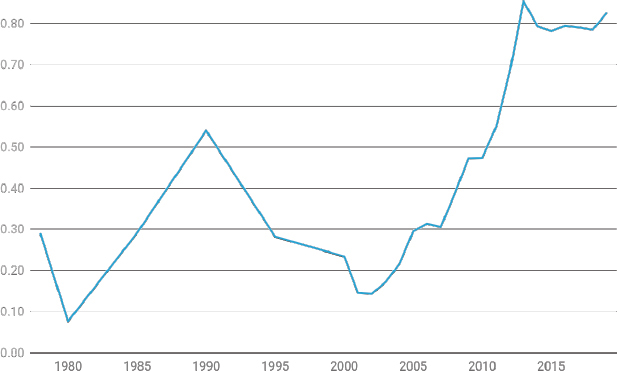
The declining interest of Chinese students in staying abroad is also evident in statistics from the National Bureau of Statistics of China, which reports figures both on the total number of students studying abroad each year as well as on the number of returning students. As shown in
___________________
11Reasons for the decline in the number of Chinese students requesting a change in visa status (e.g., going from a F-1 visa to an H-1B visa) include but are not limited to COVID-19 pandemic-related visa delays, other attractive educational and employment destinations such as those described in Chapter 5, and the changing geopolitical environment and perception of the United States (Boundless, 2022; Groenewegen-Lau and Hmaidi, 2024; Hua et al., 2022; Liu, 2023; Rim, 2022).
SOURCE: SEVIS data (DHS, 2023b).
Figure 4-18, the ratio of returning students to students studying abroad has significantly increased since the early 2000s.
While international education is the United States’ largest recruitment program for high-skilled talent, and OPT and CPT offer some opportunities for work authorization, their limited duration and connection to programs of study make them inadequate for recruitment of talent long-term. Temporary visa programs are the critical on-ramp for international talent.
The H-1B visa for specialty occupations is the largest of these programs for high-skilled talent. For most employers, H-1Bs are capped at 85,000 new visas per year (20,000 of which are reserved for advanced degree holders), but universities and related nonprofit entities, nonprofit research
SOURCE: National Bureau of Statistics of China, n.d.
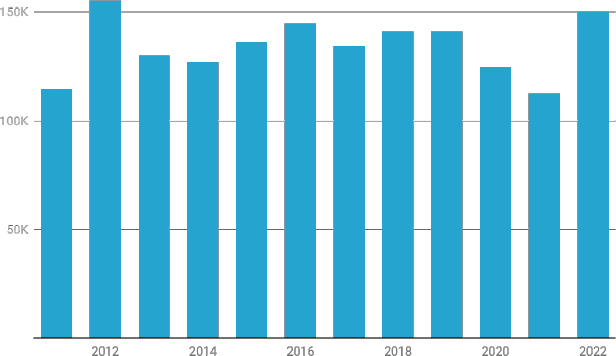
organizations, and government research organizations are exempt from this cap. Data on initial H-1B petitions filed reveals fluctuations in the demand for this visa category. Between FY 2011 and FY 2020, initial H-1B petitions hovered around 100,000–150,000 per year (see Figure 4-19).
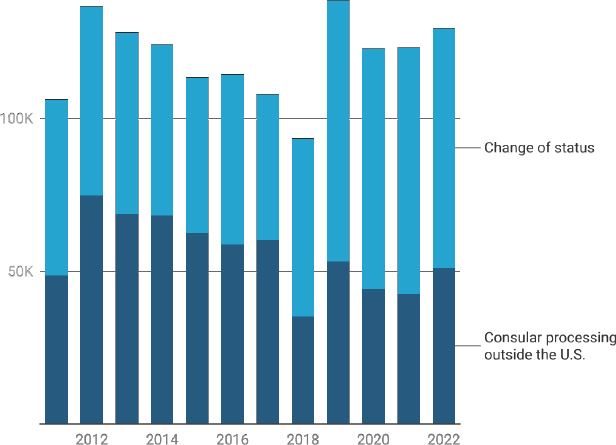
While F-1 student visas are mostly awarded to individuals outside the United States, the majority of H-1B visas go to individuals already within the United States with a prior visa status, including students. Said differently, the H-1B visa is a retention visa as much as a recruitment visa. Consular processing accounted for 51,329 visa approvals in FY 2022, a significant increase from 42,729 approvals in FY 2021. This indicates a recovery in international mobility following disruptions related to the COVID-19 pandemic. Conversely, approvals for change of status within the United States saw a slight decrease from 80,685 in 2021 to 78,340 in 2022. Nevertheless, 59 percent of H-1Bs were still going to individuals adjusting status (see Figure 4-20).
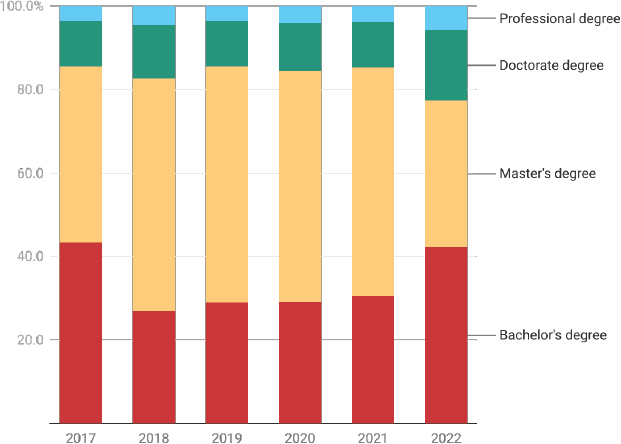
DHS data also show the distribution of H-1Bs across education levels. As shown in Figure 4-21, most H-1Bs go to advanced degree holders. This is largely explained by the 20,000 visas set aside for advanced degree holders, along with cap-exempt employers such as universities being much more likely to hire individuals with advanced degrees than cap-subject
SOURCE: Department of Homeland Security (DHS, 2023b).
SOURCE: Department of Homeland Security (DHS, 2023b).
SOURCE: Department of Homeland Security (DHS, 2023b).
employers. In FY 2022, individuals with a bachelor’s degree accounted for 41,597 approvals, master’s degree holders were the beneficiaries of 34,476, and doctorate holders increased with 16,569 approvals.
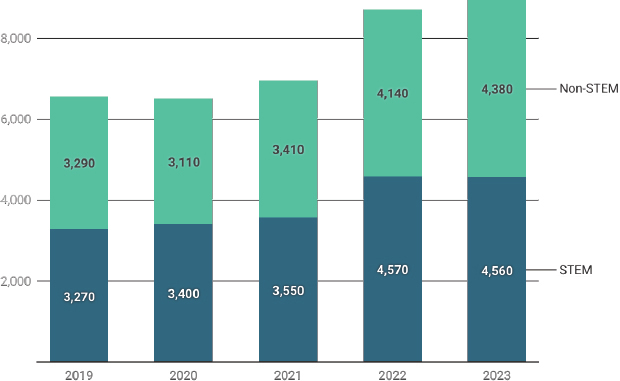
The O-1A visa for individuals of extraordinary ability in the sciences, education, business, or athletics is much smaller in scope than the H-1B. However, the O-1A visa is an important pathway for top-tier talent, as an uncapped program for people at the cutting edge of their field. The data on O-1A visa issuance from FY 2019 to FY 2023 reveals an increasing trend in both STEM and non-STEM fields (see Figure 4-22), with STEM seeing a notable rise from 3,270 in 2019 to 4,560 in 2023, and non-STEM increasing from 3,290 to 4,380 during the same period. This upward trend suggests the O-1A visa is becoming an increasingly viable pathway for individuals of extraordinary ability in their respective fields to work in the United States, reflecting growing certainty and predictability after new guidance was issued about the visa in 2022 (USCIS, 2022). However, despite modest gains compared to its potential, its use remains low. While the O-1A visa could be better promoted to universities and businesses as an option to retain international talent, it presents known issues that could
SOURCE: Department of Homeland Security (DHS, 2023b).
make this visa a less attractive option. These include short renewal periods and a lack of employment authorization afforded to spouses and children, unlike with H-1Bs.
For most international talent, staying in the United States long-term requires applying for permanent residency. For example, H-1B holders cannot renew their visas beyond 6 years without first applying for permanent residency. In addition to aiding in the retention of high-skilled immigrants, obtaining permanent residency affords those immigrants more opportunities to contribute to U.S. science and innovation, making it easier to take their talents where they can do the most or even launch ventures of their own.
Employment-based Green Cards are capped at 140,000 per year, with occasional rollovers from other categories (Kahn and MacGarvie, 2018). There are also per-country caps that restrict any one country from contributing more than 7 percent of the total number of Green Cards issued annually, leading to a backlog of 1,058,169 petitioners waiting for an employment-based Green Card to be issued to them (USCIS, 2023a). The number of unique petitions does not account for spouses and children who would accompany a petitioner and that also count toward the employment-based Green Card cap once a Green Card is issued to a petitioner.
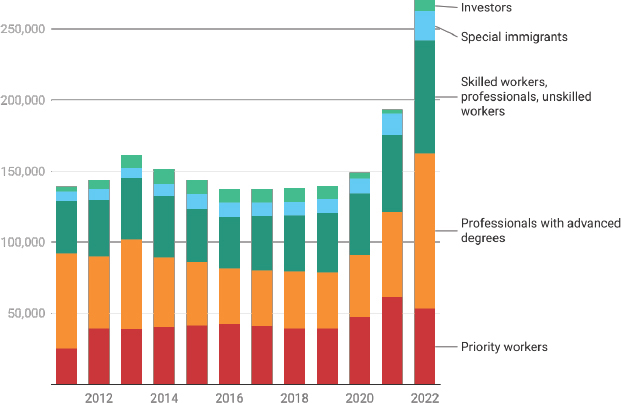
The current situation is so dire that if a Nobel Prize–winning chemist or a Turing Award–winning AI scientist born in India were to seek a Green Card today, applying in Employment-Based First Preference Category (EB-1), one would not be available to them despite their exceptional ability and qualifications (DOS, 2024). The Congressional Research Service estimates that the wait time for Employment-Based Second Preference Category (EB-2) Green Cards for professionals with advanced degrees or individuals of exceptional ability was 195 years for immigrants from India if they applied in 2020 and is expected to grow to 436 years by 2030 (Kandel, 2020). Figure 4-23 presents the distribution of employment-based Green Cards across the five priority preference categories.
The number of employment-based Green Cards issued saw an almost 100 percent increase in FY 2022 over the allocated cap of 140,000. This can be attributed to consulate closures in FY 2021 as a result of the COVID-19 pandemic, which led family-based Green Cards to go unused and subsequently resulted in a rollover to the employment-based category in FY 2022. This will return to historical levels in upcoming years. This consensus study report asserts that employment-based Green Cards are mostly about retention rather than recruitment, with most slots going to individuals already in the United States (see Figure 4-24).
SOURCE: Department of Homeland Security (DHS, 2023b).
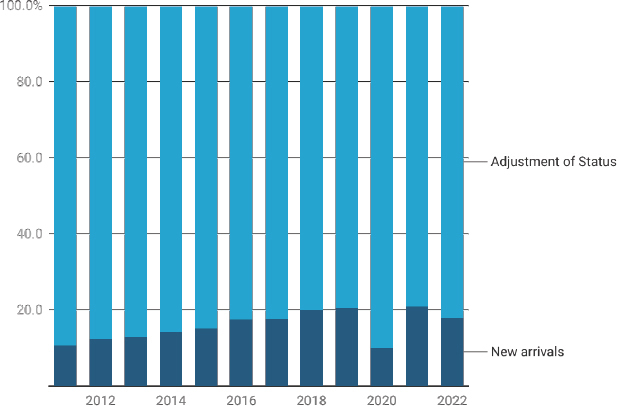
SOURCE: Department of Homeland Security (DHS, 2023b).
PERCEPTIONS ARE CHANGING, AND NOT FOR THE BETTER
While the United States remains a major destination for international talent, to its great benefit, immigration issues and global competition are acting as a drag on recruitment and retention (Olszewski et al., 2024).12 This limits the promise that international scientists, engineers, technologists, and others offer the U.S. economy and U.S. scientific enterprise. However, there are policy-based opportunities to bolster its competitive edge in attracting and retaining international talent.
Highly qualified researchers have a choice of where to build their careers, and their decisions rest heavily on considerations related directly to the research environment: the likelihood of robust external funding
___________________
12Lumina Foundation President and CEO Jamie Merisotis writes that “while Washington bickers and fiddles, our global competitors, like sharp human resource managers, are luring away talented men and women who might otherwise arrive on our shores, using smarter and simpler laws” (Merisotis, 2015).
support,13 salary levels, team quality, and the likelihood of continued professional advancement. They also rest on broader considerations related to quality of life. In all of these respects, the United States has long been perceived as one of the most desirable locations for researchers. The nation’s commitment to open collaboration in basic research is highly attractive to researchers around the world, along with the nation’s commitment to “accountability, objectivity, fairness, and integrity” as key values underpinning the scientific enterprise (Colglazier, 2023). The United States is perceived as a country that prizes innovation and entrepreneurship, and it enjoys a long history and tradition of being an immigrant-friendly culture, fostering commitment to the principle of economic opportunity for all (Allison and Schmidt, 2022).
Indeed, some of the nation’s most important advantages in attracting and retaining talent are the intangibles: values, freedom, and opportunity. This makes these advantages particularly vulnerable to changes in perception of the United States as an open and welcoming environment for foreign researchers. Unfortunately, developments in recent years have created negative perceptions of the United States as a destination of choice for pursuing a scientific research career and building a personal life and family.14
The overall debate surrounding immigration has created a perception that the United States is increasingly hostile to foreigners (Ma, 2023; Olszewski et al., 2024). This view is supported by recent changes in (and stress on) the immigration system that have led to long delays in visa processing and in certain areas to a restriction on the availability of Green Cards (Knox, 2024; Mitchell, 2024). To this end, the United States’ talent attractiveness score, as calculated by the Organisation for Economic Co-operation and Development is dragged down by a complex, restrictive, and inefficient immigration system (OECD, 2023e). Between 2019 and 2023, the U.S. attractiveness score decreased from 0.65 to 0.58, dropping the United States from being ranked first to eighth worldwide (OECD,
___________________
13The committee notes the current state of research funding in the United States— namely that “decreased discretionary funding at the federal and state level is creating a hyper-competitive environment between government agencies (e.g., EPA, NIH, CDC), for scientists in these agencies, and for academics seeking funding from all sources” (Edwards and Roy, 2017). This is particularly pervasive in the life sciences and biomedical research (Alberts et al., 2014; DORA, 2020; Fochler et al., 2016). Some have argued for the adoption of alternate approaches to allocate research funding, such as lotteries (Nature, 2022; Schaubroeck, 2022).
14The JASON independent science advisory group states that “[f]or its own sake, the United States should avoid the risk of creating an impression that it is not a welcoming place for foreign students” (JASON, 2024).
2019, 2023e). Furthermore, certain forms of legislation at the state level, such as Florida denying property ownership to Chinese nationals and blocking Chinese students from academic laboratories, have likewise affected perceptions of the welcoming climate, both in general and in connection with research engagement in particular (Burton and Richardson, 2024; Hatzipanagos, 2023; Heidt, 2024; Li, 2024; Matat, 2024; Mervis, 2023a; Ngai, 2023; Qin, 2023; Qin and Mazzei, 2024; Wu, 2023). Incidents on college campuses and in their surrounding communities, including violence toward foreign students, are affecting the perception of U.S. universities as well.
Finally, Presidential Proclamation 1004315 and the China Initiative created a climate of fear and uncertainty not only for researchers from China but also for the entire Asian American scientific community (American Physical Society, 2021; Anderson, 2021, 2023a; Ma, 2023; Olszewski et al., 2024; Xie et al., 2023). Evidence suggests that the China Initiative in particular has discouraged talent flow and also contributed to the withdrawal from scientific engagement of current researchers whose contributions the United States can ill afford to lose (Ma, 2024; Xie et al., 2023).
Perceptions are important at all points of the talent funnel. The United States seeks to attract students, particularly at the graduate student level; recruit highly qualified researchers; and retain talent already contributing at universities and in industry. It will therefore be of critical importance that the nation addresses certain shifts in perception that threaten to diminish our long-standing advantages in international talent development.
___________________
15Executive Office of the President. May 29, 2020, Proclamation 10043: Suspension of Entry as Nonimmigrants of Certain Students and Researchers From the People’s Republic of China. Available at https://www.federalregister.gov/documents/2020/06/04/2020-12217/suspension-of-entry-asnonimmigrants-of-certain-students-and-researchers-from-the-peoples-republic.
This page intentionally left blank.


