International Talent Programs in the Changing Global Environment (2024)
Chapter: 3 National Security and Defense Implications of Scientific Research and Foreign Talent
3
National Security and Defense Implications of Scientific Research and Foreign Talent
U.S. technological leadership has been an essential force in driving economic growth and creating and maintaining the nation’s superior defense capabilities. Foreign science, technology, engineering, and mathematics (STEM) talent has played, and will continue to play, a critical role in enabling U.S. leadership in the fields that underpin national security and the defense industrial base (Ahern et al., 2022; Chase and Miles, 2023). As an Institute for Progress report stated, “The need for STEM talent is especially pronounced in defense-related industries. Not only are STEM workers with advanced degrees disproportionately employed by the defense industrial base, but 50 percent of advanced STEM workers in the defense industrial base are foreign born” (Neufeld, 2022b). For example, approximately 58 percent of Ph.D.-level computer and mathematical scientists, who drive the development of artificial intelligence and computing technologies, were born outside of the United States (NSB, 2022a). In contrast, only 34 percent of advanced STEM workers outside of the defense industrial base are foreign born (Neufeld, 2022b). Box 3-1 illustrates the domestic STEM talent pipeline and its relatively low yield of workers in STEM fields, with an estimated 3.2 percent of U.S. high school graduates ultimately entering the STEM workforce (Verma et al., 2023). Box 3-2 considers one of the most successful past examples of boosting STEM education in response to national security challenges—the National Defense Education Act (P.L. 85-864, September 2, 1958). These provide important
BOX 3-1
The Domestic STEM Talent Pipeline
Several efforts, including some funded by the Department of Defense (DOD), have sought to create dynamic models of talent flows through the domestic science, technology, engineering, and mathematics pipeline. This work has been undertaken with the intent of better understanding where losses occur and where interventions may be fruitful, both for increasing the number of students matriculating in STEM and the number of students graduating with STEM degrees (Kelic and Zagonel, 2009; Newton et al., 2009; Olszewski et al., 2024; Sturtevant, 2008; Verma et al., 2022a, 2023; Wells et al., 2007).
The overall domestic talent pipeline model developed by the Systems Engineering Research Center for DOD follows in Figure 3-1 (Verma et al., 2022a). Using this model, Verma et al. estimate that only 3.2 percent of U.S. high school graduates ultimately enter the STEM workforce (Verma et al., 2023).
Potential opportunities exist at multiple points along the path from K–12 education and onward to increase the flow of domestic talent in the United States into STEM careers. These include (from left to right in the pipeline model above): (1) bolstering K–12 education and increasing the number of “STEM-ready” students; (2) increasing the number of and retaining students who matriculate in STEM so that they graduate with STEM degrees; and (3) increasing the number of and retaining individuals who pursue STEM employment.
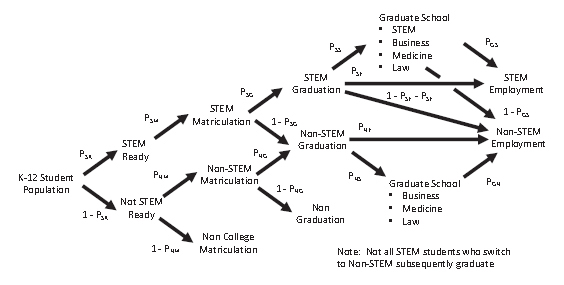
SOURCE: Verma et al., 2022a.
A deep examination of the K–12 educational system is beyond the scope of this report. Analyses of this highly complex, often uneven, and essential aspect of domestic STEM talent development, as well as potential recommendations for increasing the number of STEM-ready students, are available (ED, 2014; GAO, 2022; NSB, 2024c; NASEM, 2019b, 2021b, 2024). These studies draw attention to the wide gaps in opportunities available to students from under-resourced communities. For example, between 10 and 25 percent of high schools in the United States do not offer more than one core course in the standard sequence of math and science education including Algebra I and II, geometry, biology, and chemistry (ED, 2014; Verma et al., 2022b). Only 50 percent of high schools offer calculus and only 63 percent offer physics (ED, 2014; NSB, 2018; Verma et al., 2022b). Access to such courses also varies significantly by ethnicity. A recent study by the U.S. Government Accountability Office (GAO) confirms that many public elementary and secondary schools in the United States remain divided along racial, ethnic, and economic lines (GAO, 2022).
Among U.S. high school graduates, over 20 percent matriculate in STEM fields in college, but only 50 percent of students initially pursuing STEM majors ultimately graduate with a STEM major (Chen and Soldner, 2013; Verma et al., 2022a). This varies by demographic factors and by institutional type. For example, according to the National Science Board’s Science and Engineering Indicators, students identifying as American Indian or Alaska Native, Black or African American, and Hispanic or Latino were all underrepresented compared with U.S. populations among recipients of S&E bachelor’s degrees (NSB, 2024d). The scholarly literature base often refers to “leaky pipelines,” “braided rivers,” and “hostile obstacle courses” as ways to illustrate the differential experiences of students within nominally similar systems (Batchelor et al., 2021; Berhe et al., 2022). Previous reports from the National Academies and others have discussed both causes and potential recommendations for increasing the number of students matriculating in STEM as well as specific interventions for developing systems to help retain them through graduation (NASEM, 2011, 2016, 2017d, 2019a, 2019c, 2021a; Verma et al., 2022a, 2022b; Witteveen and Attewell, 2020).
Salzman finds STEM employment to be a “fairly consistent one-third of STEM graduates each year,” while Verma et al. assert that 40 percent of students graduating with a STEM degree take a STEM job (Salzman, 2007; Verma et al., 2022a). Fourteen percent of all
workers holding a bachelor’s degree or higher in the United States work in STEM, with this figure being 12.1 percent for those born in the United States and 22.9 percent for those born abroad (U.S. Census Bureau, 2021). Overall, STEM occupations have both higher earnings and lower unemployment than non-STEM occupations and have been growing in proportion to the overall workforce, in both number and percentage (NSB, 2024d). These factors might be expected to make STEM careers attractive to more graduates. Many factors may influence career decisions, including workplace culture, compensation, burnout, skill expectations and hiring, and perceived and actual opportunities (Conzelmann et al., 2023; NASEM, 2016b, 2017a, 2020, 2023a; Skrentny, 2023).a As noted in Box 2-1, the definition of STEM fields and STEM jobs varies among different federal agencies and often excludes occupations in health care and education that require STEM degrees (Fry et al., 2021). However, even if all STEM degree holders were employed in STEM jobs, this would still represent less than 10 percent of U.S. high school graduates and an even smaller percentage of the population at large.
__________________
a The committee notes Salzman’s assertion that there is a paucity of “comprehensive, systematic research on how students choose a STEM career, either on the process or the factors that influence these choices” (Salzman, 2007).
context for considering ways to improve the supply of domestic STEM talent as well as the ongoing need for foreign talent.
In a report issued in 2020, the bipartisan House Armed Services Committee Future of Defense Task Force identified STEM immigrants’ contributions to U.S. leadership as “staggering” and noted that “without a new commitment to achieving technological superiority, the successes of the 20th century—the American Century—will no longer be assured” (U.S. House Armed Services Committee, 2020). This report, which focused on the state of the nation’s national security innovation base to meet emerging threats, also concluded that “immigration policy hinders the nation’s ability to attract and retain foreign STEM talent that instead flows to other countries, including competitors” (U.S. House Armed Services Committee, 2020).
BOX 3-2
The National Defense Education Act of 1958
The National Defense Education Act (NDEA; P.L. 85-864) was passed by Congress and signed into law by President Eisenhower on September 2, 1958, to ensure the security of the United States and “strengthen the national defense and to encourage and assist in the expansion and improvement of educational programs to meet critical national needs” (Butz et al., 2004; U.S. Congress, 1958). The immediate catalyst for the NDEA was the October 1957 launch of the satellite Sputnik by the Soviet Union (Butz et al., 2004; Flattau et al., 2006; Granovskiy, 2018; Herman, 2019; Merisotis, 2015; Teitelbaum, 2014). Following this disruptive, crisis-level event—which “directly challenged the scientific, technological, and military prowess of the United States” and had major geopolitical implications—it was imperative to “ensure that highly trained individuals would be available to help America compete with the Soviet Union in scientific and technical fields” (Butz et al., 2004; ED, 2024; Flattau et al., 2006). While the launch of Sputnik “crystallized the political support that education reformers had been lacking and demolished their political opposition,” there had been some interest in and movement toward such comprehensive federal education legislation for at least a decade prior (Butz et al., 2004; Clowse, 1981; Flattau et al., 2006; Urban, 2018).
The NDEA shifted the relationship of the federal government to education, as the government had previously provided land grants for schools and aid for vocational education, but not funding for general education (ED, 2024; Neal et al., 2008). The legislation was described as “a composite of programs to strengthen the U.S. education system” (Butz et al., 2004). The NDEA infused resources and provided aid at all levels, including capital funds for low-interest loans to students, to both public and private institutions of higher education and also provided support for improving elementary and secondary education (Butz et al., 2004). In particular, the NDEA contained provisions to provide financial “support for loans to college students, the improvement of science, mathematics, and foreign language instruction in elementary and secondary schools, graduate fellowships, foreign language and area studies, and vocational-technical training” (ED, 2024). States received an allocation of funds authorized by the NDEA according to a college population-based formula (Butz et al., 2004).
Furthermore, the NDEA was accompanied by parallel actions that created NASA as well as the Advanced Research Project Agency (now known as the Defense Advanced Research Projects Agency, or DARPA) and that increased National Science Foundation (NSF) funding (Herman, 2019; JASON, 2019; NASEM, 2007b). While the NDEA was largely superseded by other programs by the 1970s,a it is widely acknowledged as “an extraordinarily successful legislative initiative” (AAU, 2006; Butz et al., 2004; Flattau et al., 2006; Urban, 2018).b The NDEA’s legacy is evident today in the form of NSF and DOD’s graduate research fellowship programs (NSF’s Graduate Research Fellowships Program and DOD’s National Defense Science and Engineering Graduate Fellowship), the Department of Education’s Title VI international education programs, and the Perkins Loan Program (formerly the National Defense Student Loan Program) (AAU, 2006; NASEM, 2007b; NSF, n.d.a). Intended to improve K-12 science and mathematics education and to produce highly trained scientists, the legislation ultimately benefited higher education writ large, as the initial focus on defense was broadened to encompass most academic disciplines and fields of study (Butz et al., 2004; Neal et al., 2008; Parsons, 2005; Urban, 2018).
There was some momentum toward a new or revived NDEA in the 2000s due to concerns about DOD’s science and engineering workforce. Several major studies posited that the number of U.S. graduates in critical disciplines was not sufficient to meet national, homeland, and economic security needs (AAU, 2006; Berry, 2005; Business Roundtable, 2005; Council on Competitiveness, 2005; DOD, n.d.; Jones, 2004; NASEM, 2007b; Sega, 2005; TFAI, 2005). These reports catalyzed some reforms, including the establishment of the DOD Science, Mathematics, and Research for Transformation (SMART) Scholarship-for-Service Program under the National Defense Education Program and the passage in 2007 and subsequent reauthorization in 2010 of the America Creating Opportunities to Meaningfully Promote Excellence in Technology, Education, and Science Act (or America COMPETES Act) (Gonzalez and Kuenzi, 2013; SMART Scholarship, n.d.; Teitelbaum, 2014; Urban, 2018; U.S. Congress, 2007, 2011). S. 3502, the New National Defense Education Act of 2006 was introduced by Senators Edward Kennedy, John Kerry, and Hillary Clinton but ultimately did not advance (Urban, 2018; U.S. Congress, 2006).
The National Security Commission on Artificial Intelligence Final Report, released in 2021, calls upon Congress to “pass a National Defense Education Act II to address deficiencies across the American educational system—from K–12 and job reskilling to investing in thousands of undergraduate- and graduate-level fellowships” in critical and emerging technology fields (NSCAI, 2021; SCSP, 2022). The chair emeritus of the National Science Board (NSB), Daniel Reed, called for the United States to pursue a “National Defense Education Act (NDEA) 2.0” in congressional testimony in 2024, noting that such legislation is not just about investing in the future, but rather “about encouraging and unleashing talent” (Reed, 2024). A follow-on op-ed by Reed and current chair of the National Science Board, Dario Gil, suggested that a modern-day NDEA could be one component of a STEM talent strategy to empower the United States to compete against China (Reed and Gil, 2024). Furthermore, the National Science Board’s July 2024 policy brief on “A Changed Science and Engineering Landscape” emphasizes the need to rebuild STEM education and a robust, future-capable STEM workforce that engages all Americans through “a new version of the 1958 National Defense Education Act” and making “education a federal, state, and local priority” (NSB, 2024a).
The committee notes that a new NDEA could potentially reduce the United States’ reliance on foreign STEM talent and could also provide enhanced resources for foreign language instruction, which is no less important in today’s global environment than it was in 1958 (Neal et al., 2008).
__________________
a The NDEA continued in operation until 1973, a period of 15 years (Teitelbaum, 2014).
b A formal evaluation of the NDEA, and individual provisions contained in the NDEA, was never conducted. Butz et al. provide a brief assessment based on earlier work by Forbis (Butz et al., 2004; Forbis, 1982). The Institute for Defense Analyses’ Science and Technology Policy Institute addresses the intended and actual effects of selected outcomes of the NDEA in a 2006 report commissioned by the Office of Science and Technology Policy, noting that “without the means to track and analyze outcomes, its effects cannot be quantitatively and qualitatively established with certainty” (Flattau et al., 2006). The number of Ph.D.s awarded annually by U.S. colleges and universities did increase from 8,600 in 1957 to 34,000 in 1973; this growth may stem from provisions in the NDEA (Greenwood and Riordan, 2002).
Given that technological advancements in artificial intelligence and biotechnology, for example, will have an outsized effect on national security, the dependence of U.S. leadership on foreign STEM talent to meet critical workforce needs, particularly in emerging technologies, presents potential economic and national security risks (NSB, 2024b). As a report to the White House Office of Science and Technology Policy (OSTP) stated, “Concerns have been voiced about the large numbers [of foreign individuals with STEM degrees]—including those from China—employed in innovation activities in U.S. companies, laboratories, and academic institutions. These individuals are seen as posing risks of misappropriating U.S. trade secrets from important U.S. industries, transferring them to companies in competitor countries. They may also return to their countries of birth with intangible technology that they have acquired in the United States” (Crane et al., 2021). It is important to point out that misappropriation of trade secrets is unethical and unlawful; however, the intangible transfer of knowledge is inherent in international education and scientific collaboration. It is a feature, not a bug, of the values-based order that has served the United States well.
RISKS ASSOCIATED WITH FOREIGN TALENT AND OPEN RESEARCH ENVIRONMENTS
International science and technology (S&T) is intensely competitive, both in terms of leadership and credit for scientific discoveries and the economic benefits of innovation and technology developments (NASEM, 2022a). The value proposition for international talent participation is clear and stark: the United States simply does not, and for the foreseeable future will not, develop sufficient domestic STEM talent at all levels of expertise to fully support the nation’s research and innovation system (American Academy of Arts & Sciences, 2020; AAU and Business Roundtable, 2022; DeSilver, 2017; Herman, 2019; NASEM, 2007b, 2011, 2019; NSB, 2015, 2024d; Olszewski et al., 2024; Reed, 2024). As a result, the United States needs to attract a great deal of this workforce from abroad.
The quality of talent coming to the United States from abroad is generally good because of the competitive nature of university admissions and the fact that mobility increases with higher levels of talent (Helms and Spreitzer,
2021; Kerr, 2018).1 Incoming graduate students hold at least a bachelor’s degree. Furthermore, the cost of travel, tuition, and other expenses can add selective pressure on many potential foreign students in terms of motivation to perform and to succeed (Swaminathan, 2017). Consequently, U.S. universities historically have been able to compete for and attract the best talent available worldwide, and so the benefits to the United States of an open science, technology, and innovation system welcoming worldwide talent should be positive in terms of attracting highly motivated and train-able students with superior levels of native intelligence and capability that allows them to produce the highest quality ideas and breakthroughs (DOS and ED, 2021; Neal et al., 2008).
The benefits of a system so dependent on foreign talent are rooted in the presumption that the system is open, transparent, and fair. It assumes that students coming to the United States are motivated to better themselves, to participate in a robust S&T ecosystem, and to pursue scientific achievement or commercial opportunity free from other agendas. It presumes that foreign talent coming to the United States will embrace the Western system of scientific norms and values, including fairness in assigning credit for advances, and protection of intellectual property (IP) when innovating technology.
The potential risks of an open science, technology, and innovation system based so heavily on the flow of foreign talent are also understandable. If this foreign talent does not ascribe to the same value system, respect IP ownership, or is motivated by incentive or coercion to play by a different set of rules, then much of the value proposition is invalid. In the context of great power competition that includes both military and economic dimensions, a coordinated effort to recruit STEM talent and acquire practical knowledge or more tangible IP might well represent a real danger, precisely because it is the most capable foreign talent that comes to the United States to study.
Determining the actual risk of the U.S. open research ecosystem, one that welcomes talent from around the world, therefore hinges on evaluating these assumptions about the motivations of the foreign STEM talent
___________________
1Kerr notes that “[b]usiness leaders and policy makers care deeply about how the skills of immigrants stack relative to natives. Are immigrants the ‘best and brightest’? In Washington, you hear this phrase continually in debates about the merits of immigration reform. If immigrants are the ‘best and brightest,’ it is easier to justify the greater inflows to skeptical Senators and the American public. But if immigrants are less productive than native scientists and engineers, the expanding role of immigrants in U.S. innovation may be a cause for concern if the immigrants are displacing better native talent” (Kerr, 2018).
diaspora. Is it to seek a better life, intellectual freedom, and opportunity, or is there willing or even unwilling or unwitting participation in malign foreign nation-state agendas? The information and tools to answer these questions about deeper motives do not exist, yet the core assumption remains valid based not just on current domestic STEM educational trends but also on simple population demographics: the United States will have to attract the majority of its STEM talent from abroad to remain competitive in any foreseeable future (Tiffert, 2024). The challenge, then, is to accept the risk and to compensate and adjust for it.
One step to address this risk would be for the United States and other democratic nations to promote an international framework to safeguard fundamental research and enable enhanced protection and risk management (Gamache and Tiffert, 2020; Holtkamp, 2024; Turpin, 2024). This would require the United States and its allies to acknowledge the scope of the threat that China in particular presents regarding the protection of IP (McMaster, 2020; U.S. Senate, 2019a, 2019b). As a report from the Hoover Institution states, “Neither the U.S. government nor the universities and national laboratories in the [United States] research enterprise are adequately managing the risks posed by research engagements with foreign entities. The task is quite simply falling through the cracks” (Tiffert, 2020).2 Or as another investigator noted, “The lack of understanding of the magnitude and complexity of China’s technology transfer apparatus has resulted in misperceptions, some of which downplay or understate the threats posed by China and/or overestimate the United States’ ability to maintain technological and military superiority. For instance, our views of risks and threats posed by China are too often placed in simplistic, binary terms. The most common of these binary constructs are legal versus illicit activity, international research collaboration versus shutting ourselves off, and openly shared (and published) versus classified research” (Stoff, 2022).
Among the risks the Hoover report (Tiffert, 2020), a 2020 OSTP report (OSTP, 2020), a 2020 American Academy of Arts & Sciences report (American Academy of Arts & Sciences, 2020), and others identify are as follows:
___________________
2The Los Alamos Club report by Strider Technologies, Inc. details how at least 162 scientists working at Los Alamos National Laboratory between 1987 and 2021 were recruited by the People’s Republic of China (PRC) to return and continue their military weapons research programs there. This document was inspired by an earlier article in the South China Morning Post. See https://content.striderintel.com/wp-content/uploads/2022/09/Strider-Los-Alamos-Report.pdf and https://www.scmp.com/news/china/diplomacy-defence/article/2082738/americas-hidden-role-chinese-weapons-research.
- Conversion of U.S. government-funded research into IP that is then commercialized in the PRC in violation of research grant or university terms and conditions.
- Direction or redirection of U.S. research to the PRC government by selectees of the PRC’s state-run talent recruitment programs.
- Improper PRC influence over or manipulation of U.S. research grant evaluations and award decisions.
- Diversion of U.S. research to PRC defense programs and weapons system development that can undermine or eliminate U.S. military superiority.
- Diversion of U.S. research to applications that violate ethical standards or democratic norms and values, such as those that enable or enhance the PRC’s domestic surveillance apparatus and human rights abuses.
- Failure to report or misreporting of foreign affiliations, research projects, and additional sources of funding in violation of federal research grant disclosure rules.
China’s rise as an economic and S&T power has involved massive internal investment, as well as resources drawn from outside the country (Joshi, 2019; Morrison, 2019; NASEM, 2010; Simon and Cao, 2009a). These resources include financial investments by businesses, international collaborations, and talent (including returnees) recruited from abroad (Simon and Cao, 2009a). While much of this activity has followed the playbook followed by other developing nations, including the United States in the 19th and early 20th centuries, it has been accompanied by other illicit activities that are appropriately characterized as “malign.” Examining the full scope of such activities, which include counterfeiting goods, copyright violations, IP theft, industrial espionage, exfiltration of data and trade secrets, and concealing talent programs, is beyond the scope of this report. The Federal Bureau of Investigation (FBI) has estimated the annual cost to the U.S. economy of counterfeit goods, pirated software, and theft of trade secrets by China at $225 to $600 billion (Commission on the Theft of American Intellectual Property, 2017; Deutch, 2018; FBI, 2019b; Hvistendahl, 2017). It is important to assess the effect of malign talent programs against this scale. However, implications that this loss reflects substantial thefts of federally funded research, especially from universities, cannot be justified by the original or subsequent analyses.
A $600 Billion Problem for Federally Funded Research?
The National Science Foundation, in partnership with the National Institutes of Health, the Department of Energy, and the Department of Defense, released a series of four training modules in February 2024.3 This training “provides recipients of federal research funding with information on risks and threats to the global research ecosystem—and the knowledge and tools necessary to protect against these risks” (NSF, n.d.b). Module 1: What is Research Security? includes a discussion of IP and the potential consequences of its theft or loss, stating that “the estimated losses to our researchers and economy approach $600 billion annually” (NSF, 2024c). Since the stated audience for this training consists of federally funded researchers and the students and professionals who are part of the research enterprise, one might reasonably conclude that this number reflects the magnitude of the loss from this community. That would be incorrect.
The FBI produces a variety of informational resources and bulletins regarding security issues. Below is illustrated the introductory section of the bulletin “China: The Risk to Academia” (see Figure 3-2 for the bulletin’s introductory text).4 Again, one might reasonably conclude from the title that the annual cost highlighted is representative of the loss from academic institutions to China, and this would again be incorrect. The same blue box also appears in the FBI’s bulletin China: The Risk to Corporate America (FBI, 2019b). It is clear that estimates of “the annual cost to the U.S. economy of counterfeit goods, pirated software, and theft of trade secrets” represent an economy-wide impact far beyond the scope of university- or federally-sponsored research (FBI, 2019a, 2019b).5
This economic impact estimate is traceable to a 2017 analysis by the Commission on the Theft of American Intellectual Property (IP Commission), released as an update to its original 2013 report (Commission on the Theft of American Intellectual Property, 2013, 2017). Since then, the $600 billion figure has become ubiquitous, appearing not only in the press and the examples noted above from executive branch agencies but in releases from trade organizations, think tanks, and congressional committees (Cox,
___________________
3See https://new.nsf.gov/research-security/training (accessed April 15, 2024).
4See https://www.fbi.gov/file-repository/china-risk-to-academia-2019.pdf.
5Research expenditures by industry (approximately 75 percent of the United States’ R&D portfolio) exceed those of the U.S. government (approximately 20 percent of the United States’ research and development [R&D] portfolio) by a significant margin (Anderson et al., 2023; NSB, 2024a). Further, the value of IP in this sense refers to its market value. Unlike the private sector, universities and national labs do not generally practice their IP or trade secrets.
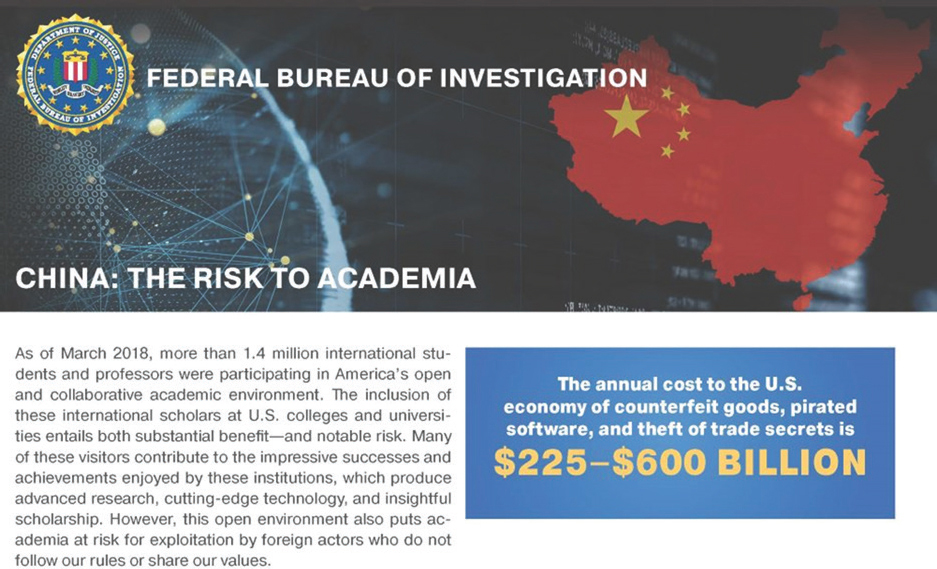
SOURCE: Federal Bureau of Investigation (FBI, 2019a).
2023; EverEdge, 2019). Such uses are rarely accompanied by any context or consideration of what went into the estimates, nor have the estimates been updated in the intervening years. Nonetheless, $600 billion is a sufficiently large number to attract attention regardless of its source, use, or currency.
What are the numbers behind that number? The IP Commission estimated the value of counterfeit and pirated tangible goods imported into the United States in 2015 to be between $58 billion and $118 billion, and that of counterfeit and pirated U.S. goods sold elsewhere in the world to be $85 billion (Commission on the Theft of American Intellectual Property, 2017). The sum of these brackets the estimate of $143 billion by the Organisation for Economic Co-operation and Development and the European Union Intellectual Property Office (OECD and EUIPO, 2016). The IP Commission notes that sales of these goods “did not displace the sale of legitimate goods on a dollar-for-dollar basis,” estimating that “at least 20 percent of the total amount of counterfeit and pirated tangible goods actually displaced legitimate sales. Thus, the cost to the American economy, on the low end of the estimate, is $29 billion” (Commission on the Theft of American Intellectual Property, 2017). The commission also noted that China, which accounted for 87 percent of counterfeit goods seized coming into the United States, represented the world’s principal IP infringer (Commission on the Theft of American Intellectual Property, 2017).
The commission estimated the economic impacts of other sources of IP theft or piracy based on percentages of the U.S. gross domestic product (GDP). At the time of this analysis, U.S. GDP stood at $18 trillion, and software piracy was estimated to cost American companies at least 0.1 percent of GDP, or $18 billion annually (Commission on the Theft of American Intellectual Property, 2017). The largest and most uncertain cost to the U.S. economy was trade secret theft. The commission cited a 2014 publication by the Center for Responsible Enterprise and Trade and PricewaterhouseCoopers estimating the economic impact of trade secret theft to be between 1 percent and 3 percent of GDP, representing a cost to the U.S. economy of $180 billion to $540 billion (Commission on the Theft of American Intellectual Property, 2017; Michel et al., 2014; Wiseman, 2024). These values bracket the 2015 estimate from the Office of the Director of National Intelligence that economic espionage through hacking costs the U.S. economy $400 billion annually (Bingen, 2023). The combined estimates of the costs of trade secret theft and the impact of counterfeit and pirated goods and software costs the U.S. economy $225 billion to $600 billion annually (Commission on the Theft of
American Intellectual Property, 2017; FBI, 2019b). In comparison, total U.S. spending on R&D is about 3 percent of GDP, and federal funding of R&D is about 0.6 percent of GDP (Anderson, 2024; Anderson and Moris, 2023; Bradsher, 2024; Harris et al., 2023). In other words, reaching a total annual cost of $600 billion to the United States from counterfeit goods, pirated software, and theft of trade secrets assumes that the value of trade secrets stolen annually is equivalent to the total investment in R&D by both the public and the private sectors.
These estimates of economic losses have not escaped criticism, regarding both their basis (“the figures rest on flimsy evidence derived from dubious ‘proxy modeling’“) or their widespread use (Cohen, 2019; Roach, 2019). An analysis by the Center for Strategic and International Studies (CSIS) suggested that, in the time frame considered in the 2017 IP Commission report, “the United States probably lost between $20 billion and $30 billion annually from Chinese cyber espionage” (Lewis, 2018b). CSIS estimated that cybercrime from all sources amounted to 1 percent of global GDP, with IP theft accounting for 25 percent of the total (Lewis, 2018a). This is in contrast to the IP Commission’s use of 1 percent to 3 percent of GDP as an estimate of losses from theft of trade secret IP (Commission on the Theft of American Intellectual Property, 2017).
Regardless of the reliability of these estimates, it is important to understand where the effects are most prominent. Whether in the popular press or captured by the activities of congressional committees, concerns about economic consequences of IP theft primarily center on business-sector consequences, with special concern for effects on small business (Rosenbaum, 2019; U.S. House Foreign Affairs Committee, 2020a; U.S. Select Committee on the CCP and Committee on Small Business, 2023). Universities, national laboratories, federally funded research, and talent programs are remarkable for their absence from these discussions on the economic impact of IP theft. Claims that American universities are giving away large amounts of taxpayer-funded research by failing to maintain adequate safeguards are by and large groundless.
TALENT PROGRAMS OF COUNTRIES OF CONCERN
The CHIPS and Science Act (P.L. 117-167, August 9, 2022) designated the talent programs of several nations, including China, Russia, Iran, and North Korea, as countries of concern (see Box 3-3). For a variety of reasons, including military, economic, and technological strength, as well as the scale
BOX 3-3
Countries of Concern
Adapted from Foreign-Funded Language and Culture Institutes at U.S. Institutions of Higher Education: Practices to Assess and Mitigate Risk (NASEM, 2023c)
Collaborations with some countries pose greater risks than others, so it is imperative for U.S. host institutions to take the partnering foreign nation into account to fully understand, evaluate, and address the risks associated with entering into or continuing such a partnership. The committee notes that “countries of concern” are fluid and change over time. At publication in August 2024, the Massachusetts Institute of Technology (MIT) subjects engagements with China (including Hong Kong), Russia, and Saudi Arabia to additional faculty and administrative review to assist with identifying and managing risks.a MIT further delineates government-identified Countries of Concern (at publication in August 2024, these include China, Iran, North Korea, and Russia), sanctioned countries (at publication in August 2024, these include the comprehensively sanctioned countries of Iran, Cuba, Syria, North Korea, and The Crimea, Donetsk People’s Republic and Luhansk People’s Republic regions of Ukraine, and the broadly sanctioned countries of Belarus, Russia, and Venezuela), and countries posing elevated risks for research (at publication in August 2024, these include China [including Hong Kong], Russia, and Saudi Arabia)—all of which present compliance as well as travel safety risks.b
Similarly, the Texas A&M University System Research Security Office reviews and updates countries of concern quarterly, with the current set of countries of concern consisting of China, Iran, North Korea, and Russia. Texas A&M selected these countries based on information present in U.S. government annual reports to Congress and guidance from federal partners, including the Defense Counterintelligence and Security Agency;c and because “they have demonstrated organized efforts to illicitly acquire intellectual property from other nations, are involved with industrial and/or cyber espionage, and demonstrate efforts to damage U.S. economic and national security” (TAMU, n.d.).
Sections 10612 and 10638 of the CHIPS and Science Act of 2022d state that the People’s Republic of China, the Democratic People’s Republic of Korea, the Russian Federation, and the Islamic Republic of Iran are foreign countries of concern, along with any other
country determined to be a country of concern by the Department of State. The RESTRICT Act,e introduced in the U.S. Senate in March 2023, lists “foreign adversary” nations as the People’s Republic of China, including the Hong Kong Special Administrative Region and the Macao Special Administrative Region; the Republic of Cuba; the Islamic Republic of Iran; the Democratic People’s Republic of Korea; the Russian Federation; and the Bolivarian Republic of Venezuela under the regime of Nicolás Maduro Moros. The committee notes that in addition to these six nations, the state of Florida has designated Syria as a “foreign country of concern.”f
Finally, the definitions of “malign foreign talent recruitment program” in Section 10638(4) of the CHIPS and Science Act of 2022d and in the February 2024 Office of Science and Technology Policy memorandumg state that any program sponsored by “a foreign country of concern or an entity based in a foreign country of concern, whether or not directly sponsored by the foreign country of concern” is considered to be a malign foreign talent recruitment program. The latter definition provides a list of international collaboration activities that are not considered to be a “foreign talent recruitment program,” as long as such activities are not funded, organized, or managed by an academic institution or a foreign talent recruitment program on the lists developed in response to Sections 1286(c)(8) and 1286(c)(9) of the John S. McCain National Defense Authorization Act for Fiscal Year 2019h (Prabhakar, 2024a).
__________________
a See the MIT Elevated-risk project review process at https://globalsupport.mit.edu/planning-agreements/elevated-risk-project-review-process/.
b See MIT Countries Presenting Added Risk at https://research.mit.edu/security-integrity-and-compliance/foreign-engagement/regulations-and-references/countries.
c The U.S. Department of State maintains a list of countries of particular concern, special watch list countries, and entities of particular concern. See https://www.state.gov/countriesof-particular-concern-special-watch-list-countries-entities-of-particular-concern/.
d H.R. 4346 – Supreme Court Security Funding Act of 2022, P.L. 117–167, 117th Congress (August 9, 2022) (U.S. Congress, 2022).
e RESTRICT Act, S.686, 118th Cong., 1st sess., Congressional Record 169 (2023).
f See https://www.usg.edu/news/release/board_of_regents_.
g See “Guidelines for Federal Research Agencies Regarding Foreign Talent Recruitment Programs” at https://www.whitehouse.gov/wp-content/uploads/2024/02/OSTP-Foreign-Talent-Recruitment-Program-Guidelines.pdf.
h P.L. 115–232,115th Congress (August 13, 2018).
of flows of goods and people, the focus has been almost entirely on China. This report reflects that focus, but the committee does not intend to imply that China is the sole country of concern. Talent programs operated by China, Russia, and Iran are described further in Chapter 6.
ECONOMIC IMPACTS OF RESTRICTING FOREIGN TALENT FLOWS
Constricting foreign talent flows to the United States, whether to address risks to national security and competitiveness or for other reasons, does affect the domestic economy at both national and regional levels (Crane et al., 2021). There have been numerous studies on the economic effects of immigration in general and the consensus, reflected in a 2017 National Academies of Sciences, Engineering, and Medicine report, is that immigration has an overall positive effect on long-term U.S. economic growth (NASEM, 2017c). At the national level, regarding international students, NAFSA: Association of International Educators has estimated that “international students studying at U.S. colleges and universities contributed $40.1 billion and supported 368,333 jobs to the U.S. economy during the 2022–2023 academic year” (NAFSA, n.d.). As an example of regional effects, research has shown that in cities where companies experience more H-1B visa denials, jobs for U.S. citizens in computer-related industries decline in the years following (Peri et al., 2014). In addition, college-educated U.S. citizens experience slower wage growth in cities that experience more H-1B visa denials (Peri et al., 2014). Another study from the National Foundation for American Policy (NFAP) found that the presence of H-1B visa holders is “associated with lower unemployment rates and faster earnings growth among college graduates” (Zavodny, 2020).
Economic effects will also vary among STEM fields depending on the demand for expertise in different industrial sectors. The NFAP found that “being in a field with more H-1B visa holders makes it more likely that U.S.-born young college graduates work in a job closely related to their college major,” and that in general, “an increase in the share of workers with an H-1B visa within an occupation, on average, reduces the unemployment rate in that occupation” and “leads to faster earnings growth for U.S. workers” (Zavodny, 2020). These findings suggest that high-skilled foreign workers complement U.S. workers—that American high-skilled workers and foreign high-skilled workers may possess different skill sets that are more effective when combined. Another
NFAP study examined the effect of enrolling more international undergraduates in STEM fields (Zavodny, 2021). This study found that every 10 bachelor’s degrees awarded across all STEM fields to international students lead to an additional 15 bachelor’s degrees in STEM majors awarded to U.S. students (Zavodny, 2021). The author of this study suggested that “colleges and universities that attract more international students likely are devoting more resources to STEM areas, such as increasing the number of courses and adding fields offered within STEM, hiring more faculty, and providing new lab spaces and buildings. To the extent such changes are occurring, they appear to be attractive to U.S. students as well” (Zavodny, 2021).
Research also shows that H-1B restrictions and the inability of companies to hire a sufficient number of high-skilled workers in the United States results in offshoring tech jobs and reducing R&D investment in the United States and leads companies to send more jobs, resources, and innovations outside the United States (Glennon, 2024). In other words, making the United States less attractive to foreign workers ultimately reduces the ability of companies in the United States to remain competitive in an increasingly global economy. In fact, a recent survey of more than 500 human resources professionals found that restrictions on H-1B visas and immigration led to jobs, workers, and resources being sent outside the United States, with 86 percent of the companies surveyed hiring employees outside the United States for roles originally intended to be based inside the country because of visa-related uncertainties (Envoy Global, 2023).
Restricting foreign high-skilled talent not only affects jobs and research investment in the United States but also hampers U.S. innovation and company growth. One study, for example, found that increases in the number of H-1B admissions led to increased worker productivity6 and company profits, especially in companies that conduct R&D (Ashraf and Ray, 2017). The investigators found that U.S. firms dependent on skilled immigrant workers saw a decline in both patents and citations since 2004 following reductions in the cap for H-1B visas.
___________________
6The investigators use research and development expenditures as a proxy for innovation.
This page intentionally left blank.


