Prevention and Mitigation of Bridge and Tunnel Strikes (2025)
Chapter: 8 BrTS Data Clearinghouse Prototype
CHAPTER 8
BrTS Data Clearinghouse Prototype
Introduction
A national BrTS Clearinghouse is one opportunity to help overcome challenges in identifying, diagnosing, and mitigating BrTS risk. The following are keys to success:
- Keeping the structure inventory data up-to-date and in good quality: The NBI has missing, erroneous, and logically conflicting information (Dedman, 2021; Dekelbab et al., 2008; Din & Tang, 2016) due to data entry errors. Similar issues afflict the NTI. As such, there is a need to work to improve the quality and timeliness of the underlying data.
- Establishing a reliable linkage between BrTS and structure inventory data: While crash, bridge, tunnel, and roadway databases contain valuable information, they are often in separate “silos” (i.e., collected and maintained by different departments or divisions). The MMUCC provides a mechanism to link bridge crashes with NBI data through a Bridge/Structure Identification Number (NHTSA, 2017), but MMUCC compliance is optional and varies among states. Further, spatial joins can be subject to errors and should be validated prior to analysis. The BrTS Clearinghouse will help to establish these linkages.
- Extracting relevant data items from connected databases for collision risk analysis: The NBI, NTI, and crash databases each have multiple tables, numerous data elements, and thousands of records. The scale of the databases and the complex relationships among them make it a challenge to extract useful information and make permitting decisions in a timely manner. The BrTS Clearinghouse will provide useful information for assessing risk-based on the underlying data. It will also allow users to extract relevant data for more detailed analysis.
- Developing a rigorous approach to accurately calculate the collision risk and its outcome: Most state agencies, as part of their bridge (damage) inspection procedure, have methods for rating a bridge after the impact and policies for an efficient and effective response. Few have methods for proactively assessing bridges for risk of being hit. The BrTS Clearinghouse will provide a method and results for assessing BrTS risk.
- Identifying and quantifying effective safety countermeasures for categories of BrTS: Quantifying the costs and benefits of targeted countermeasures will lead to more informed decisions on appropriate infrastructure and operational investments and strategies. Chapter 3 of this guide presents various countermeasures from lower-cost signing and striping to higher-cost bridge improvements to state-level policy and operational procedures.
- Communicating highway structure conditions or concerns effectively among different stakeholders: Mitigating and avoiding BrTS requires the cooperation of many stakeholders, including state/Federal agencies, motor carriers, and private service providers. Effective communication and information exchange among different parties and agencies will lead to more effective BrTS programs, especially during permit issuance for OSOW movements. This can also support improvements to the data availability and quality.
This section presents a BrTS Clearinghouse prototype for collecting and disseminating BrTS data along with a demonstration of how agencies could use it in practice. The goal is to create a sustainable national clearinghouse for states to collect and analyze BrTS data as well as communicate bridge and tunnel
clearance information. While this section presents an initial prototype, there will be a need for future efforts, including a long-term storage plan and regular maintenance. For instance, there will be a need to update the data extract, transform, load processes as states change their crash and roadway databases. This section does not address these maintenance issues.
Prototype Design Concept
Figure 14 shows the conceptual design of the BrTS Clearinghouse. There are several components, including state crash records (left middle), national bridge and tunnel inventories (top middle), and supplemental datasets (bottom middle). The result is a structured dataset with crash-based and structure-based files (right). The figure shows the collection and processing of state crash records (left middle) as a three-step process:
- BrTS crash data requests are sent to state agencies. State agencies process existing state crash data to identify BrTS crashes that meet the inclusion criteria (i.e., crashes involving a strike to the bridge, tunnel, or its component parts).
- BrTS Clearinghouse maintenance staff transform the state BrTS crash data to meet the established standard data element definitions. This ensures the final database file, and records have consistent definitions and formats. Records that fail to convert properly are examined and either corrected or excluded. The transformation process will be improved through an iterative process unique to each source file (state database).
- Each transformed and cleaned state BrTS crash file is added to the final file ready for analysis.
In parallel, the Clearinghouse retrieves structure data from NBI, NTI, and the USDOT BTS railroad bridge dataset (top middle). The Clearinghouse integrates the structure data and crash data using either the common ID or spatial join method. If the structure ID is available in both the crash and structure data, then the common ID is used to join the data. If not, the spatial join is used based on available data (e.g., latitude/longitude, X/Y). The Clearinghouse could also incorporate additional data such as roadway characteristics, inspection and maintenance records, and traffic data (bottom middle).
The risk assessment module calculates basic statistics (e.g., number of crashes, injury severity/damage) for each bridge based on the embedded BrTS crash count models, injury severity models, and risk assessment method. The Clearinghouse creates a relational database for crash-based analysis and structure-based analysis. The flat file for crash-based analysis includes one record per BrTS crash. Table 13 shows an example of the resulting flat file. The flat file for structure-based analysis includes one record per bridge or tunnel.
At a minimum, the database will include the relevant crash data elements, the bridge/tunnel data elements, and any crucial meta data required for data management purposes. A visualization component could be developed via ArcGIS to produce corresponding layers for displaying related statistics (e.g., BrTS locations, number of BrTS for each bridge, flagged railroad bridge crashes, risk assessment score, etc.). Visualization tools could allow the user to toggle specific elements of interest such as bridge or tunnel groups or even different struck parts.
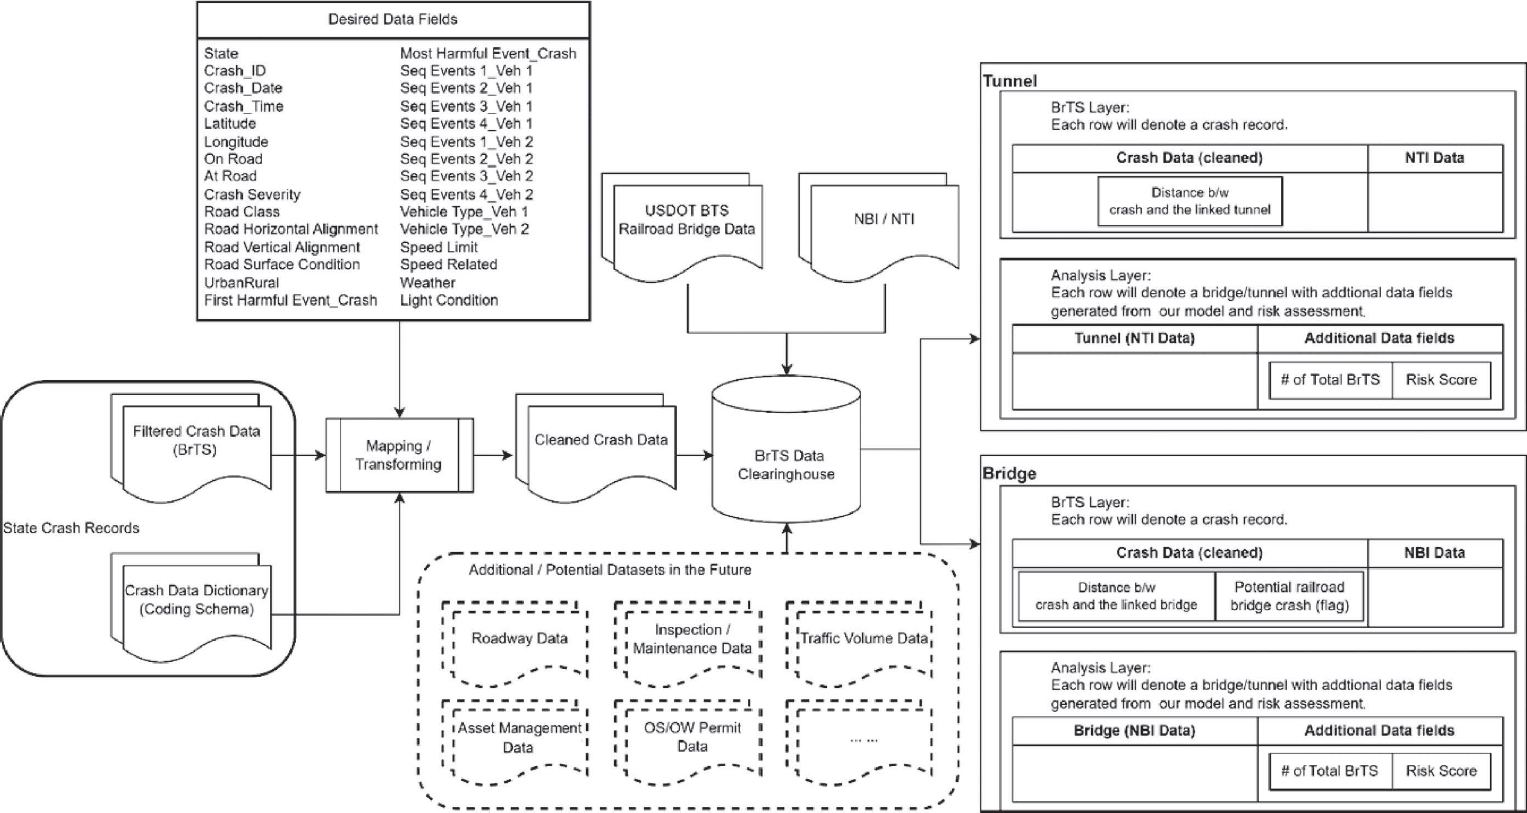
Table 13. Prototype of the BrTS data clearinghouse flat file.
| State Crash Records | |||||||||
|---|---|---|---|---|---|---|---|---|---|
| Field Name | BrTS ID | State | Date | Time | Latitude | Longitude | On Road | At Road | … |
| Format | CHARa(50)b | CHAR(2) | DATE | TIME | NUM(10,8)c | NUM(10,8) | CHAR(50) | CHAR(50) | … |
| Description | ID in data clearinghous e | State postal abbreviation | Date of crash YYYY/MM/DD | Time of crash | Decimal degrees | Decimal degrees | Name of road on which crash occurred | Name of intersecting road to identify location | … |
| 1001 | WI | 2018/11/09 | 8:45 | 43.87680426 | −91.1832326 | THIRD | WALNUT | … | |
| 1002 | WI | 2020/10/02 | 13:20 | 44.08444452 | −87.7236331 | US 29 | SR 1619 | … | |
| 1003 | NV | 2013/03/06 | 7:50 | 40.0611826 | −118.6534580 | PEACE | GLENNWOOD | … | |
| 1004 | NV | 2013/05/25 | 21:10 | 40.8091651 | −115.8246880 | SUTTON | ARLINGTON | … | |
| 1005 | MA | 2019/02/04 | 17:05 | 42.59224383 | −71.2805723 | NC 226 | POTEAT | … | |
| 1006 | MA | 2019/02/12 | 9:02 | 41.94660778 | −71.2755011 | SALISBURY | OLD CHARLOTTE | … | |
| NBI/NTI | ||||||||
|---|---|---|---|---|---|---|---|---|
| Field Name | BrTS ID | Structure Number | Structure Material | Structure Type | Minimum Vertical Clearance | Year Built | Detour Length | … |
| Format | CHAR(50) | CHAR(50) | CHAR(50) | CHAR(50) | NUM(3,2) | NUM(4,0) | NUM(3,0) | … |
| Descriptio n | ID in data clearinghou se | Structure number/bridge identification number | Structure material | Type of structure design | Minimum vertical clearance (over-bridge roadway) or minimum vertical underclearance (under-bridge roadway) in meters | Year the bridge was built | Kilometers | … |
| 1001 | B32005400000000 | Steel continuous | Stringer/multibeam or girder | 4.84 | 1967 | 1 | … | |
| 1002 | B36006500000000 | Prestressed concrete continuous | Stringer/multibeam or girder | 4.65 | 1979 | 24 | … | |
| 1003 | B1040W | Concrete | Culvert | — | 1965 | 1 | … | |
| 1004 | I900W | Prestressed concrete | Box beam or girders – multiple | 5.00 | 1976 | 1 | … | |
| 1005 | B120062BBMUNN BI | Concrete | Arch – deck | — | 1950 | 2 | … | |
| 1006 | A160203YYDOT6 34 | Steel | Stringer/multibeam or girder | 5.70 | 1962 | 3 | … | |
a CHAR indicates a data type storing characters in a fixed-length field.
b Numbers in parentheses specify data length. A single number means no decimal portion.
c Two numbers in parentheses also specify data length; the first is the number of integer digits, and the second is for decimal digits.
Prototype Demonstration
Fourteen states were selected to demonstrate the prototype based on the quality and completeness of crash data. These states are Alaska, Arkansas, Connecticut, Florida, Illinois, Iowa, Maine, Mississippi, North Carolina, South Carolina, Tennessee, Utah, Washington, Wisconsin. Specifically, these states have the essential data fields and attributes required for further analyses. The data from all 14 states can be used to identify certain bridge-related crashes. Typical situations regarding the bridge structure ID from the crash data can be categorized as:
- Crash data and corresponding NBI data have the same bridge ID, which can serve as the UUID for data linkage. Only Maine has such data.
- Crash data includes one dedicated variable for recording the bridge ID, but a very small percentage of filled values are proper NBI bridge IDs (i.e., Wisconsin).
- Crash data does not include NBI bridge IDs, which is the most common case among the currently collected data from most of the states.
For tunnel-related crashes, there is rarely a direct linkage between the NTI data and the crash data from selected states as mentioned previously. Although NTI data are setup similar to the NBI data with specific tunnel structure ID, the crash data does not capture the tunnel ID.
This subsection describes the procedures for the BrTS Clearinghouse prototype, along with challenges that can be addressed in future research. The current prototype is developed with the ArcGIS Online Application, which offers an interactive mapping interface to query and display crash and structure data, and collision risk from the selected states. The development of the current version requires a certain level of manual effort to process the data.
Data Preparation
The first step is to obtain state BrTS crash data. Most states provided datasets to the research team using the given query requirements from the research team as previously described (i.e., most/first harmful event and sequence event). Some states, like the Wisconsin WisTransportal, provide open access to data. In those cases, the research team used the same queries to obtain the data directly. The research team also queried the NBI, NTI, and railroad bridge datasets for the 14 selected states according to their state code. Geocoded data were transformed into decimal degrees for compatibility with ArcGIS.
Data Linkage
Maine’s data were linked by Common ID join, using the common bridge number in the NBI and the crash data. Some bridges were missing from the NBI data. In Wisconsin, even though some bridge numbers were provided, the structure number was typically inconsistent with the structure numbers available in the NBI data; therefore, a spatial join was conducted. Similarly, a spatial join was conducted for the other states, as there was no provision of bridge numbers. The spatial joins produced bridge hit counts where repetitions of each structure number could be counted.
For states other than Maine, two spatial joins were conducted, one to determine how many bridges were within a 100-foot buffer, and one to determine how many bridges were within a 500-foot buffer around each crash. Considering that NBI does not include most railroad bridges, the team utilized the railroad bridge dataset from the BTS website to flag potential railroad bridge-related crashes when a railroad bridge is the closest bridge within a 500-foot buffer of a given crash. Similarly, as mentioned previously, the buffer of 1500 feet is set as the threshold for potential tunnel crashes to link with the tunnels, because the national average tunnel length in the NTI is 1300 feet. The location for a tunnel is set at its entrance.
Results and Presentations
The resulting prototype is a web application that aims to establish a national level data repository for collecting and analyzing BrTS data.
The BrTS Clearinghouse uses a data-driven method to assess BrTS risk. Transportation agencies and motor carriers can use this application to assess, quantify, and communicate the risk of bridge and tunnel-related crashes. For further details on how to use the data clearinghouse to view and query data, one can refer to Appendix K: BrTS Data Clearinghouse User Manual. Notably, the functionalities listed in this guide are not exhaustive. Users can export the retrieved data to a comma-separated values file, which is compatible with Microsoft Excel and ArcGIS.
Summary
This chapter outlines the development of a prototype for the BrTS data clearinghouse. This database can serve as a comprehensive repository for data, metadata, and information related to BrTS. The primary objective is to create a prototype that lays the foundation for a lasting national clearinghouse dedicated to the collection, analysis, and dissemination of BrTS data, along with bridge and tunnel clearance information. By focusing on the continuous development and upkeep of this clearinghouse, efforts can be made to ensure that it efficiently manages data, provides insightful analyses, and effectively communicates information, all while catering to the needs of various stakeholders.


