Prevention and Mitigation of Bridge and Tunnel Strikes (2025)
Chapter: Appendix A: Technical Memorandum: Literature Review
APPENDIX A
Technical Memorandum: Literature Review
This chapter is a salient summary of literature on BrTS topic areas, including collision characteristics, crash outcomes, and models. The report also reviews the state of practice related to over-dimensional permitting considerations, as well as reporting, clearances and transportation asset management. The summary gives particular attention to strikes involving bridges and tunnels; and it also explores existing countermeasures (i.e., prevention/mitigation strategies from roadside to in-vehicle technologies). The project team performed keyword searches of research databases such as the TRID and Google Scholar to identify relevant peer-reviewed journal articles, research reports, guidance, and other resources for review. The results of this literature review informed subsequent project tasks, including the identification of data needs and data sources for developing methods to evaluate the risk of BrTS collisions. It also serves the purpose of helping identify potential evaluation methods.
Though BrTS collisions might not be significant in terms of frequency, they can be a serious threat to the structural integrity of bridges and tunnels (i.e., damage, failure or collapse of piers, bent caps, foundations, desks, etc.). Moreover, while a bridge may sustain motor vehicle strikes without an immediate collapse, the collision impact could lead to damage (e.g., internal cracks and structural fracture) that may accelerate bridge deterioration, and eventually contribute to a bridge’s premature failure. A 1990 study conducted by the University of Kentucky examined US bridge failures from 1951-1988 (Harik et al. 1990), finding that of 79 bridge failures, 11 (14 percent) were precipitated by truck collisions. Consequently, BrTS collisions may compromise the safety of users and cause major economic losses, such as injuries or fatalities, the need to clear/restore overpasses/tunnels and underway roads, as well as indirect costs due to traffic delays.
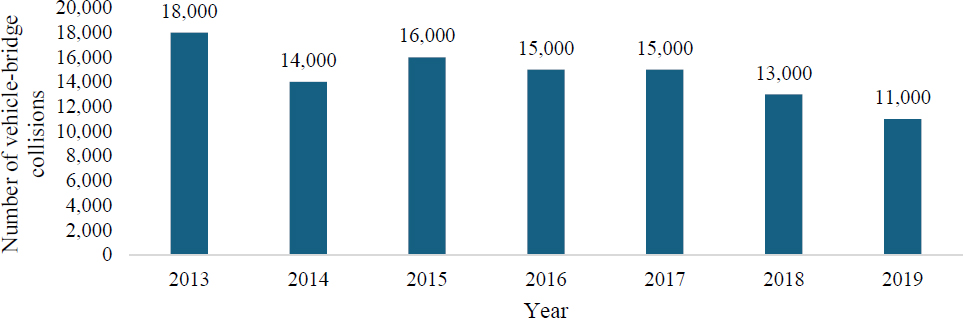
More than 600,000 bridges are registered on the 2021 NBI Database, available from FHWA. Based on analysis of NBI data, damage resulting from a vehicle or vessel hitting a bridge is among the most common causes of bridge failure (FHWA 2021). In an annual report from NHTSA, 11,000 collisions between vehicles and fixed bridge objects were recorded in 2019 (Reish 2019). As shown in Figure A1, the number of vehicle-bridge collisions (including both trucks and passenger cars) ranged from 18,000 to 11,000 per year between 2013 and 2019.
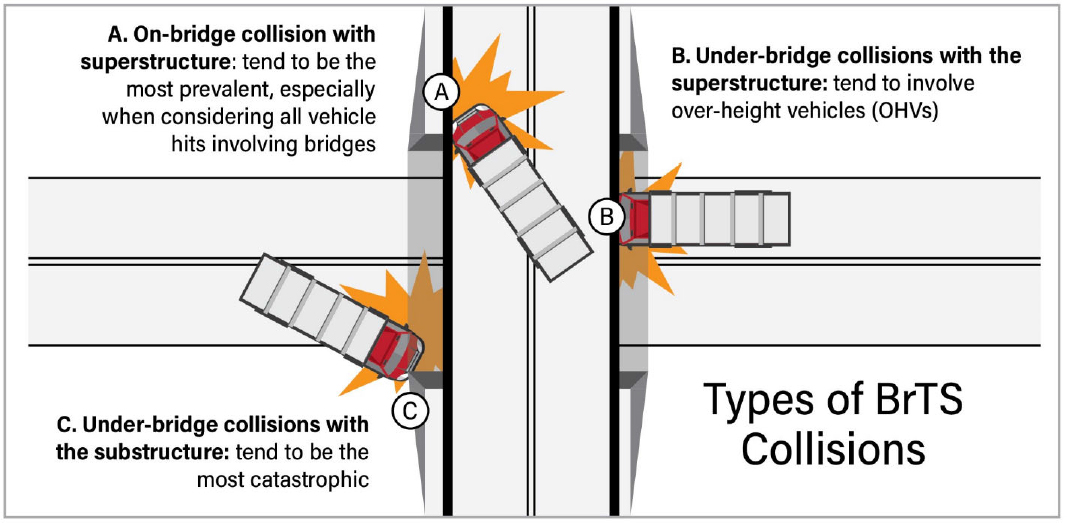
As defined in (Nguyen and Brilakis 2016), “A bridge or tunnel strike (henceforth BrTS) is an incident in which a vehicle, typically a lorry or double-decker bus, tries to pass under a bridge or tunnel that is lower than their vehicle, therefore colliding with the bridge or tunnel.” This definition specifically focuses on overheight BrTS collisions. In a broader sense, BrTS includes multiple types of bridges (e.g., bridges over highways or railways, or pedestrian bridges) and various components of a bridge/tunnel being struck by a motor vehicle (in particular, a truck). Distinguishing bridges by type and recognizing that a truck can strike a bridge in distinct places: is crucial for identifying the source of risks and evaluating the impacts. Figure A2 lists the types of collisions: (A) under-bridge collision with superstructure, (B) under-bridge collision with substructure, or (C) on-bridge collision with superstructure. Although strikes to bridge supports can be catastrophic, and collisions occurring on bridges represent a considerable portion of all vehicle hits involving bridges, strikes to the bridge superstructure (e.g., girder, truss) by OHVs are more prominent in crash statistics. In this study, OHV are defined as vehicles and loads beyond legal size limitations; or standard size vehicles that are beyond a local height limitation of a specific bridge, or tunnel.
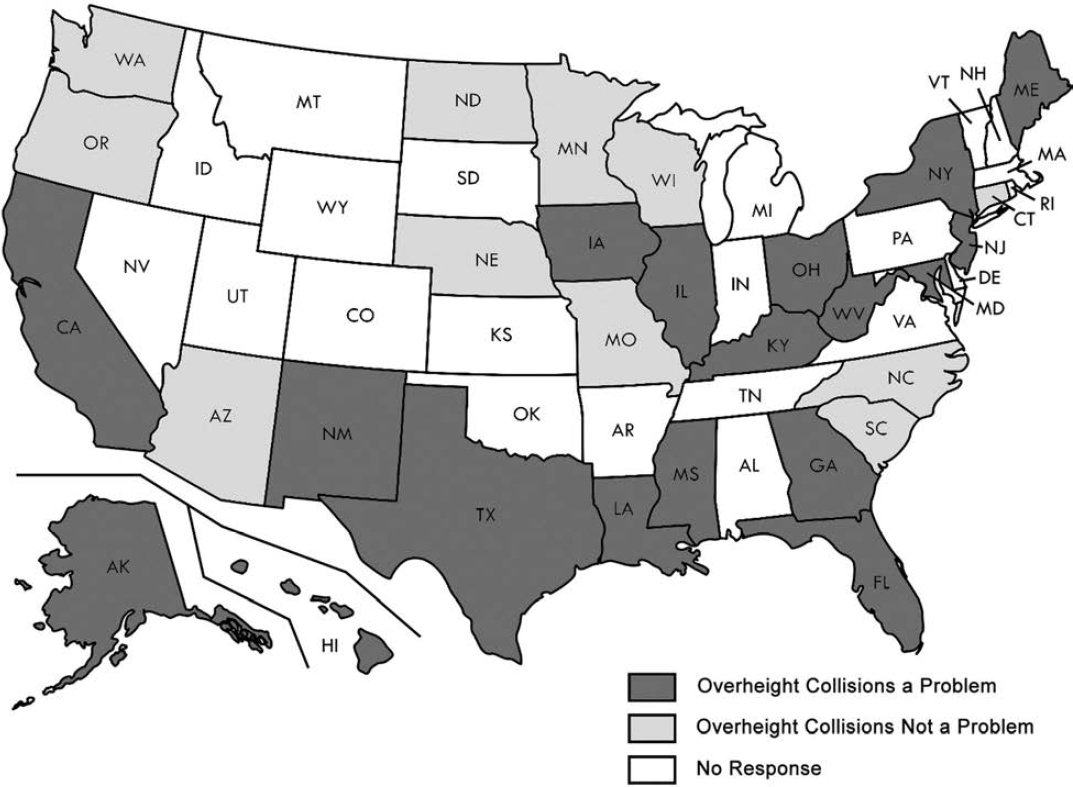
Over-height collisions were identified as a serious problem by 18 of the 29 respondents to poll by the University of Maryland (Fu, Burhouse, and Chang 2004) (Figure A3). Fu et al. (2004) reported that in Maryland overheight collisions had increased by 81 percent between 1995 and 2000, and of the 1,496 bridges susceptible to impact, over 300 (around 20 percent) were hit at some point in their lifetime of data available.
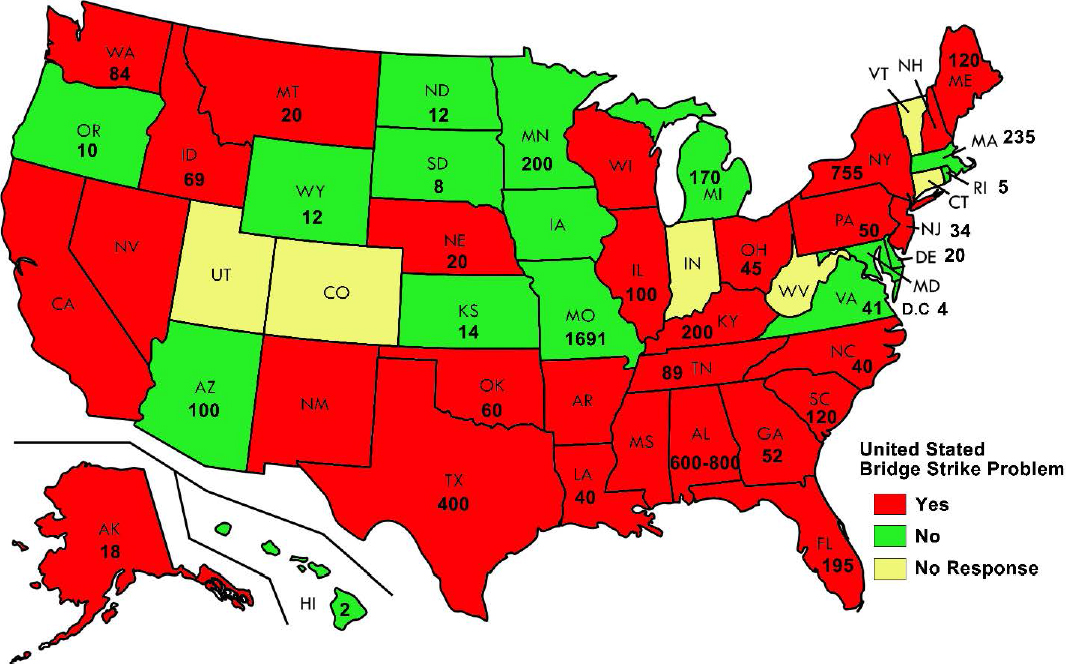
The most recent study on the seriousness of overheight collisions across the US was conducted by Agrawal et al. (2011). The authors noted that of the 44 DOTs and two local authorities that responded, the majority consider overheight collisions to be a major problem. This report presented a map showing the total number of OHV strikes from 2005 to 2008 across the nation (Figure A4). The color denotes the perceptions of the seriousness of bridge hit problem by states which may not be determined by the strike frequency. The authors further noted that states like Missouri always reported hits regardless of the impacts and these states; therefore, Missouri, for example, didn’t perceive bridge hits a serious problem in spite of 1,691 hits to bridges from 2005 to 2008. Other states like Louisiana only reported hits when there was serious damage to the bridges. As a result, Louisiana perceived bridge hit as a serious problem although there were only 40 hits.
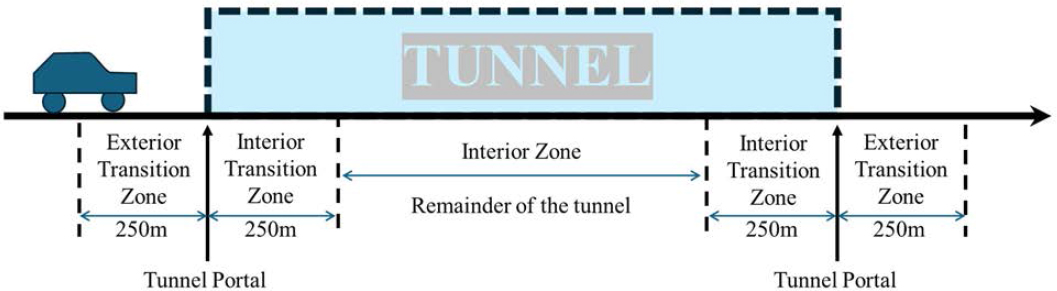
Data collection, archiving, and sharing plan. Most tunnel-truck collision occurrences are similar to an under-bridge collision with a superstructure. Despite the fact that a vehicle collision involving a tunnel entrance might be viewed as similar to an under-bridge collision with the superstructure, collisions occurring within tunnels have a completely different impact. The TR Special Issue “Tunnels – Safety and technology advances in the US and beyond” highlights the following as a research direction: “develop a national tunnel incident database to improve design, prevention, and response” (Ernst and Western 2020). The top issues concerning tunnel safety are fixed firefighting systems and lighting. A study on collisions in Norwegian road tunnels (Amundsen and Ranes 2000) showed that the severely-injured crash rate is higher in tunnels than on any other segment of the national road network. The crash rate is the highest in zone 1 [50m beyond the tunnel openings], followed by the transition zone [50m on either side of tunnel openings], and was the lowest in the mid-zone [the remainder of the tunnel]. The rear-end crash rate was higher compared to other crash types. Furthermore, traffic exposure is a critical factor contributing to BrTS collisions, as the authors found that the crash rate increased with an increase of traffic volume and decreased with a longer tunnel length.
BrTS Data Analysis
Many studies have sought to describe the relationship between BrTS and their contributing factors, and some have developed and calibrated prediction models based on actual strike data. These methods for estimating the risk of BrTS range from descriptive crash statistics to the NB regression model. Before digging deeply into risk analysis and modeling, it is necessary to understand the basic patterns and trends as well as the key factors contributing to BrTS collisions.
Causal Analysis of Traffic Crashes Involving Bridges and Tunnels
Several studies have explored the causes of bridge and tunnel collisions. In 1973, an early study pinpointed “inadequate vertical clearance” in Virginia (Hilton 1973), while Retting et al. (2000) found New York bridges had higher crash rates due to factors like transition zone changes. However, a later study in Norway observed the highest crash rates on roads near bridges, presenting a contrary perspective (Sagberg, Elvik, and Langeland 2020). (Martin and Mitchell 2004) in the United Kingdom (UK) cited unawareness of vehicle height, absence of low-bridge routes, and poor signage as key collision causes, aligning with Galer (1980) findings on drivers’ misunderstanding of height warnings. Horberry et al. (2002) suggested that misleading markings could lead to cautious navigation decisions near bridges. In 2014, a survey highlighted that a third of motor carriers blamed GPS navigation errors for directing vehicles towards inadequate clearances (Park and Fender 2014). The FMCSA acknowledged the absence of crash data related to navigation system errors but stressed the importance of using suitable navigation tools to avoid strikes (FMCSA 2014). This shows a literature gap in navigation system usage for avoiding bridge strikes, possibly due to liability issues for legally loaded trucks engaging low-clearance bridges.
As early as 1973, Hilton investigated collisions involving highway bridges in Virginia and listed “inadequate vertical clearance” as one of the key contributing factors. This study used crash reports, field evaluations, and state police and highway engineer survey responses.
By studying 1,381 crashes in four urban bridges carrying between 68,000 and 133,000 vehicles per day in the New York metropolitan area, found that all bridges had significantly higher crash rates than the approach roadways. Differences in crash rates between bridges and approach roadways can be attributed to factors such as changes in transition zones, bridge geometry, substandard guiderails and barriers, and improper or defective traffic controls. Four crash types (i.e., rear-end, sideswipe/overtaking, fixed object, and debris-related crashes) accounted for 90 percent of the bridge crashes, and fixed object crashes (i.e., bridge hits on the bridge) made up 11 percent of all vehicle-bridge crashes. However, the author did not specify the factors contributing to fixed object crashes.
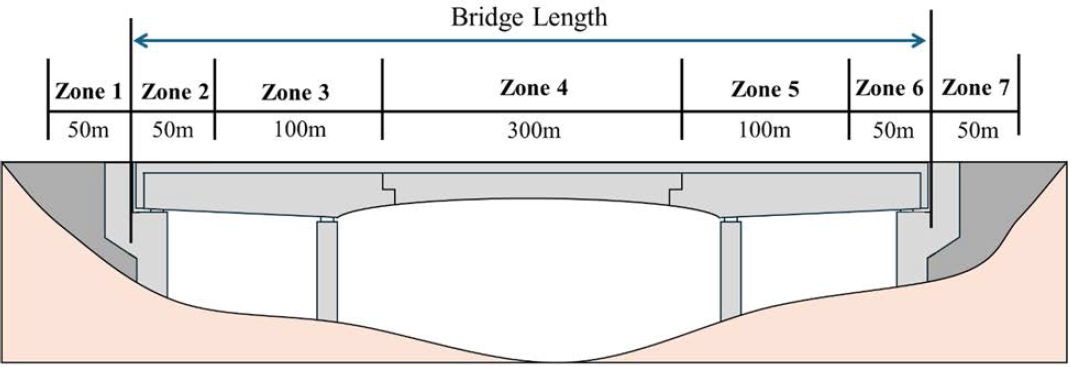
In Norway, estimated rates of single-vehicle crashes on road sections adjacent to road bridges and on different sections of the bridges (up to seven bridge zones, depending on bridge length, shown in Figure A5). Based on a chi-square statistical test, they found that crashes were highest on the roadway segments immediately adjacent to the bridge (i.e., Zone 1 and Zone 7 in Figure A5), which is contrary to Retting’s findings.
Another study in the UK that investigated factors leading to vehicle-bridge collisions revealed three main causes: 1) drivers being unaware of the height of their vehicles or cargo; 2) absence of alternative routes around low bridges and insufficient routes planning by haulers; and 3) poor signage both at and approaching low bridges (Martin and Mitchell 2004). Moreover, this study identified contributing factors to vehicle-bridge collisions, including inadequate signs, distractions, positioning of signs, driver cognizance, and bumpy road conditions. These findings agree with those from a study by Galer (1980) that identified two possible reasons for vehicle-bridge collisions: drivers’ lack of knowledge of their vehicle heights, and drivers’ lack of understanding of low bridge warning signs. The study further pointed out that only 12 percent of drivers were correct in their estimate of their vehicle height, and only 27 percent of drivers were within 76 mm of the correct height. In a separate study, found that improper marking designs might confound drivers, affecting their level of caution when making decisions about bridge navigation (i.e., drivers tend to be more cautious the closer they are to the bridge).
In a 2014 survey, 33 percent of motor carriers described situations in which they believed GPS navigation errors contributed to crashes (i.e., being directed to roads with inadequate bridge/overpass clearance). According to FMCSA, “FMCSA’s information systems do not have crash statistics associated with the use of electronic navigation systems. However, even one truck or bus striking an overpass is one too many, which is why the Agency is taking action to ensure professional truck and bus drivers know the importance of selecting the right navigation system.”. There are no available studies of inaccurate GPS navigation information and/or relevant policies on permitting and escorting as factors contributing to these collisions. One plausible reason for this gap in the literature is that truck drivers do not use navigation systems as a primary tool to avoid bridge strikes for over-dimensional loads; also, liability issues may arise if trucks carrying legal loads are using GPS tools and hitting bridges at or below 13’6”.
Bridge and Tunnel Inventory Data
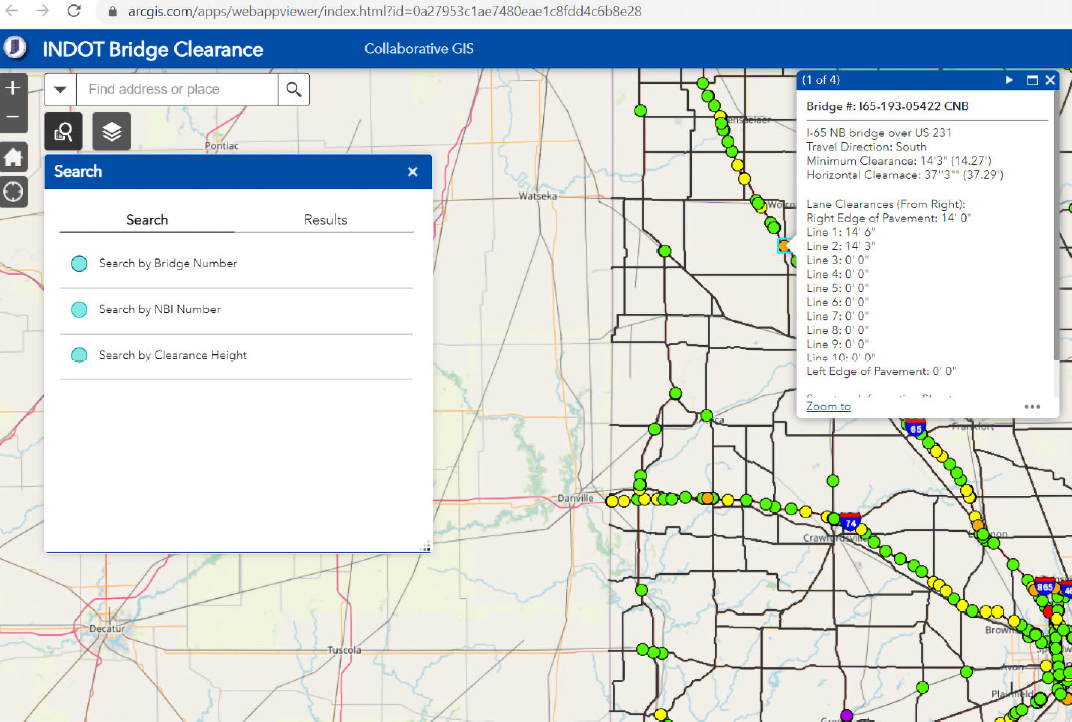
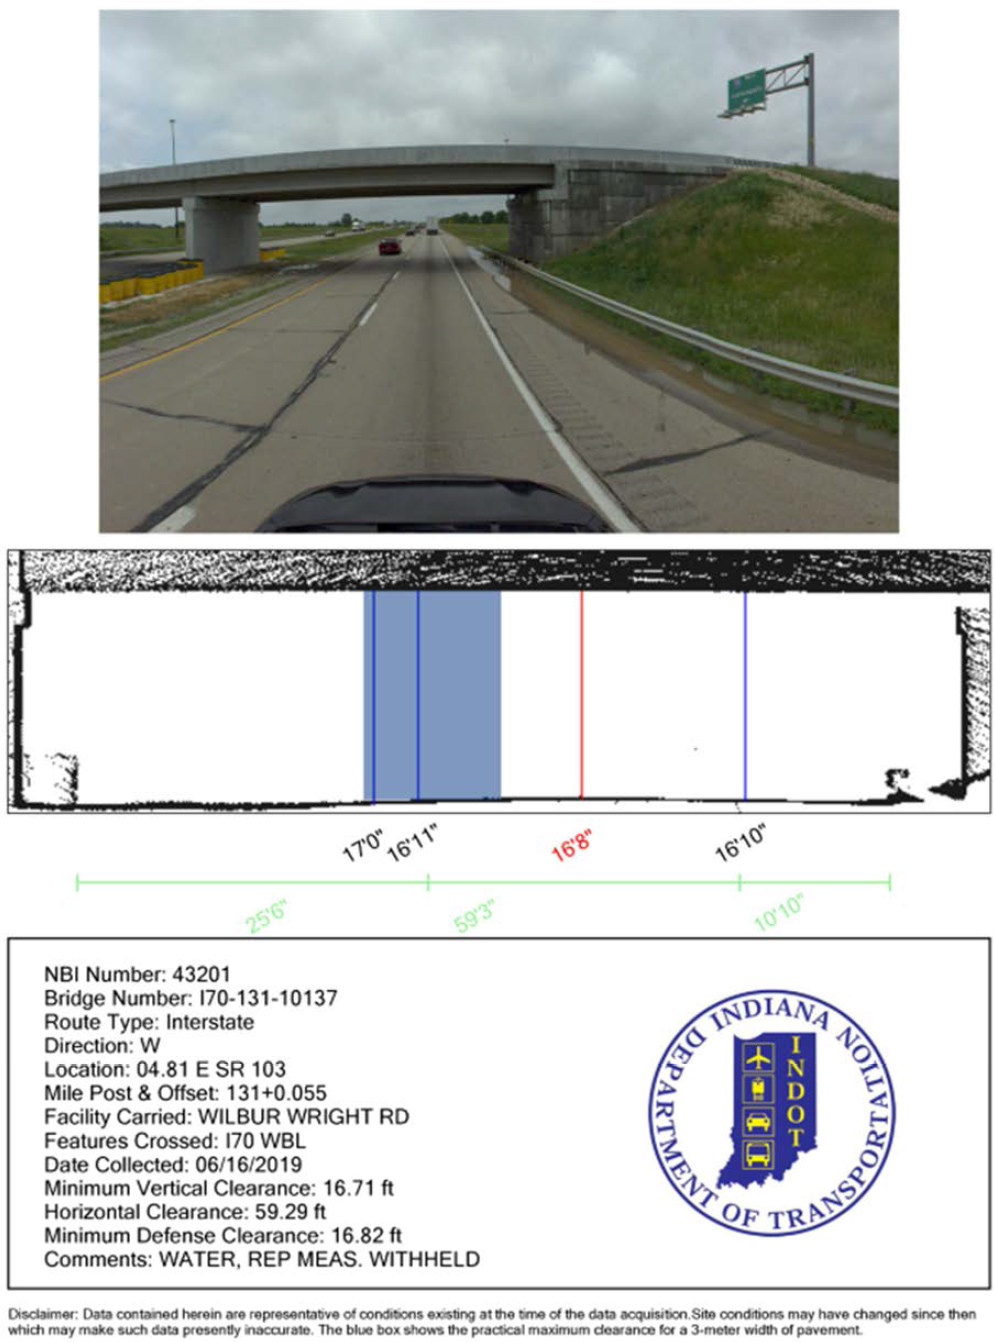
In addition to the patterns/trends and characteristics contributing to BrTS collisions, the achievement of the reliable risk analysis and modeling method depends on the data. The two most crucial groups of data are BrTS collision data and bridge/tunnel inventory data. The NBI is a comprehensive database for bridges that includes identification information, bridge types and specifications, operational conditions, and more. However, the NBI has missing, erroneous and logically conflicting information (Dedman, n.d.; Dekelbab, Al-Wazeer, and Harris 2008; Din and Tang 2016) due to user errors during data entry; similar issues afflict the NTI. States also maintain separate inventory databases of bridge/tunnel information (e.g., clearance) that meet federal reporting requirements and inform infrastructure management needs. For example, Indiana DOT (INDOT) collects, maintains, and reports lane-by-lane clearance measurements and other data on over 2,100 bridges throughout the state, as illustrated in Figure A6. Figure A7 shows an example of a custom Structure Information Sheet (SIS) sheet, including bridge photos, bridge sketch plans, and attributes such as the minimum vertical clearance and horizontal clearance.
Both the crash and inventory databases contain rich and valuable information, but they are in separate “silos”. Although the MMUCC (NHTSA 2017) has a built-in mechanism for linking bridge crashes with NBI data through a Bridge/Structure Identification Number, MMUCC compliance varies across states. The situation is more pronounced for tunnel collisions, as MMUCC combines tunnels with non-tunnel structures in the nondescript category “other”. Meanwhile, both highway structure inventory and crash database have many tables, hundreds of data elements, and tens of thousands of records. The scale of the databases and the complex relationships among them make it a challenge to extract useful information.
State of Research in BrTS Risk Analysis and Modeling
One of the most critical tasks toward preventing and mitigating the risk of BrTS by motor vehicles is developing a risk-based, data-driven approach to evaluate the risk of BrTS collisions. Instead of using simple descriptive analysis, it would be more helpful to analyze BrTS related crashes via more sophisticated methods such as risk analysis and modeling. Meanwhile, attention should also be given to specific types of strikes, types of bridges, and types of vehicles (all or trucks only).
Risk Cubic for Transportation Asset Management
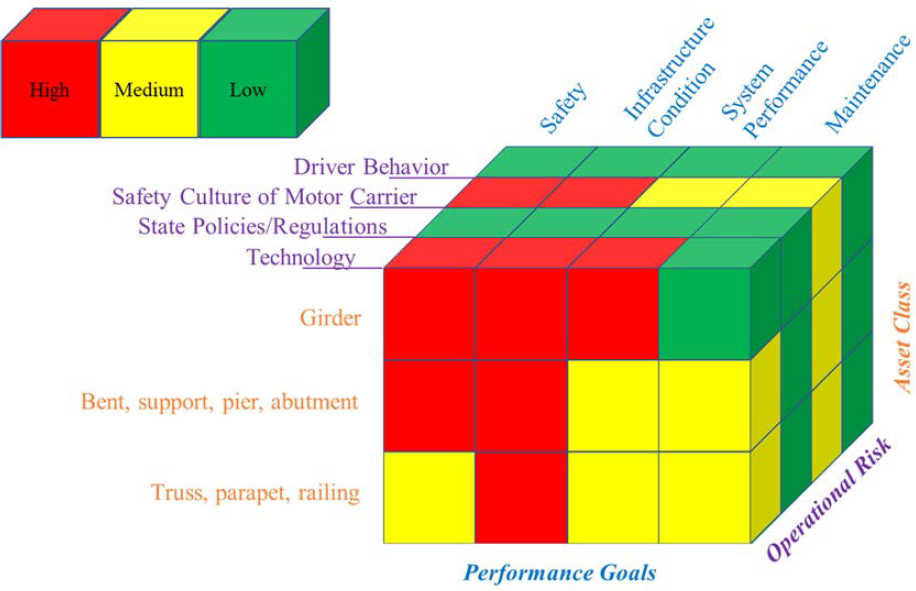
From a more general perspective, BrTS risk analysis and modeling are part of transportation asset management for critical infrastructures. As specified in the AASHTO Transportation Asset Management (TAM) Guide developed through NCHRP 08-109A, a five-step tactical procedure of risk management includes: 1) establish the context, 2) identify potential risk factors, 3) analyze data, 4) evaluate potential countermeasures, and 5) treat risks (AASHTO 2018). The concept of risk is a rational approach for considering this problem because risk accounts for both the likelihood of a hazardous event occurring (i.e., a BrTS) as well as the consequences. Including both likelihood and consequences in risk assessment provides important context. A quick and effective way for assessing the risk of BrTS collisions can be adopted from previous studies (Anderson 2016; Anderson, Schaefer, and Nichols 2016) by creating a risk cube with qualitative levels of risk for each element, as shown in Figure A8.
The risk cube with qualitative levels of risks presents a desirable framework for agencies to assess risks and develop strategies to mitigate them with the quantitative measures. This is where the data-driven risk analysis and modeling is applied. Most studies in the literature have focused on the technical aspects of bridge design, construction, and maintenance; only a few developed crash frequency and crash injury severity models. Since bridge strike collisions and tunnel strike collisions have completely different mechanisms, the remainder of this section is separated into two subsections.
Research in Bridge Strike Collision Risk Modeling
Geedipally et al. (2010) applied the NB regression model to estimate crash risk involving heavy vehicles and bridge piers. Lane width, shoulder width, and bridge density were identified as significant factors impacting such crashes. The authors also found that a bridge is more likely to be hit by a heavy vehicle if it is located on a horizontal curve than if it is located on a tangent section. (Elvik, Sagberg, and Langeland 2019) identified factors contributing to variation in the number of injury crashes on bridges in Norway using NB regression models. The results were drawn from 1,368 crashes involving 6,824 bridges, and AADT, was found to be the single most important factor influencing the number of accidents.
Qin et al. (2014) collected 5 years of truck run-off-the-road crash data, information on interstate highway geometric characteristics, and traffic information to develop crash prediction models for bridge bents (a substructure unit that supports each end of a bridge span). The bent-based predictive methods improved the collision risk estimate by evaluating the individual bents of a bridge on the basis of roadway geometrics and traffic conditions. As a follow-up (Qin, Shen, and Wehbe 2016), a risk-based approach was developed from statistical models, probabilistic theories, and a comprehensive data set. The random coefficient Poisson model was used to model truck crashes so that data heterogeneity among highway segments could be captured. Monte Carlo simulation was employed to estimate the collision hazard envelope, given the uncertainties of truck size, encroachment, and vehicle orientation angle. Finally, collision risk was calculated for each bridge bent, and the maximum value was considered as the bridge collision risk. In addition, lateral encroachment-based models, a probability theory-based method that exploits the concept of lateral offset in NCHRP Report 492 (Mak and Sicking 2003), also offer a means to estimate the likelihood of a vehicle hitting a bridge abutment after it departs the travel way.
Mehta et al. (2015) developed safety performance functions (SPFs) using the NB regression model for crashes on highway bridges (upper structure) in Alabama. It was found that increases in traffic volume, bridge length, and shoulder width lead to a higher expected number of crashes, while an increase in the percentage of trucks in the traffic stream leads to a reduction in the expected number of crashes.
A research project funded by the Iowa DOT used the NB model to identify crash factors for bridge rail on secondary road bridges (Hans, Bektas, and Phares 2016). Bridges with the following characteristics were found to have higher crash rates: 1) traffic volume greater than 400 vehicles per day (vpd) (paved) or greater than 50 vpd (unpaved), 2) bridge length greater than 150 ft (paved) or greater than 35 ft (unpaved), 3) bridge width narrower than its approach (paved) or narrower than 20 ft (unpaved), and 4) bridges older than 25 years (both paved and unpaved). The study further denoted that bridge piers, abutments, and railing ends have been considered as high severity hazards.
The road surface on bridges can be more slippery than the approach roadway surface, and the driving conditions can be aggravated by inclement weather such as crosswind, ice, and snow. Khan et al. (2009) used the cross-network K-function method and GIS techniques to identify clusters of ice-related bridge crashes in Wisconsin. Ice-related crashes were found to cluster at bridge locations, suggesting that low friction and ice on the road surface can be major contributing factors to crashes on bridges (Khan et al. 2009).
The consequence of a bridge hit can be severe for the motor vehicle occupants due to the differences in speed, mass, and rigidness. In a New Jersey study, the authors applied Firth’s penalized-likelihood logistic regression model to examine the impact of explanatory variables on crash severity. Using 5 years (2011–2015) of crash data from the New Jersey crash database and bridge data from the Long-Term Bridge Performance portal, they found that driver age, weather conditions, surface conditions, lighting conditions, speed limit, roadway characteristics, and direction of traffic were statistically significant in affecting the severity of bridge-related crashes (Jalayer et al. 2021).
Research in Tunnel Strike Collision Risk Modeling
Studies on tunnel strikes seem to have a different focus on the influence areas (e.g., transition, entry, interior, existing) than the zones defined for bridges. Zonal studies of tunnel safety may require additional data collection and processing.
Lemke (2000) conducted a study of 784 crashes in Germany, including 46 freeway tunnels and 22 rural two-lane highway tunnels. This study found that tunnels are much safer than open-road sections. The authors noted that the accident rate was higher near the tunnel entrances because of the sudden change in visual environment as well as the lighting conditions, but that the accident rate was not significantly elevated at tunnel exits. Meng & Qu (2012) established the relationship between the proposed exposure to traffic conflicts and tunnel crash count by using NB models. It was found that the expected value of tunnel crash frequency has a proportional linear relationship with the proposed exposure to traffic conflicts.
Another study in Singapore examined 608 tunnel collisions from 2009-2011 to investigate tunnel collision characteristics in urban road tunnels (Yeung and Wong 2013). Results of this study found that crash rates are higher in transition zones compared to interior zones (shown in Figure A9), while mean casualty per crash was higher in the interior zones. Crashes were more likely to occur when entering the tunnel than exiting.
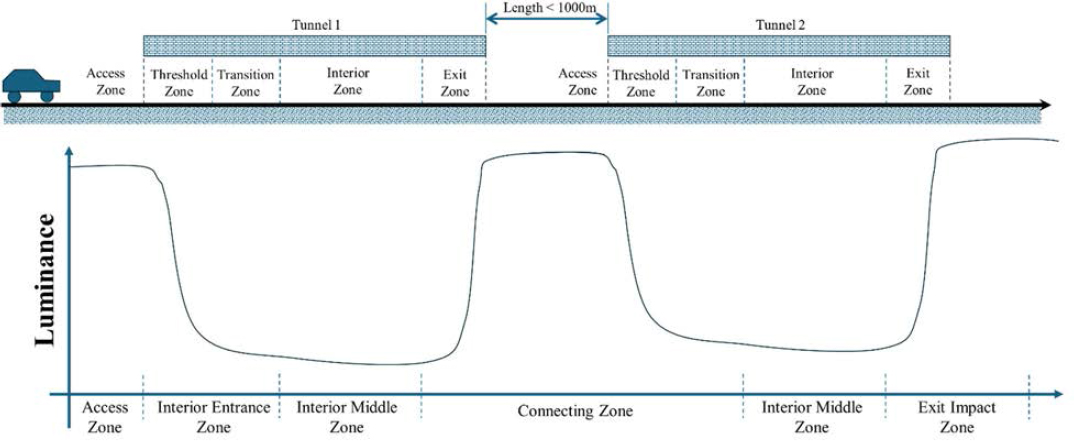
Wang et al. (2018) applied five-zone analytic approaches (access zone, interior entrance zone, exit impact zone, connecting zone, and interior middle zone; as shown in Figure A10) to study the risk factors for freeway tunnel collisions, finding that the connection zone has the highest crash rate. Regarding the light conditions, it was found that the interior entrance zone has a significantly higher proportion of crashes during the daytime while the exit impact zone is associated with a higher proportion of crashes at night. Such results show that tunnel crashes are more likely when a vehicle is moving from bright to dark environments.
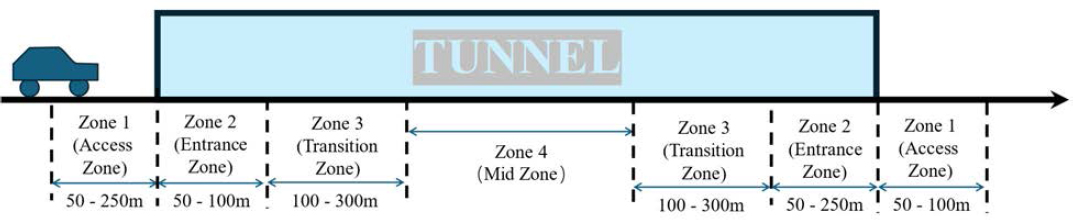
Pervez et al. (2020) found the following results after utilizing a six-zone analytic approach (access zone, entrance zone, transition zone, mid-zone, exit zone, and outside the tunnel exit; as shown in Figure A11): 1) crashes are more frequent at the transitional location from one zone to another, 2) rear-end and fixed-object crashes are more common near the tunnel, and 3) the change of lighting condition — daylight outside and artificial light inside the tunnel — has an impact on crashes.
Utilizing field test data from 50 participants (26 male and 24 female), Miller & Boyle (2015) conducted a study to evaluate stress as drivers traversed along an interstate route that included tunnel and non-tunnel segments, as well as a 75-m transition period before the tunnels. Vehicle kinematics, GPS location and images from video recording, and electrocardiogram (ECG) data were collected for analysis. The following conclusions were made in the study: 1) transition area had the higher standard deviation of speed and braking than the respective open road segment; 2) the standard deviation of speed and braking were higher within tunnels than on the respective transition segment; and 3) traffic speed decreased before entering the tunnels and within the tunnels, but it increased while exiting the tunnels, while driver stress level also changed (increased) inside the tunnels.
In order to identify and understand factors affecting crash injury severity in freeway tunnels in China, Ma et al. (2016) applied the generalized ordered logit model to study one-year police reported crash data. The study revealed that crashes near the tunnel entrance/exit tend to be more severe than those inside the
tunnels. Additionally, abrupt changes in light, weather, and geometry conditions near the tunnel entrance/exit could cause serious crashes, and the length of tunnels positively affect the increase of severe injuries. Similar studies or conclusions could also be found in several other publications that explored the risk factors of tunnel crashes in China (Jiang et al. 2016; Lu et al. 2016; Huang et al. 2018).
Hou et al. (2018) applied a correlated random parameters NB (CRPNB) model to investigate the safety effects of traffic patterns, the tunnel design, and the pavement conditions to tunnel collisions. Based on the results, the authors concluded that traffic volume, tunnel length, proportion of heavy trucks, curvature, and pavement rutting were associated with higher frequencies of traffic crashes, while the distance to the tunnel wall, distance to the adjacent tunnel, distress ratio, International Roughness Index, and friction coefficient were associated with lower crash frequencies. Furthermore, it was recommended to avoid sharp curvature and increase lateral clearance of the bridge wall to improve safety.
Recently, Jung & Qin (2021) took a data-driven approach to quantitatively examine tunnel traffic safety-related strategies recommended by the Korea Ministry of Land, Infrastructure and Transport. The study used the random forest-based binomial regression and found several risk factors that significantly impact serious injury crashes involving freeway tunnel strikes: adverse weather, fatigued and distracted drivers, collision type (i.e., head-on/angle/rear-end), tunnel exit, tunnel width, curve radius (radius less than 1800 m), and heavy vehicles. Moreover, the study compared specifications of each government strategy with the effects of the identified risk factors on injuries involved in tunnel crashes to quantitatively support recommendations to modify the government strategies.
State of Practice in BrTS Reporting
Preventing and mitigating BrTS is challenging because of the multitude of contributing factors, lack of timely data updates, and information silos. As discussed previously, the NBI and NTI are comprehensive databases, but they have several issues, including those related to data quality, linkages to the crash databases, and variability among states in the relevant crash data element definitions. Moreover, agencies who are responsible for collecting and reporting crash data, developing bridge improvement projects (e.g., resurfacing, rehabilitation) and issuing OSOW permits may not communicate effectively on a timely basis, which creates information silos.
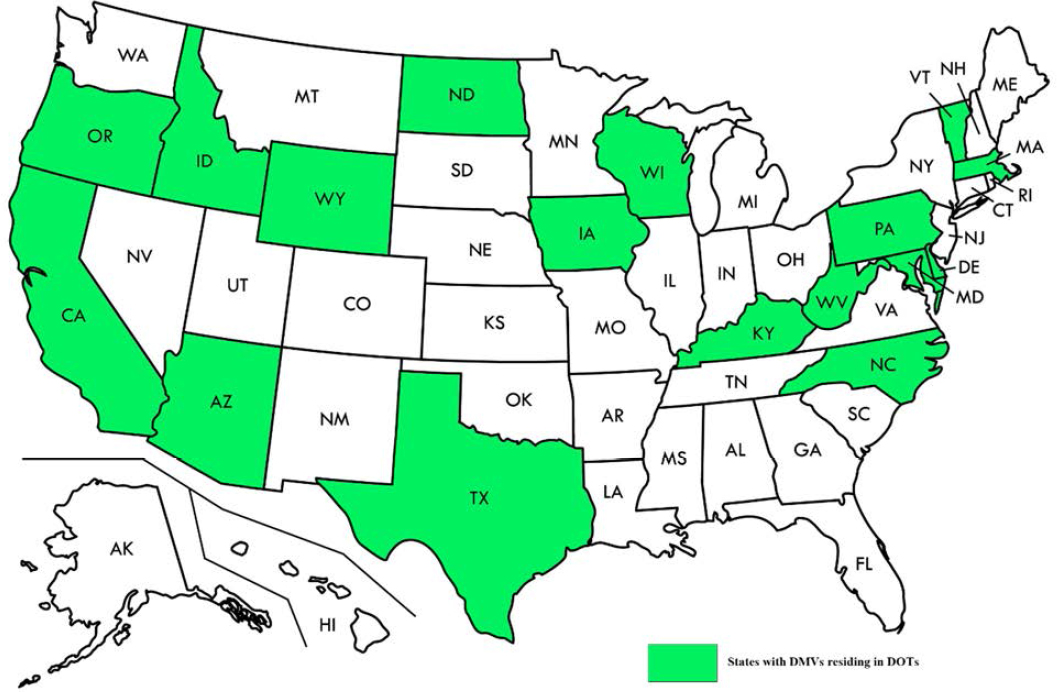
As early as 1988, an NCHRP report on uniformity in oversize and overweight permits has addressed the issue of overheight permitting (Humphrey 1988). A possible obstacle to obtaining permits may be the necessity of obtaining a permit from each state or jurisdiction along a truck’s route as well as the lack of consistency in overheight regulations among states. Solutions discussed in the report include groups of states issuing regional multistate permits or the use of private permitting organizations to obtain multiple permits. Another possible issue is that the permitting authority may reside in a different agency than the responsibility for bridge inspections. As just one potential example, the Department of Motor Vehicles (DMVs)) are tasked with issuing OSOW permits in some states and the DMV resides within the DOT in only 17 states, as seen in Figure A12. Even when the permit operation is managed by the state DOT, lines of communication between the permit office and the bridge inspection operation may be limited by organizational barriers. The problem for truckers and thus for safe routing is exacerbated by the need for permits within urban areas with home rule (e.g., New York City) so that multiple permits may be required for travel within a single state.
WisDOT Truck Route Evaluation and Efficiency was designed specifically as a system planning and improvement tool; however, it also has been a great operational resource in vetting daily permit requests to define alternative route options, as well as updating WisDOT design guidance for roadways, intersections, and pavement, according to a TR News (Titi et al. 2019).
A recent NCHRP synthesis addressed permitted night and weekend movements of over-dimensional loads (Bittner and Silber 2021). This study highlighted a variety of permitting practices and procedures for escorting and routing. While not specific to BrTS, the synthesis detailed the challenges associated with inaccurate routing and interstate differences.
A study conducted by Fu et al. (2004) used nationwide data collected from the NBI and a survey sent to each state to examine trends in overheight collisions over time. The authors compiled overheight countermeasure strategies in place in the US and found that 17 out of 29 responding states maintain records on overheight collisions. Among the 17 states, four collect data from accident reports only (24 percent), five from bridge inspections only (29 percent), and eight from both sources (47 percent). Few states provided data with information on collision injury outcomes (6 states), damage costs due to overheight accidents (4 states), and vehicle types (8 states).
Most state agencies, as part of their bridge damage inspection procedure, have methods for rating a bridge after the impact and include policies for an efficient and effective response. Few have methods for proactively assessing bridges for the risk of being hit. The NYSDOT has created a CVA procedure to determine the relative vulnerability of the state’s bridges to failures caused by impact damages, enabling efficient and effective implementation of necessary vulnerability reduction measures(Agrawal, Xu, and Chen 2011). For each bridge, a collision vulnerability rating is computed using the CVA procedure, which involves a series of assessment and evaluation steps tailored to the bridge’s unique features. This rating indicates the probability and the consequences of, specifying the necessary corrective actions to mitigate
vulnerability and the urgency of their implementation. However, the current collision vulnerability manual is 15 years old. Based on this analysis, updates to the CVA procedures have been proposed to ensure that frequently impacted bridges are classified as highly vulnerable.
State of Practice in BrTS Prevention and Mitigation
This section discusses the findings of both nationally and internationally implemented BrTS prevention and mitigation strategies and countermeasures. Both operational- and technology-related strategies and countermeasures are covered.
The most recent report published by PIARC has provided a comprehensive review on most of the available BrTS prevention and mitigation techniques, where surveys were published online and institutions from different countries were encouraged to respond to it. These institutions included bridge owners, tunnel owners, consultancies, tech providers, and research institutions. There was an emphasis on not just focusing on countermeasures that could be applied to high-income or first world countries. The purpose of the report was to determine common and emergent countermeasures that could be applied for detecting and mitigating bridge/tunnel strikes and to determine the cost-benefit of each one. A summary table can be seen below in Table A1.
The countermeasures mentioned in the report were collected and divided into the categories described in the table. The categories mentioned were passive, sacrificial, detection, active, and driver-based. A brief description of each countermeasure as well as what their purpose is, was provided. The effectiveness of each countermeasure has been provided in the table based on literature review by the study. Also, the cost-benefit analysis has been conducted for each countermeasure by the report and included in this table. The only outlier for cost-benefit analysis was driver-based countermeasures as their effects typically extended past a single bridge or series of bridges in a network.
Table A1. Summary of Countermeasures for BrTS Prevention and Mitigation (adopted from (Connolly, Kakouris, and Kelly 2022))
| Countermeasure | Type | Details | Purpose | Effectiveness | Cost-Benefit Ratio |
|---|---|---|---|---|---|
| Static Signage | Passive | Signage placed on roadways to indicate bridge height to warn drivers | To warn and inform the driver | 10%-20% | 1.39 |
| Flashing signage | Passive | Located on the road and designed to attract the attention of the driver to notify oversized vehicles of possible detours. | Ensure that the driver sees the sign | 10%-20% | 2.12 |
| Variable message signs | Passive | They are electronic traffic signs used on roadways to give travelers information about travel conditions. The message shown is updated as required and, in this context, can warn the upcoming vehicle of its excessive height. | Provide warnings or information accurate to the current situation based on traffic and vehicle size | 10%-20% | 0.04 |
| Speed Bumps | Passive | Bumps on the road made to slow down the driver of the vehicle which in turn helps them focus on their surroundings and might lead to them not missing a sign. | Slow down the driver to focus them on signs and road condition | 10%-20% | 0.99 |
| Rumble strips. | Passive | Similar to bumps, as they are indentations in the ground that cause the vehicle to rumble when driven over and can help drivers focus on their surroundings and not miss a sign. | Slow down the driver to focus them on signs and road condition | 10%-20% | 0.99 |
| Sacrificial Beams | Sacrificial | Horizontal structural members installed at the structure location protecting the structure itself from overhead collisions from high sided vehicles | Protect main structure from damage | 30%-50% | 0.22 |
| Portal Frames | Sacrificial | Structure with a strong horizontal crash beam placed in front of the overpass to protect it against incoming overheight vehicles | Protect main structure from damage | 30%-50% | 0.22 |
| Metal Strips/Bells | Sacrificial | Chains or bells hanging from a gantry and positioned at a moderate distance from the structure. An oversized vehicle would be hit by the chains and warned of the low clearance bridge in the distance. | Create an auditory warning to an overheight vehicle | 30%-50% | 0.1 |
| Fiber Optics | Detection | Fiber optic cables measure local strain changes when they are struck by an oversized vehicle. | Detect when a bridge is struck | 50%-80% | 0.49 |
| Countermeasure | Type | Details | Purpose | Effectiveness | Cost-Benefit Ratio |
|---|---|---|---|---|---|
| Laser vision | Active | This technology is used along with a float in midair pseudo-holographic ‘STOP’ sign message on a water screen which warns the oversized vehicle driver to stop | Detect when an oversized vehicle is approaching and produce warning sign | 30%-50% | 0.03 |
| Radar Systems | Active | Eye safe sensors applied within fixed installations such as gantry, bridge or poles, and mobile systems. Based on their location, they measure several information of traffic and vehicles on single or multilane, and approaching and/or receding vehicles. Using these measurements, they can detect OHVs and flash a warning sign to warn the driver. | Detect when an oversized vehicle is approaching and produce warning sign | 50%-80% | 0.55 |
| OHV Detection Systems | Active | An innovative laser ranging overheight vehicle detection system which is installed on the bridge being protected and detects incoming over height vehicles at a safe stopping distance. The laser detects the vehicles and warns the drivers by using a standard warning sign with flashing beacons installed on the bridge face next to the detector. | Detect when an oversized vehicle is approaching and produce warning sign | 50%-80% | 0.55 |
| Computer Vision Techniques | Active | In these systems, video streams are collected from a camera attached to low clearance structures and processed to detect vehicles and ultimately measure their heights. They are not usable during night hours and low light conditions. | Detect when an oversized vehicle is approaching and produce warning sign | 50%-80% | 0.23 |
| Infrared light Technology | Active | Infrared dual beam arrays are optoelectronic sensors that rely upon the interruption of a beam or sheet of light to indicate that a vehicle exceeds a predefined height threshold. This countermeasure is combined with additional measures to warn the drivers when the oversized vehicle is detected. | Detect when an oversized vehicle is approaching and produce warning sign | 50%-80% | 0.55 |
| Piezoelectric | Detection | These sensors measure the dynamic displacement of structures due to a strike. Piezoelectric transducers are subjected to force deformation such as compression or shear | Detect when a bridge is struck | - | 0.49 |
| Countermeasure | Type | Details | Purpose | Effectiveness | Cost-Benefit Ratio |
|---|---|---|---|---|---|
| Accelerometers | Detection | These sensors measure the dynamic displacement of structures due to a strike. Accelerometers sense acceleration in one to three orthogonal directions. These systems are key to addressing a different aspect of the bridge / tunnel strike problem – unreported strikes. | Detect when a bridge is struck | - | 0.49 |
| Driver education awareness | Driver-Based | Highlighting the risk of personal injury and liability. This leads to a driver being more aware to the dangers of an OHV collision and the costs attributed to it. | Encourage the driver to be more aware | - | - |
| Heavy Vehicle Goods License Test | Driver-Based | A test created in order to determine the capability of the driver in operating a heavy vehicle goods vehicle. | Ensure well equipped drivers are on the roadways | - | - |
| Good Practice Manuals | Driver-Based | These best practices encourage drivers to check the height of the vehicle and display the height in their cab before commencing a journey. | Provide information to help driver navigate properly | - | - |
| GPS | Driver-Based | GPS systems are used by overheight vehicles to indicate where low bridges are located. A small unit is installed in the vehicle cab which compares the registered vehicle height with the bridge clearance. If the height of the vehicle is greater than the vertical clearance of the structure, video and audio warnings are activated within the vehicle to warn the driver of the upcoming collision. | Provide information to help driver navigate properly | - | - |
| Fines/Fees | Driver-Based | Fines/fees imposed on the driver/motor carrier to encourage them to avoid OHV collisions either with more awareness or better implementation of strategies. Such as, a permit fee or an unpermitted vehicle/illegal height vehicle fine. | Encourage the driver to be more aware | - | - |
| Maps | Driver-Based | Pre-routed maps made for drivers based on their current vehicle height. Can be helpful in keeping the driver on the route that fits their vehicle. | Provide information to help driver navigate properly | - | - |
| Countermeasure | Type | Details | Purpose | Effectiveness | Cost-Benefit Ratio |
|---|---|---|---|---|---|
| Policies | Driver-Based | Policies created by DOTs or other government agencies to create an environment where the driver has as much knowledge and training as possible in order to properly navigate a roadway network. | Encourage the driver to be more aware | - | - |
| Increased structure vertical clearance | Other | Increasing the vertical clearance of the structure | Lower crash rate through structure alteration | - | 0.02 |
| Road narrowing techniques | Other | Narrowing the road in order to increase driver awareness and alertness. | Slow down the driver to focus them on signs and road condition | - | 0.06 |
| Bridge markings | Other | Signs/Markings placed before the bridge to warn the driver of an oncoming low clearance bridge. | To warn and inform the driver | - | 0.57 |
| Vehicle redirection in case of excessive dimensions | Other | In case of detecting that an oncoming vehicle is oversized/overweight, provide proper detouring and rerouting in order to safely divert the vehicle. | Provide information to help driver navigate properly | - | 2.12 |
| Clear heights signage and obstacles related to dimensional loads | Other | Ensuring that all the signage and other techniques in place are clear and can be viewed easily by the driver. | Provide information to help driver navigate properly | - | 1.48 |
Nguyen & Brilakis (2016) outlined three BrTS protection schemes: passive system (physical methods include static signage, VMS, beacons/flashing signs, and bridge markings; non-physical methods include OHV and axle load restrictions, permits, and related policies), mitigation systems (e.g., crash beams, hanging chains/strips/bells bars), and active systems (e.g., early warning and detection systems, both in the field and in vehicle). Figure A13 shows such classification schema.
Based on a comprehensive study of OHV detection/warning systems by Cawley (2002), passive signing is estimated to be 10-20 percent effective in preventing incidents; the sacrificial system is estimated to be 30-50 percent effective, and the active warning system is estimated to be 50-80 percent effective. Moreover, the cost of installing an OHV early warning detection system at bridges is typically much less than the cost of repairing the damage from BrTS (Hanchey and Exley 1990). In addition, a more recent comprehensive report by state DOTs on the evaluation of OHV detection systems in the US (Maghiar, Jackson, and Maldonado 2017) found that a total of 22 state DOTs reported using various warning systems, but three used them only in certain districts. A total of 25 reported not using any warning systems for overhead clearance detections. The report also provided a summary sheet on identified OHV detection systems with their associated technical information. Another recent survey and a literature search by CTC & Associates examined 21 transportation agencies by surveying their experience with, and identified publicly available sources of OHV detection systems (CTC & Associates 2019). This research has also identified a list of both national and international studies related to temporary and permanent OHV detection system applications (Massoud 2013; Murshed, Barrett, and Machemehl 2016; Nguyen, Brilakis, and Vela 2017; Nguyen and Brilakis 2016; 2018; Scriba and Atkinson 2014; Singhal, Kamga, and Agrawal 2018).
In the UK, the Department of Transportation is required to post prohibition and warning signs for all bridges under 16’6” (Department of Transportation UK 2019). However, as denoted in (Nguyen 2018), the design of having two signs with different shapes on each bridge approach only adds confusion and does not alleviate the OHV strike problem. The UK Network Rail, which owns, operates, and develops Britain’s
railway infrastructure, maintains a collision data warehouse of incidents involving vehicles that strike bridges while carrying heavy goods. In addition, the Network Rail also compiles the annual list of “Big Hitters” and launched the “Wise Up, Size Up” campaign, a series of informational documents aimed at helping mitigate bridge strikes, which includes the following: 1) “Prevention of strikes on bridges over highways: A protocol for highway managers & bridge owners” (Network Rail 2007); 2) “Prevention of bridge strikes: A good practice guide for passenger transport manager” (Network Rail 2012a); 3) “Prevention of bridge strikes: A good practice guide for professional drivers” (Network Rail 2012b); and 4) “Prevention of bridge strikes: A good practice guide for professional drivers of passenger vehicles” (Network Rail 2012c). The purpose of the series is to prevent freight vehicles from hitting bridges, raise awareness of bridge strikes, and decrease bridge failure and maintenance. Additionally, bridge audit check sheets have been designed and provided to review, rank, and improve traffic signs on bridges at risk of bridge strikes. Similarly, Transport for Scotland teamed up with the National Bridge Strike Prevention Group to develop a ‘Strike it Out’ Campaign (Donnelley 2010) aimed at raising OHV drivers’ awareness of BrTS collisions.
The Virginia DOT (VDOT) and Mississippi DOT (MDOT) have applied flashing signs/beacons, and the Oregon DOT (ODOT) has used flashing lights to notify OHV drivers to use alternative routes (Fontaine 2003; Hanchey and Exley 1990; Kumar, Albert, and Deeter 2005). These types of prevention systems are commonly paired with other methods such as bridge signs and markings.
Many states in the US have started deploying warning systems that use laser or infrared lights. A study by Mattingly (2003) examined the usage of early warning detection systems in the US. The results showed that 11 state DOTs are currently using early warning detection systems, as noted in Table A2.
Table A2. State DOT Early Warning Detection System Usage (Mattingly 2003)
| State | Manufacturer | EWDS used | System impact | Initial cost |
|---|---|---|---|---|
| Kansas | Elwood | Laser | Reduction | $500 + labor |
| Iowa | In house | Chains | Slight reduction | N/A |
| New York | In house | Headache bar | Slight reduction | N/A |
| Oregon | IRD | Laser | Reduction | $32K |
| Idaho | IRD | Laser | Reduction | $65K |
| Pennsylvania | IRD | Laser | Reduction | Unavailable |
| Florida | In house | Light | Reduction | Unavailable |
| Louisiana | IRD | Laser | Reduction | Unavailable |
| Mississippi | Unavailable | 2 EWDS | Slight reduction | Unavailable |
| Maryland | Unavailable | Light | Reduction | $50K |
| California | IRD/Trigg | Laser | Reduction | $10 – 20K + Labor |
Another system uses a patented Z-Pattern red/infrared dual beam array with the ability to reject ambient light, which eliminates false overheight alarms. The systems (except for laser profiling units) generally consist of 1) a transmitter and 2) a receiver mounted on opposite sides of the road, 3) loop detectors under the road, and 4) a visual/aural warning system. The biggest issues for asset owners considering the system installation are affordability and reliability, with minimal compromise of accuracy and performance. Table A3 shows a summary of effectiveness and user satisfaction for active systems (Agrawal, Xu, and Chen 2011).
Table A3. Summary of Effectiveness and User Satisfaction of Active Systems (Agrawal, Xu, and Chen 2011)
| States | System type | Satisfaction with overall performance (out of 10) | Operational issues with system | False detection occurrences |
|---|---|---|---|---|
| Missouri | Z-Pattern | 9 | Lighting; vehicle strikes | None |
| Maryland | Optic | 8 | Insufficient space for installation | Sparse |
| Texas | Pipes on cable | 8 | Low speed/volume roadways only | N/A |
| Hawaii | Infrared/LED/IR | 9 | Difficult to access for maintenance | 1/mth |
| Minnesota | Infrared | 8 | Damaged by lightning | N/A |
| Maine | Z-Pattern | 9 | No | 1/3 mths* |
| Alaska | Laser | 1 (complications with false detections) | Many, too complex mechanisms, poor truck discrimination | Frequent (very sensitive) |
| Virginia | Dual beam | 8.5 | False detections caused by sun, bird activity | Frequent (caused by |
| sun, bird activity | environmental factors) |
As presented previously, in practice, OHV detection systems have been reported to be highly effective (50–80 percent) in reducing bridge hits, followed by sacrificial structure (30–50 percent) and passive signing techniques (10–20 percent) (Cawley 2002). The most economical approach for agencies is to target roadways by utilizing low clearance warning signs, pavement markings on roads, and/or fascia markings on the structure itself to warn drivers (Agrawal, Xu, and Chen 2011). The active laser-beam systems are the most effective; however, due to the high costs associated with pole erection and installation, adoption has been limited. Particularly in severe wind, active systems are more prone to false positive warnings (Agrawal, Xu, and Chen 2011).
Current beam-based OHV detection systems are effective in reducing hits, but their usage is limited due to high total system costs, recurring false alarms, and site constraints. To overcome the above shortcomings, research has been conducted using sensor / laser methods and computer vision methods. Singhal et al. (2018) developed a new, enhanced LAser Detection and Ranging (LADAR)-based OHV detection system (L-OHVDs) which can be installed on the face of a structure to be protected and can measure the height of an approaching vehicle prior to the safe stopping distance. A major improvement with LADAR is the very low probability for false alarms. Other advantages stem from the use of a relatively inexpensive line of sight warning signs which are hard to miss. Finally, the cost of the entire L-OHVDs is envisioned to be very low and would have minimal design, infrastructure, and installation requirements. L-OHVD would be a cost-effective alternative where coverage would be required on only a few traffic lanes.
In contrast to the laser- or infrared-based systems, a vision-based system can also be a cost-efficient alternative that is resistant to false alarms. Dai et al. (2015) evaluated a vision-based method for measuring truck heights as a part of the framework. The system is comprised of four main processes—field of view calibration, detection, truck height measurement, and warning notice. The merit of this research was the creation of an automatic video-based method, which can determine the height of trucks and is a low cost alternative to the current, more expensive laser and infrared detection systems. Nguyen (2018) addressed the wind sensitivity issue by using a constraint-based approach to minimize the number of OHV misclassifications resulting from windy camera conditions.
A recent innovation with a laser stop warning sign (i.e., a pseudo-holographic image that floats in midair) has been installed at the Sydney Harbor Tunnel in Australia. The barrier, developed by Laservision, includes hydraulic water screens, critical pressure levels to mitigate distortion from wind currents, rapid start techniques, and monitor loops.
Summary
The commercial trucking industry remains vital to our economy by keeping a steady stream of goods flowing. One area of concern that should be addressed is the transportation of freight on routes with low clearance overpasses and tunnels. This literature review summarized research on BrTS collisions (including characteristics, crash outcomes, and models), including the state of practice related to over-dimensional permitting considerations, reporting, clearances and TAM (in particular, strikes of bridge/tunnel and other highway structures), as well as existing countermeasures (e.g., prevention/mitigation strategies from roadside to in-vehicle technologies).
A wide range of crash facts indicate BrTS collisions – overheight collisions, in particular – are considered a serious problem in many states. In order to achieve a sound methodology for risk analysis and modeling, the following challenges need to be addressed: 1) keeping the structure inventory data up-to-date and in good quality; 2) establishing a reliable linkage between BrTS and structure inventory data; 3) extracting relevant data items from connected databases for collision risk analysis and 4) communicating highway structure conditions or concerns effectively between agencies during permit issuance for OSOW movements. Moreover, limited research has focused on the inaccuracies of GPS navigation systems and/or relevant permitting and escorting policies as contributing factors.
Regarding the BrTS risk analysis and modeling, studies focusing on bridges or tunnels have been identified respectively, with different concentrations given to different types of strikes/types/vehicles. Table A4 summarizes the abovementioned literatures related to vehicle-bridge collisions in the field of BrTS analysis and modeling, and Table A5 provides a summary of the variables that were used in developing different models. Studies on vehicle-tunnel collisions focus on the influence areas (e.g., zonal studies) as opposed to the entire infrastructure.
Table A4. Summary of Literature by Type of Strike and Type of Method in BrTS (bridge collisions) Analysis and Modeling
| Type of Strikes | ||||
| A. Under-bridge collision with superstructure (e.g., girder) | B. Under-bridge collision with substructure (e.g., bent, support, pier, abutment) | C. On-bridge collision (e.g., truss, parapet, railing) | ||
| Type of Methods | Crash prediction models (e.g., NB) | Mehta et al. (2015) [all types of vehicles] |
Geedipally et al. (2010) [heavy vehicles]; Qin et al. (2014) [trucks] |
Hans et al. (2016) [all types of vehicles; secondary roads bridge]; Elvik et al. (2019) [all types of vehicles]; Jalayer et al. (2021) [all types of vehicles] |
| Risk modeling | - | Qin et al. (2016) [trucks] | Khan et al. (2009) [all types of vehicles] | |
| Probability model | - | Mak & Sicking (2003) [all types of vehicles] | - | |
The state of practice in BrTS design, management, policies and procedures was explored, and studies/techniques/practices of three BrTS protection schemes have been reviewed: passive systems (physical methods include static signage, VMS, beacons/flashing signs and bridge markings; and nonphysical methods include OHV and axle load restrictions, permits, and related policies), mitigation systems (e.g., crash beams, hanging chains/strips/bells bars), and active systems (e.g., early warning and detection systems, both in the field and in vehicle). The effectiveness of these protection strategies might require further methodology updates, such as interviews, surveys, and in-depth marketing searches.
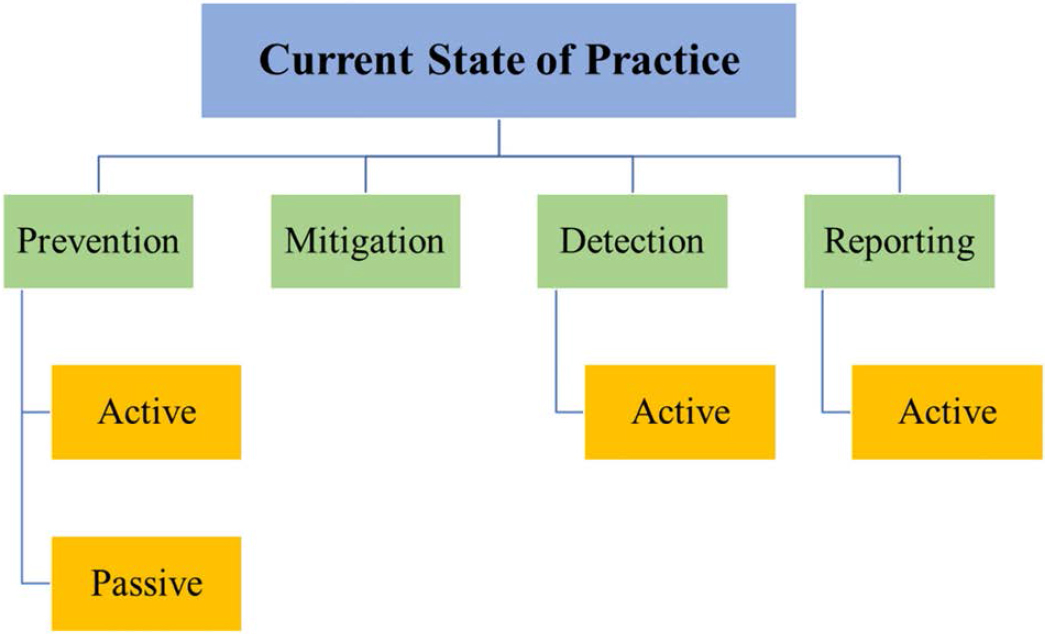
In general, BrTS practices can be grouped into three categories: a) preventing hazard methods, which are used to prevent BrTS from occurring; b) detecting hazard methods, which are used to recognize the occurrence of a BrTS; and c) reporting hazard methods, which are used to report a BrTS to authorities. Although many state DOTs have structured procedures for reporting and response after a collision, few have procedures for preventing bridges or tunnels from being struck by motor vehicles. Equally important, if not more so, is identifying cost-effective countermeasures for preventing and mitigating BrTS. Failure to quantify the costs and benefits of particular safety countermeasures will lead to ill-informed decisions regarding infrastructure investments and improvements. Overall, the review of literature covered a wide range of BrTS collision topics that will inform subsequent project tasks. The project team has also explored the data needs and data sources for developing methodologies and a sustainable national clearinghouse for BrTS data and clearance information.
Table A5. Summary of Variables Used by Studies in BrTS (Bridge Collisions) Analysis and Modeling
| Mak & Sicking (2003) | bridge age, maintenance cost, functional class of the bridge, highway type, lane width, shoulder width, speed limit, ADT, percentage truck, segment length, median length, vertical grade, curve (degree or k-value), bridge feature data (bridge pier information, w-beam strong post guardrail information, crashworthy end terminals, turned down end terminals, vertical concrete wall information, non-redirective crash cushion information) |
| Khan et al. (2009) | winter VMT, crash count |
| Geedipally et al. (2010) | crash count, crash severity, segment length, lane width, number of bridges, bridges length, number of curves, curves length, average shoulder width, AADT, truck percentages, truck AADT, vehicle types |
| Qin et al. (2014) | crash count, shoulder width, median width, length, truck AADT, curve (degree or k-value), number of lanes, lane width, surface type, shoulder type, rumble strip (Y/N) |
| Mehta et al. (2015) | crash count, AADT, bridge length, left curb (Y/N), right curb (Y/N), shoulder width, percentage truck, number of lanes, conforming railings (Y/N), conforming transition (Y/N), conforming approach guard rail (Y/N), conforming approach guard rail end (Y/N), traffic direction (1-way/2-way) |
| Qin et al. (2016) | crash count, shoulder width, median width, length, truck AADT, curve (degree or k-value), annual rainfall, annual snowfall, number of frost days, number of lanes, lanes width, surface type, shoulder type, rumble (Y/N) |
| Hans et al. (2016) | crash count, crash severity, structure length, bridge roadway width, approaching roadway width, relative approach width, narrow approach (Y/N), bridge age, AADT, speed limit, surface lane width, median width, paved road (Y/N), number of lanes, average shoulder width, number of secondary road structures |
| Elvik et al. (2019) | crash count, bridge age, length, width, AADT, speed limit, pedestrian facility (Y/N) |
| Jalayer et al. (2021) | driver age, driver gender, DUI driving (Y/N), season, day of week, time of day, injury severity, weather condition, surface condition, lighting condition, straight/curved, direction of traffic (1-way/2-way), speed limit, vehicle age, wearing surface, bridge railing (Y/N), approach guardrail end (Y/N), median type |


