Prevention and Mitigation of Bridge and Tunnel Strikes (2025)
Chapter: Appendix C: Technical Memorandum: Identify Knowledge Gaps Related to BrTS Data Management
APPENDIX C
Technical Memorandum: Identify Knowledge Gaps Related to BrTS Data Management
Communication
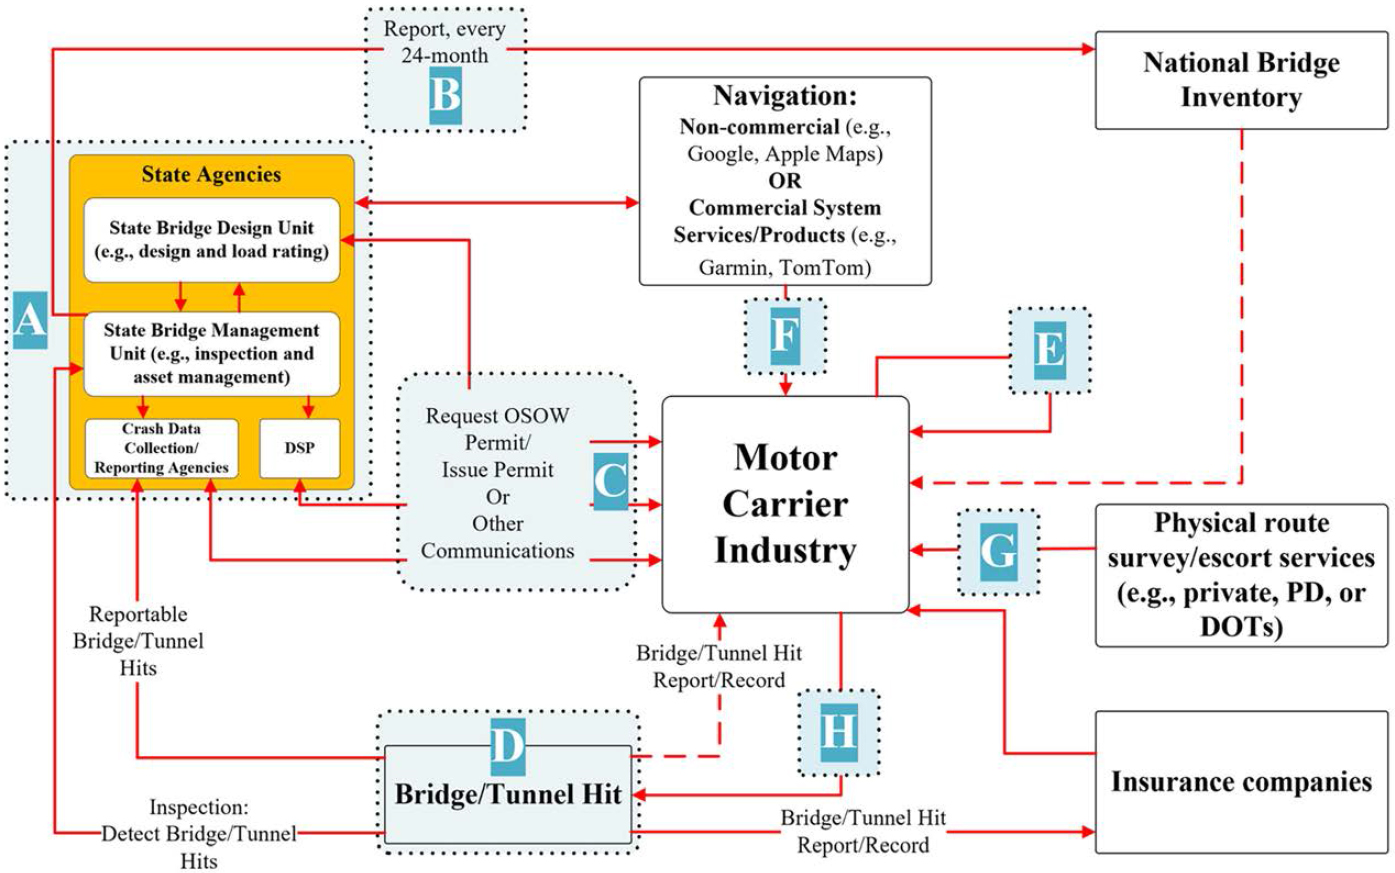
Mitigating and avoiding BrTS requires the participation of many stakeholders, including state/federal agencies, motor carriers, and private service providers. Hence, effective communication and information exchange among different parties and agencies are essential. The bridge/tunnel information (including BrTS data) flow chart is conceptualized in Figure C1 to illustrate how critical BrTS information circulates among different entities. The flow chart identifies possible information gaps and errors (e.g., vehicle permitting process), as well as data availability and quality. Any issues and/or knowledge gaps are categorized into the following eight aspects, corresponding to the letters in Figure C1:
- Inter/intra-agency communication
- State-Federal communication
- Communication between OSOW permit issuing authorities and motor carriers
- BrTS strike data exchanges
- Motor carrier’s internal communication
- Motor carriers (esp. non-permitted) and navigation systems
- Motor carriers and physical route survey/escort services
- Traffic control (bridge/tunnel signages)
A. Inter/Intra-Agency Communication
The specialized carrier industry noted concerns over a lack of consistency in permitting processes across the nation. OSOW permitting may be administered by the DOT, DMV (Department or Division of Motor Vehicles), or DSP (see Figure B8). Few states such as Wisconsin house DOT, DMV, and/or DSP within one agency. As bridge data is usually collected and maintained exclusively by state DOTs, any non-DOT agency that administers OSOW permitting, but is not the steward of bridge information, could struggle to obtain up-to-date and specific information (e.g., lane-specific vertical clearance). The demand to issue OSOW permits is increasing while resources to support the demand is decreasing, creating a large volume of OSOW loads on the system and need for more timely and reliable data. In addition, for agencies that are not familiar with bridge data and/or have other job priorities, training could be a challenge.
The variability of the permit process across states also results in inconsistent policies, processes, procedures, and requirements. Years ago, AASHTO initiated a “permit harmonization” program which aimed to improve the consistency of permit requirements and practices across state borders (AASHTO, n.d.). The program created non-binding 2013 and 2014 resolutions targeting harmonization, but enforcing these resolutions is difficult as they are not legally binding. Efforts to renew and rejuvenate the permit harmonization program are underway.
B. State-Federal Communication
Issues related to communication between state and federal agencies are mostly related to data exchanges and compliance, especially with regard to structure data (e.g., bridge/tunnel clearance information) between state-maintained databases (e.g., WisDOT HSIS, NYSDOT BDIS) and national level databases (i.e., NBI/NTI). Compared to state-maintained structure inventory, national databases normally have issues such as compromised data quality, inaccurate information, lack of timely updates, and lack of internal consistency resulting from different compliance levels by state DOTs. Section “BrTS Data Collection and Management” includes specific examples of issues with national databases through comparisons of state-maintained structure inventory with national databases.
C. Communication between OSOW Permit Issuing Authorities and Motor Carriers
It has long been suspected that most BrTSs are committed by non-permitted carriers who may not be affected by an improved and more consistent permit process; however, it is difficult to estimate the exact number of strikes caused by non-permit carriers because many strikes are not reported (e.g., hit-and-run). One approach toward improving communication is to gain a better understanding of why a carrier skips the permit process. Is it due to financial issues, the difficulties of obtaining a permit, or perhaps illegal loads?
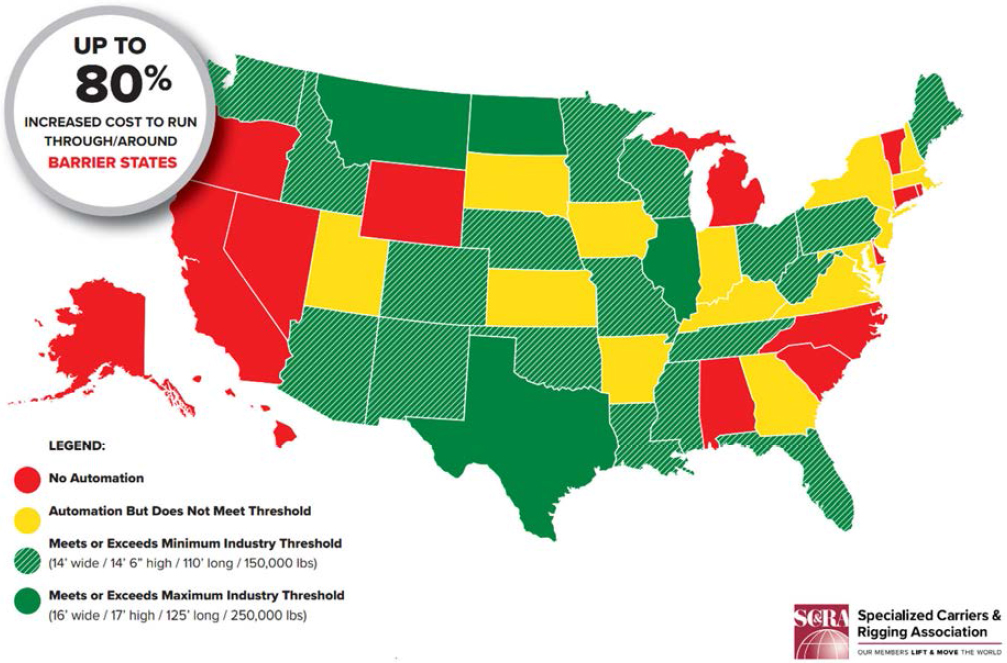
For those states who do not have automated permitting, the current practice of manual permit issuing requires more people and longer time, which might discourage motor carriers from applying. On the other hand, automated permitting has many benefits, such as reduction in human error, shorter time required to obtain permits, improved efficiency of the permit process, etc. According to a recent FHWA report (Schaefer and Todd 2018), “States implement and enhance automated permitting systems at an increasing rate nationwide, a consensus regarding the safety and efficiency benefits has also grown”. In 2018, the SCRA (SC&RA) announced the Uniform Permit Transport 2021 (UPT2021) to establish harmonization between all 50 US states on OSOW envelope vehicle configurations and provided major updates in CTSO Subcommittee on Operations 2021 Annual Meeting regarding the current state of automated permitting system in all 50 US state. Figure C2 shows 36 states that currently use automated permit systems with different weight and dimension thresholds. In addition, the quality of communication between state
agencies to motor carriers regarding bridge clearances is contingent on the open, accurate, complete, and convenient information. For instance, does a state agency provide the public with the open and convenient access to their bridge underclearance data. Is the data accurate, up-to-date, and complete (e.g., lane-specific vertical clearance)? Can the data be readily queryable to facilitate route planning?
D. BrTS Strike Data Exchanges
Few states have systematic procedures for tracking BrTS events. One reason is the difficulty of accessing relevant information. To understand why it is difficult for information sharing, it is necessary to know the answers to the following questions:
- Who collects the BrTS strike data, and what information is collected?
- Who manages the BrTS strike data, and how are the data managed?
- Who provides the BrTS strike data, and how the information is shared?
For example, the exchange of traffic incident data/bridge inspection data within WisDOT can be illustrated in Figure C3. The direction of the arrow represents the information flow from one agency to another. As can be seen, BrTS information is communicated on a real-time basis through incident notifications, which corresponds to the bridge damage inspection, and early email correspondences with WisDOT bridge engineers imply that damages and scrapes of bridges discovered during bridge (damage) inspections could include hit-and-runs. In addition, bridge engineers might have access to BrTS through route bridge inspections. However, the search in WisDOT’s HSIS for routine inspection returns no relevant information (i.e., hit-and-run BrTS) other than a term such as “frequent hits” without specifying the number of hits. For practices in other states about collecting BrTS data from bridge inspection reports, it has been explored in data collection in the project.
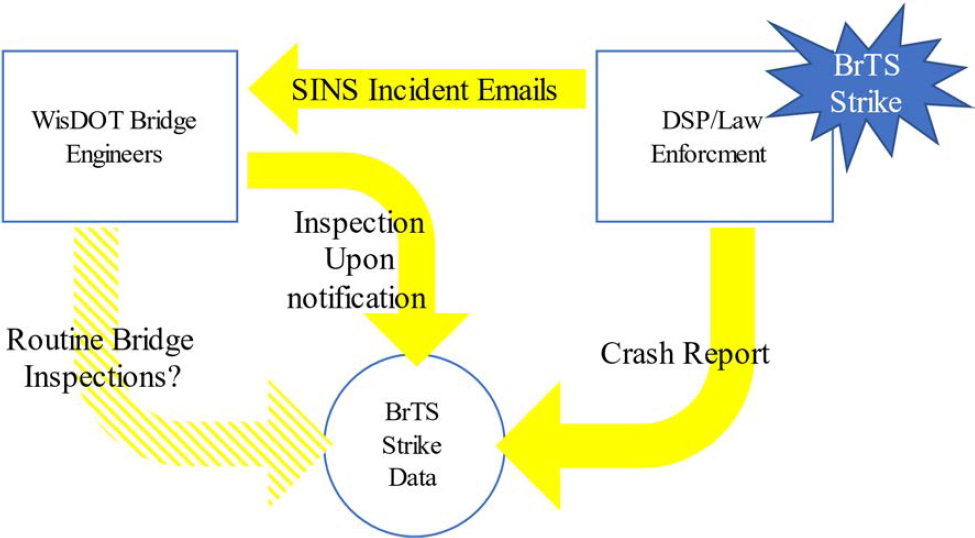
Another probable reason could be liability (i.e., knowing there is a problem with certain bridges and locations and not doing something about it).
E. Motor Carrier Internal Communication
One common issue among motor carriers is that drivers (permitted or non-permitted) may not know the exact height of their loads or how to measure them properly. And unfortunately, there are not many low-cost technologies that can accurately measure the height of the load, especially loads with irregular shapes and sizes. Additionally, permitted drivers who deviate from permitted routes or exceed their permitted height can also lead to BrTS. These deviations might result from the lack of effective communication between motor carriers and drivers regarding specific instructions on load measurement, pre-trip planning, and enroute safety requirements.
F. Motor Carrier (non-permitted) and Navigation Systems
Information regarding up-to-date and accurate vertical clearance with timely and effective delivery to drivers is key to avoiding BrTS events. Permitted drivers are less likely to be affected by the issue of missing or inaccurate bridge vertical clearance as long as the permitted route information is mistake-free. Non-permit drivers, on the other hand, highly rely on posted bridge clearance signs and placards or their GPS navigation systems. If such information is not available or inaccurate, a BrTS may take place. FMCSA believes bridge strikes are avoidable through better awareness of route restrictions along travel paths gained using a GPS navigation system intended for use by professional truck and bus drivers. Rand McNally is a common trucking map company and device provider. Drivewyze also provides location information on high-risk truck rollover location, low structure, work zone, etc. These companies may acquire data from state DOTs or collect their own data. There are other products on the market, or may be entering the market, that also offer in-cab low bridge warnings, these include, but are not limited to, GreenRoad, Sentinel, High-Tech Sign, Garmin, and EXEROS Technologies.
G. Motor Carrier and Physical Route Survey/Escort Services
Motor carriers commonly use route planning, physical route surveys, pre-trip planning meetings, and pilot car escorts to ensure their drivers’ safety. Most states require escorts for OSOW permitted loads, while only 12 states require escort training, according to state’s regulations. Furthermore, such training does not provide instructions for route surveys (e.g., how to measure a bridge clearance) which is not ideal when considering the lack of standardized height-poles height for escort requirements (height of pole at tip compared to the actual load). Most states require a height pole be 6 inches above the actual load (for example, if the load is 15 feet high, height pole would be set at 15 feet 6 inches). Some escorts set pole height only an inch or two above the load height to avoid raising wires, trees or signs, which puts the vehicle at risk of hitting fixed objects. Moreover, carriers offer limited training regarding how to properly measure flatbed load height.
H. Traffic Control Devices (Signages)
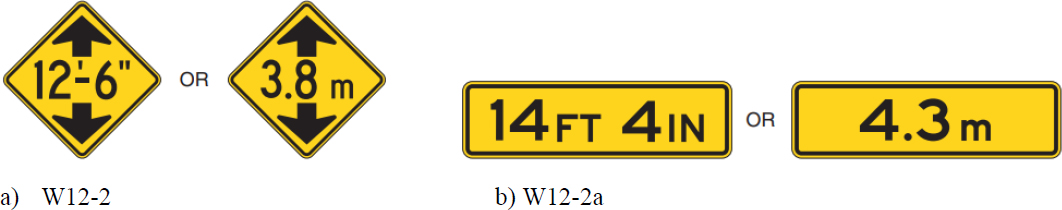
Since non-permit drivers rely on bridge clearance signs, the availability and accuracy of bridge vertical clearance information is critical. However, state DOTs may not post bridge signs of vertical clearance at all, let alone ensure the information is accurate and complete. According to the MUTCD, 2009) Section 2C. 27 Low Clearance Signs (W12-2 and W12-2a) (see Figure C4), “Standard: 01 The Low Clearance (W122) sign (see Figure 2C-5) shall be used to warn road users of clearances less than 12 inches above the statutory maximum vehicle height” (i.e.,13 feet, 6 inches to 14 feet); “Guidance: 02 The actual clearance should be displayed on the Low Clearance sign to the nearest 1 inch not exceeding the actual clearance.” Concerns with lack of standardization regarding the policies and procedures used to survey and post vertical clearances remain as bridge hits continue to occur because of inaccurate postings and routing. For example, The WISCONSIN MUTCD (WMUTCD) is the WisDOT policy for vertical clearance signing. According to Wisconsin MUTCD from the WisDOT (March 21, 2017), Section 2C.27 Low Clearance Signs (W12-2 and W12-2a) (page 21 & 22) details the policies on posting low clearance sign near/on highway bridges.
In the introduction, WMUTCD states: “Department of Transportation of the state of Wisconsin, referred to hereinafter as the “Department”, has in accordance with Wisconsin Statutes designated the 2009 edition of the MUTCD for Streets and Highways (hereafter designated the Uniform Manual or MUTCD) and addendums, developed by the National Committee on Uniform Traffic Control Devices (NC) and approved by the FHWA, including all revisions, and errata, as the official Wisconsin MUTCD subject to the modifications set forth in this Supplement. The MUTCD as addended, expanded and modified by this Supplement is applicable to the design, use, application, installation, maintenance, and operation of all traffic control devices on all highways in the state”.
Below is the exception of “Section 2C.27 Low Clearance Signs (W12-2 and W12-2a)”:
“Standard:
The Low Clearance (W12-2) sign (see Figure 2C-5) shall be used to warn road users of clearances less than 12 inches above the statutory maximum vehicle height.
Standard:
- The Low Clearance sign (W12-2) sign shall be used at all points where the clearance over any part of the usually traveled portion of the roadway is less than 14’ - 6”. Where the clearance is less than 13’ – 6” an additional sign to that effect shall be placed at the nearest intersection on which a vehicle can detour onto. The appropriate XXX MILES AHEAD plaque (W57-52) shall be added to the advance sign.
- On all freeway/expressway interchanges, low clearance signs shall be placed in advance of the exit over height vehicles can use to avoid the low clearance bridge, as well as at the bridge location itself where the bridge clearance is less than 14’ – 6”.
Guidance:
- On oversize/overweight (OSOW) freight network routes, clearances of 14’-6” or higher should be considered for installation of low clearance signs depending on the OSOW vehicles using specific routes and as approved by the region traffic engineer. Low clearance signs should be considered for clearances of 14’-6” or higher on OSOW secondary routes if the secondary route has structure clearances that are less than on the parallel OSOW primary route.
Option:
- At the discretion of the maintaining authority of a roadway, troublesome or frequently hit structures with clearances at 14’ - 6” and above may be signed.
Guidance:
- The actual clearance should be displayed on the Low Clearance sign to the nearest 1 inch not exceeding the actual clearance. However, in areas that experience changes in temperature causing frost action, a reduction, not exceeding 3 inches, should be used for this condition.
- Where the clearance is less than the legal maximum vehicle height, the W12-2 sign with a supplemental distance plaque should be placed at the nearest intersecting road or wide point in the road at which a vehicle can detour or turn around.
- In the case of an arch or other structure under which the clearance varies greatly, two or more signs should be used as necessary on the structure itself to give information as to the clearances over the entire roadway.
- Clearances should be evaluated periodically, particularly when resurfacing operations have occurred.
Option:
- The Low Clearance sign may be installed on or in advance of the structure. If a sign is placed on the structure, it may be a rectangular shape (W12-2a) with the appropriate legend (see Figure 2C-5).
- If a segment of roadway contains a number of structures that are marked for clearances an advance sign may be placed in advance of an exit that would allow an over height vehicle to detour onto another route. If the lowest structure in the segment is below 14’ - 6” the sign shall read “Low Clearance Structures next XX Miles”. If the lowest structure is 14’ - 6” or above the sign shall read “XX’ XX” Minimum Clearance next XX miles”. Both of these signs shall have a black legend on a yellow background.”
BrTS Data Collection and Management
This section focuses on the discussion of gaps and limitations with respect to BrTS strike data, bridge/tunnel inventory data, and BrTS data management. The purpose of this section is to guide data collection and development of a prototype data clearinghouse in this project.
BrTS Strike Data
In the previous chapters, the project team confirmed that BrTS can be identified in reportable crashes through appropriate data fields available on crash report forms; and the component of the bridge (e.g., bridge overhead structure, bridge support or pier, bridge rail) that is struck can be specified. BrTS strike data can be linked to highway structure inventory through a “linkable” bridge/structure identification number and/or through a location proximity tool such as linear referencing system or geographic coordinates.
However, NHTSA compliance varies by state since MMUCC is a voluntary data collection guideline. The inconsistent MMUCC compliance affects BrTS crash information extraction. If a state uses data fields and attributes that are different than those in MMUCC, it may be difficult to identify bridge hits in a crash database, as well as the part of a bridge that was struck.
Moreover, reported BrTSs represent only a portion of actual hits, as states differ in their definitions of a reportable crash. Reportability is typically defined as any crash that involves an injury, fatality, or property damage over the state-defined threshold. The property damage threshold differs among states. As one might imagine, officers make judgement calls about the monetary value of vehicle and property damage; therefore, similar crashes may or may not be reported in a jurisdiction depending on how the officer views the situation. When comparing jurisdictions that include non-injury (PDO and “possible” injury) crashes, analysts should acknowledge that even within a state, and certainly between states, the threshold for reporting will vary. The underreporting issues are aggravated even further by hit-and-run crashes in which a driver simply flees the scene and does not report the incident to authorities.
Ideally, crash data can be linked to a bridge inventory by using a “uniform” bridge/structure identification number. However, such information may not be available or may be inaccurate in the crash report. As a proof of concept, the project team conducted a query of Wisconsin crash data from 2018-2020 which shows that only 53% of crashes involving a bridge have “ATNMBR”, the structure number associated with a crash location. We also found that the available structure numbers are presented in a variety of forms, not necessarily in the same format as the 15-digit structure number in NBI. Although this limitation may be addressed by matching the location data (e.g., x, y coordinates or linear referencing system link-offset), the connection depends on the quality of the crash location information. In the Wisconsin case, location proximity was applied (with 100 meters as the buffer distance) to match the crash data and bridge data in NBI, and 99.5% of the crashes could be spatially linked to the NBI data.
Also presented in previous chapters, BrTS strike data can be augmented by incident reports, such as the WisDOT InterCAD Traffic Incident database, by routine bridge inspections such as NYSDOT BDIS, or by private companies such as insurance companies and motor carriers. However, these data may not be complete either; take C.L.U.E. as an example. C.L.U.E. is a claims history database generated by LexisNexis® which enables insurance companies to access consumer claims information when they are underwriting or rating an insurance policy. This database contains only data associated with drivers who are insured. In brief, these data sources are not as rigorous as reportable crash data and may not have the necessary details of the event or an accurate location. Moreover, when reportable crash data are merged with auxiliary data sources, there is a risk of double-counting when time and location cannot be matched.
Tunnel strike data are far more difficult to find than bridge strike data. MMUCC does not distinguish between “tunnel” elements and “bridge” elements. The best way to locate a tunnel strike is most likely a text search in the crash narrative for key words such as “tunnel”. But additional details are needed to further distinguish whether a tunnel strike is at the entrance or inside of the tunnel. A strike at the tunnel entrance is more likely to be caused by limited vertical clearance. While labor intensive, a manual review of tunnel crash narratives would result in a refined list of crashes that identify tunnel entrance crashes.
In summary, reportability of BrTS events, uniformity of BrTS strike data format and content, the connection between BrTS strike data and the structure inventory, and a uniform description of which part of the bridge or tunnel was struck are potential data gaps and limitations that should be considered when collecting BrTS data.
Bridge/Tunnel Inventory Data
State DOTs collect clearance data on every bridge in a state to meet federal reporting requirements and to inform infrastructure improvement needs. State DOTs are obligated to report bridge clearance measurements to NBI as part of the federal requirements. Additionally, because new construction, rehabilitation, and repair projects can change bridge clearances, measurements must be taken consistently to accurately support oversize/overweight permitting.
A review in previous chapters of state DOT’s guides and practices regarding structure vertical clearance data collection and management reveals that not all states make bridge heights electronically accessible or designate whether the height is the actual bridge height or the maximum permitted height. We found that a majority of state DOTs publish online vertical clearance data, and most of them (i.e., Alabama, Colorado, Delaware, Idaho, Illinois, Indiana, Iowa, Kansas, Kentucky, Massachusetts, Minnesota, Mississippi, Missouri, New York, Pennsylvania, Texas, Vermont, Virginia, and Washington) include an interactive online GIS map free to the public. Other states offer a table, list, or static bridge clearance map (in pdf or other formats). Most state DOTs give only the minimal clearance information, but a few states such as Washington (see Figure 22) and Idaho provide lane-specific vertical clearance information.
We noted that structural vertical clearance data are measured by different techniques and methods. Some are extracted from design plans or manually measured by laser devices; others use Lidar technology to automatically extract clearance information. We also noted different practices in bridge vertical clearance signage. In Texas, “In locations where an encroachment over the usable shoulder would significantly reduce the vertical clearance, two clearances may be shown. The travel lane and shoulder clearances should be signed independently on the structure.” In Indiana, “the roadway may be signed for a lower clearance. Many bridges in Indiana are signed 2 or 3 inches lower than the actual low clearance to factor in snow/ice pack during winter months”.
NBI and NTI were established as centralized databases for bridge/tunnel inventory data with the purpose of breaking down the silos and facilitating multiple permits (across states); but as the literature review found, the NBI has missing, erroneous, and logically conflicting information as well as a lack of timely inspection and updates of bridge data (e.g., routine inspections must be performed on each structure at least every 24 months). For example, the NBI/NTI provide only the overall vertical clearance, not lane-specific clearance. Lack of uniformity of some important data fields, such as Bridge/Tunnel Number, was also found when examining the sample datasets for both databases. In “Recommended Framework for a Bridge Inspection QC/QA Program” (FHWA, n.d.), FHWA “requires each inspection have agency independent QC reviews to maintain inspection quality at or above a specified level”. Although FHWA acknowledges “Agency QC procedures often vary”, it is true that “every inspection might not receive an independent QC review.” According to FHWA, audits for “Bridge inspections might be randomly selected for agency QA reviews or selected based on representative bridge type, region, district, or other agency defined bridge populations”. In recent years, the NBI/NTI dataset was subjected to scrutiny and questions after studies revealed it might be outdated or inaccurate (Din and Tang 2016; Radovic and Adarkwa 2015). One plausible reason for not getting high-quality vertical clearance data is that clearance is not a high-priority data item in NBI/HSIS because of (improvement/repair) funding incentives. According to the “Recording and Coding Guide for the Structure Inventory and Appraisal of the Nation’s Bridges”, APPENDIX B Sufficiency Rating Formula and Example, Underclearances, as part of the Serviceability and Functional Obsolescence, is only 30% maximum (FHWA, 1995).
To determine if there is a large disparity between state-maintained bridge inventory data and NBI, the project team conducted two experimental comparisons between state bridge data and NBI data: one with 20 randomly selected bridges in the WisDOT HSIS and the other with 40 randomly selected bridges from the INDOT bridge clearance data. The detailed results are shown in the Tables C1 and C2. Clearance information between Wisconsin HSIS and NBI was almost the same considering the unit conversion (meter in NBI and feet in HSIS), but for INDOT data, the information of minimum vertical clearance for 67.5%
(or 27 out of 40) of the bridges in NBI is lower than that in the INDOT database, including 10 bridges with a minimum vertical clearance less than 16’6 feet.
Table C1. Comparison between WisDOT HSIS and NBI Regarding Minimum Vertical Clearance of Bridge
| Structure Number | Minimum Vertical Clearance_NBI (m) | Minimum Vertical Clearance_NBI (ft) | Minimum Vertical Clearance_HSIS (ft) | Date_HSIS | Difference in percentage |
|---|---|---|---|---|---|
| B03001500000000 | 4.37 | 14.34 | 14.35 | 6/7/2007 | -0.09% |
| B03006000000000 | 4.40 | 14.44 | No data | - | - |
| B05017800000000 | 4.77 | 15.65 | 15.66 | 6/22/2017 | -0.07% |
| B05064800000000 | 4.74 | 15.55 | 15.56 | 6/30/2017 | -0.06% |
| B11006800000000 | 4.62 | 15.16 | 15.17 | 10/23/2006 | -0.08% |
| B13021900000000 | 4.65 | 15.26 | 15.26 | 10/17/2000 | -0.03% |
| B13026300000000 | 4.69 | 15.39 | 15.38 | 11/5/2007 | 0.05% |
| B13029200000000 | 4.65 | 15.26 | 15.25 | 10/7/2008 | 0.04% |
| B13045000000000 | 4.56 | 14.96 | No data | - | - |
| B13070100000000 | 4.69 | 15.39 | 15.38 | 12/11/2018 | 0.05% |
| B17022100000000 | 4.65 | 15.26 | 15.25 | - | 0.04% |
| B18002900000000 | 4.59 | 15.06 | 15.06 | 2/9/2015 | -0.01% |
| B18020600000000 | 4.65 | 15.26 | 15.25 | 9/20/2013 | 0.04% |
| B22009900000000 | 4.69 | 15.39 | 15.38 | 10/5/2017 | 0.05% |
| B28003000000000 | 4.56 | 14.96 | No data | - | - |
| B36010300000000 | 4.74 | 15.55 | 15.56 | 6/8/2018 | -0.06% |
| B39003400000000 | 4.65 | 15.26 | 15.25 | - | 0.04% |
| B40005600000000 | 4.46 | 14.63 | 14.64 | 7/10/2018 | -0.05% |
| B40012000000000 | 4.65 | 15.26 | 15.24 | 8/27/2015 | 0.10% |
| B40020700000000 | 4.49 | 14.73 | 14.72 | 4/21/2017 | 0.07% |
Table C2. Comparison between INDOT Bridge Clearance Database and NBI Regarding Minimum Vertical Clearance of Bridge
| Structure Number | Minimum Vertical Clearance_NBI (m) | Minimum Vertical Clearance_NBI (ft) | Minimum Vertical Clearance_INDOT (ft) | Date Collecte d_INDOT | Difference in percentage |
|---|---|---|---|---|---|
| 41770 | 5 | 16.41 | 16.42 | 5/30/2021 | -0.09% |
| 51110 | 4.34 | 14.24 | 14.14 | 6/1/2020 | 0.70% |
| 11070 | 4.47 | 14.67 | 14.77 | 6/15/2020 | -0.70% |
| 36330 | 5.8 | 19.03 | 18.79 | 6/30/2021 | 1.28% |
| 36530 | 4.34 | 14.24 | 14.17 | 6/12/2020 | 0.49% |
| 36540 | 4.36 | 14.31 | 14.31 | 6/12/2020 | -0.03% |
| 36570 | 6.04 | 19.82 | 19.33 | 5/21/2021 | 2.52% |
| 36600 | 4.36 | 14.31 | 13.99 | 6/11/2020 | 2.25% |
| 36630 | 4.3 | 14.11 | 14.01 | 6/11/2020 | 0.70% |
| 40990 | 4.32 | 14.17 | 14.24 | 5/31/2020 | -0.46% |
| 41000 | 4.3 | 14.11 | 14.23 | 5/31/2020 | -0.86% |
| 41050 | 6.4 | 21.00 | 20.8 | 8/11/2020 | 0.95% |
| 41060 | 6.71 | 22.02 | 21.91 | 8/11/2020 | 0.48% |
| 41110 | 6.81 | 22.34 | 22.32 | 5/31/2020 | 0.11% |
| 41120 | 6.69 | 21.95 | 21.93 | 5/31/2020 | 0.09% |
| 41130 | 5.07 | 16.63 | 16.5 | 5/31/2020 | 0.82% |
| 41140 | 5.07 | 16.63 | 16.47 | 5/31/2020 | 1.00% |
| 41150 | 4.96 | 16.27 | 16.26 | 5/31/2020 | 0.08% |
| 41160 | 4.87 | 15.98 | 15.99 | 5/31/2020 | -0.07% |
| 41170 | 7.06 | 23.16 | 23.17 | - | -0.03% |
| 41180 | 7.39 | 24.25 | 24.25 | 5/31/2020 | -0.01% |
| 41190 | 6.6 | 21.65 | 21.2 | 5/31/2020 | 2.14% |
| 41200 | 6.65 | 21.82 | 21.8 | - | 0.09% |
| 41210 | 6.73 | 22.08 | 22.08 | 5/31/2020 | 0.01% |
| 41220 | 6.81 | 22.34 | 22.33 | 5/31/2020 | 0.06% |
| 41230 | 6.99 | 22.93 | 22.92 | 5/31/2020 | 0.06% |
| 41240 | 6.88 | 22.57 | 22.58 | 5/31/2020 | -0.03% |
| 41250 | 4.44 | 14.57 | 14.51 | 5/31/2020 | 0.40% |
| 41260 | 5.5 | 18.05 | 17.94 | 5/31/2021 | 0.59% |
| 41281 | 5.34 | 17.52 | 17.25 | 5/31/2020 | 1.57% |
| 41291 | 5.15 | 16.90 | 16.84 | 5/31/2020 | 0.34% |
| 41340 | 4.51 | 14.80 | 14.65 | 5/31/2020 | 1.01% |
| 41350 | 4.32 | 14.17 | 14 | 5/31/2020 | 1.24% |
| 41360 | 6.1 | 20.01 | 20 | - | 0.07% |
| 41390 | 4.36 | 14.31 | 14.02 | 5/31/2020 | 2.03% |
| 41400 | 4.69 | 15.39 | 14.97 | 5/31/2020 | 2.79% |
| 41610 | 6.81 | 22.34 | 22.33 | - | 0.06% |
| 41615 | 6.78 | 22.25 | 22.25 | - | -0.02% |
| 41620 | 4.94 | 16.21 | 16.93 | 5/24/2021 | -4.26% |
| 41630 | 4.46 | 14.63 | 16.72 | 5/24/2021 | -12.48% |
One other angle to consider is the bridges/tunnels in the local system vs the state system – while most of the time a truck would travel on the state system, some of the final miles can be on the locally owned systems, and their procedures for measuring and signing may not be as robust on those on the state systems.
BrTS Data Management
Many states do not track bridge hits, nor do they have formal procedures for identifying or investigating them. The internal lack of reliable, complete and accurate BrTS statistics (crash data and beyond) is a general issue for almost all potential databases. (Fu, Burhouse, and Chang 2004) conducted a survey to state agencies on the OHV collisions in the US in which 17 out of 29 responding states maintain records on overheight collisions, the study did not provide the name of states that answered “Yes” (Fu, Burhouse, and Chang 2004). In addition, the 2004 study could be outdated given the changes in the practice of crash data collection and management.
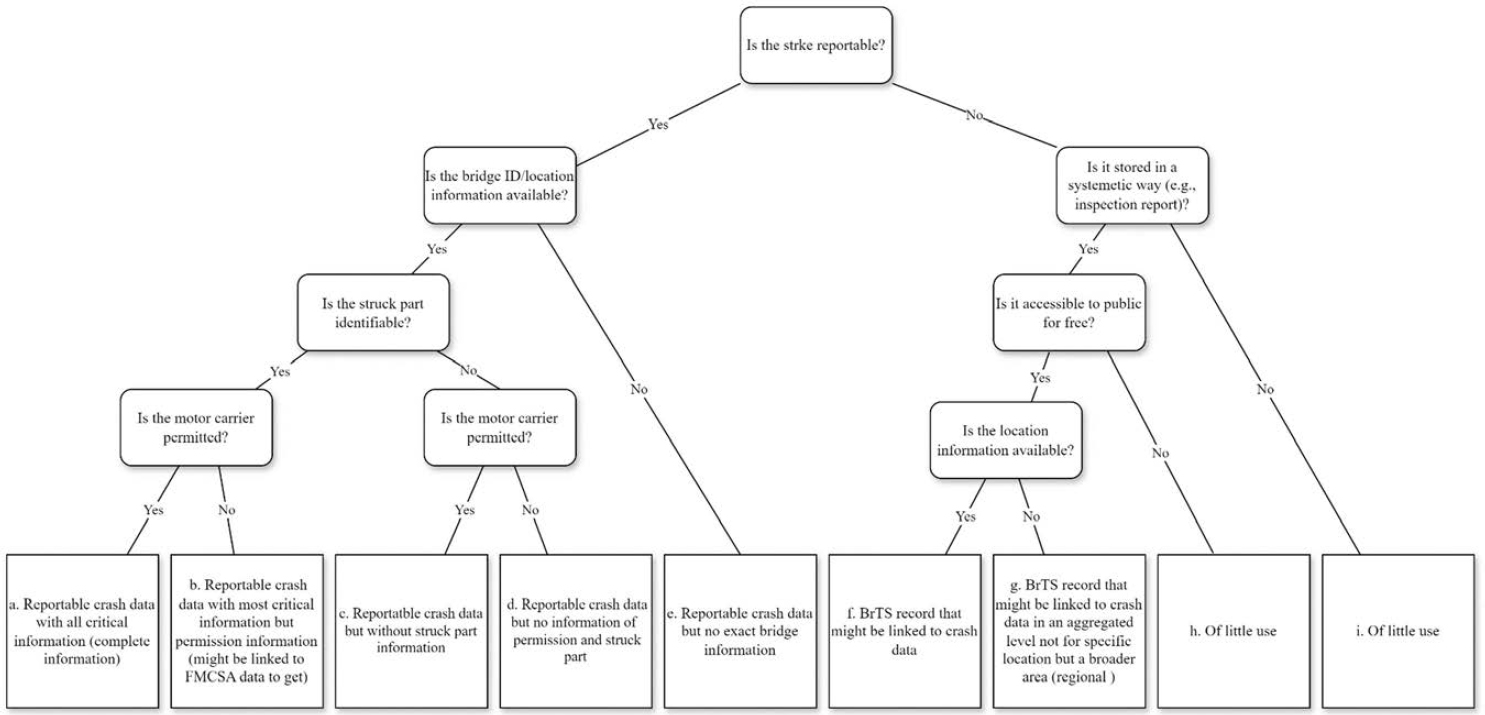
We are interested in knowing if BrTS data collection, reporting, and archiving can be standardized. Hence, we proposed a conceptual framework, illustrated in Figure C5, to collect and input information related to BrTS strikes into a data clearinghouse. It should also be noted that not all BrTS strike data would be useful or would serve the same purpose in BrTS analysis and modeling. The following important questions helped evaluate information from each BrTS event:
- Is the strike reportable?
- If non-reportable, is the strike information stored in a systematic way (e.g., inspection report)?
- Is the location information available (e.g., bridge ID, geocode, etc.)?
- Is the structural area that is struck identifiable?
- Is there any permit information available for the involved motor carrier?
- Is the data accessible to the public for free?
Depending on how these questions are answered, all potential BrTS data can be grouped into several different categories:
- Category A: Reportable crash data with all critical information (complete information)
- Category B: Reportable crash data with most critical information except permit information (might be linked to FMCSA data)
- Category C: Reportable crash data but without bridge/tunnel part(s) that is struck
- Category D: Reportable crash data but no information of permit and bridge/tunnel part(s) that is struck
- Category E: Reportable crash data but no exact bridge information
- Category F: BrTS record that might be linked to crash data
Category G: BrTS record that might be linked to crash data in an aggregated level (i.e., not for a specific location but for an area)
BrTS Applicable Technology
This section discusses the gaps and limitations in technology and strategies that could better mitigate BrTS in practice and better support BrTS analysis and modeling. Examples of some best practices are included in each subsection.
Driver Education and Training
According to the PIARC report regarding BrTS (Connolly, Kakouris, and Kelly 2022), good practice guidelines help develop skills in drivers that lead to a safer driving environment and encourage the driver/motor carrier to implement strategies and techniques that help lower the number of BrTS such as, always having the vehicle’s height on hand in order to avoid confusion when approaching a bridge, as well as practices such as providing proper driver education awareness and good practice manuals/training can help educate the driver to navigate a road network safely. In 2013, a tractor-trailer combination vehicle, traveling on a bridge that crosses the Skagit river in Washington state, struck the bridge’s support beams and caused the structure to collapse In response to this catastrophic crash, a report with in-depth investigation published by the NTSB included segments of discussion about the driver of the OSOW vehicle and the pilot/escort vehicle failing to utilize skills recommended by best practices guidelines (NTSB, 2013). The first error conducted by the driver, which a more skilled driver would have avoided, was not checking the bridge clearance information along the path. Another error performed by the driver was following too close to the escort vehicle. Due to being very close to the escort vehicle, the driver would not be able to stop in time if the escort vehicle reported any issue. The final error committed by the driver was the shifting of the vehicle to the right while being passed by a truck. This indicated the driver’s inexperience and lack of knowledge when it came to transporting a load with an oversized width.
Likewise, escort/pilot vehicle drivers also need to have skillsets and guidelines to follow. In the 2013 Skagit river bridge collapse, the driver of the escort vehicle committed an error that otherwise would have led to the safe crossing of the OSOW vehicle. The driver of the escort vehicle was engaged in multiple hands-free cell phone calls throughout the duration of the escort and even during the crossing of the bridge which led to the driver not paying attention to the fact that the right lane had lower clearance than the left lane and not informing the driver of the OSOW vehicle. Additionally, according to the Pilot Car Escort Best Practices guidelines, a review of the route for size restrictions should have been done and if so the pilot car would have better equipped and would have been able to warn the driver of the OSOW vehicle. Finally, the guidelines recommend that the pilot car driver needs to maintain a safe distance between themselves and the driver of the OSOW and the pilot car driver should have communicated with the driver of the OSOW vehicle that the spacing was too small.
OSOW Compatible Navigation System
The previous section noted that one issue for non-permitted drivers who use GPS systems is the lack of bridge vertical clearance information. FMCSA believes bridge strikes are avoidable through better awareness of route restrictions along travel paths gained by the use of a GPS navigation system intended for use by professional truck and bus drivers. The lack of vertical clearance data is in sharp contrast to other traffic data drivers receive on those systems, such as speed limits. Most GPS navigation systems include speed limit information, and some even evaluate the real-time speed to warn drivers who are speeding. Unfortunately, bridge clearance information is not well supported in almost all available GPS systems. Hence, it is important to find a way to integrate bridge clearance into navigation systems.
Traditionally, paper map like Motor Carriers’ Road Atlas by Rand McNally amongst other popular truck maps/atlases, helps inform the driver of their permitted route (if applicable) as well as low clearance sites (Rand McNally, n.d.). Additionally, some device manufacturers such as Drivewyze maintain up-to-date geographic information about the vehicle even when the navigation system is turned off to provide up-to-
date alerts about possible low clearance structures as well as other hazards (Drivewyze 2020). Furthermore, some companies, such as Here, provide 3D maps, created using HD lidar, of roadways which can provide drivers with up-to-date information about clearance requirements as well as other roadway conditions (HERE 2022). Finally, a study was published promoting a system where a mobile application connects to a central server and provides a real-time location of the vehicle. This server contains map information as well as clearance information and sends the driver a notification if the driver is on course to strike a structure. Besides, the driver can select a route and the application will inform them if there is a clearance issue and if the driver veers off the route the application uses machine learning to predict the path the driver will take and warn them if they are going to strike a structure (Abdallah and Shi 2021).
In 2021, Illinois DOT (IDOT) is pursuing an initiative called “audible turn-by-turn navigation,” which allows IDOT to electronically share authorized route details through a cloud-based app that is compatible with mobile devices. This application went live on December 1st 2021 (IDOT, 2021) and will allow drivers to hear route instructions without having to glance away from the road. The service is provided and supported by ProMiles Software Development Corporation, and it is currently being tested in Illinois, Colorado and New Hampshire. The app has no routing capabilities and does not have any OSOW restriction information, but it includes a breadcrumb trail of points that describes the route as well as driving directions associated with these points for the selected permit.
Measuring the Height of the Load/Load Securement
A load height measuring stick is the most commonly used device for measuring the height of a truck load. The stick is retractable and includes height markers that can extend all the way up to the top of a truck or load and display the height. However, for a load with an irregular shape, a measurement stick may not work well. Improper load securement can be the cause of property, environmental, and personal damage. The FMCSA has published criteria (FMCSA, n.d.) regarding the different load securement methods and how effective they need to be in certain scenarios for a load to be considered secure. Such criterion is generally seen as best practice and any deviation (i.e., “equivalent means of securement”) from it could be accepted for unconventional loads. Another article published by safeopedia aims to summarize these requirements, provide general guidelines for load securement and cargo preparation, and provide consequences to carriers or drivers who don’t follow the regulations (safeopedia 2015). Additionally, the CVSA has a long history of working with load securement issues and they have a dedicated group named the North American Cargo Securement Harmonization Public Forum, which meets twice annually to seek unified regulations in North America and address cargo securement issues that arise. They also published some informative material as well as provided bi-annual workshops with the aim of increasing road safety and driver knowledge. Technologies such as laser, infrared, and Lidar can provide more accurate measurements, but the cost may be high. Digital videos used for height measurement can be a more cost-effective, reliable alternative. A vision-based system proposed by Sandidge et al. achieved a 96.59% accuracy rate for measuring the height of trucks (Sandidge 2012).
Measuring Bridge Clearance
Many low clearance bridges are functionally obsolete, but these bridges would not receive the highest priority for repair or replacement in the near future because they do not have structural deficits. Therefore, technologies and countermeasures are needed to not only protect these bridges, but to help obtain accurate bridge clearance (e.g., vertical, horizontal, and lateral) measurements. The project team examined related documentation among state DOTs and found limited instructions on how to measure and collect bridge clearance data. Most DOTs use traditional methods such as survey rod, total station, or laser, while some (more than 10) mention the use of mobile Lidar to measure the clearance. In most cases, the Lidar measurements are conducted by a consultant. Some state DOTs might not adopt these technologies to
measure or collect bridge clearance data because of the cost and fees associated with these systems, especially laser height pole and Lidar measurement systems (price information for RSA Network’s Laser Height Pole measurement system (RSA Network Inc. 2020)).
Few state DOTs provide public information regarding the level of accuracy of their measurement and data collection related to vertical clearance. States apply different levels of tolerance in terms of measurement accuracy. For example, Iowa DOT mentions that during the quality assurance process they have a tolerance limit of 3 inches for clearance data (Iowa DOT, 2015), while a consultant of the Indiana DOT states that their Lidar techniques must meet Indiana DOT’s one-inch accuracy level (“INDOT Statewide Bridge Clearance Measurements,” n.d.).
Real-Time Reporting of Hits
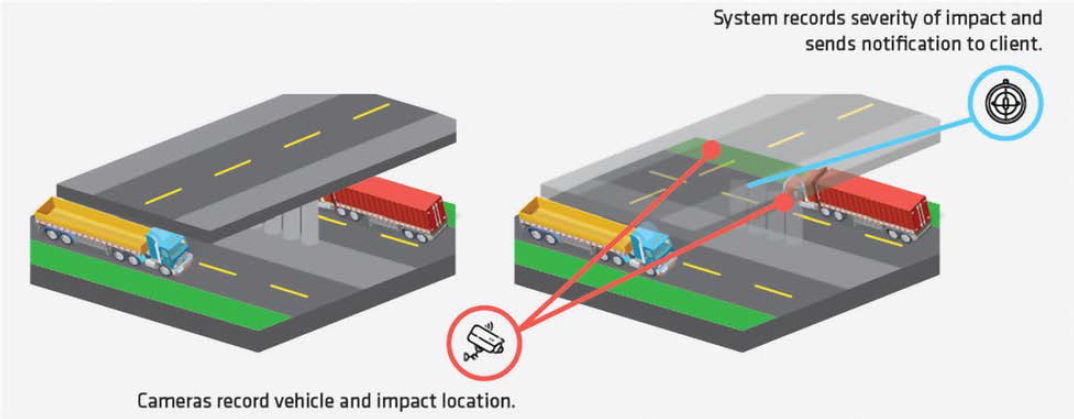
According to the literature review, many state DOTs have standard procedures for reporting and response after a collision occurs. However, a bridge/tunnel hit is not likely to be reported or recorded on time unless it is severe (either in injury severity of involved entities or level of functionality damage to the bridge/tunnel). Some BrTS might not leave visible damage but there may be internal damage. Therefore, if BrTS cannot be prevented, specific bridge/tunnel monitoring devices with the purpose of capturing BrTS in a real-time manner would be an effective alternative to mitigate the impact of BrTS. These systems would also be beneficial for data collection and analysis. Summarized by the PIARC report regarding BrTS (Connolly, Kakouris, and Kelly 2022), some technology could be employed by a DOT for real-time reporting of hits such as fiber optic cables, accelerometers, and piezoelectric sensers can detect a strike and relay that information to the appropriate governing authority to avoid unreported crashes.
Figure C6 shows a bridge collision notification system developed by HyPoint Solutions, LLC (HyPoint Solutions, LCC, n.d.-a). The system’s accelerometers are mounted on bridges to detect and record the impact from collisions or “scrapes”. Meanwhile, cameras on both sides of the bridge continuously capture images of the vehicles coming and going. A bridge impact triggers the camera to save images that are logged with a time stamp. Notification messages are transmitted to owners or agencies to initiate an on-site investigation for any collision. The impact time, location, and any images associated with the incident are recorded so that all data can be reviewed.
Prevention and Mitigation Strategies
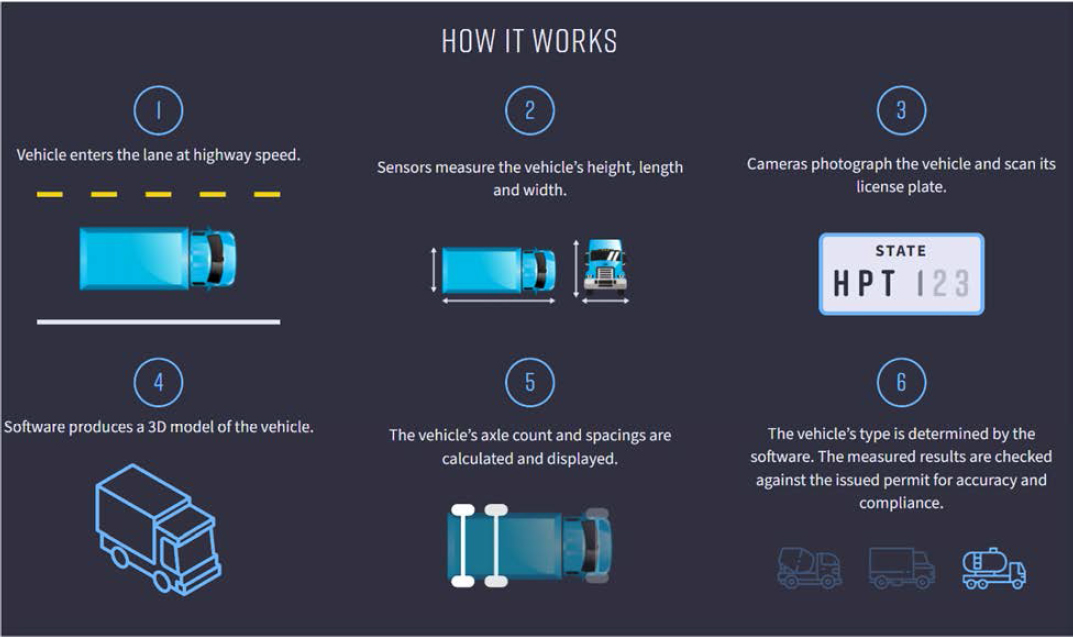
Ideally, no BrTS should happen if a driver knows the height of the load and has good knowledge of the bridge vertical clearance information along their route. The reality is that many times, neither the load height nor clearance is perfectly known. Recommended by the PIARC report regarding BrTS (Connolly, Kakouris, and Kelly 2022), technologies that could be employed by a DOT include laser vision, radar systems, over height vehicle detection systems (OVHD), computer vision, and infrared light sensors can detect when a vehicle is over height and relay that information to the driver via VMS or other technology. For example, a driver may not know, or properly measure, the height of their load. HyPoint Solutions, LLC is providing the IDOT with Hawkscan, a 3D vehicle measurement system which will allow IDOT to measure thousands and view every passing truck in real-time, as shown in Figure C7. IDOT will install Hawkscan on overhead cantilevers to monitor and measure trucks as they enter a weigh station ramp. The Hawkscan system is also designed to measure and classify vehicles during normal traffic flow. HyPoint will provide an application programming interface (API) to IDOT to integrate the solution’s data directly into IDOT’s current permitting system to automatically verify truck information against their permit dimensions.
In addition to technologies, efforts to prevent bridge hits should also be made by adopting specific strategies, such as escort training. Most states require escorts, but only 12 require escort training. Another issue is that such training (when available) does not provide instructions for route surveys (e.g., how to measure a bridge clearance). Some states try to promote certain programs through carriers to increase the awareness of BrTS (e.g., Michigan: “Know your load” (MDOT, n.d.) and “2 inch buffer for permitted loads” (MDOT, 2020)), and others work to physically increase the height of bridges on oversize-defined routes (e.g., Wisconsin: Working to increase height of bridge clearance on oversize-defined routes to 20-0 feet (WisDOT, 2021)).
It should be noted that efforts have also been made from the motor carrier industry. For example, the literature reviews have listed a series of campaigns and informational documents by UK Network Rail and Transport of Scotland, which is aimed at helping mitigate bridge strikes by providing best guidance and raising the awareness for all involved entities. Similarly, in the US, the SC&RA is addressing the problem by offering courses and webinars, such as: 1) “Bridge Safety & Accident Prevention” (SC&RA 2020), , 2) “How to Coordinate the Best OS/OW team” (SC&RA 2021c), and 3) “Pre-Trip Meetings: Be Fully Prepared Before Your OS/OW Load Hit the Road” (SC&RA 2021a). Such online education series covers a wide range of topics such as role of management in training and advocating safety and accident prevention; how the permitting process allows the driver to manage limitations of personnel and equipment; elements of the pre-trip meeting to include steps to take, issuance and receipt of permit, as well as load securement; and elements of the physical move, including the role and responsibility of pilot cars; the critical roles and responsibilities of the driver, carrier, pilot/escort vehicle operator, and public agency partners; the fully understanding permits from state to state in the US. Moreover, in 2021, SC&RA has also filed comments to proposed MUTCD changes to help promote safety and efficiency to the motor carrier industry (SC&RA 2021b). For example, SC&RA members rarely carry the loads displayed in weight limit signs (i.e., R12-5 and R12-6 in the MUTCD). These signs should rarely be used on permitted routes, and only to deter unpermitted drivers. The gross vehicle weight displayed on R12-7aP in the MUTCD far exceeds the legal weight of a CMV in most states and the interstate highway system. This might cause confusion to permitted vehicles that aren’t considered as emergency vehicles. SC&RA also notes that since the beginning of the COVID-19 pandemic a lot of carriers are transporting emergency commodities and thus may be considered an emergency vehicle. SC&RA believes R13-1 in the MUTCD should display inspection station instead of weight station due to the advancement of technology. SC&RA supports the standardization of signage showing the section with the lowest clearance, though they believe there needs to be standardization of policies and procedures used to survey and post clearance. SC&RA believes a lack of safe truck parking remains a major issue. Better signage for locations where a truck driver can detach their trailer and seek accommodations offsite. Along with the comments, 12 recommendations were also provided in the same document to State DOT’s regarding vertical clearances for OS/OW loads: “
- All bridges under 16’6” must be marked with actual height.
- All bridges under 14’ must also have prior warning.
- Distance between actual bridge height and maximum permitted height must be 3” for all states.
- Construction and maintenance projects cannot be listed as complete until remeasurement is done using consistent methods and height listings are updated in permitting systems and bridge height listings.
- If permitted route requires bridge to be ramped due to clearance issues, that portion of the route needs to be in bold.
- If permitted route requires structure to be crossed in a specific lane, that portion of the route needs to be in bold.
- States that consider lidar and other technology for measurement need to ensure accuracy and consistency.
- All states should use an automated routing and permitting system.
- All states should make bridge heights electronically accessible and designate whether they are actual bridge heights or maximum permitted heights.
- All states should provide audio turn by turn instructions for each issued permit.
- All states should require pilot car certification.
- Request planning to require a standard bridge height minimum clearance on interstates and US highways to be no less than 18’. States should review routes for any trouble spots, reduce travel on secondary roads, and prioritize available funds into raising clearances or upgrading bridges.”
Summary
This chapter presents the knowledge gaps from three aspects: 1) BrTS information communication; 2) BrTS data collection and management; and 3) BrTS applicable technology. Among the three aspects, effective communication is the key to preventing and mitigating BrTS. To improve communication, we need to realize that communication gaps may exist within or among agencies, between states and federal governments, during BrTS strike data exchanges, within motor carriers, between motor carriers and navigation systems, between motor carriers and their physical route survey and/or escort service providers, and between drivers and bridge/tunnel traffic controls. These issues can be further complicated by different OSOW permit policies, processes, procedures and requirements in different states, and varying levels of compliance with federal guidelines such as MUTCD, MMUCC.
A similar inconsistency issue was discovered in the areas of BrTS data collection, reporting, and management. Few states keep track of BrTS events due to the lack of standard procedures for data collection and investigation. Potential data gaps and limitations also exist in the reportability of BrTS events, uniformity of BrTS strike data format, and the connection between BrTS strike data and the structure inventory.
Improper load handling or route planning by motor carriers is also an issue, as well as several technology gaps that lead to further problems. The findings call for better BrTS data management that will yield timely and accurate information as well as enhanced cooperation and compliance among different parties.
Despite all the challenges, many cost-effective practices for mitigating and preventing BrTS have been implemented and satisfactory results have been reported. Also, all state DOTs collect clearance data on every bridge in a state to meet federal reporting requirements and to inform infrastructure improvement needs, and BrTS strike data can be queried from reportable crash and/or incident databases and linked to bridge/tunnel inventory. The available information can be integrated to create a BrTS data clearinghouse following the decision tree of BrTS data types in Figure C5. Moreover, the BrTS data information flow illustrated in Figure C1 helps the development of the Guide to prioritize and address the communication gaps. Finally, many states have already taken advantage of innovative technologies to accurately measure bridge vertical clearance, automate permit process, and deploy advanced bridge collision notification systems.


