Prevention and Mitigation of Bridge and Tunnel Strikes (2025)
Chapter: Appendix E: Technical Memorandum: Case Studies
APPENDIX E
Technical Memorandum: Case Studies
NYSDOT – Collision Vulnerability Assessment (CVA)
NYSDOT developed a CVA tool for bridges that evaluates the potential for collisions on and near bridges in the state of New York. The CVA is a systematic approach to identifying and assessing collision risk factors for bridges that ranks them according to their potential risk.
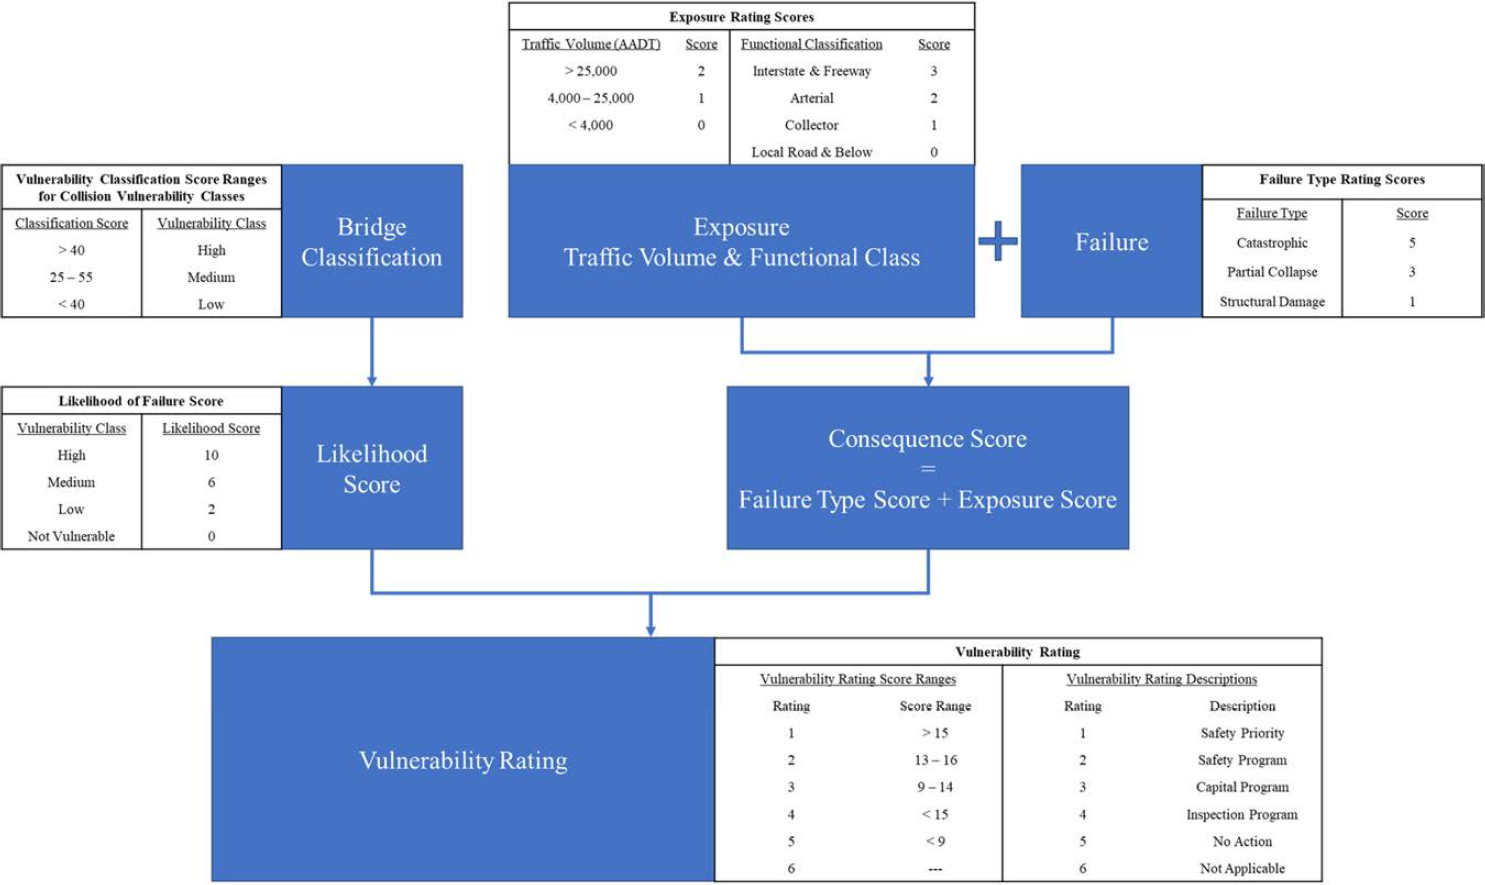
The CVA tool uses a combination of crash data analysis, field inspection, and expert judgement to identify potential hazards and evaluate their structural failure. The tool considers various risk factors, such as traffic volumes, road and bridge geometrics, and crash history to assess the bridges’ vulnerability to collisions. Figure E1 shows the general procedures of the NYSDOT’s CVA. The data utilized come from a dedicated NYSDOT collision database which contains information on bridges that have been struck by trucks.
The procedure begins with the calculation of a Bridge Classification Rating Score, an Exposure Rating Score, and a Failure Type Rating Score. With the sum of the latter two, a Consequence Score is calculated. Classification score of a bridge is based on a series of factors selected for three types of crashes: on bridge collision, under-bridge collision with pier, and under-bridge collision with superstructure; as shown in Tables E1 to E3.
Table E1. Truck on Bridge Collision Vulnerability*
| Factor | Scores |
|---|---|
| A. Bridge Type: Is Main Member a Thru Girder or Truss | Yes (Y), No (N), Branch 1 Total Score=0 |
| B. Truck Traffic: Does roadway carry truck traffic | Yes (Y), No (N), If No, Branch 1 Total Score=0. If roadway is a parkway, default to No (N) unless previously hit- Yes (Y) |
| C. Lanes of Traffic (On): | >4 (6), 4 (4), 3 (2), 2(1), 1(0) |
| D. Width of Travel Lanes (on): | <10’ (5), 10’-11’ (3), >11’-12’ (1), >12’ (0) <13’ to 13’11’’ (10), 14’ to 14’11’’ (5), 15’ to |
| E. Min. Vertical Clearance (On): | 15’11’’ (3), 16’ and greater (or no overhead bracing) (0) |
| F. Protective Barriers: | None (20), Substandard (10), Standard (0) |
| G. Volume of Truck Traffic (On) (ADTT) | >5000 (8), >2500-5000 (6), >1000-2500 (4), >200-1000 (2), 200 & below (o) |
| H. Bridge Width vs. Highway Width: | Severe necking > 10’ (10), Mod. Necking 5’-10’ (6), Minor necking<5’ (2), No change (0) |
| I. Approach Roadway Assessment | Substantial speed reduction req’d (10), Minor speed red. req’d (5), No speed red. req’d (0) |
| J. Present Wearing Surface (On): | Steel Grating-Open or filled (5), Timber (3), Other Surface (0) |
| K. Wearing Surface Condition Rating: | <3 (5), 3 or higher (0) |
| Factor | Scores |
|---|---|
| L. Lighting (On): | No Lighting (2), Lighting (0) |
| M. Design Type: | Light Truss (10), Heavy Truss (4), Thru Girder (0) |
| N. Posted Load | Not Posted (8), 27-36 tons (6), 20-26 tons (4), 12-19 tons (3), 7-11 tons (2), 3-6 tons (0) |
| O. Posted Speed Limit | >55mph (8), 40-50mph (4), 30-35mph (2), <30mph (0) |
| O. Functional Classification | Interstate (8), Arterial (4), Collector (2), Local (0) |
| P1. Previous Impact Damage | Major Damage (15), Moderate Damage (12), Minor Damage (10), Previous impacted, but no damage (5), No evidence of previous impact damage (0) |
| P2. Multiple Bridge Hits | Hit 2 or more times (15), Hit once or never been hit (0) |
| Q. VC Warning Signs: | Not Provided (4), Provided But Not Adequate (2), Not Req’d or Provided and Adequate (0), Provided, but Not Req’d (-2) |
| R. HC Warning Signs: | Not Provided (2), Provided But Not Adequate (1), Provided or Not Req’d (0) |
| S. Elev. Curb or SDWLK: | No Elev. Curb or Sdwlk (4), Elev. Curb/Sdwlk Exists (0) |
*: Source: Agrawal et al. 2011
Table E2. Superstructure Vulnerability to Truck Under-Bridge Collision*
| Factor | Revised Score |
|---|---|
| A. Under Roadway Feature: Is feature under a roadway | Yes (Y), No (N), If No, Branch 2 Total Score = 0 |
| B. Truck Traffic: Does under roadway carry truck traffic? | Yes (Y), No (N), If No, Branch 2 Total Score = 0. If Under Roadway is a parkway, default to No (N) unless previously hit – Yes (Y) |
| C. Main Member Type; | FC Deck Girder (20), FC Deck Truss (18), Suspended Spans (16), Tied Arches (14), Cross Girders & Steel Pier Caps (12), P/s I- beams, box-beams or other FC Main Member (10), Other Non-FC Main Member (0) |
| D. Pedestrian Bridge: | Yes (5), No (0) |
| E. Min. Vertical Clearance (Under) | <11’ (15), 11’ to 11’’-11’’ (12), 12’ to 12’-11’’ (10), 13’ to 13’-5’’ (8), 13’-6’’ to 13’-11’’ (6), 14’ to 14’-5’’ (4), 14’-6’’ to 15’-3’’ (2), 15’-4’’ to 16’ (1), >16’ (0) |
| F. Structural Redundancy | Simple (4), Continuous (0) |
| G. ADTT (Under) | >5000 (8), >2500-5000 (6), >1000-2500 (4), >200-1000 (2), 200 & below (0) |
| H. Lighting (Under) | No Lighting (3), Lighting (0) |
| I. Posted Speed Limit | >55 mph (8), 40-50 mph (4), 30-35 mph (2), <30 mph (0) |
| I. Functional Classification | Interstate (8), Arterial (4), Collector (2), Local (0) |
| J1. Previous Impact Damage | Major Damage (15), Moderate Damage (12), Minor Damage (10), Previous impacted, but no damage (5), No evidence of previous impact damage (0) |
| J2. Multiple Bridge Hits: | Hit 2 or more times (15), Hit once or never been hit (0) |
| K.VC Warning Signs | Not Provided (4), Provided But Not Adequate (2), Not Req’d or Provided and Adequate (0), Provided, but Not Req’d (-2) |
*: Source: Agrawal et al. 2011
Table E3. Substructure Vulnerability to Truck Under-Bridge Collision*
| Factor | Scores |
|---|---|
| A. Pier Support: Is the over roadway supported by a pier | Yes (Y), No (N), Branch 2B Total Score=0 |
| B. Truck Traffic: Does roadway carry truck traffic | Yes (Y), No (N), If No, Branch 2B Total Score=0. If roadway is a parkway, default to No (N) unless previously hit- Yes (Y) |
| C. Pier Type: | 1 or 2 columns (steel or concrete) (15), Multicolumn (10), Solid pier (0) |
| D. Protective Barriers and/or Railing: | None (20), Substandard (10), Standard (0) |
| E. Pedestrian Bridge: | Yes (5), No (0) |
| F. Structure Redundancy: | Simple (4), Continuous (0) |
| G. Volume of Truck Traffic (On) (ADTT): | >5000 (15), >2500-5000 (12), >1000-2500 (8), >200-1000 (4), 200 & below (0) |
| H. Horizontal Clearance: least distance from edge of roadway to face of pier | <30’ w/o barrier or mound (8), <30’ w/ barrier or mound (4), >30’ (0) |
| I. Weight of Superstructure: | Light (8), Moderate (4), Heavy (0) |
| J. Posted Speed Limit | >55mph (8), 40-50mph (4), 30-35mph (2), <30mph (0) |
| K. Previous Impact Damage | Major Damage (15), Moderate Damage (12), Minor Damage (10), Previous impacted, but no damage (5), No evidence of previous impact damage (0) |
| L. Orientation of Pier(s): | Skewed (4), Parallel (0) |
*: Source: Agrawal et al. 2011
After obtaining a Bridge Classification Score, vulnerability classes of “HIGH,” “MEDIUM,” and “LOW” are assigned, and the score is normalized into a 10-point scale to retrieve a Likelihood of Failure Score. Next, a Vulnerability Rating Score is computed by summing Likelihood of Failure Score and Consequence Score. Eventually, different actions can be determined based on the rating. However, there has not been an update to the 1996 Bridge Collision Vulnerability Manual, even though several recommendations have been made to modify the rating parameters and weights following a more data-driven approach ((Agrawal, Xu, and Chen 2011).
ALDOT – Safety Performance Function Development for Analysis of Bridges
ALDOT funded a project focused on the development of SPFs for single-vehicle crashes occurring on major highway bridges. Three data sources were utilized, including 1) the NBI (bridge geometry and traffic-related information), 2) the US Census Bureau’s master address file with topologically integrated geographic encoding and referencing (MAF/TIGER) (road shapefiles for Alabama), and 3) Alabama crash data from 2009 to 2012.
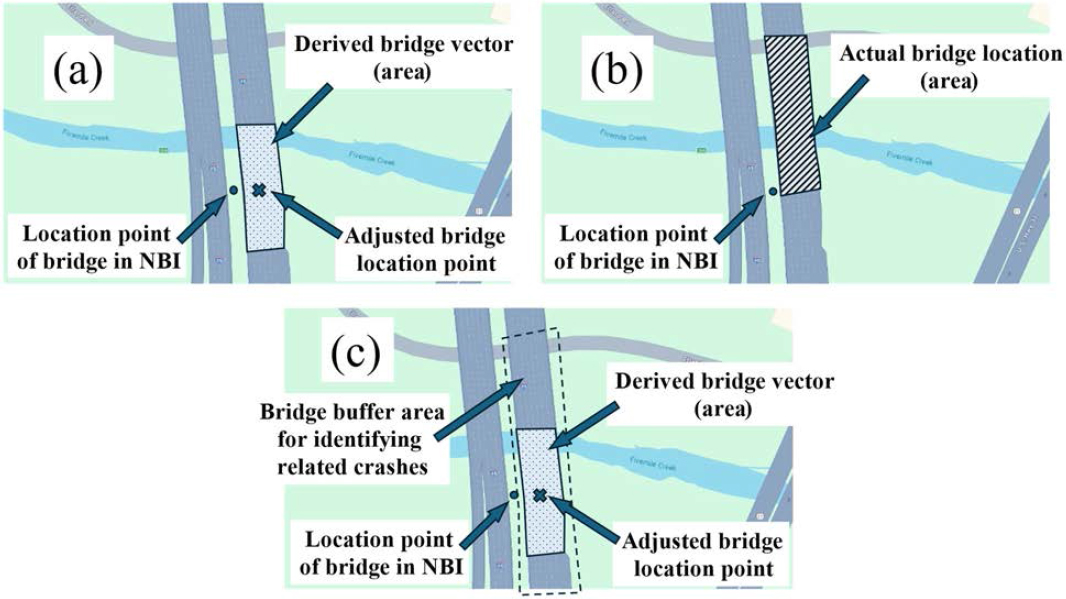
To address the inaccurate bridge location issue of bridge coordinates being within 2 miles of their actual locations, the authors moved NBI bridge point locations to the nearest roads in the MAF/TIGER database, and then converted the associated roads to bridge vectors. An on-bridge crash was designated as bridge-related if its GPS coordinates placed it directly on a bridge or within one-half of the length of each individual bridge on both sides of the bridge vector (Figure E2).
Four NB models were developed using four sets of risk factors (Table E4) and a training-validating process to compare their relative predictive capabilities. Although all the variables listed below are considered as “risk factors,” the selection of those that are statistically significant varies by the type of model and the model assumptions. Usually, the model with the best statistical “goodness-of-fit” is chosen. Table E5 summarizes the risk factors and their effects on crash occurrence in this study.
Table E4. Risk Factors in Four Models
| Variable/Risk Factors | Model 1 (Best in training data) |
Model 2 | Model 3 (Best in validation) |
Model 4 |
|---|---|---|---|---|
| AADT | • | • | • | • |
| Bridge length | • | • | • | • |
| Transition (Y/N) | • | • | NA | NA |
| Approach rail (Y/N) | NA | • | NA | NA |
| Railing (Y/N) | NA | • | NA | NA |
| Truck percentages | NA | • | • | • |
| Average shoulder width | NA | • | NA | • |
Table E5. Risk Factors and Their Effects
| Variable/Risk Factors | Relationship to the BrTS (on-bridge crashes) |
|---|---|
| AADT | Positive |
| Bridge length | Positive |
| Transition (Y/N) | Negative |
| Approach rail (Y/N) | Positive |
| Railing (Y/N) | Positive |
| Truck percentages | Negative |
| Average shoulder width | Positive |
FDOT – Florida DOT Pontis User Cost Study
The FDOT-funded project investigated the causal factors of bridge-related accidents and developed an accident risk model for on-bridge crashes. Data was prepared by merging FDOT’s Pontis data with highway crash data maintained by the Florida Department of Highway Safety and Motor Vehicles. A 500-ft buffer distance was used to join the crash with the bridge, and it was assumed that parallel bridges share the same accident risk (i.e., a crash joined with multiple bridges was divided evenly between all bridges).
First, an exploratory data analysis was conducted to evaluate the variables associated with potential user cost savings for certain facility improvements. Driver and vehicle characteristics were not included. The list of the selected risk factors follows.
- Narrowness = roadway width (NBI 51) / number of lanes (NBI 28A)
- Funnel = approach road width (NBI 32) / the bridge roadway width (NBI 51)
- Approach alignment rating (NBI 72)
- Deck condition (NBI 58)
- Functional classification (NBI 26)
- Bridge length (NBI 49)
- Number of lanes (NBI 28A)
- Traffic direction (NBI 102)
- Flared structure (NBI 35)
- Pedestrians allowed (NBI 42A)
- ADT (NBI 29)
- ADT Truck percent (NBI 109) (omitted due to the weak correlations to crash risk)
- Ramp (omitted due to the absence)
- Weather (omitted due to the issue of transferability)
- District (omitted due to neglectable significance)
- Speed (omitted due to not neglectable significance)
Two types of tests were conducted: 1) a correlation test to see if one risk factor is highly correlated with crash frequency (also each attribute if the risk factor is not binary), and 2) a hypothesis test that used Wilcoxon rank-sum test by dividing the data set into two samples based on each risk factor to see if the samples differed in their accident rates (i.e., annual accidents per million daily vehicles).
The final model was a linear regression model to predict accident counts, which takes into account the functional class of the roadway, the number of lanes, the length of the bridge, the approach alignment rating, the width of the roadway, the average daily traffic count, the future traffic forecast, the condition rating of the deck, and the narrowness of the bridge. The model was tested for stability, and correlations between explanatory variables were also investigated. The R-squared goodness-of-fit test for this model was high, suggesting that the model explains 54% of the variation in the data. The model under-predicts accidents at the extremes of its range but performs reasonably well in the middle of the range. Deck condition was found to have a significant effect on accident counts when included as a separate variable, and the combined effect of bad geometrics and a bad deck is significantly greater than the separate effects of these deficiencies. Table E6 summarizes the risk factors and their effects on the crash occurrence.
Table E6. Risk Factors and Their Effects
| Variable/Risk Factors | Relationship to the BrTS (on bridge crashes) |
|---|---|
| Rural arterial | Negative |
| Urban arterial | Positive |
| Number of lanes × bridge length | Positive |
| Narrowness × ADT | Positive |
IDOT – Crashes Associated with Bridge Rails on Low-Volume Roads
The IDOT-funded project focused on identifying significant contributing factors for crashes associated with guardrails and bridge rails at secondary roadway bridges. Crash data (2004-2013), structures (bridges), and roadways (secondary roads) were utilized. The summary for each category can be found in Table E7.
Table E7. Potential Variables
| Data Source | Variable | Description |
|---|---|---|
| Crash | Number of Crashes (in 10 years) | The sum of crashes from 2004 to 2013 involving bridges (per structure). |
| Crash Severity (1 = Fatal; 5 = PDO) | 1 = Fatal, 2 = Major, 3 = Minor, 4 = Possible/Unknown, 5 = PDO crashes | |
| Structure Length (ft) | The length of a structure (bridge) in ft. | |
| Structure | Bridge Roadway Width (ft) | The curb-to-curb distance (width) between the structure railings (in ft). |
| Approach Roadway Width (ft) | The width of usable roadway approaching the structure (in ft). | |
| Relative Approach Width (ft) | The algebraic difference in bridge and approach roadway widths (in ft). | |
| Narrow Approach Indicator | An indicator variable for structure narrower than approach: 1 = narrow; 0 otherwise. | |
| Bridge Age (Years) | The average (or middle year) age of the structure at time of crash. |
| Data Source | Variable | Description |
|---|---|---|
| Roadway | AADT (vehicles per day) | The annual average number of vehicles using the structure roadway each day. |
| Speed Limit (MPH) | The posted speed limit of the roadway the structure is on (in miles per hour). | |
| Surface Lane Width (ft) | The width of roadway surface (excluding shoulder and median widths). | |
| Median Width (ft) | The width of roadway median in ft. | |
| Paved Road Indicator | An indicator variable for structure on paved road: 1 = paved; 0 otherwise. | |
| Number of Lanes | The number of lanes serving the roadway the structure is on. | |
| Average Shoulder Width (ft) | The algebraic average of the right and left shoulder widths of the roadway. |
NB model was selected with , where:
– [yi]= the expected crash frequency per structure (i) in 10 years,
– β0= the intercept term,
– βi= the (estimated) parameter coefficient per variable x,
– xi= the explanatory variables (traffic volume, length, widths, age), and
– εi= the disturbance term.
Prior to the development of the final model results, Pearson’s correlation analysis checked for multicollinearity. Three sets of models were respectively developed for bridges on statewide roads, paved road, and unpaved roads. Table E8 summarizes the risk factors and their effects on crash occurrence using different models.
Table E8. Risk Factors and Their Effects
| Variable/Risk Factors | Relationship to the BrTS (on bridge crashes) |
|---|---|
| Statewide | |
| AADT | Positive |
| Bridge length | Positive |
| Paved road (Y/N) | Negative |
| Relative approach width | Negative |
| Average shoulder width | Positive |
| Bridge age | Positive |
| Paved Road | |
| AADT (>400) | Positive |
| Bridge length (>150 ft) | Positive |
| Relative approach width (<0 ft) | Negative |
| Bridge age (>25 years) | Positive |
| Unpaved Road | |
| AADT (>50) | Positive |
| Bridge length (>35 ft) | Positive |
| Bridge width (<20 ft) | Negative |
| Bridge age (>25 years) | Positive |
SDDOT – Evaluation of Truck Impact for Interstate Overpasses
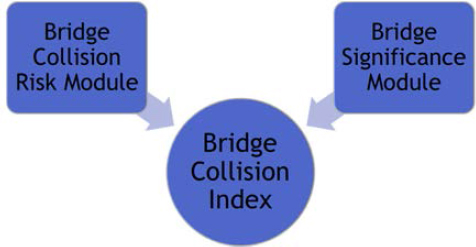
The SDDOT-funded project aimed to calculate the probability of a run-off-road (ROR) crash underneath a bridge and evaluate the vehicle impact hazards for overpass bridges by considering both collision risk and road user cost (RUC) in the event of bridge collapse. A bridge collision index is derived from collision risk and the significance of a collision, as illustrated in Figure E3.
Bridge collision risk (CR) is calculated using the NB ROR crash prediction model. The expected number of crashes is formulated as ,
where:
– Ei = expected number of ROR crashes on segment i
– ADTTi = average daily truck traffic on segment i,
– Li = length of roadway segment i,
– α and β = model parameters, and
– xi = geometric and traffic variables on segment i.
The study utilized the hazard envelope, which is the hazard exposure to an erratic vehicle, for which a bridge collision occurs if the bridge bent happens to be located in the erratic vehicle’s trajectory path. The CR for a bridge bent is obtained by multiplying truck ROR crash density by the appropriate hazard envelope.
Bridge significance is determined by the road user costs:
RUC= Value of Time (VOT) + Vehicle Operating Costs (VOC) + Accident Cost (AC)
where:
– VOT is estimated based on wage rates and delays because of the length of a trip on a detour route or an alternative route(s). The formulation is as follows:
VOT = ∗ 60 ∗ volume ∗ unit cost ∗ vehicle occupancy factor
– VOC is a composite of the costs associated with operation and ownership of the vehicle over the project analysis period. Vehicle operating costs include the costs associated with fuel, oil, tire wear, vehicle maintenance and repairs,. Ownership costs include the costs of insurance, license and registration fee and taxes, and economic depreciation and finance charges. The formulation is as follows:
– VOC = detour distance ∗ unit cost ∗ volume
– AC is measured from changes in the total annual cost of crashes as a result of the potential accidents on the detour route. The formulation is as follows:
AC = (detour distance ∗ volume ∗ accident rate ∗ unit cost)/1,000,000
Risk significance (RS) can be obtained by taking the product of the collision risk and RUC, or using this relationship: RS = CR × RUC. The authors proposed two methods to rank bridges by RS for inspection, maintenance, or repair.
- The first option is a measure of relative risk using the sum of weighted Z-scores of bridge CR and RUC:
Z_weighted=0.5Z(CRi)+0.5Z(B_RUCi), Where:
, and
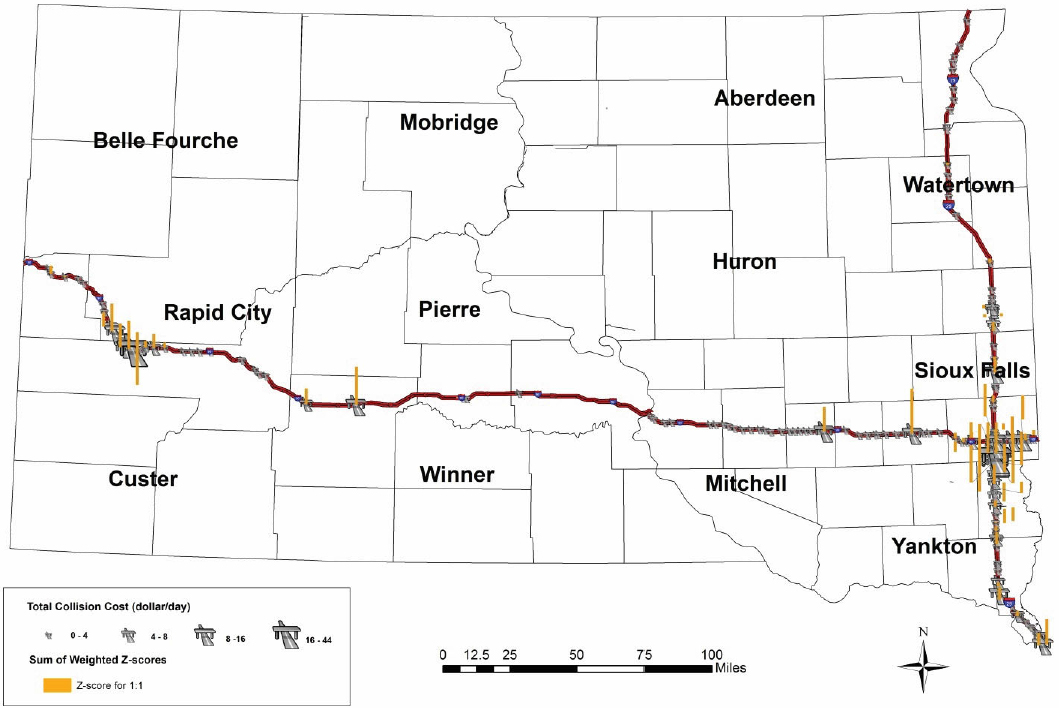
Figure E4 shows the bridge ranking by the sum of equally weighted Z-scores of CR and bridge RUC for the overpass bridges considered in this study. The length of the bar chart denotes the value of the sum of weighted Z-scores, and the size of the bridge symbol denotes the total collision cost which is calculated as the product of the truck-bridge CR and the bridge RUC.
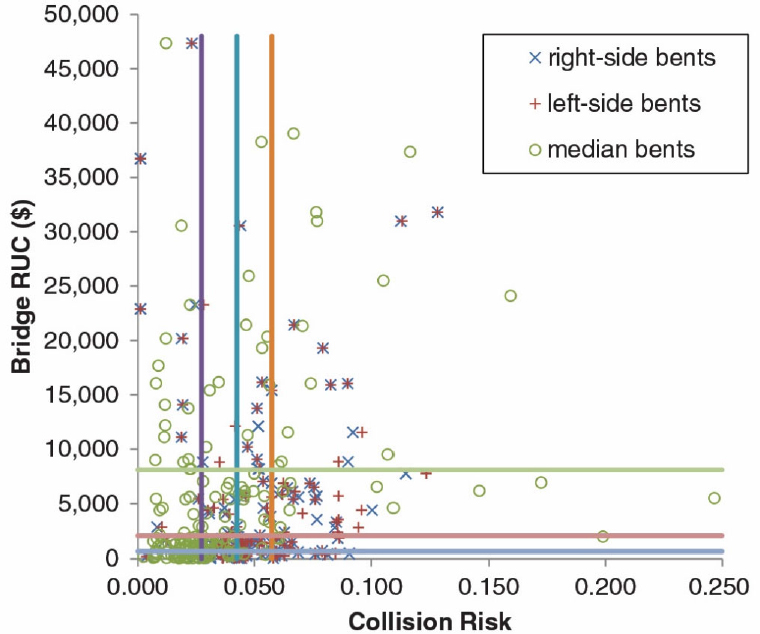
- The second option is to rank bridges by its relative standing in CR as well as RUC. In Figure E5, the X-axis indicates the CR between trucks and overpass bridges, measured in crashes per year. The Y-axis shows the additional RUC resulting from the bridge collision. The three horizontal lines represent RUC values in 25%, 50%, and 75%, while the three vertical lines show the bridge CR in 25%, 50%, and 75%. Various symbols depict the right side, left side, and median bents of a bridge. Hence, high-risk bridges are the ones that are located in the area of 75 percentile values of both CR and RUC.
Table E9 summarizes the risk factors in the study and their effects on crash occurrence.
Table E9. Risk Factors Identified in Qin et al. (2014)
| Variable/Risk Factors | Relationship to the BrTS (ROR under-bridge crashes) |
|---|
| Average shoulder width | Negative |
| Truck AADT | Positive |
| Shoulder type (concrete) | Positive |
| Rumble strip (Y/N) | Positive |
| Horizontal curve (degree) | Positive |
| Curve (k-value) | Negative |
TxDOT – Estimating Risk for Crashes Involving Heavy Vehicles and Bridge Piers
The TxDOT-funded project focused on developing a methodology to estimate the risk of a crash between a heavy vehicle and a bridge pier. The analysis was carried out using data collected in Texas and Minnesota. Two types of analyses were conducted: 1) the crash risk for the substructure of the bridge that crosses the highway being struck was estimated using probability theories; and 2) crash risk for the roadway segment was estimated using NB regression models as a function of truck exposure and covariates for the physical characteristics of the road.
The regression analysis used two functional forms: a general TAADT model which includes traffic flow as the only covariate, and a more complicated form which includes traffic flow and other covariates. The Empirical Bayes method was used for refining the safety estimates of a given site, taking into account crashes that occurred at the given site and the safety performance of sites with similar characteristics. The results of this analysis showed that lane width, shoulder width and bridge density were found to be significant in causing these kinds of crashes in Texas and Minnesota. The Empirical Bayes method can be used for identifying hazardous sites, evaluating the safety effects of interventions, or for assessing the potential safety benefits due to site improvements.
The two methods are briefly described as follows:
- Estimating crash risk using probability theories:
-
Risk for a heavy vehicle to run-off-the-road:
- Total number of opportunities = number of years × TAADT × 365
- PT_ROR = the number of truck ROR crashes on one mile road section / the total number of opportunities
- Risk for a heavy vehicle to hit a bridge pier:
- PHBP | T_ROR = the number of trucks hitting a bridge pier / the number of Trucks ROR crashes
- Risk for a truck traveling on the highway to hit a bridge pier:
- PHBP = PT_ROR × PHBP | T_ROR
- Annual Frequency the bridge pier is hit = TAADT × PHBP × 365
- Estimating crash risk using regression models:
- General TAADT model:
-
, where:
- μi is the estimated number of crashes per year for segment i,
- Fi is the ADT for segment i,
- Li is the and segment length, and
- β0 and β1 are the estimated coefficients.
-
, where:
- Model considering other risk factors:
- . The notions used here are the same as the general TAADT model with additional potential risk factors (xj), which are lane width, shoulder width, right shoulder width, bridge (pier) density, and curve density. If the bridge (pier) density has little effect on the crash occurrence, the following equation form can be used: .
- Empirical Bayes method (long-term mean estimation for the segment):
-
, where:
- is the EB estimate in crashes per year for segment i and year t,
- ωit is the weight factor for segment i and year t, , ϕ is the inverse dispersion parameter,
- yit is the observed number of crashes for segment i and year t,
- is the estimated number of crashes by crash prediction models for segment i and year t (from the NB model)
-
, where:
- General TAADT model:
Table E10 briefly summarizes the finding on the general effect of each risk factor used in this study towards the crash occurrence in this study.
Table E10. Risk Factors and Their Effects
| Variable/Risk Factors | Relationship to the BrTS (ROR under-bridge crashes) |
|---|---|
| Average shoulder width | Negative |
| Horizontal curve (degree) | Positive |
| Bridge roadway width | Negative |
| Number of bridges | Positive |
| Number of curves | Positive |
| AADT | Positive |
| Truck AADT (TAADT) | Positive |


