Prevention and Mitigation of Bridge and Tunnel Strikes (2025)
Chapter: Appendix F: Technical Memorandum: Summary of State Agency Survey Results
APPENDIX F
Technical Memorandum: Summary of State Agency Survey Results
Executive Summary
BrTS pose a significant threat to public safety, resulting in damage to vehicles and infrastructures, injuries/fatalities, and costly delays for highway users. Meanwhile, the lack of comprehensive information on the number, location, and severity of BrTS impedes the identification of at-risk structures and the implementation of cost-effective countermeasures. In response to this challenge, the project team collected BrTS data from traffic safety analysts/traffic engineers at state DOTs as well as developed a comprehensive survey to gain feedback from state agencies on the prevalence of BrTS and the effectiveness of current prevention measures.
The survey consists of 30 questions divided into five sections. It was distributed through the AASHTO COBS and the ATSIP. Thirty-five respondents were received, 25 of which were considered valid. The majority of respondents were bridge engineers and inspectors and do not belong to the ATSIP members that responded to our BrTS data request.
In terms of BrTS data management, nine states (Delaware, Indiana, Michigan, New York, Nebraska, Pennsylvania, Rhode Island, South Dakota, and Texas) claimed to have established a stand-alone BrTS database. Eight states (Delaware, Michigan, New York, Nebraska, Pennsylvania, Texas, Kentucky, and Wisconsin) indicated they have developed a risk assessment method to identify risky bridges/tunnels. While most of the responding agencies (13) do not track repair costs for BrTS damages as part of their data, seven states (California, Delaware, Indiana, Minnesota, New York, Pennsylvania, and South Dakota) do retain this information. It would be good practice to establish a centralized data inventory system that would house data on structure, crash, and cost for consistent BrTS information management. AASHTOWare™ Bridge Management (BrM) software has been cited repeatedly in the survey responses, so that might be one option for agencies to record and store bridge damage information. Indiana’s use of the DamageWise program for tracking damage to state property is another example of a good practice.
Some important facts have been observed with regard to BrTS statistics: 1) most respondents (18 or 72%) agreed that BrTS are underreported; 2) ‘bridge upper structure’ has the highest estimated percentage of collisions by OHVs, followed by ‘bridge railing or parapet’ in cases of on-bridge collisions; 3) it is a consensus from the respondents that strikes are mainly due to driver error (e.g., improper measure/operation of cargo height and unpermitted loads; 4) the most common practice (11 states) is to post a sign for 3" less than the actual measured clearance; 5) zero states provide lane-by-lane vertical clearance information as a resource to motor carriers and drivers; and 6) 11 (74%) states require a routing analysis prior to granting OSOW permits. States frequently cited ProMiles and Bently Superload as useful automated permitting/routing systems, which aligns with the literature findings. States that experience a high number of BrTS crashes often face difficulties accessing BrTS statistics and have not developed risk assessment methods to identify bridges that are at a high risk of being struck by motor vehicles.
The survey included two questions about the current practices and future plans for BrTS detection and mitigation countermeasures by transportation agencies. Rankings were analyzed based on popularity and are provided in the summary. More than 50% of state DOTs indicated they’re using the following measures
to prevent/mitigate BrTS: 1) Online Maps (e.g., up-to-date height or size restriction, interactive maps through a DOT website such as 511); 2) Static Warning Signage; 3) Bridge Markings; 4) Route Surveys; 5) Increased Structure Vertical Clearance; 6) Axle Load Restrictions; and 7) VMS. The only measure for detecting BrTS that is being utilized by more than 50% of respondents is “Beacons, Flashing Beacons, or Lights”. In addition, state agencies use various levels and scales of involvement to communicate with the trucking industry on BrTS issues, including regional/national meetings, partnerships with the trucking industry through advisory committees, regular meetings, and data sharing, in-house systems, online resources, and CDL training.
When asked about a state’s response to a frequently struck bridge/tunnel, as the answers are: 1) additional/advanced signage/control devices/overheight warning devices; 2) replacement priority, earlier rehab/replacement, or given additional strength in the repair; 3) lowering the pavement or increase vertical clearance; 4) driver awareness education; and 5) roadway geometry adjustment.
Introduction
BrTS inflict serious damage to vehicles and highway bridges/tunnels, cause injuries and fatalities, impose costly delays on highway users, and require expensive responses from bridge/tunnel owners, managers, and public safety agencies. A lack of comprehensive information on the number, location, and severity of BrTS hinders efforts to identify at-risk structures and implement cost-effective countermeasures. In response to this challenge, the project team collected BrTS data from traffic safety analysts/traffic engineers at state DOTs as well as developed a comprehensive survey to gain feedback from state agencies on the prevalence of BrTS and the effectiveness of current prevention measures.
It is also important to collect data regarding driver behavior and characteristics, driver education programs, training and safety awareness, corporate safety culture, state agencies’ policies and procedures for designing and operating bridges and tunnels, as well as permitting, escorting, and enforcing oversize/overweight (OS/OW) vehicles, etc. Thus, this survey takes into account NCHRP 08-139 Project Guide for Preventing and Mitigating the Risk of Bridge and Tunnel Strikes by Motor Vehicles to collect additional information. It is essential to use data to assess the impact and risk of BrTS and establish a framework for identifying and evaluating effective preventive measures. The purpose of the survey was to gather feedback from various state agencies that would inform the development of a national clearinghouse for collecting and analyzing BrTS data.
The survey is comprised of five sections. The first section pertains to the survey participants and their affiliations. The subsequent sections contain a total of 30 questions that cover different aspects of BrTS. Specifically, the second section focuses on general BrTS information, including the quantity of bridges and tunnels under maintenance, the frequency of bridge and tunnel strikes, the types of damages sustained, the maintenance records kept, the costs of repairs, and so forth. The third section queries participants about their respective practices of detecting, reporting, preventing, and mitigating BrTS. The fourth section deals with the regulations, practices, and guidelines implemented by the state regarding overheight vehicles. Lastly, the fifth section invites participants to provide any additional comments they have regarding BrTS.
The Qualtrics-based survey was distributed to the ATSIP with the assistance of Vanasse Hangen Brustlin, Inc. (VHB), as well as to the AASHTO COBS with the assistance of the project manager, Mr. Abu-Hawash.. Twenty-five of the 35 surveys received were considered valid, as they contained answers to at least one of the main questions.
Basic Information about Survey Participants
The survey was distributed to all states in the US, targeting state DOTs. The first section collects basic information about survey participants, including their geographic information and their relationships to BrTS. Twenty-five valid responses from 20 DOTs, one state agency other than a DOT, and one local agency were received. Figure F1 displays in blue the states that participated. Three states (CA, DE, and IN) provided multiple responses, either from different respondents within the same agency or from different agencies. One individual affiliated with the Indiana Criminal Justice Institute responded to the survey because of their responsibility for managing traffic safety data. Additionally, one response is from the Guam Department of Public Works.
Most survey respondents are bridge engineers and bridge inspectors who are not included in the group from ATSIP that responded to the BrTS data request. Ten states responded to both the BrTS data request and state agency survey, as shown in Table F1.
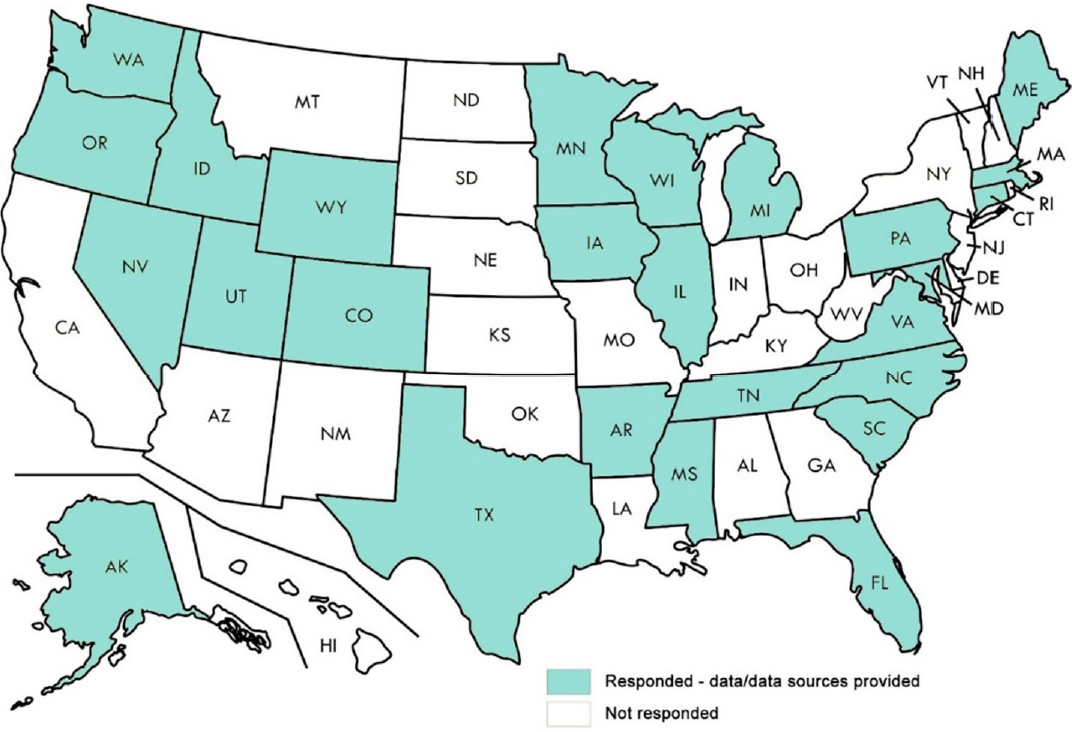
Table F1. States Responded to BrTS Data Request and the Survey.
| States | Responded to BrTS Data Request16 | Responded to BrTS Agency Survey |
|---|---|---|
| Alaska | √ | |
| Arkansas | √ | √ |
| California | √ | |
| Colorado | √ | |
| Connecticut | √ | |
| Delaware | √ | |
| Florida | √ | |
| Idaho | √ | |
| Illinois | √ | |
| Indiana | √ | |
| Iowa | √ | |
| Kansas | √ | |
| Kentucky | √ | |
| Louisiana | √ | |
| Maine | √ | |
| Maryland | √ | |
| Massachusetts | √ | |
| Michigan | √ | √ |
| Minnesota | √ | √ |
| Mississippi | √ | |
| Nebraska | √ | |
| Nevada | √ | √ |
| North Carolina | √ | |
| New York | √ | |
| Oregon | √ | |
| Pennsylvania | √ | √ |
| Rhode Island | √ | |
| South Carolina | √ | √ |
| South Dakota | √ | |
| Tennessee | √ | √ |
| Texas | √ | √ |
| Virginia | √ | |
| Washington | √ | |
| Wisconsin | √ | √ |
| Wyoming | √ | √ |
___________________
16In September 2022, the project team coordinated with the Association of Transportation Safety Information Professionals (ATSIP) to send two data requests to its member agencies: 1) crash data on bridge and tunnel hits and 2) roadway, traffic volume, and structures data. By the end of October 2022, over twenty (20) state agencies responded positively to our data request.
General BrTS Questions
First, the agencies were asked about the number of bridges/tunnels they regularly maintain and update in their bridge/tunnel inventory. Table F2 provides the summary of all 25 responses. Statistics from both the 2022 NBI and the 2022 NTI are also included in the table for comparison. Most states provide similar numbers, although discrepancies can be observed for California, Delaware, and Indiana. The reason for these differences might be the fact that some respondents belong to different agencies, or different units/regions within the same agency. For example, for “California DOT response 1”, the person is responsible for toll bridge inspections, and for “California DOT response 2”, the person is responsible for SM&I of the North region, while the “California DOT response 2” respondent is a supervising bridge engineer responsible for all bridges. The discrepancies suggest that some states do not have a centralized bridge/tunnel inventory that can be accessed by all stakeholders.
Table F2. Number of Bridges and Tunnels Maintained and Updated by State/Local Agencies*.
| Agency | Number of Bridge | Number of Highway Bridge (NBI 2022) | Number of Tunnels | Number of Tunnels (NTI 2022) | |
|---|---|---|---|---|---|
| Arkansas D | OT | 7,359 (state) | 12,955 | 1 | 1 |
| California DOT | Response 1 | 40 | 25,810 | 0 | 105 |
| Response 2 | ~7,000 (state) | - | |||
| Response 3 | ~9,500 | ~50 | |||
| Delaware DOT | Response 1 | 1,888: 1,782 (state); 15 (Delaware River and Bay Authority); 17 (municipalities); 8 (state DNREC/Parks); 51 (railroad bridges); 15 (private) | 872 | 0 | 0 |
| Response 2 | 1,888: 1176 (state); 112 (other) | 0 | |||
| Indiana Criminal Justice Institute | ~18,900: ~5,600 (state) | 19,367 | 1 | 6 | |
| Indiana DOT | 19,431: 5,763 (state); 13,668 (other) | 6 (state) | |||
| Kansas DOT | ~25,000 | 24,931 | 1 | 1 | |
| Kentucky Transportation Cabinet | > 9,000 | 14,482 | 8 | 10 | |
| Louisiana DOTD | ~12,000 | 12,733 | ~2 or 3 | 3 | |
| Michigan DOT | 5,906 (state) | 11,314 | 3 (state) | 11 | |
| Minnesota DOT | 21,197: 4,806 (state); 8,596 (county); 5,624 (town/township); 1,374 (city/municipalities); 797 (other) | 13,497 | 6: 5 (MnDOT); 1 (MAC) | 6 | |
| Nebraska DOT | 15,500 | 15,336 | 0 | 3 | |
| New York State DOT | ~20,000: ~17,500 (state) | 17,577 | 1 | 10 | |
| Pennsylvania DOT | 32,133: 25,454 (state, ≥ 8′ in length); 6,679 (Local, ≥ 20′ in length) | 23,202 | 33: 10 (state); 23 (others) | 28 | |
| Rhode Island DOT | 1,277 | 784 | 1 | 1 | |
| South Carolina DOT | ~9,500 | 9,427 | 0 | 0 | |
| South Dakota DOT | 5,760: 1819 (state); 3941 (local) | 5,897 | 7 | 7 | |
| Tennessee DOT | 20,208: 8,450 and 632 additional “underpass only” bridges (e.g., railroad and pedestrian bridges) (state) | 20,377 | 9 | 14 | |
| Texas DOT | ~56,500: ~36,250 (state); ~20,250 (local) | 55,701 | 7 | 6 | |
| Wisconsin DOT | 14,300 | 14,336 | 5 | 5 | |
| Wyoming DOT | 2,847 (825 over roadways) | 3,121 | 10 | 10 | |
*: Bold numbers denote the total number of bridges and tunnels in the state
Next, the representatives the various states were asked to share information about the number of bridge strikes and tunnel strikes that occurred in their respective states during 2019-2021. Most of the states gave
an estimate of the number of BrTS. Table F3 shows the number of bridge strikes (2019-21). Fourteen out of 25 (56%) of the respondents provided bridge strike statistics, 6 (24%) chose “I do not have any bridge strike statistics” and 5 (20%) did not answer the question. Indiana and Delaware each included two responses. In Delaware, both answers are the same, while in Indiana, answers are very different with the two respondents being from two different agencies. When crash statistics were connected with the number of bridges, it was observed that Texas has a comparatively lower number of bridge strikes despite having the highest number of bridges among all states that responded.
Table F3. Number of Bridge Strikes in Three Years (2019-21).
| Agency | 2021 | 2020 | 2019 | Average Annual Bridge Strikes | |
|---|---|---|---|---|---|
| Indiana Criminal Justice Institute | 667 | 606 | 770 | 681.00 | |
| Indiana DOT | 37 | 46 | 38 | 40.33 | |
| Kansas DOT | 476 | 559 | 639 | 558.00 | |
| Kentucky Transportation Cabinet | 370 | 358 | 364 | 364.00 | |
| New York State DOT | 417 | 287 | 254 | 319.33 | |
| Tennessee DOT | 234 | 234 | 239 | 235.67 | |
| Texas DOT | 83 | 85 | 85 | 84.33 | |
| Michigan DOT | 25 | 21 | 36 | 27.33 | |
| Pennsylvania DOT | 22 | 28 | 8 | 19.33 | |
| Delaware DOT | Response 1 | 15 | 10 | 8 | 11.00 |
| Response 2 | 15 | 10 | 8 | 11.00 | |
| Wyoming DOT | 10 | 10 | 8 | 9.33 | |
| Nebraska DOT | 8 | 14 | 5 | 9.00 | |
| South Dakota DOT | 1 | 3 | 1 | 1.67 | |
Table F4 shows the data regarding tunnel strikes: 8 respondents (32%) provided tunnel strike data; 14 (56%) selected “I do not have any tunnel strike statistics”, and the rest (12%) did not answer the question. The data shows that tunnel crashes are uncommon, and this is to be expected considering the small number of tunnels in the surveyed states. Remarkably, Rhode Island reported the highest number of tunnel collisions among all respondents, despite having only one tunnel.
Table F4. Number of Tunnel Strikes in Three Years (2019-21).
| Agency | 2021 | 2020 | 2019 | Average Annual Tunnel Strikes |
|---|---|---|---|---|
| Delaware DOT | 0 | 0 | 0 | 0.00 |
| Indiana DOT | 1 | 0 | 0 | 0.33 |
| Michigan DOT | 0 | 0 | 0 | 0.00 |
| Minnesota DOT | 0 | 0 | 0 | 0.00 |
| Nebraska DOT | 0 | 0 | 0 | 0.00 |
| Pennsylvania DOT | 0 | 1 | 0 | 0.33 |
| Rhode Island DOT | 11 | 15 | 21 | 15.67 |
| Wyoming DOT | 0 | 0 | 1 | 0.33 |
Table F5 shows how BrTS data are obtained for the responding states. Out of the 25 respondents, 10 (40%) responded that the state obtained data from a stand-alone database. Of the remaining respondents, 10 (40%) chose the option “Difficult to find from crash data or other sources”, 3 (12%) chose “limited or no knowledge”, and 2 (8%) chose the option “Easily identified from crash data or other sources”.
Table F5. BrTS Data Source for Different State and Local Agencies.
| Agency | BrTS Data Source | |||
|---|---|---|---|---|
| Stand-alone database | Easily identified from crash data or other sources. | Difficult to find from crash data or other sources | Limited or no knowledge | |
| Arkansas DOT | X | |||
| California DOT | X (from all three respondents) | |||
| Delaware DOT | X (from 1st respondent) | X (from 2nd respondent) | ||
| Guam Department of Public Works | X | |||
| Indiana DOT | X | |||
| Indiana Criminal Justice Institute | X | |||
| Kansas DOT | X | |||
| Kentucky Transportation Cabinet | X | |||
| Louisiana DOTD | X | |||
| Michigan DOT | X | |||
| Minnesota DOT | X | |||
| New York State DOT | X | |||
| Nebraska DOT | X | |||
| Nevada DOT | X | |||
| Pennsylvania DOT | X | |||
| Rhode Island DOT | X | |||
| South Carolina DOT | X | |||
| South Dakota DOT | X | |||
| Tennessee DOT | X | |||
| Texas DOT | X | |||
| Wisconsin DOT | X | |||
| Wyoming DOT | X | |||
Table F6 shows additional comments on the stand-alone database used by the agencies. The project team received data for just three of the respondents that claimed to have a stand-alone BrTS database for their state (Michigan, Pennsylvania, and Texas); however, the data retrieved from those states came from the state-maintained crash databases, and not from stand-alone BrTS databases. This reaffirms that different practices may exist within the same agency when it comes to housing BrTS data, especially when you consider that the people who responded to the data request and the survey are from different units of the same agencies.
The AASHTOWare™ Bridge Management (BrM) software was mentioned three times, which might indicate a common practice by agencies to record and store bridge damage information. The respondent from the Indiana DOT referred to the DamageWise program which helps record damages to property by motor vehicle crashes, as well as the associated costs. This process could be considered for further investigation as a possible best practice that can be adopted by other agencies.
Table F6. Comments on the Stand-alone Database Used by Agencies for BrTS.
| Delaware DOT | We obtain the data from police agencies. They are required to make positive contact with DelDOT’s TMC and provide copies of police reports of incidents. Not sure as to what software is used - it just might be tracked using excel spreadsheets. We can also run a query in our bridge database (AASHTOWare BrM) to pull any bridge that has a Damage defect element. (from 1st respondent) |
| Indiana Criminal Justice Institute | ARIES. Crash Reporting Database, police reports taken by officers. This database is used for crash records, fatality statistics, and overall data requests regarding collisions, injuries, etc. for the state of Indiana. |
| Indiana DOT | Indiana has a statewide crash data collection system called DamageWise. In 2011 INDOT deployed DamageWise, a statewide crash damage tagging, management and invoicing system that associates crash-damaged infrastructure to a police crash report and seeks reimbursement. As a result of the INDOT DamageWise program, reimbursement for repairing infrastructure damaged by motor vehicles doubled to more than $4 million per year and continues to increase. INDOT also tabulates and monitors performance measures on a quarterly basis to evaluate the cost recovery process at the district and state level. These performance measures include annualized billings, elapsed time between crash date and the invoice date and the average percent of invoiced amount collected. |
| Michigan DOT | The bridge inspector(s) in the regional areas evaluate the bridge hits and submit a copy of the inspection report to central office. The central office then enters hits in an excel spread sheet. It used for tracking hits on bridges. |
| Nebraska DOT | Special Inspection Reports submitted via BrM stored in a SQL database for larger strikes. Smaller strikes, typically of bridge rails are often not reported. |
| New York State DOT | Winchell Auyeung, Monthly Reporting on Bridge Hits. Access database updated for a Monthly Report to executives. |
| Pennsylvania DOT | Bridge Problem Report Database and historic spreadsheet bridge and tunnel impact data |
| Rhode Island DOT | I use AASHTOWare BrM. when we have a bridge strike, we do a “Special-Accident Damage” inspection |
| South Dakota DOT | The bridge office maintains a spreadsheet (over height hit repairs cost summary) to track repair costs and to help quantify the number of times a steel girder may have been heat straightened. |
| Texas DOT | Texas DOT has a policy for reporting over height bridge impacts to Texas DOT Bridge Division. Bridge Division maintains a list of bridge strikes reported by districts. |
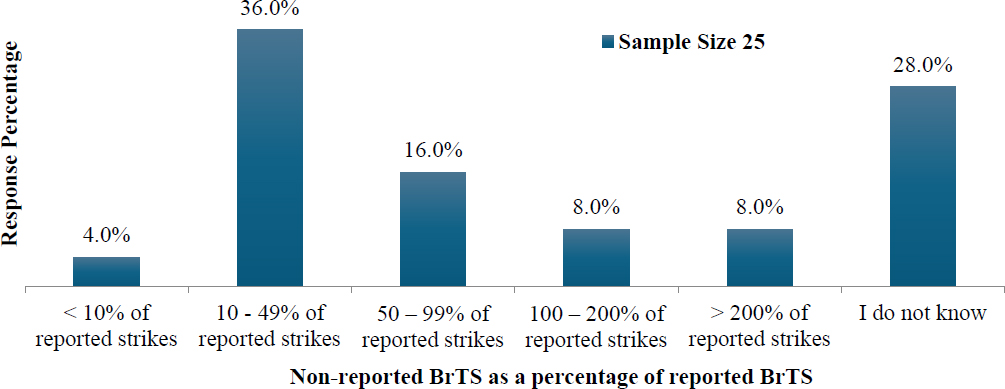
The respondents were also asked to estimate the percentage of non-reported BrTS incidents. Figure F2 shows a histogram of their responses in different percentage categories. The most prevalent answer was that 10-49% of BrTS crashes are underreported. “I do not know” was the next most frequent answer. Despite the large disparity, 18 out of 25 (72%) agreed that there is some level of underreporting.
State agencies are notified of BrTS incidents through a variety of methods. Respondents were asked to choose the options their state uses and estimate the percentage of BrTS that are reported using each method. Figure F3 shows the large disparities of how a BrTS was notified or reported among agencies, even within the same agency such as California and Delaware. This might cause concern about their notification methods, but it could also be explained by procedural differences in discrete operational areas (e.g., tollways versus all other roadways). Table F7 provides further details of “other ways” by agencies. The most common practices beyond the provided options are “TMC” (e.g., live camera) and inspection/maintenance personnel (e.g., routine or special inspections/maintenance). Respondents from New York and Wyoming said social media has been used to gain crowdsourced data, and Delaware indicated they receive crash reports from citizens/legislators via social media.
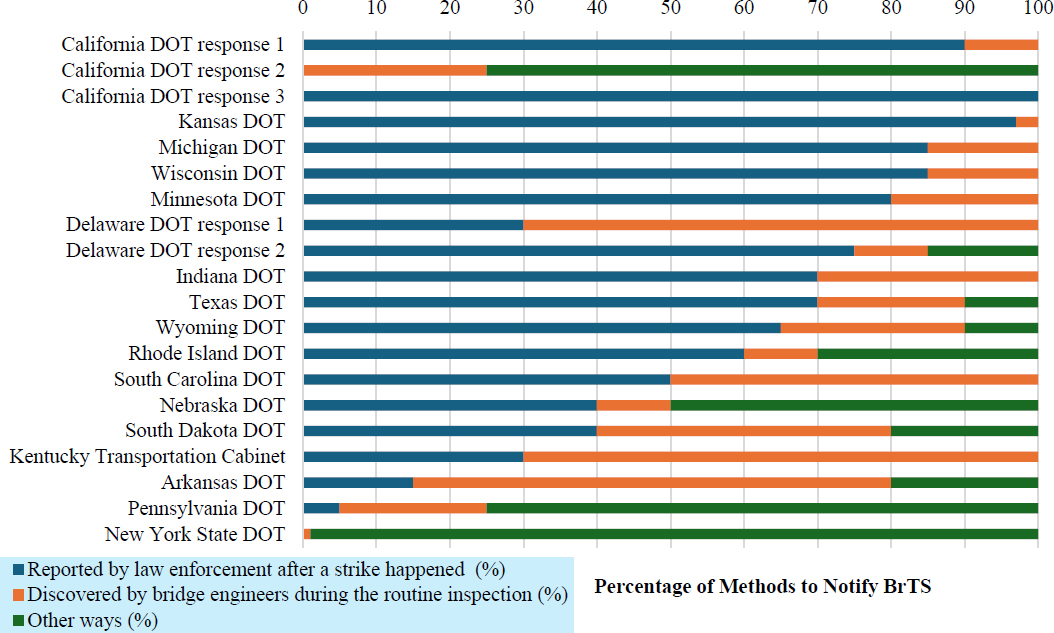
Table F7. Other Methods to Notify BrTS Used by Agencies.
| Arkansas DOT | Word of mouth reaches the district inspectors |
| California DOT | We are usually notified by District Maintenance crews. Caltrans is divided into 12 districts. The districts own and operate all highway infrastructure within their respective districts. My office performs routine bridge inspections, as well as any emergency situations such as BrTS. My office does not inspect tunnels. (from 2nd respondent) |
| Delaware DOT | Citizens or Legislators contacting DelDOT; DelDOT maintenance personnel notifying our Transportation Management Center (from 2nd respondent) |
| Nebraska DOT | State Maintenance forces |
| New York State DOT | Reported by Statewide Transportation Information and Coordination Center, TMC, news/media outlets |
| Pennsylvania DOT | PennDOT Maintenance Forces or Live Traffic Camera / TMC notifications |
| Rhode Island DOT | Traffic Monitoring Center |
| South Dakota DOT | Vehicle disabled after bridge strike. |
| Texas DOT | BrTS are identified through DMVs reporting |
| Wyoming DOT | Social Media |
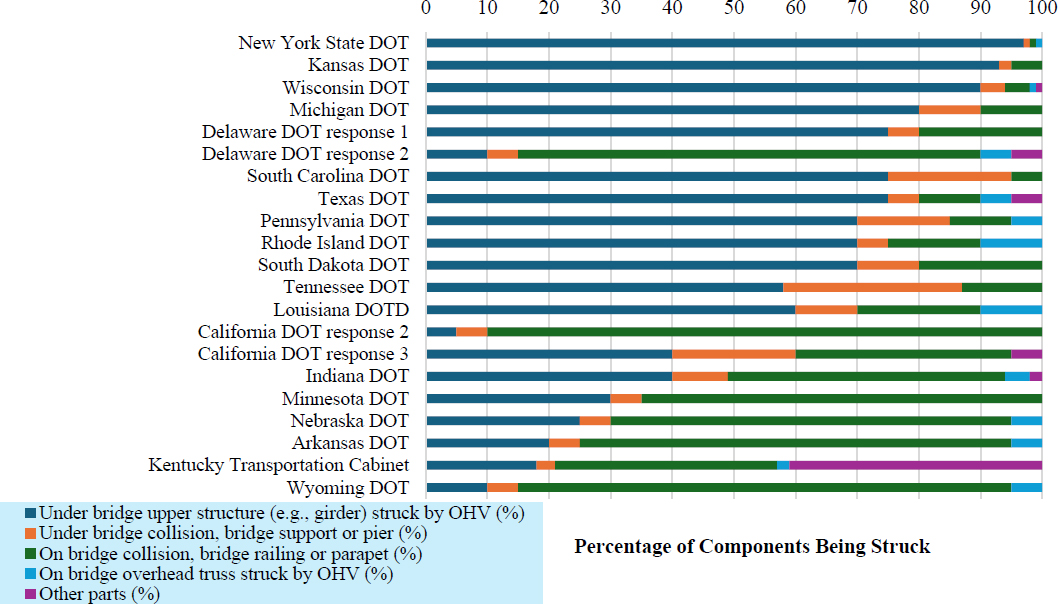
Respondents were asked to provide information on which specific parts/components of a bridge are hit during a BrTS. They were asked to give estimates for each option so that the total of all options equaled 100%. Figure F4 shows the percentage breakdown of bridge components struck due to BrTS. “Under bridge upper structure” has the highest mean value of percentage estimation for collision by OHVs, followed by “On bridge railing or parapet”.
Respondents were then asked to choose damage types based on their observations and to estimate the percentage amount for each option. As shown in Figure F5, it is evident that “mostly scrapes” is the most
common damage type, followed by “structural damage”, “partial damage”, and finally, “catastrophic damage”. However, it is apparent that several states still consider structural damage to be a significant issue.
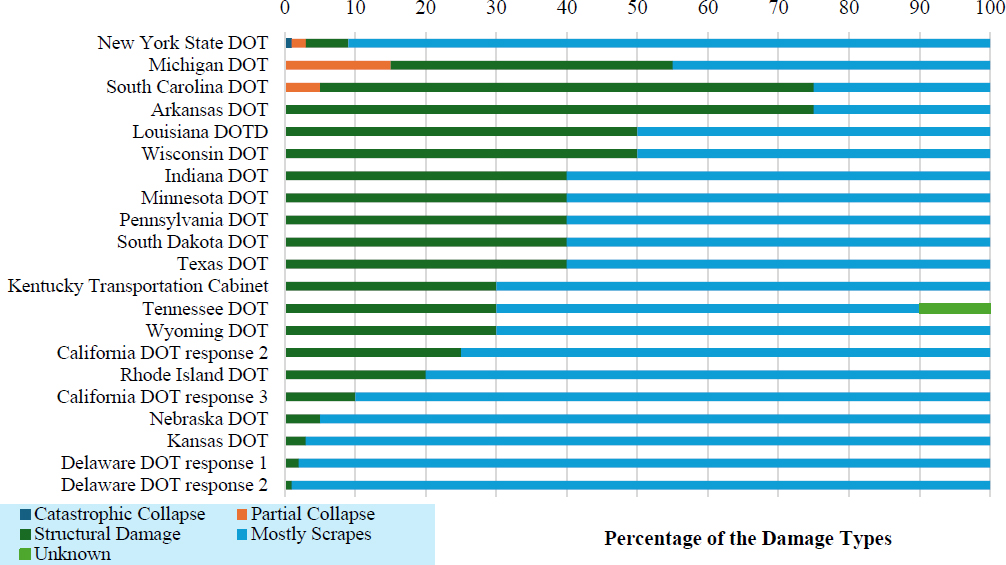
Table F8 shows the responses from agency officials on whether their agencies record repair costs for BrTS damage caused by motor vehicle strikes. It is evident that most agencies (13 out of 19, or 68%) do not keep such information. Even if an agency does keep repair cost records, the information can be difficult to find.
Table F8. Repair Cost Record Keeping for BrTS Damages.
| Agency | Yes, repair cost is part of the bridge/tunnel inspection database but is difficult to find (e.g., in comments or special notes). | Yes, repair cost is part of the bridge/tunnel inspection database and is easy to find. | No, we do not keep such information because bridge projects can be LET at different times, and insurance claims are not always available. | |
| Arkansas DOT | X | |||
| California DOT | X (from 2nd and 3rd respondents) | |||
| Delaware DOT | X (from 2nd respondent) | X (from 1st respondent) | ||
| Indiana Criminal Justice Institute | X | |||
| Indiana DOT | X | |||
| Kansas DOT | X | |||
| Kentucky Transportation Cabinet | X | |||
| Louisiana DOTD | X | |||
| Michigan DOT | X | |||
| Minnesota DOT | X | |||
| Nebraska DOT | X | |||
| New York State DOT | X | |||
| Pennsylvania DOT | X | |||
| Rhode Island DOT | X | |||
| South Carolina DOT | X | |||
| South Dakota DOT | X | |||
| Tennessee DOT | X | |||
| Wisconsin DOT | X | |||
| Wyoming DOT | X | |||
Figure F6 shows the responses related to the costs resulting from BrTS. The average percentage value of costs paid by those with insurance (23.68%) is the most, followed by costs for bridge owners (14.80%), and finally, carriers without insurance (1.52%).
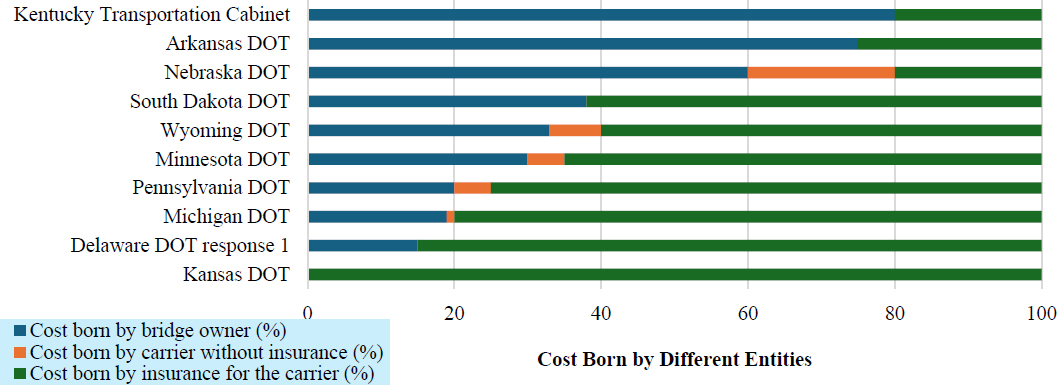
Several agencies provided additional comments on this question, which can be seen in Table F9. Several states estimated that the bridge owner bears the largest portion of the cost because, in most cases of BrTS (mostly the non-reportable cases), the party that caused the damage cannot be identified. The additional comments also reflect the previous finding that routine inspection/maintenance might help identify non-reported BrTS.
Table F9. Additional Comments on Costs Resulting From BrTS.
| Minnesota DOT | This has to do with the percentage of non-reported bridge hits and their severity. The cost is usually born by MnDOT when an impact damage is discovered during a routine inspection and repair is required/recommended, or when a bridge hit is reported but MnDOT was not able to track-down the carrier. |
| Wyoming DOT | These percentages represent the total claims for WYDOT regarding bridge/tunnel damage that have either been paid or not billed due to no responsible party found. These totals do not include claims that are still opened and being recovered or claims that are not closed yet with costs still accumulating. |
| Delaware DOT | These percentages are just for the bridges that get damaged, and repairs are needed. (from 1st respondent) |
| Texas DOT | Texas DOT attempts to recover damages when the responsible party is known. Recovering costs can be a long process and may take over a year. |
| Arkansas DOT | We can heat straighten by ARDOT repair crews. We only charge insurance companies, and we have not charged uninsured motorist. |
| Indiana DOT | The managers of the DamageWise system would likely have the best records of information for questions 10 and 11. |
| Nebraska DOT | This info is based on engineering judgement. Records are difficult to obtain. |
Figure F7 shows the percentage breakdown of traffic impacts resulting from BrTS. One to 6 hours of impact was the most frequent response with a mean value of 28.84%. The next most frequent response was none, with a mean value of 22.28%. The rest of the categories are ranked in order ‘>3days’ (5.56%), ‘7-24 hours’ (4.80%), and ‘1-3 days’ (2.52%). Table 10 shows any additional comments on this question, which detail how the options and percentages were chosen or calculated.
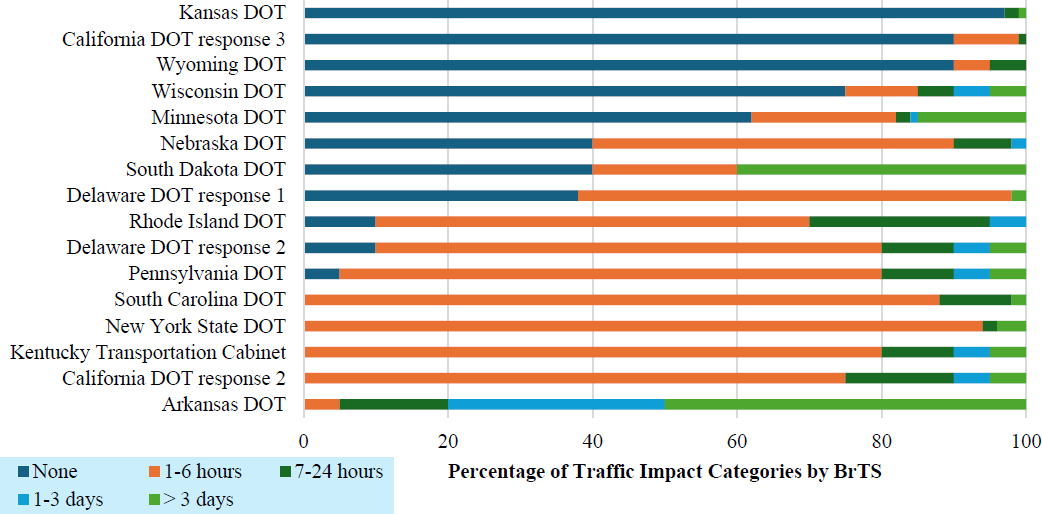
Table F10: Additional Comments on the Percentage of Traffic Impacts Resulting from BrTS.
| Arkansas DOT | Repairing usually requires lane closures. I am not sure if this question is just in regard to removing wreckage or repairs. I showed repairs as well. |
| Delaware DOT | These percentages are just for the bridge strikes that are reported by police. (from 1st respondent) |
| Indiana DOT | Estimating most are 24 hours or less. INDOT has had a few closures lasting more than 3 days. |
| Michigan DOT | For a majority of the bridge hits, we do not have a record for the traffic impact because we do not know that the bridge hit occurred until the next routine inspection. For most, if not all, of the reported bridge hits, there is at least a 7-24 hour impact on traffic. |
| Minnesota DOT | None: Mostly for scrapes and minor impacts. 1-6 hours: Strikes that required an arms-reach inspection with no further temporary traffic closures. 7-24 hours and 1-3 days: Strikes that required an arms-reach inspection followed by either a second round of in-depth inspection (e.g., NDE testing: magnetic particle testing, etc.) or a short-term (temporary) traffic closure for safety considerations pending structural analysis. > 3 days: Strikes that required a temporary traffic closure due to public safety considerations. |
| Texas DOT | Many unreported scrapes will have no impact to traffic. Generally, traffic disruptions will be less than 6 hours. |
| Wisconsin DOT | These are estimates based on my observations. Traffic impacts would include shoulder/lane closures until inspection and cleanup can occur. |
| Wyoming DOT | Some bridge rail impacts due to inclement weather have resulted in extended closures. Typically results in none to very short closures. Have had several bridges with shoulder or lane closures. |
Bridge Strike Detection and Mitigation
Respondents were asked via three questions to share information regarding bridge strike detection and mitigation. Table F11 shows the percentage of responses for each option or cause as the primary reason of BrTS. Most agencies consider strikes to be caused by the driver, such as by the driver’s lack of knowledge of the height of their cargo, improperly loaded equipment, improper measurements of the height of the cargo, an unpermitted OHV, load shifts or equipment failures, etc. At the other end of the spectrum, causes that are considered to be less likely are mostly related to the mismanagement or ignorance of responsible authorities.
Table F11. Perception of the Primary Causes of BrTS.
| Perceived primary cause of BrTS | Very likely | Somewhat likely | Less likely | Total responses |
|---|---|---|---|---|
| Driver’s lack of knowledge of their height of cargo | 63.64% | 22.73% | 13.64% | 22 |
| Improperly loaded equipment on truck trailers (e.g., irregular-sized cargo such as construction vehicles, wind turbines, equipment extending above vehicles) | 59.09% | 40.91% | 0.00% | 22 |
| Driver did not properly measure the height of their cargo | 52.38% | 33.33% | 14.29% | 21 |
| Unpermitted OHV or other over-dimensional loads | 45.45% | 36.36% | 18.18% | 22 |
| Load shifts and/or equipment failures (e.g., bed raises, boom raises) during the transport | 45.45% | 22.73% | 31.82% | 22 |
| Driver’s lack of recognizing or understanding low bridge/tunnel warning signs | 28.57% | 33.33% | 38.10% | 21 |
| Driver’s reliance on non-commercial GPS that do not include height restriction information | 25.00% | 40.00% | 35.00% | 20 |
| Permitted drivers on unauthorized roadways (e.g., annual multi-trip permit holders who deviate from the permitted route) | 18.18% | 40.91% | 40.91% | 22 |
| Driver does not have a detour option or ignores the detour | 14.29% | 42.86% | 42.86% | 21 |
| Pilot or escort vehicle operator error | 13.64% | 22.73% | 63.64% | 22 |
| Inadequate warning at or near bridges/tunnels with low clearance | 9.09% | 9.09% | 81.82% | 22 |
| Use of an improper lane at a bridge (e.g., arch or truss) or tunnel where vertical clearances vary by lane | 4.76% | 28.57% | 66.67% | 21 |
| Change in the pavement elevation due to weather conditions such as snow | 4.55% | 9.09% | 86.36% | 22 |
| Change in the pavement elevation due to pavement projects (e.g., resurfacing) | 4.55% | 13.64% | 81.82% | 22 |
| Other (please specify): | 0.00% | 0.00% | 100.00% | 4 |
Respondents used the provided table to indicate the measures that are currently being used and those they plan to use in future to prevent and mitigate BrTS. Table F12 summarizes their responses. Both respondents from the Delaware DOT mentioned the same unlisted measure, a vertical clearance warning device (i.e., “Clankers”17), which has been used at on-bridge areas with a vertical clearance of 8.75′ and will be used to other frequently hit bridges. Another unlisted method mentioned by the respondent from the Texas DOT was the Transportation Data Exchange (TDx) Vertical Clearance dataset. This uniform dataset is made available by states throughout the country to routing companies.
___________________
17The “Clankers” consist of orange rubber buoys that hang from chains from mast arm type of traffic signal support structure. See article: https://www.delawarepublic.org/delaware-headlines/2022-07-14/deldot-installs-new-system-to-reduce-crashes-oncasho-mill-road
Table F12. Measures Used Now vs. Planned in Future to Prevent and Mitigate BrTS.
| Measures to prevent and mitigate BrTS | Used Now (Number of responses) | Planned in the Future (Number of responses) |
|---|---|---|
| Online Maps (e.g., up-to-date height or size restriction, interactive maps through DOT website such as 511) | 76.19% (16) | 4.76% (1) |
| Static Warning Signage | 76.19% (16) | 0.00% (0) |
| Bridge Markings | 76.19% (16) | 0.00% (0) |
| Route Surveys | 66.67% (14) | 0.00% (0) |
| Increased Structure Vertical Clearance | 57.14% (12) | 4.76% (1) |
| Axle Load Restrictions | 52.38% (11) | 0.00% (0) |
| VMS | 52.38% (11) | 4.76% (1) |
| Law Enforcement Escorts | 47.62% (10) | 0.00% (0) |
| Pre-routed Maps | 47.62% (10) | 4.76% (1) |
| Pre-trip Plans | 33.33% (7) | 4.76% (1) |
| Lower the Pavement | 33.33% (7) | 9.52% (2) |
| Media Campaigns | 28.57% (6) | 0.00% (0) |
| Good Practice Manuals | 28.57% (6) | 0.00% (0) |
| Heavy Vehicle/Commercial Motor Vehicle Goods License Test | 28.57% (6) | 0.00% (0) |
| Better Driver Awareness Education | 23.81% (5) | 4.76% (1) |
| Pilot/Escort Vehicle Operator Certification | 23.81% (5) | 4.76% (1) |
| Increasing Fines | 19.05% (4) | 0.00% (0) |
| Increasing Restrictions on Vehicle Dimensions | 19.05% (4) | 0.00% (0) |
| Rumble Strips | 19.05% (4) | 4.76% (1) |
| Road Narrowing Techniques | 9.52% (2) | 4.76% (1) |
| Speed Bumps | 9.52% (2) | 4.76% (1) |
| Crash Sacrificial Beams | 9.52% (2) | 4.76% (1) |
| Overhead Portal Frames | 9.52% (2) | 4.76% (1) |
| Energy-Absorbing Devices | 9.52% (2) | 4.76% (1) |
Similarly, respondents were asked to indicate measures for BrTS detection. Table F13 shows the 15 survey responses, for which no additional responses were received.
Table F13. Measures Used Now vs. Planned to Detect BrTS.
| Measures to detect BrTS | Used Now (number of responses) | Planned in the Future (number of responses) |
|---|---|---|
| Beacons, Flashing Beacons, or Lights | 80.00% (12) | 13.33% (2) |
| Laser Vision (e.g., vehicle dimension, esp. height) | 40.00% (6) | 13.33% (2) |
| Hanging Chains/Bells | 33.33% (5) | 6.67% (1) |
| (CCTV) Cameras and Computer Vision | 33.33% (5) | 13.33% (2) |
| Radar Systems (e.g., vehicle dimension, esp. height) | 13.33% (2) | 6.67% (1) |
| Infrared Light Technology (e.g., vehicle dimension, esp. height) | 13.33% (2) | 6.67% (1) |
| Accelerometers (e.g., vibration, displacement of structure due to an impact) | 6.67% (1) | 6.67% (1) |
| Piezoelectric Sensors (e.g., vibration, displacement of structure due to an impact) | 0.00% (0) | 6.67% (1) |
Over-height Regulations, Practices, and Guidelines
Respondents were asked several questions related to OHV regulations, practices, and guidelines in their state. The first question about the state’s statutory minimum vertical clearance for bridges/tunnels shows that states have quite different practices. Though 14′6′′ and 16′6′′ are mentioned more frequently, it appears as though they are used in certain situations, such as for different road functionalities and different structure designs. Inconsistencies were observed for Indiana and Delaware. Table 14 shows the detailed responses from all respondents.
Table F14. Responses on Each State’s Statutory Minimum Vertical Clearance for Bridges/Tunnels.
| Agency | What is your state’s statutory minimum vertical clearance for bridge and tunnel? | References | |
|---|---|---|---|
| Arkansas DOT | 15′ or less | Not specify | |
| California DOT (from 3rd respondent) | 16′6″ | California Highway Design Manual | |
| Delaware DOT | Response 1 | 14′-6" | DelDOT’s Traffic Manual |
| Response 2 | None | ||
| Indiana Criminal Justice Institute | 16′ | Not specify | |
| Indiana DOT | 14′6″ | Indiana Code (IAC) § 9-20-3-3, | |
| Kansas DOT | No statutorily legal minimum, but KDOT Bridge Design Manual provides minimum vertical clearance for new design based on underpass location. | KDOT Bridge Design Manual | |
| Kentucky Transportation Cabinet | 14′6″ | Division of Traffic Operations Manual | |
| Louisiana DOTD | 16′6″ | Not specify | |
| Michigan DOT | Vary based on functional classification of highway and type of facility being carried overhead | Reference Bridge Design Manual Section 7.01.08 (https://mdotjboss.state.mi.us/stdplan/englishbridgemanual.htm) | |
| Minnesota DOT | For Rural-Suburban Design: Highways under Roadway or Railroad Bridges (16′4″) | Minnesota Administrative Rules, Section 8820.9956 | |
| Agency | What is your state’s statutory minimum vertical clearance for bridge and tunnel? | References | |
|---|---|---|---|
| Minnesota DOT | Highway under Pedestrian Bridge (17′4″) Railroad under Roadway Bridge (22′) For Urban Design: Highways under Roadway or Railroad Bridges (14′6″) Highway under Pedestrian Bridge (15′6″) Railroad under Roadway Bridge (22″) | Minimum Vertical Clearances for Underpasses. | |
| Nebraska DOT | 14′6″ (collectors); 16′ (others) | Not specify | |
| New York State DOT | 14′-0″ | NYS Bridge Manual 2.3.1. | |
| Pennsylvania DOT | - | PennDOT Publication 238 (Bridge Safety Inspection Manual) | |
| Rhode Island DOT |
Freeway or Expressway Under 16′-3″ over the entire roadway width Arterial Under 16′-3″ over the entire roadway width Local or Collector Under 14′-6″ over the entire roadway width Highway Under Sign or Pedestrian Bridge 17′-3″ over the entire roadway width
| Not specify | |
| South Carolina DOT | Don’t know of any state minimum | ||
| South Dakota DOT | 17′ for new bridges | Not specify | |
| Texas DOT | Vary based on functional classification of highway and type of facility being carried overhead | Texas DOT’s Roadway Design Manual (Table 2-11 of Chapter 2, Section 6): http://onlinemanuals.txdot.gov/txdotmanuals/rdw/rdw.pdf | |
| Wisconsin DOT | Design vertical clearance depends on the route. | FDM links: https://wisconsindot.gov/rdwy/fdm/fd-11-35.pdf https://wisconsindot.gov/rdwy/fdm/fd-11-35-att.pdf#fd11-35a1.8 https://wisconsindot.gov/rdwy/fdm/fd-11-35-att.pdf#fd11-35a1.9 https://wisconsindot.gov/rdwy/fdm/fd-11-10.pdf#fd11-10-5.4.3 | |
| Wyoming DOT | 16′ + 6″ for additional overlays under interstates and 14′ + 6″ for non-NHS routes | Not specify | |
Regarding the statutory maximum height limit for vehicles and cargo, 13′6″ and 14′ are the most common practices according to the results (Figure F8 below).
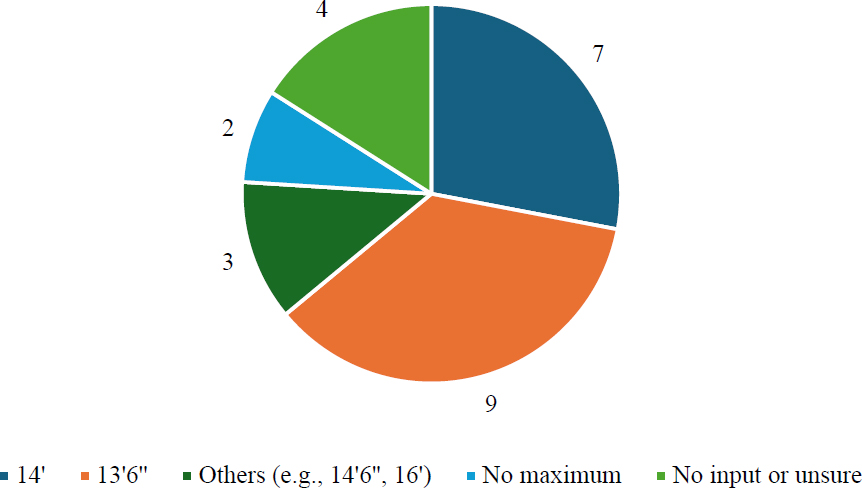
Responses from South Carolina and Wisconsin show that they don’t have a statutory maximum height limit for vehicles and cargo. However, in Wisconsin any vehicle over 13′-6″ requires a permit. Zero inconsistencies were observed among the responses from California, Delaware, and Indiana. Table F15 shows the detailed responses from all respondents.
Table F15. Responses to Each State’s Statutory Maximum Height Limit for Vehicles/Cargo.
| Agency | What is the statutory maximum height limit for vehicles and cargo? | References |
|---|---|---|
| Arkansas DOT | 14′ | https://www.arkleg.state.ar.us/Calendars/Attachment?committee=040&agenda=5095&file=D.1.a+ARDOT+SHC+Amendments+to+the+Permit+Rules+for+the+Movement+of+Oversized+Vehicles+on+the+State+Highway+System+and+Act+871+of+2021.pdf |
| California DOT | 14′ (from 2nd and 3rd respondents) | California Vehicle Code:https://dot.ca.gov/programs/traffic-operations/legal-truck-access/height#:~:text=The%20CVC%20Height%20Section%20is,of%2014%20feet%2C%203%20inches. |
| Delaware DOT | 13′6″(from both respondents) | Del. C. §4502(b)(2) https://delcode.delaware.gov/title21/c045/index.html#4502 |
| Indiana Criminal Justice Institute | 13′6″ | Not specify |
| Indiana DOT | 13′6″ | Indiana Administrative Code 9-20-3-3 Sec 3(a) |
| Agency | What is the statutory maximum height limit for vehicles and cargo? | References |
|---|---|---|
| Kansas DOT | 14′ except cylindrical hay bales (14′6″) | K.S.A. 8-1904 |
| Kentucky Transportation Cabinet | 16′ unless it’s an over-dimensional permit. | Not specify |
| Louisiana DOTD | Unsure | |
| Michigan DOT | 13′6″ for unpermitted vehicles | |
| Minnesota DOT | 13′6″ | 2022 Minnesota Statutes, Section 169.81 Height and Length Limitations, Subdivision 1. |
| Nebraska DOT | 14′6″ for unpermitted vehicles; 16′ for permitted vehicles | |
| New York State DOT | 13′6″ | Vehicle Traffic law Title 3, Article 10, Section 385 |
| Pennsylvania DOT | 13′6″ | Pennsylvania State Statute §4961 of the Vehicle Code |
| Rhode Island DOT |
Freeway or Expressway Under 16’-3” over the entire roadway width Arterial Under 16’-3” over the entire roadway width Local or Collector Under 14’-6” over the entire roadway width2 Highway Under Sign or Pedestrian Bridge 17’-3” over the entire roadway width
| Not specify |
| South Carolina DOT | There is no state maximum. | |
| South Dakota DOT | 14′, except baled hay can be 15′ | SD codified law 32-22-3 |
| Tennessee DOT | 13’-6” for unpermitted vehicles | TCA 55-7 |
| Texas DOT | 14′ | Sections 621.207 and 621.504 of Chapter 621 of the Texas Transportation Code https://www.txdmv.gov/motor-carriers/oversize-overweight-permits/texas-size-weight-limits |
| Wisconsin DOT | There is no maximum, but the highest possible design vertical clearance for designated OSOW routes is 20′-0″, so it would be unrealistic to have anything higher except for perhaps very short distances. Any height over 13′-6″ requires a permit. Anything over 16′-0″ requires a single trip permit which includes route analysis. | https://wisconsindot.gov/Pages/dmv/com-drv-vehs/mtr-car-trkr/osow-permit-req.aspx |
| Wyoming DOT | 14′ | Wyoming State Statute 31-18-802(a)(ii) |
In terms of state’s policy on posting bridge and tunnel clearances, it can be seen from Figure F9 that the most common practice is to sign for 3" less than the actual measured clearance for the posted clearance sign. Inconsistent answers are observed from Delaware and California according to Table F16 below.
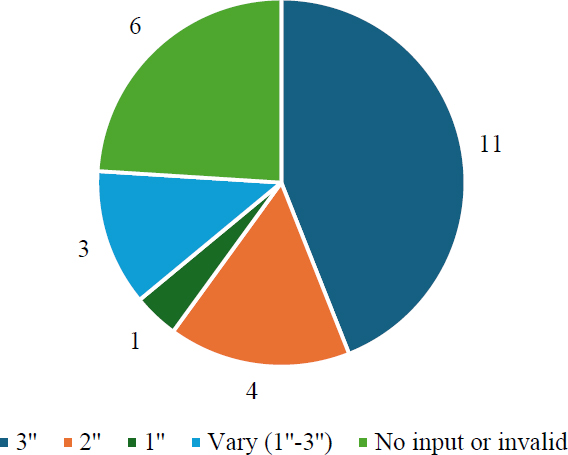
Table F16. Summary of State’s Policy on Posting Bridge/Tunnel Clearances.
| Agency | According to your state’s policy on posting bridge and tunnel clearances: By how many inches do these signs under-report the actual underclearance? | References | |
|---|---|---|---|
| Delaware DOT | Response 1 | 3″ | DE-MUTCD, Section 2C.27 |
| Response 2 | 1″ (in areas that experience changes in temperature causing frost action, < 3″) | Not specify | |
| Indiana DOT | 1″ (in areas that experience changes in temperature causing frost action, < 3″) | Indiana MUTCD Section 2C.27 Low Clearance Signs (W12-2 and W12-2a) | |
| Minnesota DOT | 1″ (in areas that experience changes in temperature causing frost action, < 3″) | MN MUTCD (January 2023), Section 2C.27 | |
| Rhode Island DOT | 3″ | Not specify | |
| South Dakota DOT | 3″ | Not specify | |
| Arkansas DOT | 3″ | Not specify | |
| California DOT | Response 2 | 1″ | Not specify |
| Response 3 | 3″ | Not specify | |
| Kansas DOT | 3″ | Not specify | |
| Kentucky Transportation Cabinet | 3″ | Not specify | |
| Nebraska DOT | 3″ | No policy | |
| New York State DOT | 12″ | - | |
| Pennsylvania DOT | 3″ | PennDOT Publication 238 states | |
| Texas DOT | 3″ | Chapter 6 of the Texas DOT Sign Guidelines and Applications Manual http://onlinemanuals.txdot.gov/txdotmanuals/smk/vertical_clearance.htm | |
| Wisconsin DOT | 3″ | Not specify | |
| Michigan DOT | 2″ | Not specify | |
| South Carolina DOT | 2″ | Not specify | |
| Tennessee DOT | 2″ | Not specify | |
| Wyoming DOT | 2″; The recommended posting is typically 2 inches less than the actual underclearance for new signs. However, new signs are not recommended unless the posted vertical clearance exceeds the actual measured clearance. | Not specify | |
The next question was asked to retrieve relevant state design standards regarding where to post underclearance signs. The MUTCD is generally followed with modifications/variations depending on the state. The survey responses show that states generally post signs at multiple locations, depending on the specific situation, making it difficult to summarize such information in a standardized way. Table F17 provides a summary of all valid responses.
Table F17. Summary of State’s Policy on Posting Signs for Bridge/Tunnel Underclearance.
| Agency | What is your state’s policy |
|---|---|
| California DOT | Advanced warning signs are required as well as signs posted on the structure. California MUTCD (from the 2nd respondent); 1/2 mile before the structure and also at the structure portal (from the 3rd respondent) |
| Delaware DOT | Delaware MUTCD (DE-MUTCD), Section 2C.2718 (from both respondents) |
| Indiana DOT | From Indiana MUTCD Section 2C.27 Low Clearance Signs (W12-2 and W12-2a) Where the clearance is less than the legal maximum vehicle height, the W12-2 sign with a supplemental distance plaque should be placed at the nearest intersecting road or wide point in the road at which a vehicle can detour or turn around. In the case of an arch or other structure under which the clearance varies greatly, two or more signs should be used as necessary on the structure itself to give information as to the clearances over the entire roadway. Option: The Low Clearance sign may be installed on or in advance of the structure. If a sign is placed on the structure, it may be a rectangular shape (W12-2a) with the appropriate legend. |
| Kansas DOT | Highway Sign Manual pg. C7-3, For vertical underclearance. Sign is on vertical surface of the structure over the roadway. |
| Kentucky Transportation Cabinet | On the structure above the low clearance area. |
| Michigan DOT19 | Reference Bridge Design Manual Section 7.01.08. (https://mdotjboss.state.mi.us/stdplan/englishbridgemanual.htm) |
| Minnesota DOT | Where the clearance is less than the legal maximum vehicle height, the Low Clearance sign with a supplemental distance plaque should be placed at the nearest intersecting road or wide point in the road at which a vehicle can detour or turn around. Reference: MN MUTCD (January 2023), Section 2C.27 |
| Nebraska DOT | MUTCD is followed. |
| New York State DOT | MUTCD and the NYS Supplement to the MUTCD and the NYS Vehicle and Traffic Law Section 1621 (c). |
| Pennsylvania DOT | PennDOT Publication 238 states “Accordingly, all bridges with actual clearances under 14’-6” shall be posted with advance vertical clearance signs (W12-2). In addition, the W12-2A Clearance sign should be placed on the structure at the critical clearance whenever possible. If signs are not in place or are incorrect, it should be noted in the inspection report as a critical deficiency. The actual vertical clearance is to be rounded down to the next lower whole inch and recorded in BMS2 Items 6C20 and 6C21.” |
___________________
18“03 Where the clearance is less than the legal maximum vehicle height, the W12-2 sign with a supplemental distance plaque should be placed at the nearest intersecting road or wide point in the road at which a vehicle can detour or turn around.”
19The placement of a bridge clearance sign can be found in MDOT Traffic and Safety Sign Design, Placement, and Application Guidelines, Table 21: “Bridge connection with left edge of sign over left edge of right lane. - If a guide sign is located on the bridge over the right lane, the Bridge Clearance Sign should be located left of the guide sign; The Bridge Clearance Sign should not be placed over a lane line; When 2 or more bridges are spaced at intervals of 300’ or less, place the Bridge Clearance Sign only on the first structure. - Use the lowest clearance to determine the dimension shown on the sign.”
| Agency | What is your state’s policy |
|---|---|
| South Carolina DOT | On the structure centered over the roadway per the SCDOT Supplemental MUTCD |
| South Dakota DOT | Near structure and at first intersection before bridge for each direction of travel. |
| Texas DOT | Per Texas DOT’s Sign Guidelines and Applications Manual The signed clearance (the clearance shown on the sign) should be 3 inches less than the actual measured clearance. This establishes a clearance buffer to allow for future surface overlays. The following signing requirements are summarized in Figure 6-3. Structures Not Requiring Signing. Overhead obstructions with minimum clearances exceeding 20 feet do not require any clearance signs. The clearance signs should not be applied to overhead sign support structures. Structures Requiring Signing. All overhead obstructions, except overhead sign structures, that have a minimum measured clearance of 20 feet or less require both advance CLEARANCE (W12-2) and structure mounted ( ) FT ( ) IN clearance (W12-2a) signs, unless the immediately preceding structure is lower and no access (entrance or exit ramps, driveways, or intersections) for traffic exists between the structures. When the advanced CLEARANCE sign legend is less than 14 feet, 6 inches, the LOW CLEARANCE plaque (W12-2TP) should be included on the advance sign assembly. The W12-2 sign must not be located between a MERGE sign and the entrance ramp or between an EXIT DIRECTION sign and the exit ramp. See the TMUTCD for more sign placement information. |
| Wisconsin DOT | On or in advance of the structure. If less than 13′-6″, an additional sign at nearest intersection Section 2C.27, Wisconsin MUTCD: https://wisconsindot.gov/dtsdManuals/traffic-ops/manuals-and-standards/wmutcd/mutcd-ch02c.pdf |
| Wyoming DOT | In accordance with WYDOT’s signing manual, a bridge clearance sign (W12-2) is used for structures or overhead objects with 19 feet of vertical clearance or less over the roadway. The bridge clearance sign is placed 250 feet past the exit gore. In instances where ramps are not present, bridge clearance signs are placed 750 feet in advance of the structure. When vertical clearance is 16 feet or lower, two signs will be required; one sign is placed 250 feet past the exit gore and a second sign is placed across from the advanced exit warning sign in the median. In the instance of a structure crossing the roadway with no ramps and a clearance of 16 feet or lower two signs will be required, placed directly across from each other 1000 feet ahead of the hazard. Use a 48-inch diamond for Interstate Highways. For crossroads and non-interstate highway, use a 30-inch diamond; this may be increased due to speed limit. |
The majority of respondents indicated that state DOTs issue Oversize/Overweight (OS/OW) vehicle permits, at least for state highways. Indiana was the exception, where the Indiana Department of Revenue is in charge. Four states, Michigan, Minnesota, New York, and Wyoming denoted that local agencies (city or county) are responsible for issuing OS/OW vehicle permits for local routes. Table F18 shows the responses to the question about OS/OW issuing authority.
Table F18. Summary of Responses about the Permit Issuing Authority/Agency of a State.
| Agency | OS/OW Permit Issuing Agency |
|---|---|
| Arkansas DOT | State Policy/ARDOT |
| California DOT | Department of Transportation (from 3rd respondent) |
| Delaware DOT | DelDOT, Traffic Section / Bridge Management Section reviews all permits for trucks with total vehicle weight > 80,000lbs or at least one axle > 25,000lbs (from both respondents) |
| Indiana Criminal Justice Institute | Indiana Department of Revenue |
| Indiana DOT | Indiana Department of Revenue Motor Carrier Services |
| Kansas DOT | KDOT |
| Kentucky Transportation Cabinet | Department of Vehicle Enforcement |
| Michigan DOT | Michigan Department of Transportation issues OS/OW permits for state-owned routes. Local Agencies issue OS/OW permits for local agency owned routes. |
| Minnesota DOT | MnDOT: Freight and Commercial Vehicles Operations. Local Routes: County Office. |
| Nebraska DOT | The Operations Division - Permits Office (Nebraska DOT) |
| New York State DOT | NYSDOT, except in the New York City five boroughs, where NYCDOT has permit jurisdiction. |
| Pennsylvania DOT | PennDOT. Pennsylvania requires permits for over height, over width and overweight vehicle movement. |
| Rhode Island DOT | Rhode Island Department of Transportation |
| South Carolina DOT | SCDOT OSOW office |
| South Dakota DOT | Highway Patrol (South Dakota DOT) |
| Tennessee DOT | The Central Services division of the Department of Transportation |
| Texas DOT | Texas DMVs issues OS/OW permits |
| Wisconsin DOT | DMV (DMV is within Wisconsin DOT) |
| Wyoming DOT | Highway Patrol for all state highways (Wyoming DOT). City and County agencies permit their controlled routes. |
Table F19 shows the summary of responses regarding routing systems used by a state for permitted overheight vehicles. According to the responses, most (14) chose the option “Carrier may propose route and submit to state for approval” which is the highest category. Twelve respondents chose the option “State determines specific route for permitted vehicles”. The respondent from Wisconsin selected “Other”, and provides additional information regarding how that state system operates20.
___________________
20The state system performs for single-trip permits exceeding 16′ inches. Between 13′-6″ and 16′, multi-trip permits are allowed, and the carrier is required to review their route via an online list with all bridges having clearances below 16′-3″.
Table F19. Summary of State’s Routing System for Permitted OHV.
| Agency | State determines specific route for permitted vehicle | Carrier may propose route and submit to state for approval | Regional (multistate) permitting organization routes vehicle | Other |
|---|---|---|---|---|
| Arkansas DOT | X | |||
| California DOT | X (from 3rd respondent) | |||
| Delaware DOT | X (from both respondents) | |||
| Indiana DOT | X | |||
| Kansas DOT | X | X | ||
| Kentucky Transportation Cabinet | X | |||
| Louisiana DOTD | X | |||
| Michigan DOT | X | |||
| Minnesota DOT | X | X | ||
| Nebraska DOT | X | |||
| New York State DOT | X | X | ||
| Pennsylvania DOT | X | X | ||
| Rhode Island DOT | X | |||
| South Carolina DOT | X | |||
| South Dakota DOT | X | |||
| Tennessee DOT | X | |||
| Texas DOT | X | X | ||
| Wisconsin DOT | X | X | ||
| Wyoming DOT | X | X |
With regard to the question about routing analysis for OS/OW permits, 14 chose the option that an analysis was conducted by the permitting system before permits are granted. The remaining five agencies for Michigan, Kansas, Tennessee, Texas, and Wisconsin do not require a routing analysis.
Next, states were asked about the methods used to route trucks/OHVs. Table F20 shows that 11 chose “A commercial truck routing software prepared for the state” with more details in the comments. Five chose “An electronic map developed in house” and four mentioned other methods that are listed in Table 22. The Delaware DOT was the only state agency to choose multiple methods, mentioning that they are in the process of developing an in-house Over-Size and Over-Height Automated Routing Program as an enhancement to their electronic map that was also developed in house. ProMiles and Bently Superload were mentioned repeatedly as methods used for both existing and ongoing efforts for in-house automated permitting/routing systems. This aligns with the findings in the literature.
Table F20. Methods Used by States to Route Trucks/OHVs.
| Agency | An electronic map developed in house | A commercial truck routing software prepared for the state | Mapping software such as MapQuest, Google Maps, Street Atlas, Street and Trips | Other |
|---|---|---|---|---|
| Arkansas DOT | X | |||
| California DOT | X (from 3rd respondent) | |||
| Delaware DOT | X (from both respondents) | X (from 1st respondent) | ||
| Indiana DOT | X | |||
| Kansas DOT | X | |||
| Kentucky Transportation Cabinet | X | |||
| Michigan DOT | X | |||
| Minnesota DOT | X | |||
| Nebraska DOT | X | |||
| New York State DOT | X | |||
| Pennsylvania DOT | X | |||
| Rhode Island DOT | X | |||
| South Carolina DOT | X | |||
| South Dakota DOT | X | |||
| Tennessee DOT | X | |||
| Texas DOT | X | |||
| Wisconsin DOT | X | |||
| Wyoming DOT | X |
Table F21. Comments on Methods of Commercial Truck Routing Software.
| Agency | Commercial truck routing software prepared for the state |
|---|---|
| Indiana DOT | Automated Oversize/Overweight Permitting application developed specifically for Indiana by ProMiles |
| Kansas DOT | ProMiles |
| Kentucky Transportation Cabinet | Bentley Superload |
| Minnesota DOT | Commercial truck routing software (Bentley) which also uses a Bing maps platform for routing. |
| Nebraska DOT | Bentley Superload |
| New York State DOT | HOOCS – Software developed by ProMiles. |
| South Carolina DOT | We use Hexagon’s SafeHaul |
| South Dakota DOT | Superload - Bentley |
| Tennessee DOT | A state-specific application developed by Celtic using a commercial GIS roadway network with state provided clearance data |
| Texas DOT | Texas Permitting and Routing Optimization System; ProMiles Software Development Corp. |
| Wisconsin DOT | Bentley Superload |
Table F22. Comments on Other Methods Used by Agencies to Route Trucks/OHVs.
| Agency | Other methods |
|---|---|
| Delaware DOT | We are in the process of developing our own in-house Over Size and Over Height Automated Routing Program (from 1st respondent) |
| Michigan DOT | Michigan’s Transport Routing and Internet Permitting System (MiTRIP) incorporates the routing functions from Bentley Superload, however, permit agents encourage carriers to propose their own route for approval. |
| Pennsylvania DOT | PennDOT uses their own “Automated Permit Routing Analysis System” (APRAS). |
| Wyoming DOT | Currently, routes are checked manually. Bridge analysis application uses Google Maps. WYDOT is launching an automated permitting system being developed by ProMiles in 2023. |
When asked where a driver finds roadway restriction information along the route if a permit is not required, seven out of 16 respondents selected “Other” which indicates the challenges for a driver to easily find roadway restrictions information. One respondent said no source within the state provides such information. The survey results show that no agency provides lane-by-lane vertical clearance information, or at least such information is not publicly available. Although the literature review points out that the Indiana DOT collects, maintains, and reports lane-by-lane clearance measurements and other data on over 2,100 bridges throughout the state21, neither respondent from Indiana selected the “lane-by-lane vertical clearance” option. Table F23 presents the summary of responses, with additional comments in Table 24 if “Other” was selected. Most “Other” information includes additional comments regarding the state’s in-house online maps. Michigan and Texas noted that it does keep vertical clearance information for state-owned structures with overhead clearances less than 14 inches.
___________________
21INDOT Statewide Bridge Clearance Interactive Map https://www.arcgis.com/home/webmap/viewer.html?url=https%3A%2F%2Fmaps.indot.in.gov%2Farcgisro%2Frest%2Fservices%2FDOT%2FINDOT_RH_BRIDGE_CLEARANCE_Vendor%2FFeatureServer&source=sd
Table F23. Summary of Responses About Information Sharing by Agencies to Carriers/Drivers.
| Agency | DOT webpage such as 511 where lane-by-lane vertical clearance of a bridge/tunnel can be found on an interactive online map | DOT webpage such as 511 where only minimum vertical clearance of a bridge/tunnel can be found on an interactive online map | DOT webpage where lane-by-lane vertical clearance of a bridge/tunnel can be downloaded/printed | DOT webpage where only minimum vertical clearance of a bridge/tunnel can be downloaded/printed | We do not provide such information. | Other |
|---|---|---|---|---|---|---|
| Arkansas DOT | X | |||||
| California DOT | X (3rd) | |||||
| Delaware DOT | X (1st) | X (2nd) | ||||
| Indiana DOT | X | |||||
| Kansas DOT | X | |||||
| Kentucky Transportatio n Cabinet | X | |||||
| Michigan DOT | X | |||||
| Minnesota DOT | X | |||||
| Nebraska DOT | X | |||||
| New York State DOT | X | X | ||||
| Pennsylvania DOT | X | |||||
| South Carolina DOT | X | |||||
| South Dakota DOT | X | |||||
| Texas DOT | X | |||||
| Wisconsin DOT | X | |||||
| Wyoming DOT | X |
Table F24. Text Response Corresponding to Other Way of Sharing Roadway Restrictions.
| Agency | Text response to specify other source |
|---|---|
| California DOT | I am not aware of any specific information being provided to the public (from 3rd respondent) |
| Delaware DOT | An electronic map developed in house (Map is constructed to display Delaware assets, bridge, signals, signs, load postings, etc.). This is a public facing map provided to industry on our Oversize/Overweight Permitting system. https://deldot.gov/osow/application/ (from 2nd respondent) |
| Michigan DOT | Michigan Truck Operators Map (published annually) contains a table of state-owned structures with overhead clearances less than 14’-0” (Maximum Legal Height is 13’-6”) at the time of publication |
| Nebraska DOT | Nebraska hosts a map of bridges that are posted for Legal Loads. Weight Restricted Bridge Map here: https://dot.nebraska.gov/business-center/bridge/inspection/ |
| South Carolina DOT | SCDOT does not provide but state transport police does provide on their website. |
| South Dakota DOT | http://sdtruckinfo.sd.gov there are links to it from the DOT website |
| Texas DOT | Listings of clearances 14’ and under are available on the TxDMV website. TxDMV also provides a link to a map of vertical clearances available on the Texas DOT website. |
Table F25 shows a summary of methods used to enforce OHV laws. Please note that one state can have multiple methods of enforcing OHV laws. According to the responses, the automated height measurement system at weigh stations is the only automated system used in OHV law enforcement by states who responded to the survey. The respondent from Delaware said that state does not specifically enforce OHV; however, if a truck is pulled over for speeding or another traffic violation, a complete CDL inspection is performed to confirm both driver and vehicle qualifications.
Table F25. Summary of Responses about OHV Law Enforcement.
| Agency | Roving patrols | Manual spot checks at weigh stations | Automated height measurement system at weigh stations | Automated height measurement system at truck loading terminals | Automated height measurement system on highways | Automated system with active warning signs | Other |
|---|---|---|---|---|---|---|---|
| Arkansas DOT | X | ||||||
| Delaware DOT | X (from 1st respondent) | X (from both) | |||||
| Kansas DOT | X | ||||||
| Kentucky Transportation Cabinet | X | ||||||
| Michigan DOT | X | X | X | ||||
| Minnesota DOT | X | X | X | ||||
| Nebraska DOT | X | ||||||
| New York State DOT | X | ||||||
| Pennsylvania DOT | X | X | |||||
| Rhode Island DOT | X | ||||||
| South Carolina DOT | X | X | |||||
| South Dakota DOT | X | X | |||||
| Wisconsin DOT | X | X | |||||
| Wyoming DOT | X | X | X |
When asked if the agency has access to OHV enforcement records, 10 answered that their state does not have access to the records, while eight responded that they do have access to the records.
Other Questions
Respondents indicated that state agencies have attempted to communicate with the trucking industry regarding BrTS issues. The results are shown in Table F26. The communication efforts can mostly be categorized as:
- Regional/national meetings, such as AASHTO, Mid-American Association of State Transportation Officials (MAASTO), and SC&RA symposiums.
- Partnerships with the trucking industry through advisory committees, regular meetings, and data sharing (e.g., TxDMV works with the Texas Trucking Association; SDDOT corresponds with and meets with the trucking association; PennDOT participates in data sharing events with the trucking industry; SCDOT upper management has regular meetings with the trucking industry.)
- In-house systems or online resources (e.g., permitting system, web map, website, official social media) that are capable of information distribution.
- CDL training.
Table F26. Responses about Communication with the Trucking Industry Regarding BrTS Issues.
| Agency | How do you communicate with trucking industry regarding the BrTS issues |
|---|---|
| Delaware DOT | OS/OW website has link to Bridge Restrictions Interactive Map that identifies bridges with load posting restrictions and vertical clearance ranges. (from 1st respondent); All restrictions, permanent or temporary, are public facing and posted on specific links on our Oversize/Overweight Permitting system. An email blast to all customers of our Oversize/Overweight Permitting system could be used if necessary. (from 2nd respondent) |
| Indiana DOT | INDOT Multimodal and Freight is responsible for communication with the trucking industry. |
| Kansas DOT | SC&RA, twice yearly MAASTO meetings |
| Michigan DOT | Motor carrier advisory board |
| Minnesota DOT | Bridge strikes are a regional concern often discussed/addressed in annual AASHTO conferences, MAASTO, and Specialized Carrier and Rigging Association Symposiums on behalf of all AASHTO regions. From what is gathered, it appears that very few bridge strikes in Minnesota are caused by oversize permitted vehicles. If they do occur, it’s because the hauler either misrepresented the permit height at application, or didn’t obtain an oversize permit, or the vehicle/load didn’t require a permit but was loaded/operated in such a way that it caused a bridge strike (e.g., the driver forgets to lower the dump box or reposition a boom on their backhoe). |
| Nebraska DOT | Online resources to assist with routing. CDL training covers these topics. |
| New York State DOT | NYSDOT Permits Office and Bridge Hit Task Force participation |
| Pennsylvania DOT | PennDOT participates in data sharing events with the trucking industry in PA and on advisory committee’s |
| South Carolina DOT | Upper management has regular meetings with the trucking industry to discuss various issues, including bridge hits |
| South Dakota DOT | correspondence and meetings with trucking association |
| Texas DOT | TxDMV does not otherwise hold any of these types of meetings regularly. TxDMV works with Texas Trucking Association and distributes notices to trucking industry on a variety of topics. |
| Wisconsin DOT | Advisory committees, social media, 511, email listserv, bulletin on permitting system |
When asked if a state has a procedure for identifying high-risk bridges or tunnels, 10 out of 19 respondents selected the option “Yes”, four selected “No”, and the remaining five selected “I do not know”. All states except for Indiana and South Dakota (who might not or didn’t take advantage of such data sources) said they use a stand-alone BrTS database and have developed their own risk assessment methods. The respondents from Kentucky and Wisconsin claimed that while there is a risk assessment method in place, their BrTS statistics are difficult to find. Overall, the data show that Kansas appears to have more BrTS crashes than other states, and also indicates having difficulty accessing BrTS statistics. They also have not developed a risk assessment method to identify bridges that are at a high risk of being struck by motor
vehicles. It should be noted that most of the recorded BrTS crashes in Kansas are categorized as scrapes. Table F27 shows all responses.
Table F27. Procedure for Identifying Bridges/Tunnels at High Risk for Being Hit by Motor Vehicles.
| Agency | Yes | No | I do not know | BrTS Data Source* |
|---|---|---|---|---|
| Delaware DOT | X (from both) | Standalone database | ||
| Indiana DOT | X | |||
| Indiana Criminal Justice Institute | X | |||
| Michigan DOT | X | |||
| New York State DOT | X | |||
| Nebraska DOT | X | |||
| Pennsylvania DOT | X | |||
| Rhode Island DOT | X | |||
| South Dakota DOT | X | |||
| Texas DOT | X | |||
| Nevada DOT | Easily identified from crash data or other sources. | |||
| Tennessee DOT | ||||
| Arkansas DOT | X | Difficult to Find from crash data or other sources | ||
| California DOT | X (from 3rd respondent) | |||
| Kansas DOT | X | |||
| Kentucky Transportation Cabinet | X | |||
| South Carolina DOT | X | |||
| Wisconsin DOT | X | |||
| Wyoming DOT | X | |||
| Guam Department of Public Works | Limited or no knowledge | |||
| Louisiana DOTD | ||||
| Minnesota DOT | X |
* Responses from the previous question on BrTS data source.
The next question is a follow-up question about a state’s response to a bridge/tunnel if it is struck repeatedly. Seventeen text entry answers were received and are summarized below:
- Additional/advanced signages/control devices/overheight warning devices. (11)
- Replacement priority, earlier rehab/replacement, or given additional strength in the repair. (7)
- Lowering the pavement or increasing vertical clearance. (4)
- Driver awareness education. (1)
- Roadway geometry adjustment. (1)
Specific responses are listed in Table F28.
Table F28. Survey Responses of Agencies’ Strategies to a Bridge/Tunnel that is Struck Repeatedly.
| Agency | What is your state’s response to a bridge/tunnel that is struck repeatedly? |
|---|---|
| Arkansas DOT | More advanced signing. In one instance placing a portal with lower clearance before the structure. |
| California DOT | Prioritize them for replacement (from 3rd respondent) |
| Delaware DOT | Evaluate existing signage or alerting strategies to see what can be done to improve those strategies and reduce the amount of strikes (from 1st respondent); Bridge inspection staff will respond to the location immediately following the strike. If a frequently struck location, they will normally refer to the Traffic section for further traffic control device improvements. In the most extreme case, we have installed the “Clankers” system along with flashing red beacons and emphatic signage. (From 2nd respondent) |
| Kansas DOT | Adding signage to notify drivers |
| Kentucky Transportation Cabinet | Signage or bridge/superstructure replacement |
| Michigan DOT | Erect a warning sign with flashing lights and look to raise the bridge when a catastrophic hit has happened while minimizing future hits on other bridges. |
| Minnesota DOT |
|
| Nebraska DOT | Mitigation and prevention methods are reviewed. |
| New York State DOT | Increase vertical clearance in a capital project or reduce under roadway wearing surface elevation. If raising the clearance or lowering the surface elevation isn’t feasible, enhanced conspicuity measures installed on existing warning devices and installation of OHV detection systems (e.g., TRIGG) on the approach the structure. Also, installing a turnaround for locations where space is available. |
| Pennsylvania DOT | Construct mitigation devices or, plan and construct replacements to eliminate over height impact issues |
| South Carolina DOT | It depends on the structure and the circumstances. Often the bridges are repaired with additional signage. Sometimes additional structural capacity is added back to beams during repairs to account for the next bridge hit. Jackings and replacements are used sparingly but can be used when needed. |
| South Dakota DOT | Overheight detection was added by the city but hasn’t been effective. |
| Tennessee DOT | installing additional signage, including lighting and possibly height sensors, and potentially a long-term plan to replace the bridge if a low |
| Texas DOT | Texas DOT may attempt to increase driver awareness at the location or adjust the geometry if possible. |
| Wisconsin DOT | Add more prominent signage / warning system. If it’s a structure type that’s prone to damage, it may be considered for earlier rehab/replacement, or given additional strength in the repair. |
| Wyoming DOT | Increase the bridge clearance when bridge is replaced by use of modified girder geometry (e.g. parabolic or shallower section, etc.). Lower roadway under / raise roadway over Use overheight warning devices. |
The final question of the survey is a post-survey evaluation question aimed at obtaining further information from respondents regarding the project overall. Table F29 summarizes the responses.
Table F29. Summary of Post-Survey Comments with Opinions or Suggestions for the Study.
| Agency | Any other comments for the survey or the study? |
|---|---|
| Kansas DOT | KDOT’s Office of Chief Counsel Property Damage Unit keeps track of the repair costs for bridge hits; but it is not in a bridge/tunnel database. |
| Minnesota DOT | MnDOT recognizes that there is a growing need to gather data about bridge/tunnel strikes. We are working towards establishing policies and a software improvement to facilitate better reporting and tracking of this data. In 2022 we reported 56 bridge hits in Metro District, excluding barrier hits on bridges (gathered using dispatch call logs). |
| New York State DOT | Coordination with USDOT is necessary to mandate the use of commercial GPS nationwide. More information on origin/destination is necessary for a targeted approach. Goal is to make the risk of hitting a bridge much more significant than the reward of taking restricted routes (greater fines for bridge strikes, CDL penalties, insurance premium increases, higher fines for personal GPS use in commercial vehicles, etc.). |
| South Carolina DOT | This is a complex issue that involves many internal departments as well as external agencies (like the DMV and transport policy and highway patrol). We’ve done our best to answer everything but may not be aware of everything regarding this topic. |
| Wisconsin DOT | We are currently working on adding required entries to bridge inspections after bridge strikes that will better track causes, location of damage into a database, follow-up actions, and trends. |
Conclusion
The survey findings reveal BrTS as a significant risk factor to public safety, causing damage to vehicles and infrastructures, injuries/fatalities, and costly delays for highway users. Unfortunately, the lack of comprehensive information on the number, location, and severity of BrTS hinders the identification of at-risk structures and the implementation of cost-effective countermeasures.
The survey offers valuable information for state agencies to improve their practices in preventing and mitigating BrTS incidents. These improvements include the need for a centralized data inventory system to manage BrTS information consistently and develop risk assessment methods to identify high-risk bridges/tunnels for BrTS. The survey also highlights important facts about BrTS statistics, policies, and operations, including underreporting, the highest estimated percentage of collisions by OHVs, and the common practice of using 3" less than the actual measured clearance on signage.
The survey data provides actionable steps for implementing measures to mitigate and prevent BrTS, such as additional signage, control devices, and driver awareness education. State agencies also use various levels and scales of involvement to communicate with the trucking industry regarding BrTS issues. The survey emphasizes the importance of these communications and the need for more comprehensive BrTS statistics as well as more accurate information such as lane-by-lane vertical clearance to prevent future incidents.
Overall, the survey provides valuable insights into the current practices and challenges surrounding BrTS prevention and mitigation efforts by state agencies. Further collaboration and data sharing are necessary to improve public safety on our highways and bridges.


