Prevention and Mitigation of Bridge and Tunnel Strikes (2025)
Chapter: 5 Data Acquisition, Processing, and Linkage
CHAPTER 5
Data Acquisition, Processing, and Linkage
Data Acquisition
With the assistance of the Association of Transportation Safety Information Professionals (ATSIP), the leading advocacy group for improving the quality and use of transportation safety information, two data requests for crash data on bridge and tunnel hits and roadway, traffic volume, and structures data were sent to its member agencies1. Figure 3 shows the states that expressed their willingness to share data. The responding states have balanced geographic coverage, manage and own a wide range of bridges and tunnels, and represent various ways of crash data collection and management.
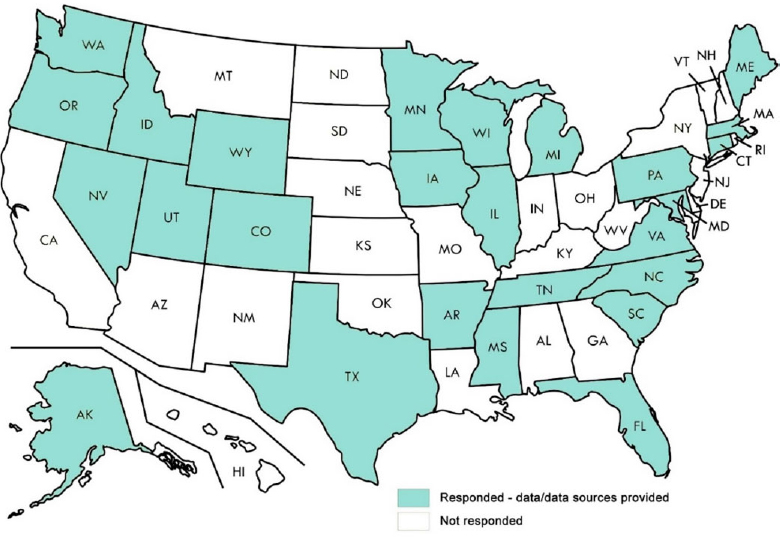
In total, 14 (14) states provided both crash and structure data: AK, AR, CO, CT, IL, NC, OR, SC, TX, UT, VA, WA, WI, and WY; nine (9) states provided crash data only: FL, IA, ID, ME, MI, MN, MS, NV, TN; and three (3) states provided roadway or traffic data only: MA, MD, PA. As shown in Table 3, some state agencies provided queried BrTS data directly, while others granted the access to their online data depository. It is fair to say that the BrTS data acquired from these states represent the current state of practice for BrTS, as well as the challenges and issues to achieving the project goals.
___________________
1 ATSIP’s membership consists of professionals from local, state and federal government agencies, including Departments of Transportation, Public Safety, and Highway Safety Offices, as well as law enforcement agencies, private sector professionals, and partners from academia and university research centers.
Table 3. Summary of State Data Collection Protocols
| State | Crash | Structure | Roadway | Traffic |
|---|---|---|---|---|
| Alaska | Directly provided | Directly provided | ‒ | Directly provided |
| Arkansas | Directly provided | Directly provided | Directly provided | Directly provided |
| Colorado | Directly provided | https://dtdapps.coloradodot.info/otis | ||
| Connecticut | Directly provided | https://connecticut-ctdot.opendata.arcgis.com/ | ||
| Florida | Directly provided | ‒ | ‒ | ‒ |
| Idaho | Directly provided | ‒ | ‒ | ‒ |
| Illinois | Directly provided | http://apps.dot.illinois.gov/gist2/ | http://apps.dot.illinois.gov/gist2/ | - |
| Iowa | Directly provided | ‒ | Directly provided | Directly provided |
| Maine | Directly provided | ‒ | ‒ | ‒ |
| Maryland | ‒ | https://maryland.maps.arcgis.com/ | https://data-maryland.opendata.arcgis.com/pages/mdot-data | https://roads.maryland.gov/mdotsha/pages/Index.aspx?PageId=792 |
| Massachusetts | ‒ | ‒ | Directly provided | Directly provided |
| Michigan | Directly provided | ‒ | ‒ | ‒ |
| Minnesota | Directly provided | ‒ | ‒ | ‒ |
| Mississippi | Directly provided | ‒ | ‒ | ‒ |
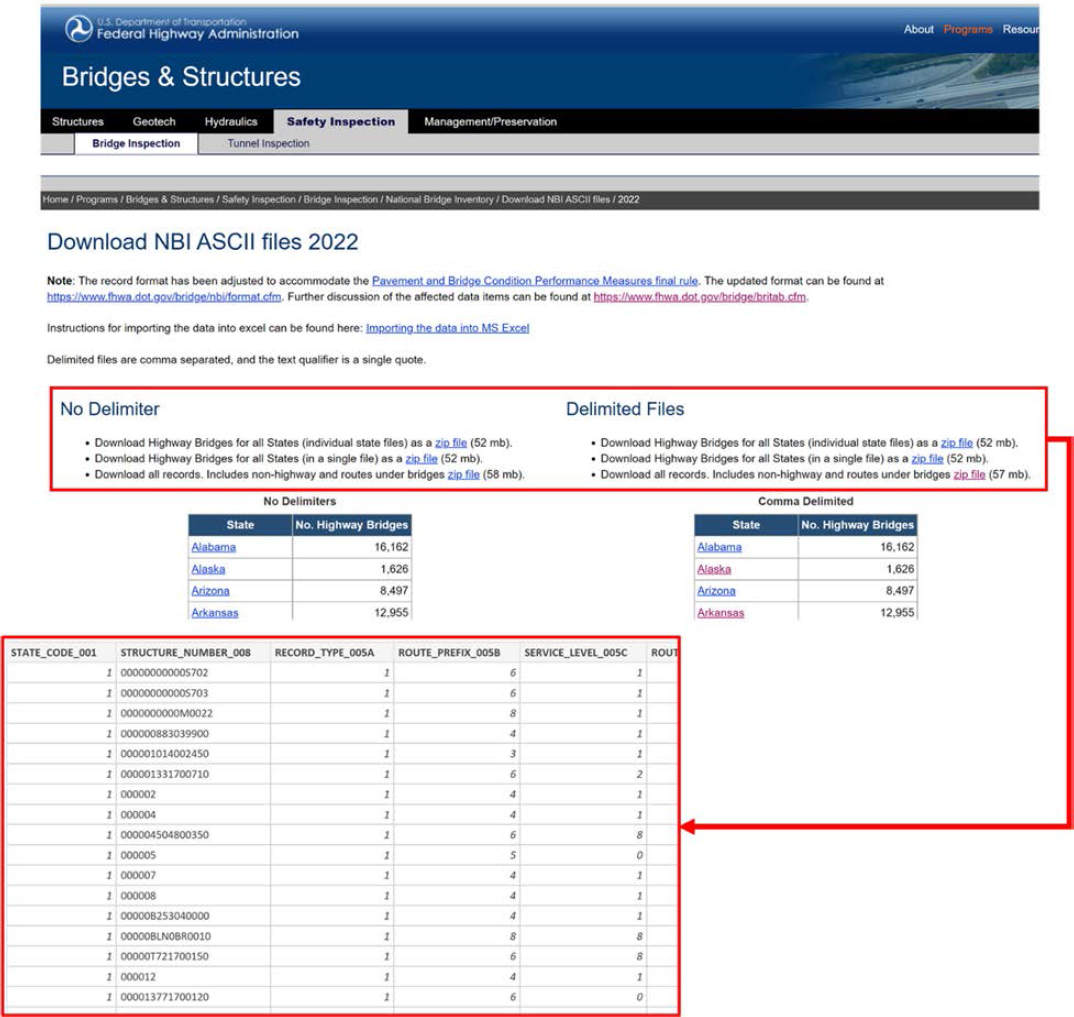
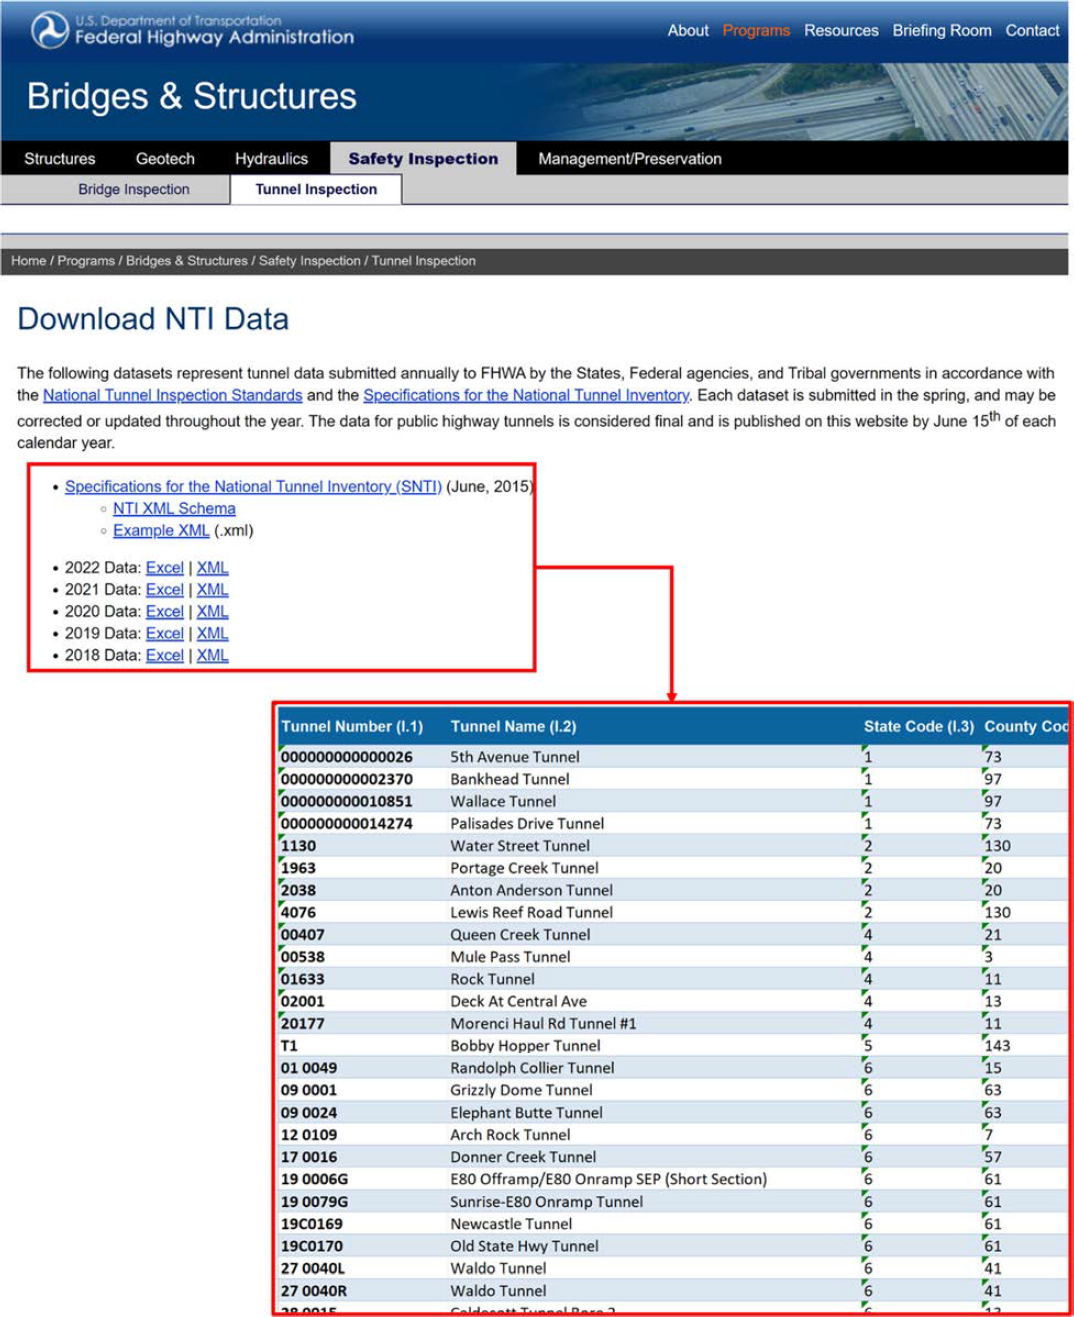
A review of state-specific structure databases concludes that they are not applicable to this project because of limited information and inconsistent format. The decision was made to acquire structure data from national databases such as the NBI and NTI. NBI and NTI are comprehensive databases that contain information about bridges, traffic, and roadway characteristics. NBI2 and NTI3 data are downable from the FHWA’s website. Figures 4 and 5 show the NBI and NTI data retrieval and the sample data, respectively.
___________________
2 NBI: https://www.fhwa.dot.gov/bridge/nbi/ascii.cfm
3 NTI: https://www.fhwa.dot.gov/bridge/inspection/tunnel/inventory.cfm
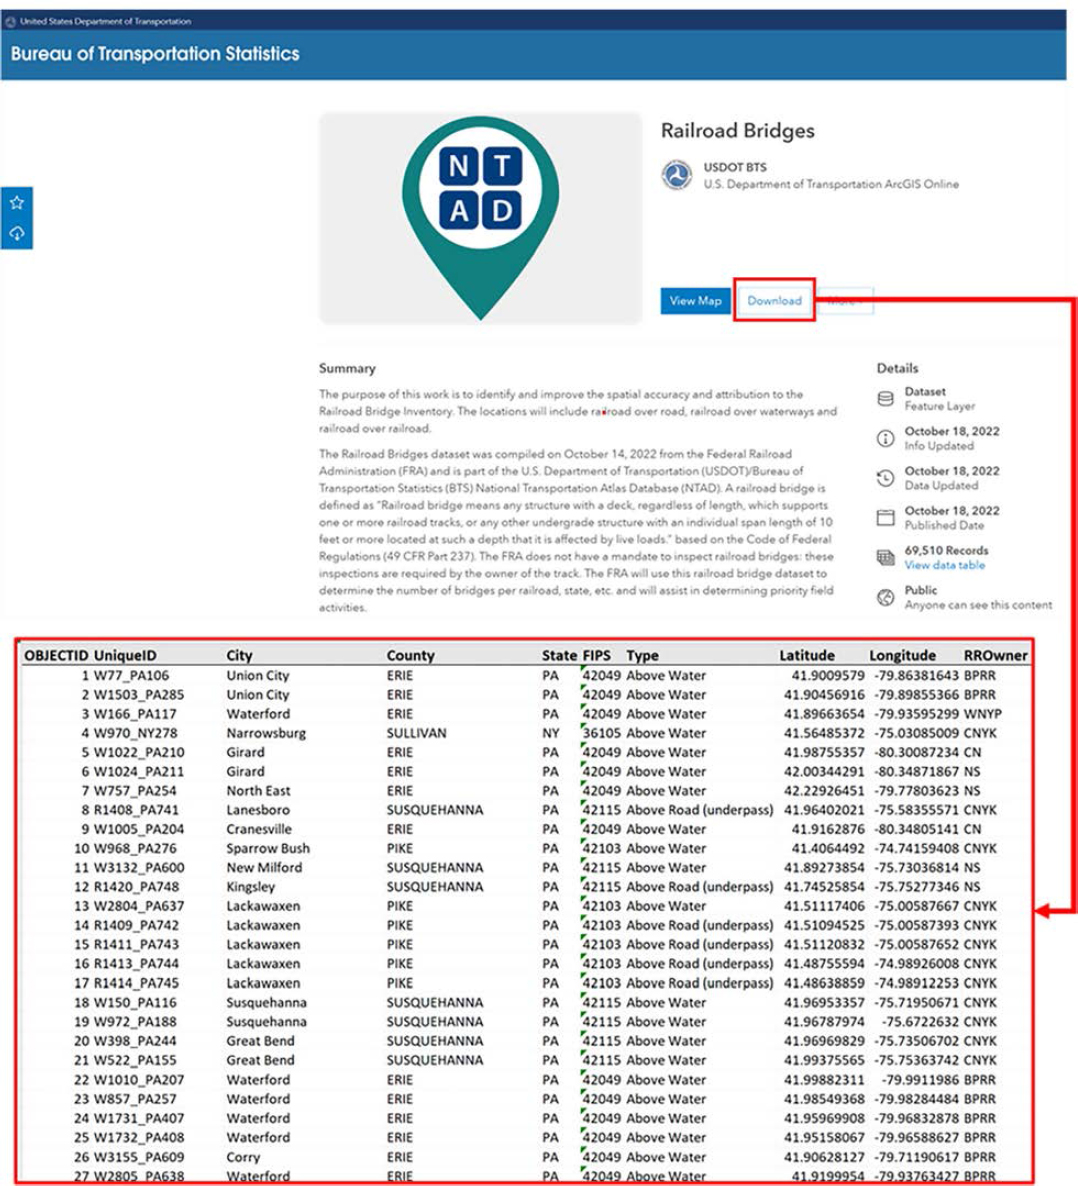
Few railway bridges are stored in NBI. Missing railroad bridges will result in a wrongful linkage between a railroad bridge crash to a nearby highway bridge. To address this issue, a recently compiled and published inventory of railroad bridges by the US Department of Transportation (USDOT) Bureau of Transportation Statistics (BTS) was acquired, as shown in Figure 6. The key data fields are Type (above water or above road), and Latitude/Longitude information.
Data Processing and Linkage
Due to there not being enough guidance or a clear definition of BrTS in MMUCC, each state has the flexibility to create their own data fields and attribute values in association with their infrastructure such as bridges and tunnels. This section provides the details of data processing at the state level (state-maintained crash data and structure/traffic/roadway inventory data) and the national level (NBI and NTI). This section also introduces the data linkage method for integrating structure information with crash data.
Definition
Based on what is learned from the literature and the state of practice in collecting vehicle bridge or tunnel collisions, the following definitions are applied in this report.
- BrTS: a reportable crash in which one or more vehicles or their cargos collide with a bridge or a tunnel or its associated component. A BrTS can be further classified by the distinct places of a structure being struck.
- OHV: vehicles and loads beyond legal size limitations; or standard size vehicles that are beyond a local height limitation of a specific bridge, or tunnel.
- On-bridge collision with superstructure: a reportable crash in which one or more vehicles collide with a bridge rail, parapet, or other elements in the superstructure of a bridge. Note that this type of crashes does not include on bridge collision by OHVs.
- On-bridge collision by OHV: a reportable crash in which an OHV collides with an overhead truss or other overhead components that support the bridge.
- Under-bridge collision with substructure: a reportable crash in which one or more vehicles collides with the elements of bridge substructure such as bridge support, pier, column, abutment.
- Under-bridge collision by OHV: a reportable crash in which a vehicle, typically a truck, tries to pass under a bridge that is lower than their vehicle or cargo height, therefore colliding with the bridge.
- Tunnel collision: a reportable crash in which one or more vehicles collide with the tunnel. Due to their relatively small size and lack of specific information in the crash data, it is appropriate to group all tunnel crashes into one group. If more information is available, a tunnel collision may be further classified as tunnel collision by OHV or tunnel collision at the entrance, inside of, or at the exit of the tunnel.
Reportable BrTS Data Elements
Querying a BrTS in a crash database is not straightforward because of various ways to store and present it. The relational crash database in Figure 7 illustrates the recommended query method.
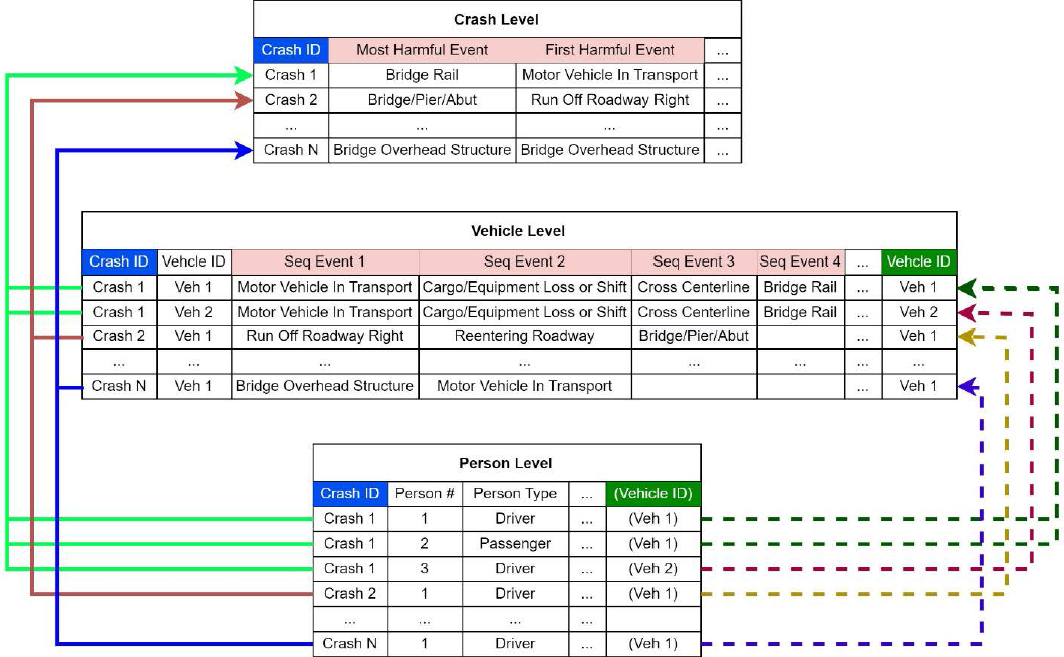
Events related to bridge strikes are usually archived at the vehicle level or at the crash level. In most states, only the most harmful event and sometimes the first harmful event are available at the crash level. Querying the most harmful events for bridge-related collisions will leave out a substantial number of bridge hits that are neither the most harmful nor the first harmful event. Therefore, querying BrTS from multiple data fields and two different tables such as “first harmful (crash-level)”, “most harmful (crash-level)”, or “sequence of events (vehicle-level)” for attributes such as “Bridge Overhead Structure”, “Bridge Pier or Support”, “Bridge Rail”, “Other Fixed Object (wall, building, tunnel, etc.)” is a recommended practice in order to retrieve complete results. Table 4 shows the complete results from Wisconsin, North Carolina, and Maine.
Table 4. BrTS by Sequence of Crash Events4
| Sequence of crash events | WI (2017-2021) | NC (2017-2021) | ME (2017-2021) | |||
|---|---|---|---|---|---|---|
| Single Vehicle | Multi-Vehicle | Single Vehicle | Multi-Vehicle | Single Vehicle | Multi-Vehicle | |
| SEQ 1 VEH 1 | 1145 (56.4%) | 59 (22.3%) | 388 (19.7%) | 30 (19.2%) | 140 (33.3%) | 4 (10%) |
| SEQ 2 VEH 1 | 607 (29.9%) | 78 (29.4%) | 1062 (53.8%) | 38 (24.4%) | 168 (20%) | 10 (25%) |
| SEQ 3 VEH 1 | 194 (9.6%) | 22 (8.3%) | 356 (18.0%) | 22 (14.1%) | 65 (15.5%) | 4 (10%) |
| SEQ 4 VEH 1 | 54 (2.7%) | 7 (2.6%) | 179 (9.1%) | 13 (8.3%) | 18 (4.3%) | 2 (5%) |
| SEQ 1 VEH 2 | - | 22 (8.3%) | - | 6 (3.8%) | - | 2 (5%) |
| SEQ 2 VEH 2 | - | 54 (20.3%) | - | 26 (16.7%) | - | 7 (17.5%) |
| SEQ 3 VEH 2 | - | 13 (4.9%) | - | 27 (17.3%) | - | 5 (12.5%) |
| SEQ 4 VEH 2 | - | 2 (0.8%) | - | 2 (1.3%) | - | 0 (0.0%) |
| Most Harmful | 1803 (88.9%) | 101 (39.5%) | 1589 (80.5%) | 108 (69.2%) | 343 (81.7%) | 16 (40%) |
| First Harmful | 1729 (85.3%) | 53 (20.7%) | N/A | N/A | N/A | N/A |
| Total | 2027 | 265 | 1973 | 156 | 420 | 40 |
Ideally, the crash data should contain information that can help specify which bridge parts are struck and distinguish bridge hits from tunnel hits. A few states do not distinguish by bridge part. For instance, the bridge hit records from Colorado are all labeled as “bridge railing” crashes. In terms of tunnel strikes, very few states (e.g., Washington) assign dedicated attributes/fields to tunnels in the crash data. The only way to identify tunnel hits from “Other Fixed Object (wall, building, tunnel, etc.)” hits or to identify a specific part of the bridge is to review the crash narrative. However, the crash narrative is one of the data items that is frequently not available through data requests.
To better support the methodology development, at a minimum, the following data fields and attributes are required:
- Crash time
- Crash location (Latitude/Longitude, X/Y, on/at/from)
- Injury (persons) in the crash
- Data fields used to query BrTS crashes
- Vehicle type
- Roadway classification/functions
- Urban-rural classification
- Speed related information (posted speed limit, measured speed)
- Information that can support potential analyses (e.g., OSOW permit process, economic analysis, driver behavior) or validations (e.g., crash location) is desirable:
- Structure ID of bridge/tunnel
- Damage of bridge/tunnel
- Permit information (especially OSOW permit information)
- Commercial vehicle information (e.g., cargo, dimension)
- Crash narrative
___________________
4 crash events are within 500ft of a bridge. Usually, only the first two units involved in a crash and the first four events are displayed.
In most responding states, none of the additional information is available in their crash databases.
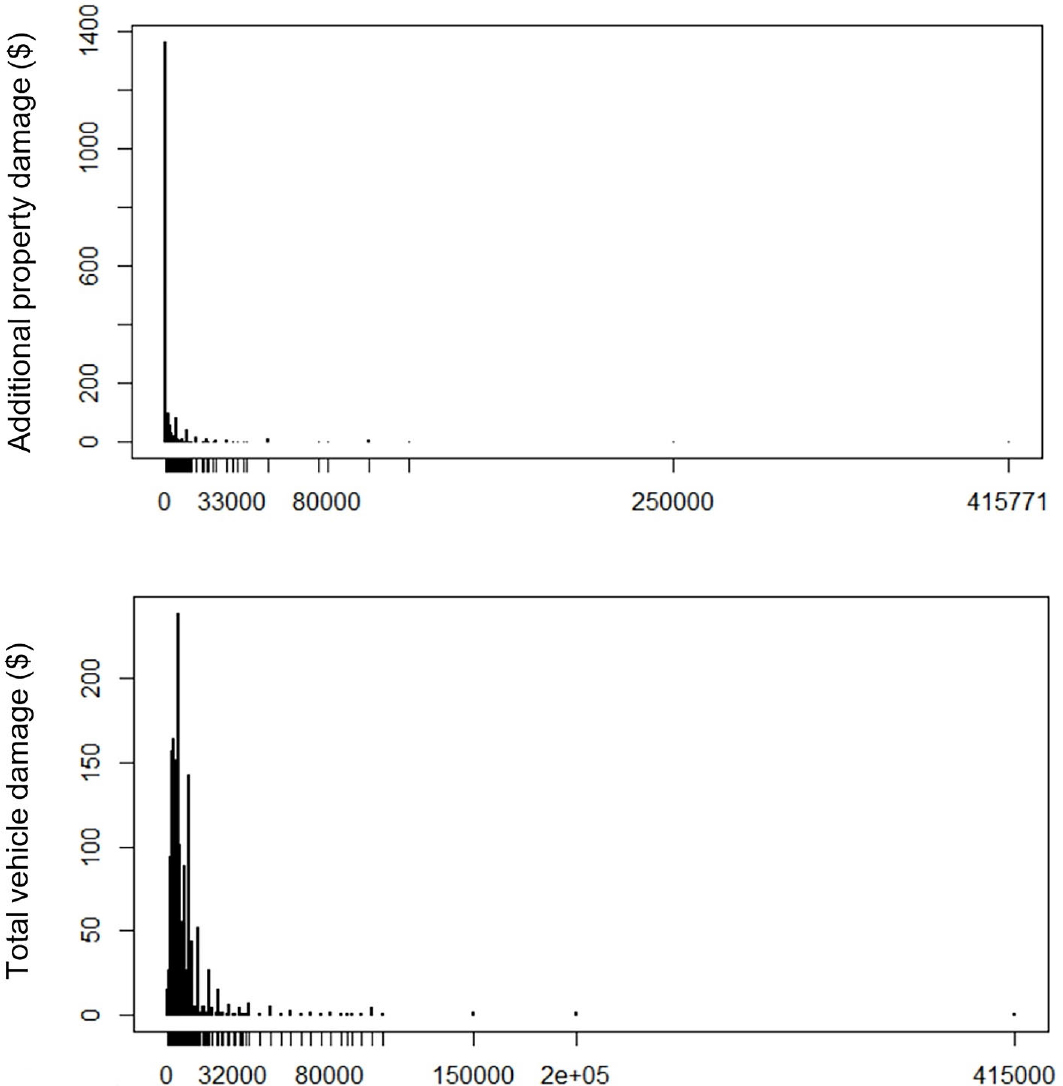
North Carolina is one of the few states that documents the estimated amount of “any property other than motor vehicles and their loads that was damaged” in their crash data. Figure 8 shows the distribution of additional property damage and total vehicle damage in dollar amount for over 2000 BrTS between 2017 and 2021. To our surprise, most cases are below $100,000, and only six crashes have a damage that exceeds $100,000, with the highest being $415,771. Such a low damage cost casts doubt on how reliable this variable is when estimating the severity of bridge damage after the motor vehicle strike.
Lastly, in order to create a database with standard data fields and attribute values, state-specific data fields and attributes need to be converted to MMUCC-compliant data fields. Table 5 shows an example of converting vehicle type into the corresponding MMUCC attributes.
Table 5. Example of Data Fields/Attributes Conversion (Wisconsin)
| State Crash Data Field | MMUCC -Compliant Data Field |
|---|---|
| SUV - (Sport) Utility Vehicle | (Sport) Utility Vehicle |
| CYCLE – Motorcycle | 2-Wheeled Motorcycle, 3-Wheeled Motorcycle |
| ATV - ATV/UTV (Utility Terrain Vehicle) | All-Terrain Vehicle/All-Terrain Cycle (ATV/ATC) |
| ATV – ATV | |
| UTV - UTV (Utility Terrain Vehicle) | |
| ACYCLE - Autocycle | Autocycle |
| P VAN - Passenger Van | Cargo Van, 9- or 12-Passenger Van, 15-Passenger Van |
| C VAN - Cargo Van (10,000 lbs or Less) | |
| FARM - Farm Tractor/Self Propelled | Farm Equipment (tractor, combine harvester, etc.) |
| GOLF - Golf Cart | Golf Cart |
| LSPD - Low Speed Vehicle | Low Speed Vehicle |
| MOPED - Moped | Moped or motorized bicycle |
| HOME - Motor Home | Motor Home, Recreational Off-Highway Vehicles (ROV) |
| COACH - Motor Coach | Motorcoach |
| OT BUS - Other Bus | Other Bus Type |
| EM POL - Police on Emergency | Other or unknown |
| AMB EM - Ambulance on Emergency | |
| AGCMV - AgCMV (Ag Commercial Motor Vehicle) | |
| OTHR - Other Working Machine | |
| TRAIN - Railway Train | |
| PLOW - Snow Plow | |
| MISC - Miscellaneous | |
| BIKE - Bicycle | |
| FIREF - EM - Fire Fighter on Emergency | |
| TRAILER - Trailer | |
| HRSDRWN - Horse and Buggy | |
| MINI - Mini Bike/Dirt Bike | |
| FIRE EM - Fire Truck on Emergency | Other Trucks |
| CAR - Passenger Car | Passenger Car |
| UT TRK - Utility Truck/Pickup Truck | Pickup |
| S BUS - School Bus | School Bus |
| PT BUS - Pupil Transportation School Bus | |
| ST TRK - Straight Truck | Single Unit Truck |
| SNOW - Snowmobile | Snowmobile |
| T BUS - Passenger Bus/Transit Bus | Transit Bus |
| TRK NA - Truck Tractor (Trailer Not Attached) | Truck Tractor |
| TRK TA - Truck Tractor (Trailer Attached) | |
| TRK DB - Truck Tractor (More Than One Trailer) |
Table 6 summarizes the result of BrTS data from 23 states. One outstanding issue is that the structure ID is not available for most states. Maine is the only state with a properly filled structure ID that is identical to the bridge ID found in NBI. The structure ID is available in Wisconsin’s crash data, but most of the IDs were improperly filled.
Table 6. Summary of Retrieved State-Maintained BrTS Crash Data
| Data Elements | A K |
A R |
C O |
C T |
F L |
I D |
I L |
I A |
M E |
M I |
M N |
M S |
N V |
N C |
O R |
S C |
T N |
T X |
U T |
V A |
W A |
W I |
W Y |
|---|---|---|---|---|---|---|---|---|---|---|---|---|---|---|---|---|---|---|---|---|---|---|---|
| Identifiable bridge struck part | √ | × | × | √ | √ | √ | √ | √ | √ | √ | √ | √ | √ | √ | √ | √ | √ | √ | √ | √ | √ | √ | √ |
| Crash time | √ | √ | √ | √ | √ | × | √ | √ | √ | √ | √ | √ | √ | √ | √ | √ | √ | √ | √ | √ | √ | √ | √ |
| Crash location | √ | √ | √ | √ | √ | × | √ | √ | √ | √ | √ | √ | √ | √ | √ | √ | √ | √ | √ | √ | √ | √ | √ |
| Injury severity | √ | √ | √ | √ | √ | √ | √ | √ | √ | √ | √ | √ | √ | √ | √ | √ | √ | √ | √ | √ | √ | √ | √ |
| Vehicle type | √ | × | √ | √ | √ | × | √ | √ | √ | √ | √ | √ | √ | √ | √ | √ | √ | √ | √ | × | √ | √ | × |
| Roadway classification | √ | × | × | √ | √ | × | √ | √ | √ | √ | √ | √ | × | √ | √ | √ | × | √ | × | √ | × | √ | × |
| Urban/rural classification | √ | √ | × | √ | × | × | √ | √ | √ | √ | √ | √ | × | √ | √ | √ | × | √ | × | √ | × | √ | × |
| Speed related information | × | × | √ | √ | √ | × | √ | √ | √ | √ | √ | √ | × | √ | √ | √ | √ | √ | × | × | √ | √ | × |
| Structure ID | × | × | × | × | × | × | × | × | √ | × | × | × | × | × | × | × | × | × | × | × | × | √ | × |
| Damage to structure | × | × | × | × | √ | × | √ | × | √ | √ | √ | √ | √ | √ | × | √ | √ | √ | × | × | × | × | × |
| Permit information | × | × | × | × | × | × | × | × | × | × | × | × | × | × | × | × | × | × | × | × | × | × | × |
| Information of commercial vehicle | √ | × | × | × | √ | × | √ | √ | √ | √ | √ | × | √ | √ | × | × | √ | √ | × | × | √ | √ | × |
| Crash narrative | × | × | × | × | × | × | × | × | × | × | × | × | × | √ | × | × | × | × | × | × | × | √ | × |
| Data format* | M | M | M | S | S | M | S | S | M | S | S | M | M | M | S | M | S | M | S | M | M | M | M |
*: M: Merged data; S: Separate datasets are provided with crash (event) level, vehicle level, and personal level datasets.
NBI and NTI
The NBI database maintains information about more than 615,000 bridges located on public roads and publicly accessible bridges on federal and tribal lands. NBI keeps inventory and inspection information collected by state DOTs, federal agencies, and tribal governments. The collection of bridge inventory and inspection data is categorized into seven sections:
- bridge identification,
- bridge material and type,
- bridge geometry,
- features,
- loads, load rating and posting,
- inspections, and
- bridge condition.
Similarly, NTI is a national database that contains information describing the more than 500 tunnels nationwide located on public roads, including Interstate Highways, US highways, state and county roads, as well as publicly accessible tunnels on federal lands. The collection of information includes eight types of inventory items: identification items, age and service items, classification items, geometric data items, inspection items, load rating and posting items, navigation items, structure type and material items. Table 7 shows a short list of risk factors pertinent to each type of BrTS selected from the bridge inventory.
Table 7. Selected Structure Variables
| Bridge Features | On Bridge Roadway Features | Under Bridge Roadway Features | |||
|---|---|---|---|---|---|
| Variable | Description | Variable | Description | Variable | Description |
| Main Member Type | Type of structure used for the main span of the bridge | Truck Traffic | Annual Daily Truck Traffic | Under Roadway Feature | Type of facility provided under the bridge (Highway, Railroad, Body of Water, etc.) |
| Structural Redundancy | The structure’s ability to redistribute its loads within a primary member due to the continuity of primary members | Pedestrian Bridge | Whether the bridge is a pedestrian bridge | Truck Traffic | Annual Daily Truck Traffic (vehicles per hour) |
| Previous Impact Damage | Type of damage resulting from previous impacts | Annual Average Daily Traffic | The average daily traffic in vehicles per day | Annual Average Daily Traffic | The average daily traffic in vehicles per day |
| Bridge Features | On Bridge Roadway Features | Under Bridge Roadway Features | |||
|---|---|---|---|---|---|
| Variable | Description | Variable | Description | Variable | Description |
| Multiple Bridge Hits | Number of bridge hits | Minimum Vertical Clearance | The minimum clearance above the roadway for a vehicle to pass under | Minimum Vertical Clearance | The minimum clearance above the roadway for a vehicle to pass under |
| Vertical Clearance Warning Signs | Whether there are warning signs placed to warn the driver of the available clearance under the bridge | Lighting | Type of lighting present on the roadway | Lighting | Type of lighting present on the roadway |
| Posted Speed Limit | The posted speed limit on the roadway | Posted Speed Limit | The posted speed limit on the roadway | ||
| Functional Classification | The functional classification of the roadway (Interstate, Arterial, Collector, Local) | Functional Classification | The functional classification of the roadway (Interstate, Arterial, Collector, Local) | ||
| Lane Width | How wide the lanes are on the roadway | Lane Width | How wide the lanes are on the roadway | ||
| Shoulder Width | How wide the shoulders are on the roadway | Shoulder Width | How wide the shoulders are on the roadway | ||
| Necking | Whether the roadway becomes narrower at some point | Necking | Whether the roadway becomes narrower at some point | ||
USDOT BTS Railroad Bridge Data
On October 14, 2022, BTS of USDOT released the railroad bridge dataset from the Federal Railroad Administration and published it as part of the National Transportation Atlas Database. Based on the Code of Federal Regulations (49 CFR Part 237), a railroad bridge is defined as “Railroad bridge means any structure with a deck, regardless of length, which supports one or more railroad tracks, or any other undergrade structure with an individual span length of 10 feet or more located at such a depth that it is affected by live loads” in this dataset. There are 69,510 railroad bridges contained in this dataset.
However, the railroad bridge inventory lacks structure and traffic-related information. Thus, the major purpose of using this dataset is to use the location information of the railroad bridge to increase the accuracy of spatial join between the crash and the NBI bridge, as NBI lacks most railroad bridges. Including this dataset can reduce the uncertainty of joining a crash with the wrong highway bridge in the NBI data.
Data Linkage
There are two situations when linking the crash to the bridge data. The first situation is when the crash data contains a complete and accurate bridge ID that is the same ID found in the bridge inventory. This bridge ID is a UUID that can deterministically link a crash record to the impacted bridge. Maine’s bridge ID is its UUID in both the crash data and the bridge inventory, and therefore, Maine’s BrTSs are directly linked to the impacted bridges. The second situation is also the most common case, which occurs when the structure ID is not available or not properly filled out in the crash data. The solution is to apply a spatial join based on the Euclidean distance between crash and bridge locations. Note that the spatial join is a probabilistic linkage method and that the accuracy of finding a correct match increases as the joined distance decreases.
The most common spatial join method, called “closest join,” involves linking a crash to its nearest bridge. An alternative is to split a crash among bridges found within its proximity. For the “split join,” a distance must be defined, and a fraction of a hit is assigned to each bridge, rather than assigning 100% of a crash to the nearest bridge.
Both closest and split join methods for Maine, North Carolina, and Wisconsin were performed with the intention of comparing them. Nine split joins were conducted, three for each state - on bridge strikes, under bridge strikes, and under bridge OHV strikes. Each bridge was presented with a fraction of the crash count if it was within 500 feet. This set of strikes was then compared to the strikes generated by the closest join using a paired t-test to determine whether the two samples were statistically different. A fisher’s exact test was used to determine whether the two samples were independent. The paired t-test indicated that the two samples generally were statistically different, and the fisher’s exact test showed that they were generally independent; this indicates that selecting an option between the closet join and split join is imperative, as it could be influential later in the analysis.
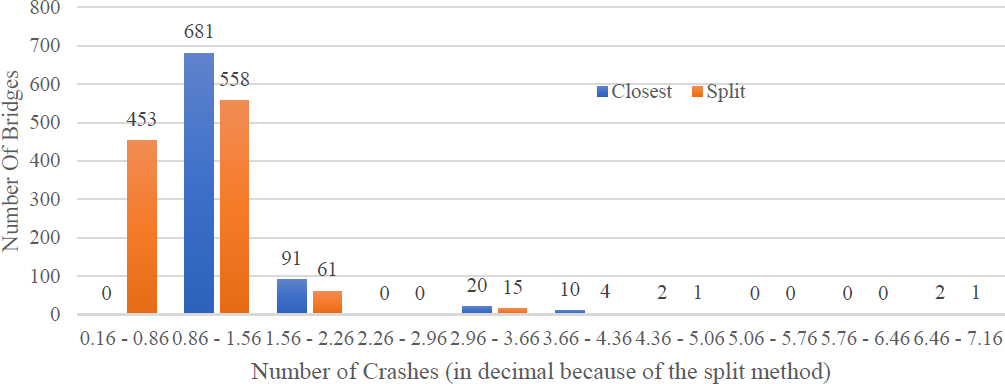
Figure 9 presents the distribution of bridge count for North Carolina by the number of crashes between closet join and split join (decimal because of the split method). As can be seen, the split join resulted in more bridges than there were crashes, which is very problematic, as the resultant dataset includes many bridges with very small fractions of strike counts. Therefore, “closest join” is the recommended spatial join method in this project.
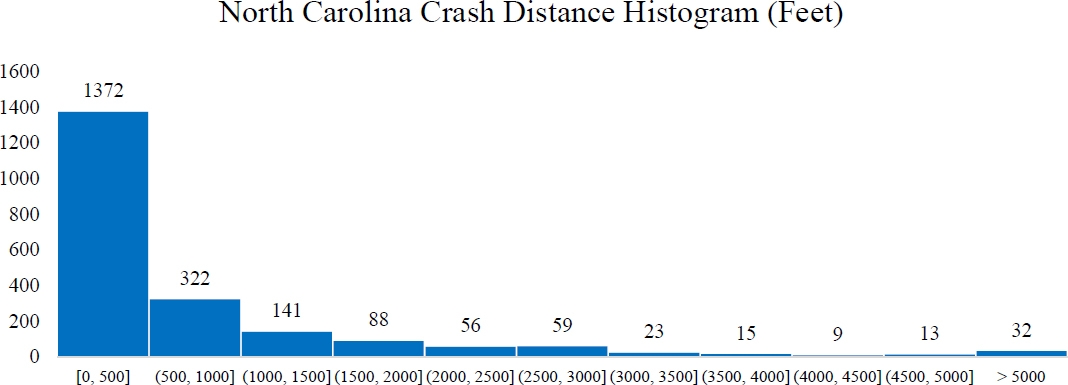
Distance histograms were generated for each state. The histograms showed that most crashes were within 500 feet of a bridge, such as in the case of North Carolina (Figure 10) where over 64% of all crashes were within 500 feet of a bridge. When the crash was farther than 500 feet from a bridge, the accuracy of the spatial join fell. Meanwhile, a shorter distance will result in a great loss of the number of crashes joined to the bridge. Furthermore, according to the descriptions in NBI, the latitude/longitude of a bridge generally refers to the beginning of a bridge in the direction of inventory. The average structure length of bridges in NBI is about 150 feet, which suggests that for the majority of bridges, the 500-foot buffer covers the entire bridge length and its proximity.
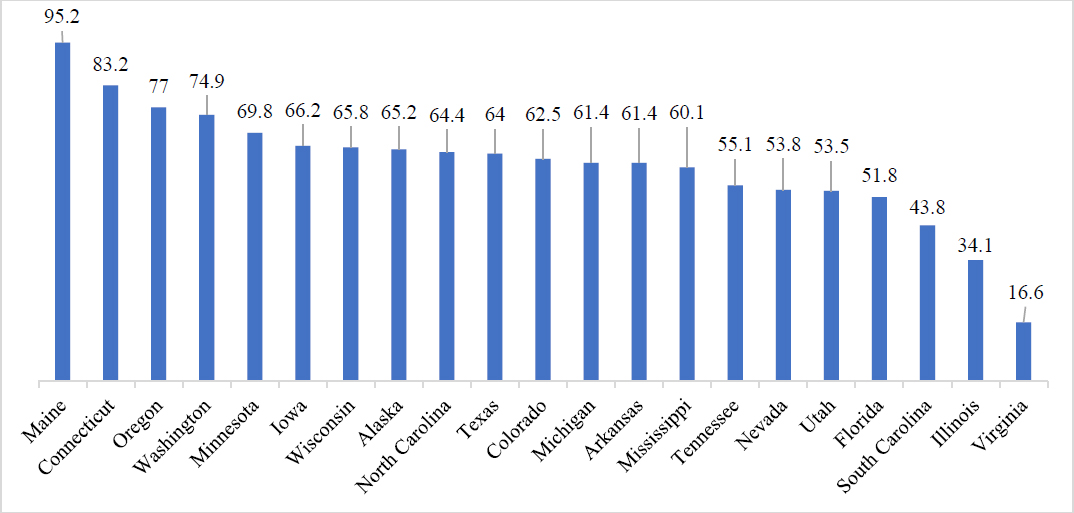
Therefore, a threshold of 500 feet is recommended. On average, 60.94% of crashes have a bridge within 500 feet. Among these states, Maine has the most accurate spatial joins with 95.2% of crashes within 500 feet of a bridge. Virginia is the state with the lowest spatial join accuracy at 16.6%. Figure 11 shows the percentage of crashes within 500 feet of a bridge by state.
To increase the accuracy of spatial join and reduce the uncertainty of wrong joining due to the missing railroad bridges in NBI5, spatial join between crash data and railroad bridges was performed. Any potential railroad bridge-related crashes were flagged when a railroad bridge is the nearest one within a 500-foot radius of a crash.
Table 8 shows the spatial join for each type of bridge-related crash. Note that the only under-bridge crashes (i.e., overhead bridge structure strikes and the under-bridge strikes with pier or support) are joined to a railroad bridge because a vehicle crash on a railway bridge is not expected. For under-bridge strikes with overhead structure (e.g., girder), the difference between including and excluding potential railroad bridge-related crashes can be large, where more than 60% (304 out of 499 crashes) are flagged as railroad bridge hits. In Wisconsin, the percentage is even higher as more than 80% (266 out of 318 crashes) are flagged for potential railroad bridge hits. However, without access to additional data sources such as crash narratives, it would be extremely difficult to verify whether these crashes are strikes to railroad bridges or to highway bridges.
Table 8. Results of Spatial Join Incorporating Railroad Bridge Data
| State | Under-bridge strikes with superstructure | Under-bridge strikes with substructure | ||
|---|---|---|---|---|
| Include possible railroad bridge crashes | Exclude possible railroad bridge crashes | Include possible railroad bridge crashes | Exclude possible railroad bridge crashes | |
| ME | 113 | 84 | 24 | 23 |
| NC | 68 | 59 | 88 | 88 |
| WI | 318 | 52 | 54 | 20 |
| Total | 499 | 195 | 166 | 131 |
In summary, if a reliable structure ID is present in the crash data, a structure can be directly linked to the strike; otherwise, the two can be joined based on the spatial proximity. The recommended spatial join is based on the closet bridge to a BrTS within its 500-ft buffer distance. The choice of 500-ft buffer distance is based on the balance between accuracy and coverage of the spatial join, which is due to the location accuracy. A linkage based on a short buffer distance of 50 feet can be highly accurate, but many crashes will not be linked to any bridges within such a small radius. A distance of 1000 feet may substantially increase the matches between crash records and bridges. Oftentimes, a crash can be linked to multiple bridges or linked to the wrong bridge, so the balance between accuracy and coverage. Similarly, vehicle strikes within 1500 feet to a tunnel are labeled as tunnel strikes. The buffer of 1500 feet is set as the threshold because the national average tunnel length in the NTI is 1300 feet. The location for a tunnel is set at its entrance.
___________________
5 Arizona, Maine, Minnesota, Montana, Oregon, and Utah include a few railroad bridges in their NBI data, while other states don’t include any.


