Prevention and Mitigation of Bridge and Tunnel Strikes (2025)
Chapter: Appendix D: Technical Memorandum: Crash Prediction Models for Highway Bridges
APPENDIX D
Technical Memorandum: Crash Prediction Models for Highway Bridges
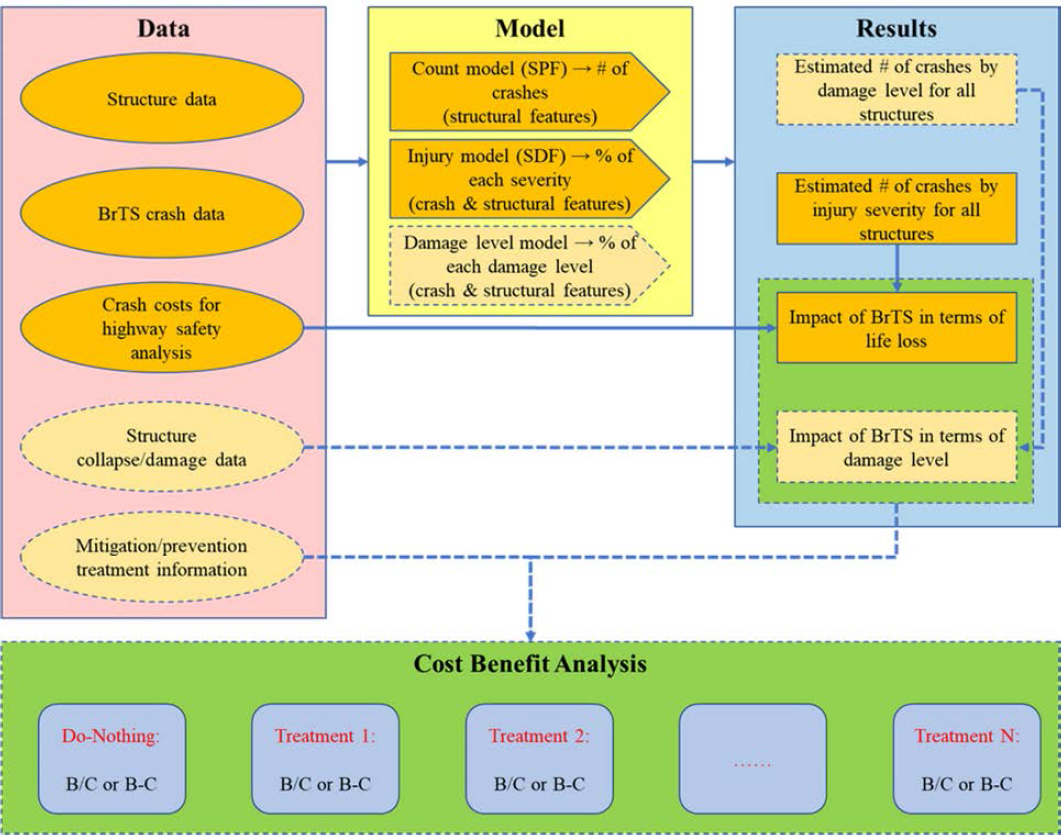
The impacts resulting from both aspects can be quantified through a two-step approach: (a) a predictive method for calculating the frequency of strikes given structural features (including traffic exposure information, which are AADT and the truck ADT percentage); and (b) an outcome model that calculates a monetized value of the comprehensive costs of a crash. The outcome model can be established for both loss of life and structural damage based on the availability of data. Meanwhile, the effects of significant risk factors in the developed models can be retrieved to help evaluate the BrTS risk for structures and identify proper treatments. It is also possible to combine the results from the modeling with the cost-benefit analysis for different treatments. The entire concept is demonstrated in Figure D1.
A review of the data suggests that the proposed method may be compromised by the low quality of the following data items:
- BrTS consequence information, in terms of structure damage, is mostly not available (in reportable crash data)15.
- Important structure characteristics, such as fracture critical condition and structure redundancy/adequacy information, are not available for all bridges (in NBI).
Considering the practicality of the methodology from a broad perspective, only personal injury severity is considered instead of failure of structure (e.g., catastrophic collapse, partial collapse, structure damage, or actual damage costs in money value) to represent the impact of BrTS.
Data Description
Two types of statistical models were developed using five-year BrTS data from Maine, North Carolina and Wisconsin between 2017 and 2021: the crash count model and the crash injury severity model. These two models serve the same purpose as the SPF and Severity Distribution Function (SDF) as defined in the HSM.
- The crash count model predicts the annual average number of specific types of bridge crashes: a) on-bridge strikes (e.g., truss, parapet, railing), b) under-bridge strikes with overhead structure (e.g., girder), and c) under-bridge strikes with pier or support (e.g., bent, support, pier, abutment)) based on the selected structure-related characteristics, and
- The crash injury severity model predicts crash injury severity (e.g., KABCO scale) given the selected structure and crash characteristics.
First, the predicted crashes from count models were calculated for all injury severities. Next, the number of crashes under each severity were determined by multiplying the total crashes with the relevant injury severity models.
Before modeling, data processing and reduction were performed to remove a) the variables with a high percentage of missing values, b) variables with a percentage of records in a single category that was greater than 90%, and c) highly correlated variables. Next, variable screening methods such as random forest and spearman correlation were used to further reduce the variable dimension. Table D1 shows the statistics of the aggregated datasets for all three states. The common crash data fields were selected from all three states and were re-coded to be consistent with the MMUCC schema.
___________________
15Only Iowa and North Carolina provide the crash data with amount of property damage, however, the distributions of such items shows that the vast majority of the property damage costs are less than $10,000, which might be unreliable for analysis/modeling and requires further investigation.
Table D1. Joined Crash Datasets by Bridge Strike Type and Injury Severity
| Type of Bridge Strikes | Injury Severity | State | Grand Total | ||
|---|---|---|---|---|---|
| ME | NC | WI | |||
| On-bridge strikes (e.g., truss, parapet, railing) | K | 0 | 23 | 4 | 27 |
| A | 5 | 22 | 8 | 35 | |
| B | 25 | 113 | 34 | 172 | |
| C | 35 | 180 | 31 | 246 | |
| O | 132 | 647 | 196 | 975 | |
| Total | 197 | 985 | 273 | 1455 | |
| Under-bridge strikes with overhead structure (e.g., girder) | K | 0 | 0 | 0 | 0 |
| A | 1 | 1 | 4 | 6 | |
| B | 0 | 3 | 9 | 12 | |
| C | 4 | 1 | 8 | 13 | |
| O | 108 | 63 | 297 | 468 | |
| Total | 113 | 68 | 318 | 499 | |
| Under-bridge strikes with pier or support (e.g., bent, support, pier, abutment) | K | 0 | 15 | 3 | 18 |
| A | 2 | 4 | 5 | 11 | |
| B | 7 | 15 | 6 | 28 | |
| C | 4 | 17 | 8 | 29 | |
| O | 11 | 37 | 32 | 80 | |
| Total | 24 | 88 | 54 | 166 | |
| Grand Total | 334 | 1141 | 645 | 2120 | |
BrTS Count Model
The HSM best practice is to use the NB crash count modeling method to estimate the number of BrTSs. The form of the bridge SPFs is as follows:
Where:
- Crashesi denotes the estimated bridge strikes at bridge i,
- Structure Length:1) length of the bridge structure for on-bridge strikes (e.g., truss, parapet, railing), or 2) length of the deck for both under-bridge strikes with overhead structure (e.g., girder) and under-bridge strikes with pier or support (e.g., bent, support, pier, abutment),
- n equals the number of years considered for the study (i.e., 5 years),
- AADT is the annual average daily traffic (based on the type of the estimated crash),
- xij is the quantitative measure of each explanatory variable j associated with bridge i,
- α1, and βj are estimated model coefficients for the explanatory variable j, and
- β0 represents the estimated constant.
All variables used in the model development are from the NBI. Three sets of models have been developed with selected structure variables to correspond to each bridge-related crash type. Tables D2 to D4 show the model results of variables that contribute to the number of each bridge-related crash type, including coefficients (estimates), standard errors, and associated p-values (or significance level) of the significant variables.
Table D2. Count Model Results for On-Bridge Strikes
| Parameter | Estimate | Standard Error (S.E) | Pr > z |
|---|---|---|---|
| (Intercept) | -8.2320 | 0.3348 | -- |
| Log of On-bridge Roadway Average Daily Traffic | 0.1933 | 0.0241 | 0.00 |
| Approach Width | -0.0361 | 0.0103 | 0.00 |
| Bridge Age | 0.0108 | 0.0014 | 0.00 |
| Deck Width | 0.0153 | 0.0058 | 0.01 |
| Bypass, Detour Length for the On-Bridge Roadway | -0.0035 | 0.0010 | 0.00 |
| Average Daily Truck Traffic Percentage | 0.0185 | 0.0057 | 0.00 |
| Curb or Sidewalk Widths (Right) of On-Bridge Roadway | -0.1557 | 0.0483 | 0.00 |
| Number of Lanes on the Bridge | -0.0458 | 0.0384 | 0.23 |
| Bridge Serviceability and Functional Obsolescence | -0.0281 | 0.0036 | 0.00 |
| Deck Condition Rating: FAIR CONDITION - all primary structural elements are sound but may have minor section loss, cracking, spalling or scour. | 0.1315 | 0.1015 | 0.20 |
| Deck Condition Rating: SATISFACTORY CONDITION - structural elements show some minor deterioration. | 0.1283 | 0.0851 | 0.13 |
| Deck Condition Rating: GOOD CONDITION - some minor problems. | 0.0842 | 0.0781 | 0.28 |
| Functional Classification of on-Bridge Roadway: Rural Major Collector | 0.1638 | 0.0855 | 0.06 |
| Functional Classification of on-Bridge Roadway: Rural Minor Collector | 0.2018 | 0.1157 | 0.08 |
| Functional Classification of on-Bridge Roadway: Urban Interstate | -0.3444 | 0.0986 | 0.00 |
| State Code: Maine | 0.3863 | 0.1066 | 0.00 |
| State Code: Wisconsin | 0.6750 | 0.0670 | 0.00 |
| Structure Flared: No Flared (Flared = Width of Structure Varies) | 0.4748 | 0.2382 | 0.05 |
| Direction of Traffic: 2-Way Traffic | -0.1935 | 0.0771 | 0.01 |
Table D3. Count Model Results for Under-Bridge Strikes with Overhead Structure
| Parameter | Estimate | S.E. | Pr > z |
|---|---|---|---|
| (Intercept) | -5.3619 | 0.8983 | -- |
| Log of Under-bridge Average Daily Traffic | 0.2555 | 0.0720 | 0.00 |
| Minimum Vertical Underclearance | -0.2903 | 0.1358 | 0.03 |
| Bridge Age | 0.0147 | 0.0045 | 0.00 |
| Functional Classification of Under-Bridge Roadway: Rural Interstate | -0.7722 | 0.2526 | 0.00 |
| Functional Classification of Under-Bridge Roadway: Urban Local | 1.3911 | 0.2581 | 0.00 |
| Total Horizontal Clearance for Under-Bridge Roadway | 0.0313 | 0.0150 | 0.04 |
| Length of Maximum Span of the Bridge | 0.0179 | 0.0057 | 0.00 |
| Minimum Lateral Underclearance on Left | -0.0365 | 0.0101 | 0.00 |
| Average Daily Truck Traffic Percentage of Under-Bridge Roadway | 0.0548 | 0.0169 | 0.00 |
| State Code: Wisconsin | -0.8762 | 0.1951 | 0.00 |
| Number of Lanes under the Bridge | 0.1150 | 0.0500 | 0.02 |
Table D4 Count Model Results for Under-Bridge Strikes with Pier or Support
| Parameter | Estimate | S.E. | Pr > z |
|---|---|---|---|
| (Intercept) | -8.0479 | 1.2357 | -- |
| Log of Under-Bridge Roadway Average Daily Traffic | 0.0391 | 0.0782 | 0.62 |
| Bridge Age | -0.0038 | 0.0040 | 0.35 |
| Number of Lanes under the Bridge | 0.0755 | 0.0439 | 0.09 |
| Length of Maximum Span of the Bridge | -0.0288 | 0.0089 | 0.00 |
| Skew Angle (between the centerline of a pier and the roadway centerline) | 0.0066 | 0.0045 | 0.15 |
| Bypass, Detour Length for the On-Bridge Roadway | -0.0080 | 0.0077 | 0.30 |
| Average Daily Truck Traffic Percentage of Under-Bridge Roadway | 0.1056 | 0.0151 | 0.00 |
| State Code: Wisconsin | -1.0686 | 0.2225 | 0.00 |
| Structure Flared: No Flared (Flared = Width of Structure Varies) | 1.3618 | 1.0152 | 0.18 |
| Functional Classification of Under-Bridge Roadway: Rural Interstate | -0.8065 | 0.2752 | 0.00 |
| Functional Classification of Under-Bridge Roadway: Rural Local | 0.5053 | 0.3716 | 0.17 |
| Functional Classification of Under-Bridge Roadway: Urban Interstate | -0.3664 | 0.2573 | 0.15 |
| Functional Classification of Under-Bridge Roadway: Urban Other Principal Arterial | 0.5539 | 0.2527 | 0.03 |
| Functional Classification of Under-Bridge Roadway: Urban Minor Arterial | 0.7788 | 0.3079 | 0.01 |
| Functional Classification of Under-Bridge Roadway: Urban Local | 0.7444 | 0.3296 | 0.02 |
| Direction of Traffic: 2-Way Traffic | -0.3179 | 0.2411 | 0.19 |
| Route is Part of National Truck Network | 0.3781 | 0.2305 | 0.10 |
Severity Distribution Function (SDF)
The MNL model was chosen as the personal injury severity model. The MNL model can be shown in following equation:
Where:
- Pij is the probability of ith vehicle-bridge strike with jth personal injury severity level outcome;
- Xij denotes the vector of observable factors (variables) for ith vehicle-bridge strike with jth injury severity level;
- αj is the estimated constant;
- βj represents the vector of estimated coefficients.
An important feature of the MNL is that it estimates k-1 models, where k is the number of levels of the dependent variable. In this case, the dependent variable is injury severity level (i.e., k = 5, KABCO scale). In this instance, “No Injury/PDO (O)” is the referent group. Since the parameter estimates are relative to the referent group, the standard interpretation of the MNL model is as follows: for a unit change in the predictor variable, the logit of outcome m relative to the referent group is expected to change by its respective parameter estimate, given the variables in the model are held constant.
Selected variables from both crash data and the NBI are utilized for model development. Table 25 shows brief results including the list of remaining variables that contribute to the injury severity of each crash type.
Table D5. Summary of Crash Injury Severity Models for Bridge Strikes
| Crash Type | Variables Contributing to Injury Severity |
|---|---|
| On-bridge strikes (e.g., truss, parapet, railing) | (Crash Data)
(NBI Data)
|
| Under-bridge strikes with overhead structure (e.g., girder) | (Crash Data) None (NBI Data)
|
| Under-bridge strikes with pier or support (e.g., bent, support, pier, abutment) | (Crash Data)
(NBI Data)
|
Tables D6 to D8 show the model results of variables that contribute to the injury severity of each bridge-related crash type, with coefficients (estimates), standard errors, and associated p-values (or significance level).
Table D6. Crash Injury Severity Model for On-Bridge Strikes
| Injury Severity* | Parameter | Estimate | S.E. | Pr > z |
|---|---|---|---|---|
| K | (Intercept) | -3.1307 | 0.5643 | -- |
| K | Crash Count (On-bridge strikes (e.g., truss, parapet, railing)) | -0.1640 | 0.2124 | 0.44 |
| K | Length of Maximum Span of the Bridge | -0.0466 | 0.0223 | 0.04 |
| K | Curb or Sidewalk Widths (Left) of on-Bridge Roadway | 0.3304 | 0.3309 | 0.32 |
| K | Functional Classification of on-Bridge Roadway: Urban Principal Arterial - Other Freeways or Expressways (base: Principal Arterial – Interstate) | 1.3413 | 0.6319 | 0.03 |
| K | Road Class: Local (base: Interstate) | 1.0658 | 0.5066 | 0.04 |
| K | Horizontal Alignment: Curve (base: Straight) | 1.1950 | 0.4039 | 0.00 |
| K | Vehicle Type: Pickup (base: Passenger Car) | -1.0017 | 0.7447 | 0.18 |
| A | (Intercept) | -2.9952 | 0.4858 | -- |
| A | Crash Count (On-bridge strikes (e.g., truss, parapet, railing)) | -0.5055 | 0.2771 | 0.07 |
| A | Length of Maximum Span of the Bridge | -0.0003 | 0.0114 | 0.98 |
| A | Curb or Sidewalk Widths (Left) of on-Bridge Roadway | 0.5227 | 0.1978 | 0.01 |
| A | Functional Classification of on-Bridge Roadway: Urban Principal Arterial - Other Freeways or Expressways (base: Principal Arterial – Interstate) | 0.5093 | 0.6409 | 0.43 |
| A | Road Class: Local (base: Interstate) | 0.2424 | 0.5514 | 0.66 |
| A | Horizontal Alignment: Curve (base: Straight) | 0.6143 | 0.3715 | 0.10 |
| A | Vehicle Type: Pickup (base: Passenger Car) | -0.3767 | 0.4940 | 0.45 |
| B | (Intercept) | -1.8816 | 0.1755 | -- |
| B | Crash Count (On-bridge strikes (e.g., truss, parapet, railing)) | -0.0092 | 0.0772 | 0.91 |
| B | Length of Maximum Span of the Bridge | 0.0091 | 0.0030 | 0.00 |
| B | Curb or Sidewalk Widths (Left) of on-Bridge Roadway | -0.0982 | 0.1464 | 0.50 |
| B | Functional Classification of on-Bridge Roadway: Urban Principal Arterial - Other Freeways or Expressways (base: Principal Arterial – Interstate) | -0.6656 | 0.4088 | 0.10 |
| B | Road Class: Local (base: Interstate) | -0.6906 | 0.4062 | 0.09 |
| B | Horizontal Alignment: Curve (base: Straight) | 0.1144 | 0.1960 | 0.56 |
| B | Vehicle Type: Pickup (base: Passenger Car) | -0.0384 | 0.2090 | 0.85 |
| C | (Intercept) | -1.1772 | 0.1593 | -- |
| C | Crash Count (On-bridge strikes (e.g., truss, parapet, railing)) | -0.1370 | 0.0745 | 0.07 |
| C | Length of Maximum Span of the Bridge | 0.0051 | 0.0033 | 0.12 |
| C | Curb or Sidewalk Widths (Left) of on-Bridge Roadway | -0.1605 | 0.1330 | 0.23 |
| C | Functional Classification of on-Bridge Roadway: Urban Principal Arterial - Other Freeways or Expressways (base: Principal Arterial – Interstate) | 0.2447 | 0.2609 | 0.35 |
| C | Road Class: Local (base: Interstate) | -0.1208 | 0.2747 | 0.66 |
| C | Horizontal Alignment: Curve (base: Straight) | -0.0229 | 0.1734 | 0.89 |
| C | Vehicle Type: Pickup (base: Passenger Car) | -0.4710 | 0.2024 | 0.02 |
*: Base level is “No Injury/PDO (O)”. Same for all injury severity models
Table D7. Crash Injury Severity Model for Under-Bridge Strikes with Overhead Structure
| Injury Severity | Parameter | Estimate | S.E. | Pr > z |
|---|---|---|---|---|
| K | (Intercept) | -3.7228 | 0.0011 | 0.00 |
| K | Number of Lanes under the Bridge | -0.0392 | 0.0037 | 0.00 |
| K | Skew Angle (between the centerline of a pier and a line normal to the roadway centerline) | 0.0540 | 0.0141 | 0.00 |
| K | Minimum Lateral Underclearance on Right | -0.0096 | 0.0347 | 0.78 |
| K | Appraisal Rating for Underclearances, Vertical and Horizontal: Basically Intolerable Requiring High Priority of Replacement (base: Equal to Present Desirable Criteria) | -0.4338 | 0.0051 | 0.00 |
| K | Minimum Vertical Underclearance | 0.2042 | 0.0064 | 0.00 |
| K | Average Daily Traffic for Under-Bridge Roadway | 0.0001 | 0.0002 | 0.44 |
| K | Total Horizontal Clearance for Under-Bridge Roadway | 0.1420 | 0.0234 | 0.00 |
| A | (Intercept) | 1.0937 | 0.0011 | -- |
| A | Number of Lanes under the Bridge | 0.6565 | 0.0042 | 0.00 |
| A | Skew Angle (between the centerline of a pier and the roadway centerline) | 0.0287 | 0.0192 | 0.14 |
| A | Minimum Lateral Underclearance on Right | -0.2432 | 0.0046 | 0.00 |
| A | Appraisal Rating for Underclearances, Vertical and Horizontal: Basically Intolerable Requiring High Priority of Replacement (base: Equal to Present Desirable Criteria) | 0.4602 | 0.0065 | 0.00 |
| A | Minimum Vertical Underclearance | -1.7132 | 0.0060 | 0.00 |
| A | Average Daily Traffic for Under-Bridge Roadway | -0.0001 | 0.0000 | 0.00 |
| A | Total Horizontal Clearance for Under-Bridge Roadway | 0.1567 | 0.0288 | 0.00 |
| B | (Intercept) | -0.5091 | 0.0009 | -- |
| B | Number of Lanes under the Bridge | 0.1167 | 0.0036 | 0.00 |
| B | Skew Angle (between the centerline of a pier and the roadway centerline) | 0.0210 | 0.0130 | 0.11 |
| B | Minimum Lateral Underclearance on Right | -0.0558 | 0.0041 | 0.00 |
| B | Appraisal Rating for Underclearances, Vertical and Horizontal: Basically Intolerable Requiring High Priority of Replacement (base: Equal to Present Desirable Criteria) | -0.2248 | 0.0054 | 0.00 |
| B | Minimum Vertical Underclearance | -0.0307 | 0.0055 | 0.00 |
| B | Average Daily Traffic for Under-Bridge Roadway | 0.0001 | 0.0000 | 0.03 |
| B | Total Horizontal Clearance for Under-Bridge Roadway | 0.0412 | 0.0197 | 0.04 |
| C | (Intercept) | -0.3123 | 0.0017 | -- |
| C | Number of Lanes under the Bridge | 0.0927 | 0.0072 | 0.00 |
| C | Skew Angle (between the centerline of a pier and the roadway centerline) | -0.0002 | 0.0148 | 0.99 |
| C | Minimum Lateral Underclearance on Right | 0.0962 | 0.0372 | 0.01 |
| C | Appraisal Rating for Underclearances, Vertical and Horizontal: Basically Intolerable Requiring High Priority of Replacement (base: Equal to Present Desirable Criteria) | -0.3483 | 0.0065 | 0.00 |
| C | Minimum Vertical Underclearance | 0.1792 | 0.0106 | 0.00 |
| C | Average Daily Traffic for Under-Bridge Roadway | 0.0001 | 0.0001 | 0.79 |
| C | Total Horizontal Clearance for Under-Bridge Roadway | -0.0716 | 0.0224 | 0.00 |
Table D8. Crash Injury Severity Model for Under-Bridge Strikes with Pier or Support
| Injury Severity | Parameter | Estimate | S.E. | Pr > z |
|---|---|---|---|---|
| A | (Intercept) | 11.6279 | 7.3543 | -- |
| A | Number of Lanes under the Bridge | 1.0427 | 0.5696 | 0.07 |
| A | Length of Maximum Span of the Bridge | -0.6043 | 0.2794 | 0.03 |
| A | Minimum Lateral Underclearance on Right | 1.9576 | 0.8526 | 0.02 |
| A | Minimum Vertical Underclearance | -3.7655 | 1.7734 | 0.03 |
| A | Bypass, Detour Length for the Under-Bridge Roadway | 0.1317 | 0.0797 | 0.10 |
| A | Average Daily Truck Traffic Percentage | -0.4318 | 0.2613 | 0.10 |
| A | Functional Classification of on-Bridge Roadway: Urban Principal Arterial - Other Freeways or Expressways (base: Principal Arterial – Interstate) | -1.5467 | 1.9248 | 0.42 |
| A | Road Class: Arterial (base: Interstate) | 3.6673 | 1.8941 | 0.05 |
| A | Horizontal Alignment: Curve (base: Straight) | 3.9914 | 1.5333 | 0.01 |
| A | Appraisal Rating for Underclearances, Vertical and Horizontal: Basically Intolerable Requiring High Priority of Replacement (base: Equal to Present Desirable Criteria) | 1.8557 | 1.6719 | 0.27 |
| B | (Intercept) | -4.6340 | 2.5186 | -- |
| B | Number of Lanes under the Bridge | -0.2456 | 0.1763 | 0.16 |
| B | Length of Maximum Span of the Bridge | 0.0717 | 0.0484 | 0.14 |
| B | Minimum Lateral Underclearance on Right | 0.0569 | 0.1657 | 0.73 |
| B | Minimum Vertical Underclearance | -0.3244 | 0.5976 | 0.59 |
| B | Bypass, Detour Length for the Under-Bridge Roadway | 0.0020 | 0.0392 | 0.96 |
| B | Average Daily Truck Traffic Percentage of Under-Bridge Roadway | 0.1368 | 0.0550 | 0.01 |
| B | Functional Classification of on-Bridge Roadway: Urban Principal Arterial - Other Freeways or Expressways (base: Principal Arterial – Interstate) | 0.6350 | 1.1742 | 0.59 |
| B | Road Class: Arterial (base: Interstate) | -0.4793 | 0.8844 | 0.59 |
| B | Horizontal Alignment: Curve (base: Straight) | 0.9100 | 1.2656 | 0.47 |
| B | Appraisal Rating for Underclearances, Vertical and Horizontal: Basically Intolerable Requiring High Priority of Replacement (base: Equal to Present Desirable Criteria) | 2.1656 | 0.9147 | 0.02 |
| C | (Intercept) | -2.0784 | 1.8301 | -- |
| C | Number of Lanes under the Bridge | -0.6789 | 0.3982 | 0.09 |
| C | Length of Maximum Span of the Bridge | 0.0939 | 0.0475 | 0.05 |
| C | Minimum Lateral Underclearance on Right | -0.4547 | 0.3199 | 0.16 |
| C | Minimum Vertical Underclearance | -0.2171 | 0.4327 | 0.62 |
| C | Bypass, Detour Length for the Under-Bridge Roadway | 0.0753 | 0.0306 | 0.01 |
| C | Average Daily Truck Traffic Percentage of Under-Bridge Roadway | 0.0226 | 0.0786 | 0.77 |
| C | Functional Classification of on-Bridge Roadway: Urban Principal Arterial - Other Freeways or Expressways (base: Principal Arterial – Interstate) | 4.3206 | 1.3313 | 0.00 |
| C | Road Class: Arterial (base: Interstate) | -0.9617 | 0.8892 | 0.28 |
| C | Horizontal Alignment: Curve (base: Straight) | 0.9659 | 1.3386 | 0.47 |
| C | Appraisal Rating for Underclearances, Vertical and Horizontal: Basically Intolerable Requiring High Priority of Replacement (base: Equal to Present Desirable Criteria) | -1.8108 | 1.5514 | 0.24 |
After obtaining the SPFs and SDFs, the equations associated with significant risk factors can be used to predict the crash frequency and the probabilities of each injury severity. For SPFs, all risk factors come from structure data (in this study it is NBI) that are available for that individual structure. For SDFs, most of the variables in the injury severity model still come from structure data (in this study is NBI), but the use of variables that come from crash data can be a bit tricky. For example, in the injury severity model for on-bridge strikes, “Vehicle Type: Pickup (base: Passenger Car)” is a significant variable. The viable solution is to calculate the probabilities for both scenarios – with and without the presence of a pickup – and then compute the average probabilities or the composite probabilities based on the percentage of pickup traffic for that structure. The next step is to combine the results from the SPFs and SDFs for each structure to obtain the predicted crash frequency by injury severity.
Further analysis could be conducted to retrieve the impact of BrTS in terms of the monetarized value of the comprehensive costs of the crash, transportation agencies (structure owner), and road users. This analysis would be completed by considering the local crash-related costs, or by using the Crash Costs for Highway Safety Analysis by FHWA (Harmon, Bahar, and Gross 2018) when the local value is not available. It is also recommended that more advanced modeling techniques such as the hurdle-NB (HNB) and zero inflated-negative binomial be applied to address the data-overdispersion issue caused by excessive zero counts.


