Effects of Past Global Change on Life (1995)
Chapter: MAPS OF CHANGING TAXON DISTRIBUTION THROUGH TIME
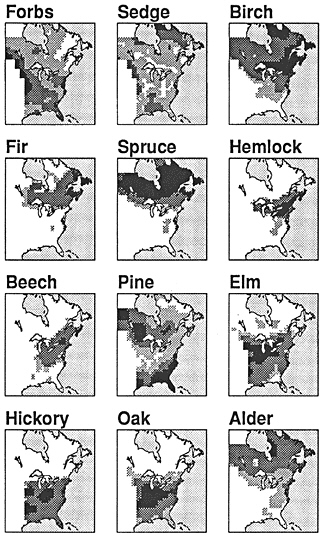
FIGURE 13.3 Maps (from Webb et al., 1993) with contours of equal pollen frequency that show the current distribution for 9 pollen types. For forbs (Artemisia, other Compositae excluding Ambrosia, and Chenopodiaceae/Amaranthaceae), sedge (Cyperaceae), birch (Betula), spruce (Picea), and alder (Alnus), black areas are >20%, dark gray 5-20%, and light gray 1-5%. For oak (Quercus) and pine (Pinus), the values are >40%, 20- 40%, and 5-20%. For fir (Abies), hemlock (Tsuga), beech (Fagus), and hickory (Carya), the values are >5%, dark gray 1-5%, and light gray 0.5-1%.
America, for example, maps for 12 major pollen categories record the patterns of the major formations from the western prairie into the eastern forests and from the northern tundra into the southeastern pine-oak forest (Figures 13.2 and 13.3). At this scale, the major vegetation gradients are aligned with temperature and moisture gradients. The pollen maps show not only the pattern of the major plant assemblages (i.e., formations) but also the steepness and position of the ecotones between them. The maps also show the changes in species composition not only among but within the major plant assemblages. Within the mixed forest, for example, a gradient exists between the dominance of birch, beech, and hemlock in the east and the dominance of pine in the west. Other mapping studies show similar ability of pollen to record vegetational patterns at state and county levels in support of the general picture shown in Figure 13.1 (Webb, 1974; Webb et al., 1983; Bradshaw and Webb, 1985; Jackson, 1991). At these spatial scales, the vegetation patterns reflect differences in soils, topography, and disturbance history as well as climate gradients. Pollen data can therefore give a zoom lens view of the vegetation when spatial arrays of the samples are properly organized (Figure 13.1). By being sensitive to vegetation at various spatial scales, the pollen data are also sensitive to a variety of factors affecting the vegetation from climate at the continental scale down to disturbance history and patch dynamics at local sites (Figure 13.2; Delcourt et al., 1983; McDowell et al., 1990).
MAPS OF CHANGING TAXON DISTRIBUTION THROUGH TIME
Time sequence maps for the past 18,000 yr show where and when the modern patterns and vegetational regions developed. Webb (1988) and Jacobson et al. (1987) used time series of maps such as those in Figure 13.4 to infer that the modern boreal forest, for example, with its coincident patterns of spruce, birch, and alder, developed only after 6000 yr ago (ka). From 18 to 12 ka in the area south of the ice sheet between treeless boreal vegetation and pine-dominated mixed forests, spruce, sedge, and sagebrush pollen co-occurred, indicating widespread growth of a spruce parkland. From 11 to 7 ka, transitional forests near the ice front were dominated first by spruce and later by birch populations. Considerable compositional and structural change therefore occurred in the regions where spruce trees grew, and the modern boreal forest was one outcome of these changes. Similar types of sequences of compositional change occurred for other modern plant assemblages (Davis, 1983). Webb (1988) used time series of maps like those in Figure 13.4 to infer that the modern deciduous forests developed by 12 ka; prairie and tundra by about 10 ka; mixed forest with beech, birch, and hemlock after 8 ka; and the southeastern pine-oak forest after 8 ka. Maps of European vegetation for the past 12,000 yr illustrate similar types of broad-scale changes in the abundance, location, and association of taxa, with consequent changes in vegetational assemblages (Huntley, 1990). In the western United States, where low regional site density and topographic complexity have thus far precluded mapping studies, the data also show individualistic changes among taxa (Thompson, 1988). In each of these regions,
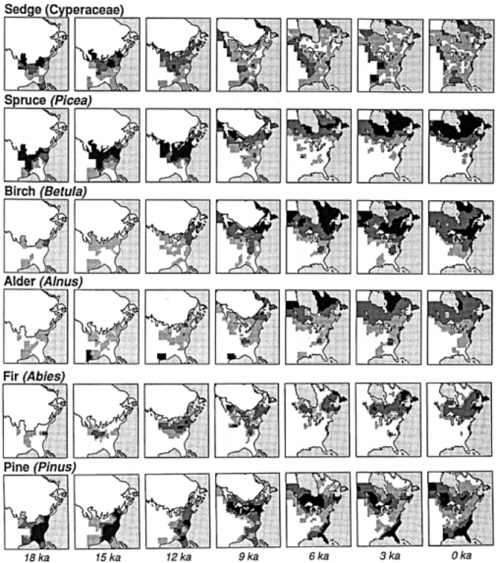
FIGURE 13.4 Maps of pollen frequency for sedge (Cyperaceae), spruce (Picea), birch (Betula), alder (Alnus), fir (Abies), and pine (Pinus) from 18 ka to present (0 ka). For all taxa but fir, black areas are >20%, dark gray 5-20%, and light gray 1-5%. For fir, black are >5%, dark gray 1-5%, and light gray 0.5-1%.

