Pathways to Reduce Child Poverty: Impacts of Federal Tax Credits (2026)
Chapter: Appendix D: Demographic Portrait of Child Poverty in the United States
Appendix D
Demographic Portrait of Child Poverty in the United States
Child poverty has lasting negative consequences for children, including greater risk of food insecurity, poor health, developmental delays, lower educational achievement, and adverse health consequences in adulthood. Beyond harming children and families directly, child poverty imposes broader societal costs by lowering economic productivity and increasing demands on the educational, criminal justice, and health care systems (National Academies, 2019, 2024).
While child poverty affects many families, certain groups—including children living in single-parent families, children whose parents have low educational attainment, and Black, Hispanic, and American Indian/Alaska Native children—are significantly more likely to experience poverty than children in two-parent families, children with more highly educated parents, or non-Hispanic White and Asian children. These disparities1 are large and persistent (U.S. Census Bureau and U.S. Bureau of Labor Statistics’ Current Population Survey, Annual Social and Economic Supplement [CPS ASEC], various years data; National Academies, 2019) and often associated with differences in parental human capital (e.g., education), employment status and job quality (e.g., low-wage sector jobs), and eligibility for antipoverty programs (U.S. Census Bureau and U.S. Bureau of Labor Statistics’ Current Population Survey, Annual Social and Economic Supplement [CPS ASEC], various years data; Meyer & Sullivan, 2003).
This appendix examines how child poverty varies by demographic and socioeconomic subgroups, as directed by the committee’s statement
___________________
1Disparities are group-based average differences in outcomes (National Academies, 2019).
of task. This analysis uses data from the Transfer Income Model version 3 (TRIM3)—provided to the committee and by the Urban Institute and other consultants (discussed in more detail in Chapters 3, 4, and 9). Examining the system-level factors that contribute to child poverty is beyond the scope of this report. See the 2024 National Academies of Sciences, Engineering, and Medicine (National Academies) report Reducing Intergenerational Poverty for an examination of key historical and contemporary drivers of long-term intergenerational poverty (National Academies, 2024, pp. 61–62).2
DEMOGRAPHIC CONTEXT
The U.S. population is changing. According to Census Bureau data, in 1990 about 70% of U.S. children were non-Hispanic White; today only about half of children are non-Hispanic White (U.S. Census Bureau, 1993, 2020). By 2025, the Census Bureau predicts that White non-Hispanic children will make up less than 50% of the child population, and by 2060, they are expected to be less than 40% (Census Bureau, 2020). Conversely, the Hispanic child population increased from 12% in 1990 to 25% today—and is projected to reach 32% by 2060 (Census Bureau, 1993, 2020; National Academies, 2019).
To provide context for examining variation in the effects of the Earned Income Tax Credit (EITC) and Child Tax Credit (CTC) in 2021 (Chapter 8) and the options to enhance these policies’ antipoverty effects (Chapter 9), this appendix presents an overview of child poverty by subgroup, as directed by the committee’s charge. It focuses on two years: 2018—a non-COVID-19 pandemic (hereafter, “pandemic”) year, which is used to evaluate tax credit policy options—and 2021, which is used to evaluate the effects of the tax credits during the pandemic. Appendixes I and J include detailed effects by subgroup for the policies considered in Chapters 8 and 9.
It is important to examine the demography of child poverty in a nonpandemic year because both poverty levels and disparities in child poverty
___________________
2Reducing Intergenerational Poverty (National Academies, 2024) examines the histories, practices, and contexts that limit the intergenerational mobility of American children. As described in that report, “The evidence reviewed points to historical and contemporary racism as a driving factor in intergenerational economic outcomes. For example, in comparison with other advanced countries, the United States has a relatively weak social safety net, which limits the resources available for reducing intergenerational poverty. This weak welfare state is due in part to greater racial polarization in the United States and racist stereotypes of non-White people (Alesina et al., 2001; Fox, 2012). Many mechanisms of structural racism can be found in an array of institutional arrangements and public policy choices of the past and present (e.g., Baker & O’Connell, 2022), although the magnitude of the effects of such choices is unknown. Because racial disparities in intergenerational poverty were, in part, a product of past policy choices, future policy choices may help to reduce current and future disparities” (National Academies, 2024, pp. 61–62).
were much lower during the pandemic. As discussed in Chapter 8, the pandemic demonstrated the effectiveness of policy to reduce child poverty substantially overall and for many subgroups that had historically experienced very high child poverty. However, child poverty rates and disparities by subgroup returned to pre-pandemic levels after pandemic relief measures expired.
During nonpandemic years, the effectiveness of antipoverty programs varies by subgroup. Using TRIM3 data, the 2019 National Academies report A Roadmap to Reducing Child Poverty concluded that the antipoverty policy options considered in that report would generate disparate impacts across population subgroups. Although virtually all the options would reduce poverty across subgroups, Hispanic children and immigrant children would benefit relatively less (Lee et al., 2024; National Academies, 2019). Similarly, in a study of racial and ethnic disparities in the child poverty gap, Lee et al. (2024) found that in 2022, Black children benefited more than other subgroups from in-kind transfer programs, while White children benefited more from cash transfer programs. Hispanic children benefited the least from both types of transfer programs (Lee et al., 2024).
As discussed in Chapter 8, in 2021, the EITC, CTC, and other pandemic programs reduced child poverty rates overall and across subgroups. Poverty reduction was larger for some subgroups, partly due to the differential effects of changes to antipoverty programs during the pandemic. The statement of task did not direct the committee to identify the family-level or system-level factors that drive differences in the effectiveness of antipoverty programs. However, based on eligibility rules and subgroup characteristics, informed inferences can be made. For example, the American Rescue Plan Act of 2021 (ARPA) CTC Expansion eliminated the minimum earnings requirement of $2,500, which previously applied to the refundable portion of the CTC, allowing more children in families below the poverty line to receive the full credit. This had a greater beneficial impact on children more likely to live in families with no or very low earnings—such as Black and Hispanic children compared to White children, and those in single-parent households compared to two-parent households (Wimer et al., 2022).
On the other hand, Social Security Number (SSN) eligibility requirements for the EITC and CTC did not change during the pandemic, likely affecting Hispanic children. Hispanic children are more likely than other children to live in immigrant families, particularly in mixed-status families with undocumented members without SSNs, who have limited eligibility for antipoverty programs (Acevedo-Garcia et al., 2022).
This appendix examines differences in poverty rates between subgroups by family characteristics discussed in Chapters 8 and 9. While child poverty declined for most subgroups in 2021, disparities persisted. The analysis also examines the composition of children in poverty, which differs from the
overall child population. Some groups are disproportionately represented, reflecting differences in parental human capital, employment, and program eligibility rules that affect subgroups differently. During the pandemic, child poverty declined across most subgroups, along with shifts in the overrepresentation and underrepresentation of certain groups of children.
CHILD POVERTY RATES BY SUBGROUP
Table D-1 presents the total child population, the child population in poverty, the child poverty rate, and the composition of children in poverty (in numbers and percent distribution) for subgroups identified in the committee’s statement of task—family structure, family socioeconomic characteristics, residential location, race and ethnicity, nativity and citizenship/immigration status in both 2018 and 2021 using TRIM3 data. The narrative in this appendix focuses on child poverty by family composition (i.e., marital status of parents), work status of household members, race and ethnicity, and immigration and citizenship status. These characteristics were selected because they are commonly linked to child poverty in research and show large disparities in child poverty rates across subgroups. These disparities highlight groups of children who, due to system-level and family factors, as well as differences in program eligibility and effectiveness, have experienced—and continue to experience—very high poverty rates.
As shown in Table D-1, both in 2018 and 2021 the child poverty rate varied substantially across subgroups by family structure, family socioeconomic characteristics, place, race and ethnicity, and nativity and citizenship/immigration status. The discussion highlights family characteristics associated with large differences in poverty rates across subgroups. Compared to 2018, in 2021, poverty declined across subgroups. Some subgroups with high poverty rates in 2018 benefited from the CTC’s expanded eligibility and higher benefits, but as shown in Chapter 8, other pandemic programs also lowered their poverty rates.
For both 2018 and 2021, Table D-2 shows poverty rate gaps by subgroup for each family characteristic. The poverty rate gap is the difference, in percentage points, between the poverty rate of a given subgroup and that of the subgroup with the lowest poverty rate in 2018. In general, poverty rate gaps narrowed in 2021 compared to 2018.
Family Composition
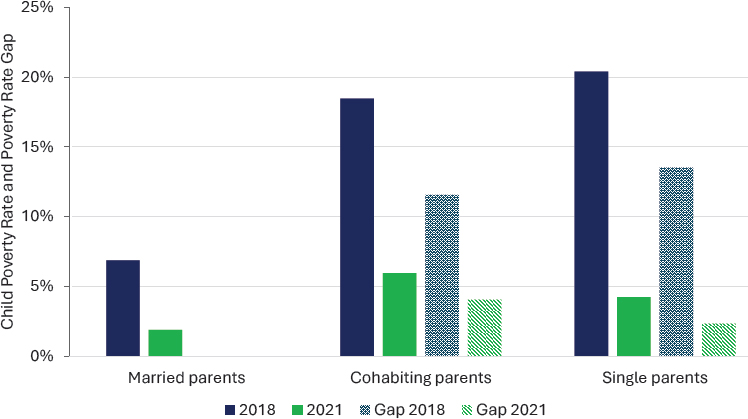
As shown in Figure D-1, based on TRIM3, in 2018 children in single-parent families had much higher poverty rates (20.4%) than those in families with married parents (6.9%) and somewhat higher than those with cohabiting parents (18.4%). In contrast, in 2021, the child poverty rate was
| 2018 | 2021 | |||||||||
|---|---|---|---|---|---|---|---|---|---|---|
| Total child population # | Total child population % | Child poverty rate | Children in poverty # | Children in poverty % | Total child population # | Total child population % | Child poverty rate | Children in poverty # | Children in poverty % | |
| All Children | 73,793 | 100% | 11.1% | 8,159 | 100% | 73,467 | 100% | 2.8% | 2,055 | 100% |
| Child’s Age | ||||||||||
| <6 | 23,733 | 32% | 11.4% | 2,699 | 33% | 22,538 | 31% | 2.8% | 623 | 30% |
| 6 to 17 | 50,060 | 68% | 10.9% | 5,460 | 67% | 50,929 | 69% | 2.8% | 1,432 | 70% |
| Number of Children in SPM Unit | ||||||||||
| 1 | 16,950 | 23% | 11.9% | 2,024 | 25% | 17,565 | 24% | 4.5% | 786 | 38% |
| 2 | 28,914 | 39% | 9.1% | 2,627 | 32% | 28,113 | 38% | 2.5% | 700 | 34% |
| 3+ | 27,930 | 38% | 12.6% | 3,509 | 43% | 27,789 | 38% | 2.1% | 570 | 28% |
| Age of Mother, Father, or Unit Heada | ||||||||||
| <25 | 2,626 | 4% | 18.1% | 476 | 6% | 2,246 | 3% | 5.4% | 121 | 6% |
| 25 to 34 | 21,807 | 30% | 12.4% | 2,700 | 33% | 20,152 | 27% | 3.2% | 650 | 32% |
| 35+ | 49,228 | 67% | 9.9% | 4,890 | 60% | 50,964 | 69% | 2.4% | 1,206 | 59% |
| Race/Ethnicity | ||||||||||
| White-only (non-Hispanic) | 36,863 | 50% | 5.7% | 2,118 | 26% | 36,125 | 49% | 1.1% | 404 | 20% |
| Black-only (non-Hispanic) | 10,161 | 14% | 15.8% | 1,607 | 20% | 10,245 | 14% | 3.0% | 311 | 15% |
| 2018 | 2021 | |||||||||
|---|---|---|---|---|---|---|---|---|---|---|
| Total child population # | Total child population % | Child poverty rate | Children in poverty # | Children in poverty % | Total child population # | Total child population % | Child poverty rate | Children in poverty # | Children in poverty % | |
| Hispanic | 18,878 | 26% | 19.3% | 3,639 | 45% | 18,820 | 26% | 6.2% | 1,162 | 57% |
| Asian/Pacific Islander (non-Hispanic) | 4,097 | 6% | 10.6% | 436 | 5% | 4,243 | 6% | 2.8% | 119 | 6% |
| Other (non-Hispanic)b | 3,794 | 5% | 9.5% | 359 | 4% | 4,034 | 5% | 1.5% | 59 | 3% |
| Metropolitan/Non-Metropolitan Area | ||||||||||
| Inside metropolitan area | 64,132 | 87% | 11.4% | 7,308 | 90% | 63,904 | 87% | 2.9% | 1,877 | 91% |
| Outside metropolitan area | 8,962 | 12% | 9.0% | 804 | 10% | 8,875 | 12% | 1.9% | 164 | 8% |
| Metropolitan status not disclosed | 699 | 1% | 6.8% | 47 | 1% | 688 | 1% | 2.0% | 14 | 1% |
| Census Division | ||||||||||
| New England | 2,925 | 4% | 8.2% | 239 | 3% | 2,926 | 4% | 3.2% | 94 | 5% |
| Middle Atlantic | 8,677 | 12% | 10.4% | 900 | 11% | 8,796 | 12% | 2.9% | 254 | 12% |
| East North Central | 10,557 | 14% | 7.2% | 757 | 9% | 10,426 | 14% | 1.0% | 101 | 5% |
| West North Central | 5,022 | 7% | 5.8% | 294 | 4% | 5,034 | 7% | 1.5% | 75 | 4% |
| South Atlantic | 14,123 | 19% | 13.3% | 1,874 | 23% | 14,130 | 19% | 3.5% | 491 | 24% |
| East South Central | 4,317 | 6% | 11.1% | 478 | 6% | 4,328 | 6% | 2.1% | 91 | 4% |
| West South Central | 10,183 | 14% | 13.3% | 1,354 | 17% | 10,235 | 14% | 4.4% | 446 | 22% |
| Mountain | 5,884 | 8% | 9.3% | 549 | 7% | 5,898 | 8% | 2.6% | 152 | 7% |
| Pacific | 12,105 | 16% | 14.2% | 1,715 | 21% | 11,694 | 16% | 3.0% | 349 | 17% |
| Family Compositionc | ||||||||||
| Married parents (both bio and adoptive) | 44,191 | 60% | 6.7% | 2,968 | 36% | 44,194 | 60% | 1.9% | 855 | 42% |
| Married parents (at least one step) | 4,220 | 6% | 8.2% | 346 | 4% | 3,808 | 5% | 1.3% | 49 | 2% |
| Two unmarried cohabiting biological/adoptive parents | 2,682 | 4% | 18.4% | 495 | 6% | 3,019 | 4% | 6.0% | 180 | 9% |
| Biological/adoptive parent with cohabiting partner | 2,806 | 4% | 12.1% | 340 | 4% | 3,006 | 4% | 2.6% | 79 | 4% |
| Single bio/adoptive parent | 16,447 | 22% | 20.4% | 3,352 | 41% | 16,306 | 22% | 4.2% | 691 | 34% |
| Living with other relatives (including grandparent, stepparent only, other relatives) | 2,953 | 4% | 18.1% | 535 | 7% | 2,658 | 4% | 4.9% | 129 | 6% |
| Living with non-relatives | 493 | 1% | 25.0% | 123 | 2% | 477 | 1% | 15.0% | 71 | 3% |
| 2018 | 2021 | |||||||||
|---|---|---|---|---|---|---|---|---|---|---|
| Total child population # | Total child population % | Child poverty rate | Children in poverty # | Children in poverty % | Total child population # | Total child population % | Child poverty rate | Children in poverty # | Children in poverty % | |
| Employment Status of Adults in Unitd | ||||||||||
| 1+ full-year, full-time workers | 61,111 | 83% | 5.9% | 3,596 | 44% | 59,764 | 81% | 1.1% | 661 | 32% |
| 1+ part-time or part-year workers (and no adult who works full time for the full year) | 8,781 | 12% | 24.1% | 2,118 | 26% | 9,499 | 13% | 5.5% | 523 | 25% |
| No workers | 3,900 | 5% | 62.7% | 2,445 | 30% | 4,204 | 6% | 20.7% | 871 | 42% |
| Unit has nonelderly member with disabilitye | ||||||||||
| 1+ members with disability | 7,032 | 10% | 25.7% | 1,806 | 22% | 6,268 | 9% | 5.0% | 313 | 15% |
| No members with disability | 66,761 | 90% | 9.5% | 6,353 | 78% | 67,199 | 91% | 2.6% | 1,742 | 85% |
| Education of Mother, Father, or Unit Headf | ||||||||||
| Less than high school | 8,197 | 11% | 28.9% | 2,368 | 29% | 7,236 | 10% | 9.5% | 689 | 34% |
| High-school graduate/GED | 17,384 | 24% | 15.9% | 2,769 | 34% | 17,578 | 24% | 3.3% | 583 | 28% |
| Some college | 19,986 | 27% | 9.3% | 1,853 | 23% | 18,700 | 25% | 1.7% | 327 | 16% |
| Bachelors degree or more | 28,095 | 38% | 3.8% | 1,075 | 13% | 29,848 | 41% | 1.3% | 378 | 18% |
| Unit participates in major safety net program (not counting tax credit) | ||||||||||
| At least one unit member participates in major safety net programg | 33,820 | 46% | 21.4% | 7,250 | 89% | 33,038 | 45% | 4.9% | 1,623 | 79% |
| No member participates in major safety net program | 39,973 | 54% | 2.3% | 909 | 11% | 40,429 | 55% | 1.1% | 432 | 21% |
| Child’s Health Insurance | ||||||||||
| Has private | 45,063 | 61% | 4.0% | 1,809 | 22% | 44,915 | 61% | 1.0% | 472 | 23% |
| Has public (no private) | 24,136 | 33% | 23.2% | 5,592 | 69% | 22,736 | 31% | 4.8% | 1,097 | 53% |
| Uninsured | 4,594 | 6% | 16.5% | 758 | 9% | 5,816 | 8% | 8.4% | 486 | 24% |
| Child and Parent or Unit Head Nativityh | ||||||||||
| Child is U.S. born: | ||||||||||
| With immigrant parent/head | 17,357 | 24% | 18.1% | 3,147 | 39% | 16,784 | 23% | 5.4% | 904 | 44% |
| With U.S.-born parent/head | 53,575 | 73% | 8.0% | 4,275 | 52% | 53,915 | 73% | 1.2% | 635 | 31% |
| Child is foreign born: | ||||||||||
| With parent/headi | 2,729 | 4% | 23.6% | 644 | 8% | 2,663 | 4% | 16.5% | 438 | 21% |
| Citizenship/Legal Status of Unit Membersj | ||||||||||
| Child is a citizen: | ||||||||||
| All unit members are citizens | 59,415 | 81% | 8.2% | 4,856 | 60% | 59,557 | 81% | 1.3% | 751 | 37% |
| 2018 | 2021 | |||||||||
|---|---|---|---|---|---|---|---|---|---|---|
| Total child population # | Total child population % | Child poverty rate | Children in poverty # | Children in poverty % | Total child population # | Total child population % | Child poverty rate | Children in poverty # | Children in poverty % | |
| Unit contains undocumented immigrant | 5,038 | 7% | 30.0% | 1,512 | 19% | 5,039 | 7% | 12.8% | 643 | 31% |
| Unit contains recent immigrantk | 1,309 | 2% | 17.7% | 232 | 3% | 1,278 | 2% | 4.2% | 54 | 3% |
| Unit contains other noncitizenl | 5,822 | 8% | 16.6% | 965 | 12% | 5,355 | 7% | 3.0% | 163 | 8% |
| Child is a noncitizen: | ||||||||||
| Unit contains undocumented immigrant | 912 | 1% | 38.0% | 346 | 4% | 1,113 | 2% | 31.0% | 345 | 17% |
| Unit contains recent immigrantk | 697 | 1% | 24.1% | 168 | 2% | 591 | 1% | 10.7% | 63 | 3% |
| Unit contains other noncitizenl | 599 | 1% | 13.4% | 80 | 1% | 533 | 1% | 6.7% | 36 | 2% |
| Child and Parent or SPM Unit Head Nativity | ||||||||||
| Child in nonimmigrant familym | 53,675 | 73% | 8.1% | 4,341 | 53% | 54,003 | 74% | 1.3% | 701 | 34% |
| Child in immigrant family | 20,118 | 27% | 19.0% | 3,818 | 47% | 19,464 | 26% | 7.0% | 1,354 | 66% |
| Citizenship/Legal Status of SPM Unit Members | ||||||||||
| Child in all-citizen family | 59,415 | 81% | 8.2% | 4,856 | 60% | 59,557 | 81% | 1.3% | 751 | 37% |
| Child in mixed-status family | 14,378 | 19% | 23.0% | 3,303 | 40% | 13,910 | 19% | 9.4% | 1,304 | 63% |
Citizen child in mixed-status familyn | 12,169 | 16% | 22.3% | 2,708 | 33% | 11,672 | 16% | 7.4% | 861 | 42% |
Citizen child in mixed-status family with undocumented member | 5,038 | 7% | 30.0% | 1,512 | 19% | 5,039 | 7% | 12.8% | 643 | 31% |
Noncitizen child in mixed-status familyo | 2,208 | 3% | 26.9% | 595 | 7% | 2,238 | 3% | 19.8% | 444 | 22% |
Noncitizen child in family with undocumented member | 912 | 1% | 38.0% | 346 | 4% | 1,113 | 2% | 31.0% | 345 | 17% |
NOTES: For each subgroup, the Total Child Population is the number of children <18 in that subgroup (in thousands); the Total Population % is the share (percentage) that a subgroup represents of the U.S. total child population; Children in Poverty # is the number of children in poverty (<100% SPM) in that subgroup; Children in Poverty % is the share (percentage) that a subgroup represents of the U.S. total population of children in poverty; the Child Poverty Rate is the number of children in poverty in that subgroup as a percentage of the total number of children in that subgroup.
a These rows reflect the characteristics of the biological, adoptive, or stepmother (if present), else the biological, adoptive, or stepfather (if present). If neither the father nor mother is present, then the characteristics of the SPM unit head are used, unless the child is the unit head, spouse, or cohabiting partner, in which case the child is excluded from these rows.
b The “other” race category includes non-Hispanic children who are American Indian or Alaska Natives or report more than one race.
c A child is placed in the first row that applies to his or her family (based on the presence of the child’s own parent or parents, regardless of whether they are the head of the SPM unit).
d These rows reflect the work status of persons aged 18 or older in the SPM poverty unit. “Full-year” is classified as 50 weeks or more, and “full-time” is classified as 35 hours per week or more. Children in units without adults (i.e., those aged 15 to 17 living without parents or caretakers) are included in the “no workers” row.
e A child is classified as being in an SPM poverty unit with a person with a disability if there is at least one person in the unit who is younger than 65 and is identified as disabled according to the definition used when determining Supplemental Security Income eligibility.
f These rows reflect the characteristics of the child’s biological, adoptive, or stepmother (if present), else the biological, adoptive, or stepfather (if present). If neither the father nor mother is present, then the characteristics of the SPM unit head are used, unless the child is the unit head, spouse, or cohabiting partner, in which case, the child is excluded from these rows.
g At least one member of the SPM poverty unit receives SNAP, Medicaid, CHIP, TANF or GA, SSI, or public and subsidized housing.
h If a child has at least one biological, adoptive, or stepparent that was born in another country, the child is classified as having an immigrant parent. Persons born abroad to American parents are counted as native born. If a child does not have a parent present, the immigrant status of the unit head and the unit head’s spouse are used, unless the child is the unit head, spouse, or cohabiting partner, in which case the child is excluded from these rows.
i Parent/head means that a child lives with a parent or guardian. If a child is foreign born, this table does not make a distinction between living with a native-born or foreign-born parent/head (nearly all foreign-born children have at least one foreign-born parent).
j The child is placed in the first row that applies. Citizens include both native-born and naturalized citizens.
k A “recent immigrant” is defined as a person entering as a legal permanent resident within the last 5 years.
l An “other noncitizen” includes noncitizens not classified as undocumented or recent. These include legal permanent residents who have been in the United States for more than 5 years, refugees/asylees, and “temporary residents”—noncitizens legally admitted to the United States for a specified period and for a specified purpose, such as students, guest workers, intracompany transfers, diplomats, and au pairs.
m A child is classified as being in a nonimmigrant family if the child is native born and any parent(s) present in the household are native born. If the child’s parents are not in the household, then a native-born child is classified as in a nonimmigrant family if the head and spouse (if present) of the SPM poverty unit are native born. Individuals who report that they were “born abroad to American parents” are counted as “native born.”
n A citizen child is classified as being in a mixed-status family if there is at least one noncitizen in the SPM unit.
o All noncitizen children are classified as being in mixed-status families.
TABLE D-2 Child Poverty Rates and Child Poverty Rate Gaps by Subgroup (SPM<100%), 2018 and 2021
| Child poverty rate - 2018 | Child poverty rate gap - 2018 | Child poverty rate - 2021 | Child poverty rate gap - 2021 | |
|---|---|---|---|---|
| All Children | 11.1% | 2.8% | ||
| Child’s Age | ||||
| <6 | 11.4% | 0.5% | 2.8% | 0.0% |
| 6 to 17 | 10.9% | 0.0% | 2.8% | 0.0% |
| Number of Children in SPM Unit | ||||
| 1 | 11.9% | 2.9% | 4.5% | 2.0% |
| 2 | 9.1% | 0.0% | 2.5% | 0.0% |
| 3+ | 12.6% | 3.5% | 2.1% | -0.4% |
| Child poverty rate - 2018 | Child poverty rate gap - 2018 | Child poverty rate - 2021 | Child poverty rate gap - 2021 | |
| Age of Mother, Father, or Unit Heada | ||||
| <25 | 18.1% | 8.2% | 5.4% | 3.0% |
| 25 to 34 | 12.4% | 2.4% | 3.2% | 0.9% |
| 35+ | 9.9% | 0.0% | 2.4% | 0.0% |
| Race/Ethnicity | ||||
| White-only (non-Hispanic) | 5.7% | 0.0% | 1.1% | 0.0% |
| Black-only (non-Hispanic) | 15.8% | 10.1% | 3.0% | 1.9% |
| Hispanic | 19.3% | 13.5% | 6.2% | 5.1% |
| Asian/Pacific Islander (non-Hispanic) | 10.6% | 4.9% | 2.8% | 1.7% |
| Other (non-Hispanic)b | 9.5% | 3.7% | 1.5% | 0.3% |
| Metropolitan/Non-Metropolitan Area | ||||
| Inside metropolitan area | 11.4% | 4.6% | 2.9% | 0.9% |
| Outside metropolitan area | 9.0% | 2.2% | 1.9% | -0.2% |
| Metropolitan status not disclosed | 6.8% | 0.0% | 2.0% | 0.0% |
| Census Division | ||||
| New England | 8.2% | 2.3% | 3.2% | 1.7% |
| Middle Atlantic | 10.4% | 4.5% | 2.9% | 1.4% |
| Child poverty rate - 2018 | Child poverty rate gap - 2018 | Child poverty rate - 2021 | Child poverty rate gap - 2021 | |
|---|---|---|---|---|
| East North Central | 7.2% | 1.3% | 1.0% | –0.5% |
| West North Central | 5.8% | 0.0% | 1.5% | 0.0% |
| South Atlantic | 13.3% | 7.4% | 3.5% | 2.0% |
| East South Central | 11.1% | 5.2% | 2.1% | 0.6% |
| West South Central | 13.3% | 7.4% | 4.4% | 2.9% |
| Mountain | 9.3% | 3.5% | 2.6% | 1.1% |
| Pacific | 14.2% | 8.3% | 3.0% | 1.5% |
| Family Compositionc | ||||
| Married parents (both bio and adoptive) | 6.7% | 0.0% | 1.9% | 0.0% |
| Married parents (at least one step) | 8.2% | 1.5% | 1.3% | –0.6% |
| Two unmarried cohabiting biological/adoptive parents | 18.4% | 11.7% | 6.0% | 4.0% |
| Biological/adoptive parent with cohabiting partner | 12.1% | 5.4% | 2.6% | 0.7% |
| Single bio/adoptive parent | 20.4% | 13.7% | 4.2% | 2.3% |
| Living with other relatives (including grandparent, stepparent only, other relatives) | 18.1% | 11.4% | 4.9% | 2.9% |
| Living with nonrelatives | 25.0% | 18.3% | 15.0% | 13.0% |
| Employment Status of Adults in Unitd | ||||
| 1+ full-year, full-time workers | 5.9% | 0.0% | 1.1% | 0.0% |
| 1+ part-time or part-year workers (and no adult who works full time for the full year) | 24.1% | 18.2% | 5.5% | 4.4% |
| No workers | 62.7% | 56.8% | 20.7% | 19.6% |
| Unit has nonelderly member with disabilitye | ||||
| 1+ members with disability | 25.7% | 16.2% | 5.0% | 2.4% |
| Child poverty rate - 2018 | Child poverty rate gap - 2018 | Child poverty rate - 2021 | Child poverty rate gap - 2021 | |
|---|---|---|---|---|
| No members with disability | 9.5% | 0.0% | 2.6% | 0.0% |
| Education of Mother, Father, or Unit Headf | ||||
| Less than high school | 28.9% | 25.1% | 9.5% | 8.3% |
| High-school graduate/GED | 15.9% | 12.1% | 3.3% | 2.1% |
| Some college | 9.3% | 5.4% | 1.7% | 0.5% |
| Bachelors degree or more | 3.8% | 0.0% | 1.3% | 0.0% |
| Unit participates in major safety net program (not counting tax credit) | ||||
| At least one unit member participates in major safety net programg | 21.4% | 19.2% | 4.9% | 3.8% |
| No member participates in major safety net program | 2.3% | 0.0% | 1.1% | 0.0% |
| Child’s Health Insurance | ||||
| Has private | 4.0% | 1.0% | 0.0% | |
| Has public (no private) | 23.2% | 19.2% | 4.8% | 3.8% |
| Uninsured | 16.5% | 12.5% | 8.4% | 7.3% |
| Child and Parent or Unit Head Nativityh | ||||
| Child is U.S. born: | ||||
| with immigrant parent/head | 18.1% | 10.2% | 5.4% | 4.2% |
| with U.S.-born parent/head | 8.0% | 0.0% | 1.2% | 0.0% |
| Child is foreign born: | ||||
| with parent/headi | 23.6% | 0.0% | 16.5% | 0.0% |
| Citizenship/Legal Status of Unit Membersj | ||||
| Child is a citizen: | ||||
| All unit members are citizens | 8.2% | 0.0% | 1.3% | 0.0% |
| Unit contains undocumented immigrant | 30.0% | 21.8% | 12.8% | 11.5% |
| Unit contains recent immigrantk | 17.7% | 9.5% | 4.2% | 3.0% |
| Child poverty rate - 2018 | Child poverty rate gap - 2018 | Child poverty rate - 2021 | Child poverty rate gap - 2021 | |
|---|---|---|---|---|
| Unit contains other noncitizenl | 16.6% | 8.4% | 3.0% | 1.8% |
| Child is a noncitizen: | ||||
| Unit contains undocumented immigrant | 38.0% | 24.6% | 31.0% | 24.3% |
| Unit contains recent immigrant | 24.1% | 10.7% | 10.7% | 4.0% |
| Unit contains other noncitizen | 13.4% | 0.0% | 6.7% | 0.0% |
| Child and Parent or SPM Unit Head Nativity | ||||
| Child in nonimmigrant familym | 8.1% | 0.0% | 1.3% | 0.0% |
| Child in immigrant family | 19.0% | 10.9% | 7.0% | 5.7% |
| Citizenship/Legal Status of SPM Unit Members | ||||
| Child in all-citizen family | 8.2% | 0.0% | 1.3% | 0.0% |
| Child in mixed-status family | 23.0% | 14.8% | 9.4% | 8.1% |
Citizen child in mixed-status familyn | 22.3% | 14.1% | 7.4% | 6.1% |
Citizen child in mixed-status family with undocumented member | 30.0% | 21.8% | 12.8% | 11.5% |
Noncitizen child in mixed-status familyo | 26.9% | 18.8% | 19.8% | 18.6% |
Noncitizen child in family with undocumented member | 38.0% | 29.8% | 31.0% | 29.7% |
NOTES: For each subgroup, the Child Poverty Rate is the number of children in poverty in that subgroup as a percentage of the total number of children in that subgroup. The Poverty Rate Gap is the difference in percentage points between the child poverty rate of each respective subgroup and the child poverty rate of the subgroup within that family characteristic that had the lowest child poverty rate in 2018.
a These rows reflect the characteristics of the biological, adoptive, or stepmother (if present), else the biological, adoptive, or stepfather (if present). If neither the father nor mother is present, then the characteristics of the SPM unit head are used, unless the child is the unit head, spouse, or cohabiting partner, in which case the child is excluded from these rows.
b The “other” race category includes non-Hispanic children who are American Indian or Alaska Natives or report more than one race.
c A child is placed in the first row that applies to his or her family (based on the presence of the child’s own parent or parents, regardless of whether they are the head of the SPM unit).
d These rows reflect the work status of persons aged 18 or older in the SPM poverty unit. “Full-year” is classified as 50 weeks or more, and “full-time” is classified as 35 hours per week or more. Children in units without adults (i.e., those aged 15 to 17 living without parents or caretakers) are included in the “no workers” row.
e A child is classified as being in an SPM poverty unit with a person with a disability if there is at least one person in the unit who is younger than 65 and is identified as disabled according to the definition used when determining Supplemental Security Income eligibility.
f These rows reflect the characteristics of the child’s biological, adoptive, or stepmother (if present), else the biological, adoptive, or stepfather (if present). If neither the father nor mother is present, then the characteristics of the SPM unit head are used, unless the child is the unit head, spouse, or cohabiting partner, in which case, the child is excluded from these rows.
g At least one member of the SPM poverty unit receives SNAP, Medicaid, CHIP, TANF or GA, SSI, or public and subsidized housing.
h If a child has at least one biological, adoptive, or stepparent that was born in another country, the child is classified as having an immigrant parent. Persons born abroad to American parents are counted as native born. If a child does not have a parent present, the immigrant status of the unit head and the unit head’s spouse are used, unless the child is the unit head, spouse, or cohabiting partner, in which case the child is excluded from these rows.
i Parent/head means that a child lives with a parent or guardian. If a child is foreign born, this table does not make a distinction between living with a native-born or foreign-born parent/head (nearly all foreign-born children have at least one foreign-born parent).
j The child is placed in the first row that applies. Citizens include both native-born and naturalized citizens.
k A “recent immigrant” is defined as a person entering as a legal permanent resident within the last 5 years.
l An “other noncitizen” includes noncitizens not classified as undocumented or recent. These include legal permanent residents who have been in the United States for more than 5 years, refugees/asylees, and “temporary residents”—noncitizens legally admitted to the United States for a specified period and for a specified purpose, such as students, guest workers, intracompany transfers, diplomats, and au pairs.
m A child is classified as being in a nonimmigrant family if the child is native born and any parent(s) present in the household are native born. If the child’s parents are not in the household, then a native-born child is classified as in a nonimmigrant family if the head and spouse (if present) of the SPM poverty unit are native born. Individuals who report that they were “born abroad to American parents” are counted as “native born.”
n A citizen child is classified as being in a mixed-status family if there is at least one noncitizen in the SPM unit.
o All noncitizen children are classified as being in mixed-status families.
NOTE: Includes the three largest subgroups by family composition in 2018; see Figures D-3 and D-4 for data for the other subgroups. The poverty rate gap is the difference in percentage points between the poverty rate of a given subgroup and that of the subgroup with the lowest poverty rate in 2018.
SOURCE: Estimates from TRIM3 commissioned by the committee.
highest for children with cohabiting parents (6.0%) followed by children in single-parent families (4.2%). This was likely due to the elimination of the minimum earnings requirement in the ARPA CTC Expansion. In nonpandemic years, about 25% of children in single-female-headed families are not eligible for the CTC due to low earnings, but they became eligible in 2021 with the ARPA CTC Expansion (Collyer et al., 2023).
The poverty rate gap between children in families with single parents and children with married parents was much lower in 2021 (2.3 percentage points) than in 2018 (13.5 percentage points).
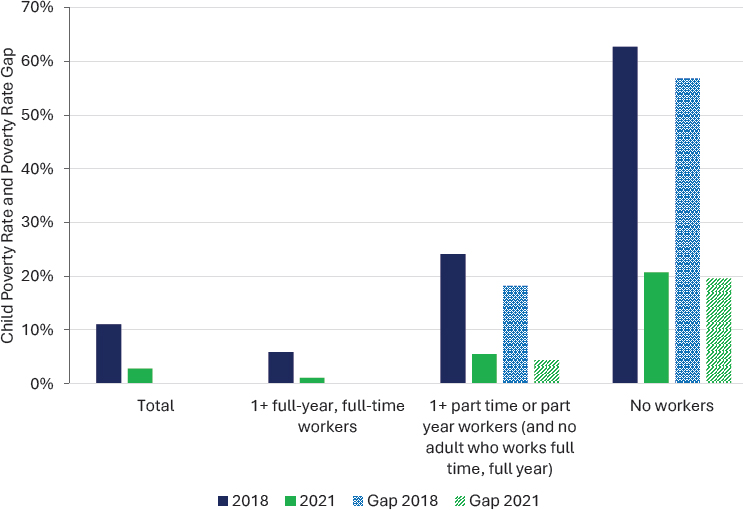
In 2018, children in families with no workers had much higher poverty rates (62.7%) than children in families with full-time (5.9%) or part-time workers (24.1%). In 2021, children in families with no workers continued to have the highest child poverty rate (20.7%), but poverty rates were considerably lower for this and other subgroups compared to 2018. As discussed in Chapter 8, families with no workers experienced a substantial reduction in poverty due to the ARPA CTC Expansion, which eliminated the minimum earnings requirement and allowed many formerly ineligible families to benefit from the higher CTC benefits (Figure D-2).
NOTE: The poverty rate gap is the difference in percentage points between the poverty rate of a given subgroup and that of the subgroup with the lowest poverty rate in 2018.
SOURCE: Estimates from TRIM3 commissioned by the committee.
The poverty rate gap between children in families with no workers and children in families with at least one full-time, full-year worker was much lower in 2021 (19.6 percentage points) than in 2018 (56.8 percentage points).
RACE AND ETHNICITY
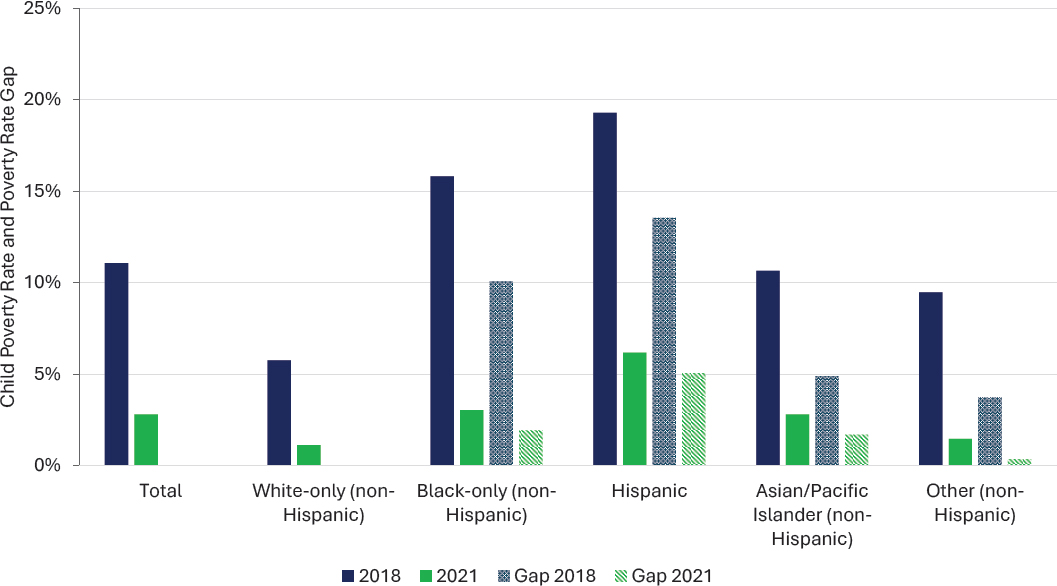
Child poverty rates for all subgroups have declined since 1970, as have disparities in poverty rates by race and ethnicity, although these disparities still persist (National Academies, 2019). As shown in Figure D-3, in 2018, by race and ethnicity, Hispanic children had the highest child poverty rate (19.3%) followed by Black children (15.8%). The poverty rate for Hispanic children was 3.4 times higher than that of non-Hispanic White children (5.7%), As discussed in Chapter 8, the measures taken during the pandemic reduced child poverty for all racial/ethnic groups. However, in 2021, Hispanic children continued to have the highest poverty rate (6.2%) followed by Black children (3.0%). Hispanic children were the only racial/ethnic group whose poverty rate was higher than the overall child poverty
NOTE: The poverty rate gap is the difference in percentage points between the poverty rate of a given subgroup and that of the subgroup with the lowest poverty rate in 2018.
SOURCE: Estimates from TRIM3 commissioned by the committee.
rate (2.8%), and their poverty rate was 5.6 times higher than that of White children.
Figure D-3 also shows the poverty rate gap between non-Hispanic White children—the group with the lowest poverty rate in 2018—and each racial/ethnic group for both 2018 and 2021. The racial/ethnic poverty rate gap decreased for all subgroups, but both in 2018 and 2021 Hispanic children had the largest child poverty rate gap with respect to White children: 13.5 and 5.1 percentage points, respectively. By comparison, Black children had a child poverty rate gap with respect to White children of 10.1 percentage points in 2018 and only 1.9 percentage points in 2021.
CITIZENSHIP AND IMMIGRATION STATUS
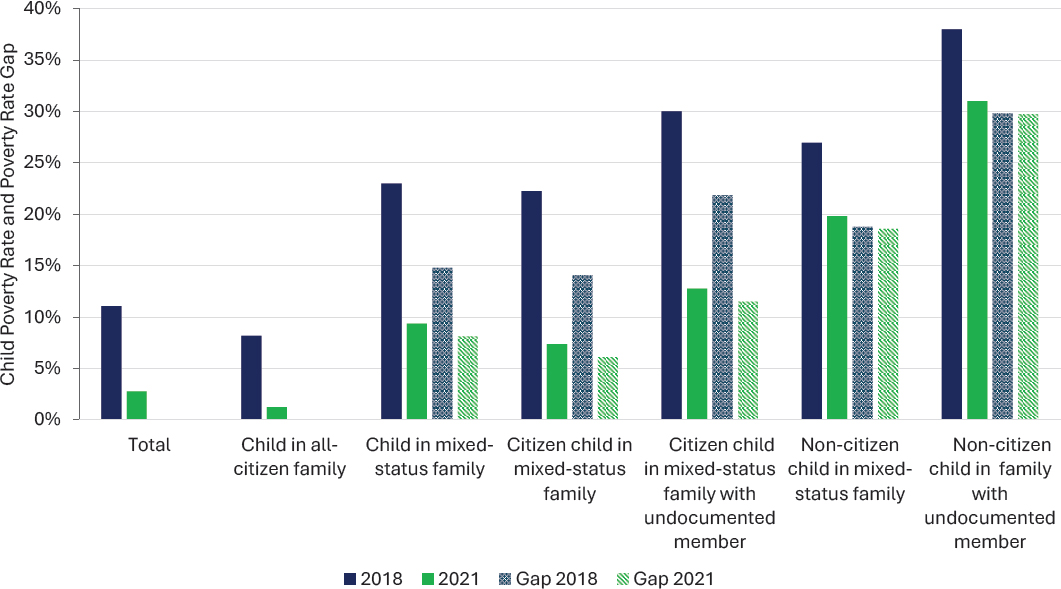
According to TRIM3 data, in 2018, noncitizen children in families with undocumented members and U.S. citizen children in families with undocumented members had very high poverty rates of 38% and 30%, respectively (see Figure D-4). Children in families where all members were U.S. citizens had a poverty rate of 8.2%. As was also found in the 2019 National Academies report, being U.S. citizens themselves did not protect children from experiencing high poverty rates. Instead, the data show that eligibility and benefit restrictions in antipoverty programs, which are based not on the citizenship/immigration status of children but on the status of their family members,3 lead to disparities in poverty rates by family immigration status.
In 2021, child poverty rates declined across all citizenship and immigration status subgroups. Poverty remained lowest among children in all-citizen families (1.3%). A notable shift occurred among families with undocumented members. While noncitizen children in families with undocumented members had a poverty rate of 31%, U.S. citizen children in similar families had a significantly lower poverty rate of 12.8%—an 18.2 percentage point difference. This was likely due to other pandemic programs such as the Economic Impact Payments (EIPs, i.e., stimulus checks), which initially followed eligibility rules similar to those of the EITC, excluding U.S. citizen children in families where even one member did not have an SSN, but eligibility for EIPs was extended to these children in December 2020, including retroactive payments (CARES Act, 2020). Eligibility rules for the EITC and CTC contributed to these differences in poverty rates. As shown in Chapter 8, in 2021, without the EITC and CTC but in the presence of other pandemic programs, the difference in poverty rates between noncitizen (34.1%) and U.S. citizen children (21.5%) in families with undocumented members was 12.6 percentage points. The difference
___________________
3For example, as discussed in Chapter 2, U.S. citizen children in families where even one of the parents does not have an SSN cannot receive the EITC.
NOTE: The poverty rate gap is the difference in percentage points between the poverty rate of a given subgroup and that of the subgroup with the lowest poverty rate in 2018.
SOURCE: Estimates from TRIM3 commissioned by the committee.
became wider with the ARPA CTC Expansion, because—like the CTC in nonpandemic years—it included children with SSNs even if their parents did not have SSNs, but excluded children without SSNs. Other changes in the CTC, such as eliminating the minimum earnings requirements, likely benefited U.S. citizen children with undocumented parents, too.
During the pandemic, U.S. citizen children in families with undocumented members had greater eligibility for antipoverty programs as compared to previous years. U.S. citizen children in families with undocumented members had a poverty rate in 2021 (12.8%) that was much lower than their poverty rate in 2018 (30%), a decline of 17.2 percentage points. In contrast, during the pandemic, noncitizen children in families with undocumented members remained ineligible for certain antipoverty programs; noncitizen children in families with undocumented members had a very high poverty rate of 31% in 2021, compared to 38% in 2018, a decline of only 7 percentage points. Still, the 2021 poverty rate for citizen children in families with undocumented members was much higher than the total child poverty rate (2.8%) and the poverty rate for children in all-citizen families (1.3%). See Box D-1.
COMPOSITION OF CHILDREN IN POVERTY
Another way of describing poverty across subgroups is by looking at the composition of all children in poverty by subgroup (Table D-1). Both the absolute number of children in poverty and each subgroup’s share of that total population can help identify subgroups of vulnerable children
BOX D-1
Child Poverty 2021
Child poverty rates were lower in 2021 than in 2018, both overall and across subgroups. Disparities in child poverty measured by the poverty rate gap (i.e., the difference in percentage points between the subgroup with the lowest poverty rate for a given family characteristic in 2018 and the other subgroups) were lower in 2021 than in 2018.
Decreases in the child poverty rate and in the poverty rate gap were higher for groups who benefited more from increased eligibility provided by the ARPA CTC Expansion, particularly the elimination of the minimum earnings requirement (e.g., single-parent families and families with no workers). Children in families who did not benefit from the tax credits (e.g., noncitizen children) also experienced lower poverty rates, possibly due to other pandemic programs such as Economic Impact Payments and Supplemental Nutrition Assistance Program emergency allotments that may have been available to at least some members of their families.
left behind by program rules (e.g., eligibility) and program implementation (e.g., knowledge and take-up of programs).
This section describes the subgroups that constitute the largest number of children in poverty and the subgroups that are overrepresented among children in poverty compared to their share of the total child population. Coupled with knowledge of differential eligibility rules and benefit levels that have disparate impacts, this information can help identify children that are most at risk of experiencing poverty and its consequences, as well as policy design elements to reduce poverty further among vulnerable subgroups.
Before and during the pandemic, the composition of children in poverty was very different from the composition of the U.S. child population. These differences reflect differences in factors that contribute to high child poverty rates at the family and parental level—for example, employment and educational attainment—as well as different eligibility requirements for antipoverty programs.
Based on TRIM3 data, Figures D-5 through D-12 show the composition of the child population in poverty in number of children and percent terms, respectively, in 2018 and in 2021.
Family Composition
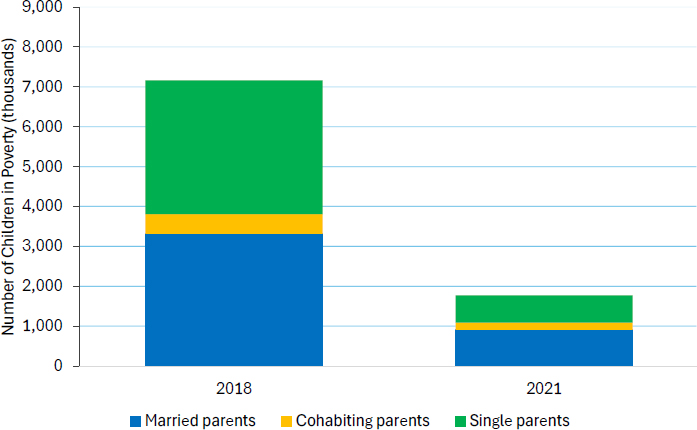
As shown in Figure D-5 the number of children in poverty was substantially lower in 2021 compared to 2018 for all subgroups by family composition. For instance, the number of children in poverty in single-parent households was about 691,000 in 2021 compared to about 3.4 million in 2018.
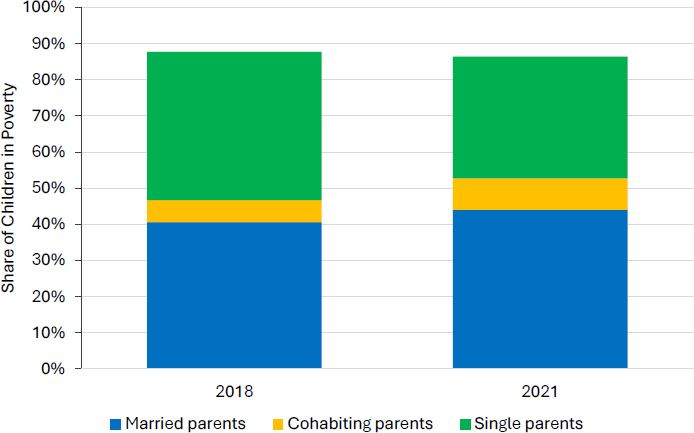
Children in single-parent families were 22% of the total child population but represented 41% of children in poverty in 2018. As mentioned earlier, during 2021, pandemic tax credit programs reduced poverty substantially for children in single-parent families, lowering their representation among children in poverty to 34%. Children in families with cohabiting parents represented a somewhat larger share of children in poverty in 2021 than in 2018 (9% vs. 6%). The share of children in poverty in families with married parents increased from 41% to 44%. These changes were likely due to pandemic programs, particularly the ARPA CTC Expansion, whose extended eligibility to families with no or low earnings benefited single parents (Figure D-6).
Family Socioeconomic Characteristics: Employment Status of Adults
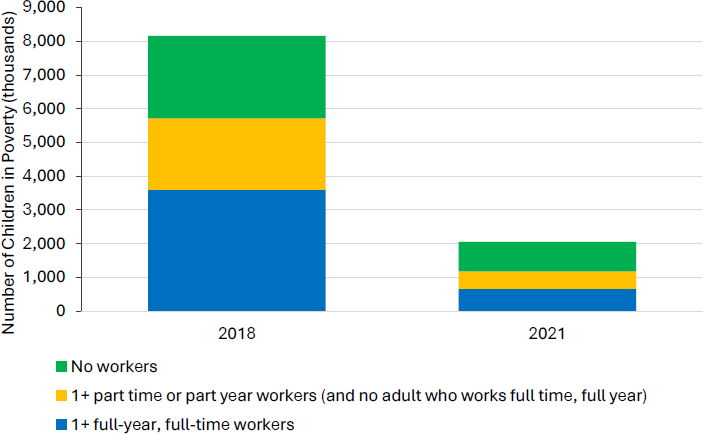
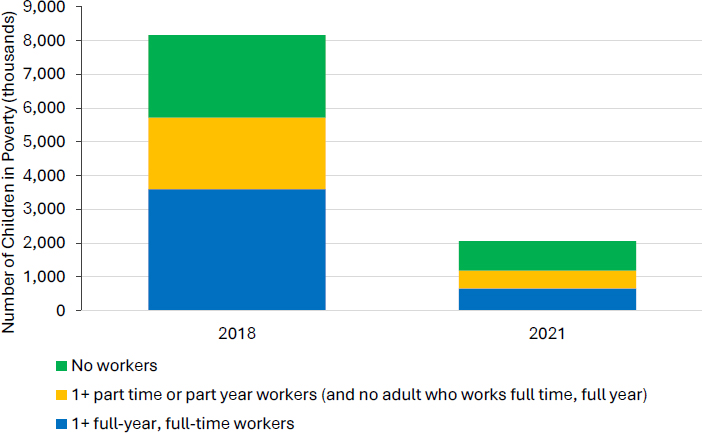
Across subgroups by employment status, the number of children in poverty was lower in 2021 than in 2018 (Figure D-7). The largest absolute
NOTES: Includes the three largest subgroups by family composition in 2018; see Table D-1 for data for the other subgroups.
SOURCE: Estimates from TRIM3 commissioned by the committee.
NOTES: Includes the three largest subgroups by family composition in 2018; see Table D-1 for data for the other subgroups.
SOURCE: Estimates from TRIM3 commissioned by the committee.
SOURCE: Estimates from TRIM3 commissioned by the committee.
SOURCE: Estimates from TRIM3 commissioned by the committee.
decline was for children in families with at least one full-time, full-year worker—from 3.6 million children in poverty in 2018 to 661,000 in 2021. The percent distribution also changed from 2018 to 2021. While children in families with at least one full-time, full-year worker represented 44% of children in poverty in 2018, they were 32% in 2021—although they represented more than 80% of the total child population. Conversely, the share of children in families with no workers was 30% in 2018 versus 42% in 2021—in both years they were overrepresented relative to their share of the total child population (about 5%; Figure D-8).
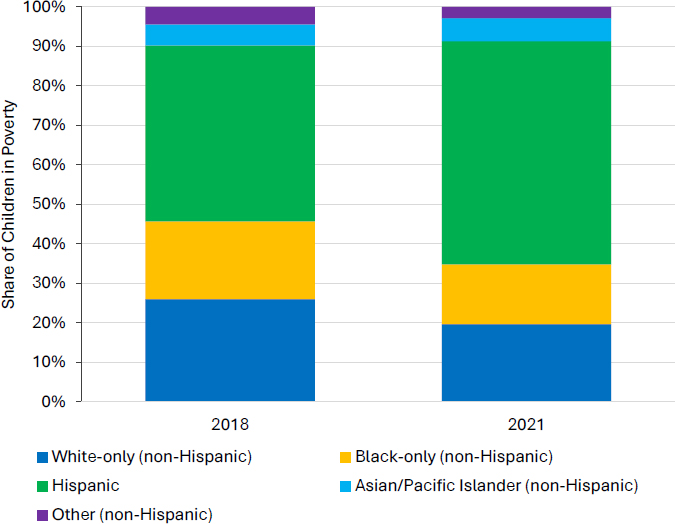
Race and Ethnicity
By race and ethnicity, the number of children in poverty was much lower in 2021 than in 2018 across all subgroups, but in both 2018 and 2021, the largest group of children in poverty were Hispanic children—about 3.64 million and 1.16 million children, respectively (Figure D-9).
In 2018, Hispanic children represented 26% of the U.S. child population, but they comprised 45% of children in poverty. In contrast, White children represented 50% of all U.S. children but only 26% of children in poverty (Figure D-10).
As discussed in Chapter 8, the antipoverty programs implemented
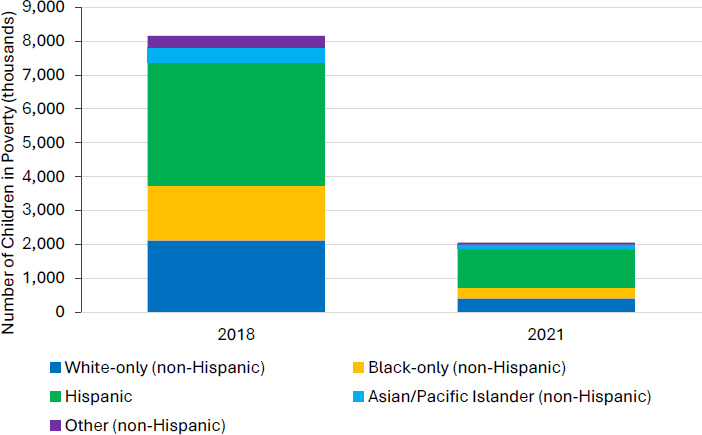
SOURCE: Estimates from TRIM3 commissioned by the committee.
SOURCE: Estimates from TRIM3 commissioned by the committee.
during the pandemic substantially reduced child poverty rates and the number of children in poverty across subgroups. However, by race and ethnicity, child poverty became more disproportionately concentrated among Hispanic children, who in 2021 represented 57% of children in poverty, up from 45% in 2018. In contrast, the representation of non-Hispanic White children decreased from 26% to 20%. In 2018, Black children represented about 20% of children in poverty and 15% in 2021, which is similar to their representation in the total child population (15%).
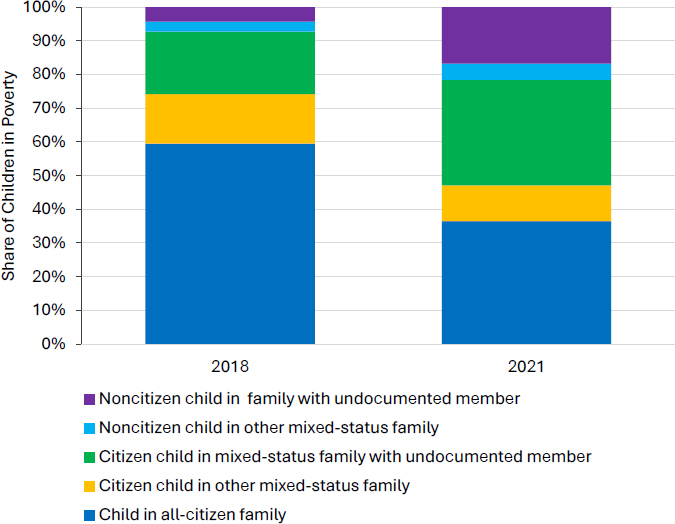
Citizenship/Immigration Status
Again, across subgroups by family citizenship/immigration status, the number of children in poverty was lower in 2021 than in 2018 (Figure D-11).
In 2018, U.S. citizen children in mixed-status families with undocumented members were overrepresented among children in poverty. They were 7% of the total U.S. child population in 2018 but represented 19% of children in poverty—about 1.51 million children. In 2021, their share of
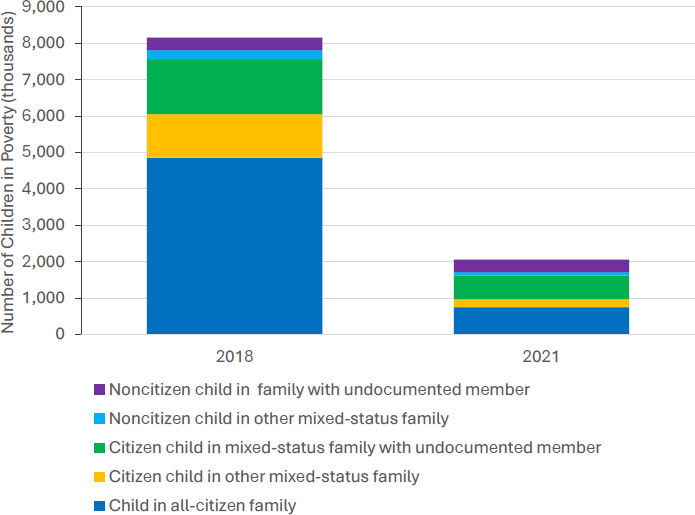
SOURCE: Estimates from TRIM3 commissioned by the committee.
children in poverty increased to 31%. Noncitizen children in families with undocumented members, who represented only 1% of the total U.S. child population in 2018, made up 4% of children in poverty in 2018 and 17% in 2021 (Figures D-11 and D-12). Eligibility requirements of the EITC and CTC contributed to these disparities. In both 2018 and 2021, U.S. citizen children in mixed-status families with undocumented members were eligible for the CTC but not the EITC because they had at least one family member without an SSN. Therefore, both during the pandemic and in typical years, the EITC had little impact on reducing the poverty rate among this subgroup, even though it significantly reduced poverty rates for other groups. Noncitizen children in mixed-status families with undocumented members are ineligible for the EITC or the CTC, both prior to ARPA (under the Tax Cuts and Jobs Act) and in ARPA EITC and CTC Expansions. See Box D-2.
CONCLUSION
The committee’s statement of task was to examine the effects of the ARPA EITC and CTC policies in 2021 on child poverty and to consider
SOURCE: Estimates from TRIM3 commissioned by the committee.
BOX D-2
Composition of Children in Poverty
Both in 2018 and 2021, the composition of children in poverty differed considerably from the composition of the total child population.
Overall and across subgroups, the number of children in poverty was substantially lower in 2021 compared to 2018. The disproportionate representation of some subgroups among children in poverty compared to their share of the total population was considerably higher in 2021 compared to 2018. For instance, in 2021, Hispanic children represented 57% of children in poverty versus 45% in 2018—though they constituted only 26% of the total child population. Conversely, non-Hispanic White children represented 20% of children in poverty in 2021 compared to 26% in 2018—while their share of the total child population was 49%. U.S. citizen children in families with undocumented members represented 19% of children in poverty in 2018 but 31% in 2021—even though they represented only 7% of the total child population.
options for enhancing their antipoverty effects. Child poverty in the United States cannot be discussed without addressing disparities across subgroups defined by family structure, socioeconomic status, area of residence, race and ethnicity, nativity, and citizenship/immigration status. Data from the committee’s analysis show that differences across subgroups are large and have persisted despite overall declines in child poverty. Pandemic-related measures implemented in 2021 lowered child poverty overall and substantially reduced poverty rates among many—though not all—vulnerable subgroups that had very high baseline poverty rates. In addition to lower overall poverty rates, gaps between subgroups decreased. The number of children in poverty in 2021 was much lower than in 2018. However, the composition of children in poverty in 2021 was even more unequal relative to the total child population than it was in 2018.
This page intentionally left blank.


