Pathways to Reduce Child Poverty: Impacts of Federal Tax Credits (2026)
Chapter: Appendix H: Urban Institute TRIM3 Technical Specification: Using Microsimulation to Assess the Impact of the 2021 Child Tax Credit and Earned Income Tax Credit
Appendix H
Urban Institute TRIM3 Technical Specification: Using Microsimulation to Assess the Impact of the 2021 Child Tax Credit and Earned Income Tax Credit
INTRODUCTION
This report describes the work conducted by the Urban Institute in support of a consensus study by the National Academies of Sciences, Engineering, and Medicine’s Board on Children, Youth, and Families and the Committee on National Statistics to assess the impacts of the federal Earned Income Tax Credit (EITC) and Child Tax Credit (CTC) on child poverty in 2021.1 The study builds on methods used in the 2019 National Academies report, A Roadmap to Reducing Child Poverty (National Academies, 2019). Under contract with the National Academies, Urban Institute staff used the Transfer Income Model version 3 (TRIM3) microsimulation model to assess the effect of the American Rescue Plan Act (ARPA)-expanded CTC, the components that were already in place in 2020, and the 2021 EITC including both components that were already in place in 2020 and the small additional components to the EITC added in the ARPA legislation, on child poverty as measured with the Supplemental Poverty Measure (SPM), which incorporates the impact of noncash benefits and tax credits on poverty. Results showed antipoverty impacts for all children and for various subgroups of children. Estimates also included the total amount of EITC and CTC provided to families by family poverty level. In addition to providing detailed baseline 2021 estimates, poverty estimates were provided under two alternative definitions—one that estimates the effect of the EITC and
___________________
1The data and methods used for the antipoverty effects of alternative EITC and CTC policies reported in Chapter 9, which used the spring 2019 CPS ASEC, can be found in Appendix F.
CTC in the absence of Economic Impact Payments (EIPs) and other CO-VID-19 pandemic-related policy expansions, and another that counts only those tax credits received in 2021 (excluding amounts received as refunds on 2021 tax returns filed in 2022 and approximating refunds received on 2020 returns filed in 2021).
This appendix describes the methods used for the work and presents key results. First, an overview of the model is provided, discussing the creation of monthly data and assignment of immigrant status to people in the Current Population Survey Annual Social and Economic Supplement (CPS ASEC), and describing the methods for simulating program eligibility and benefits, taxes, and tax credits. The appendix then turns to how closely the simulated data align with real-world targets obtained from administrative data and discusses how much the TRIM3 baseline corrects for underreporting of program benefits in the CPS ASEC. Next, the appendix describes the methods used to create the baseline 2021 SPM poverty estimates and shows how the TRIM3 adjustments lower the estimated child poverty rate relative to the Census Bureau’s SPM estimate. Two alternative poverty definitions used for the project are then described, and the appendix concludes with a section describing the definitions of subgroups included in the poverty tables.
THE TRIM3 AND THE 2021 BASELINE2
Estimates were developed by applying a comprehensive microsimulation model, TRIM3, to data from the Census Bureau’s CPS ASEC. TRIM3’s computer code applies the rules of government tax and benefit programs to each household in the survey data, either mimicking their real-world operations or simulating hypothetical policy changes.3
TRIM3 Overview
TRIM3 is a comprehensive microsimulation model of the tax and benefit programs affecting U.S. households. It has been used for over 50 years to support analyses of income support programs—how they operate currently, how they interact, and how changes to these programs can affect families’ economic well-being (Zedlewski & Giannarelli, 2015). The model is funded and copyrighted by the Department of Health and Human Services, Office of the Assistant Secretary for Planning and Evaluation (HHS/ASPE); the Urban Institute developed the model and has held a continuous
___________________
2This section is adapted from Appendix F in A Roadmap to Reducing Child Poverty (National Academies, 2019).
3Full documentation of TRIM3 is available on the project’s website, http://trim.urban.org
series of contracts to maintain it, augment it to meet new aspects of the policy environment, and use it in support of ASPE analyses. ASPE also allows the Urban Institute to use TRIM3 for other projects, such as this one.
TRIM3 is a microsimulation model, which means that its estimates are developed by applying the rules of benefit and tax programs to each of the households in a survey data file, one by one. The model can simulate either the actual rules of programs (i.e., “baseline” simulations) or potential alternative policies. When policy changes are modeled, the results might show that a particular family receives a larger benefit under an alternative policy than under the baseline. Aggregate impacts are estimated by adding up the individual-level impacts using the “weights” for each person or household. Several aspects of TRIM3 are particularly important for this analysis:
- Comprehensiveness: TRIM3 models all the major benefit and tax programs that directly affect the economic well-being of low-income U.S. families and corrects for the underreporting of benefits reported in survey data. The simulations used in this analysis are
- Unemployment Compensation (UC)
- Means-tested cash benefits: Supplemental Security Income (SSI) and Temporary Assistance to Needy Families (TANF)
- Nutrition benefits: Supplemental Nutrition Assistance Program (SNAP), and the Women, Infants, and Children (WIC) program
- Other in-kind benefits and subsidies: Public and subsidized housing, child care subsidies through the Child Care and Development Fund (CCDF), and Low Income Home Energy Assistance Program (LIHEAP) benefits
- Taxes: Payroll taxes, federal income taxes and credits, and state income taxes and credits
- Economic Impact Payments (EIPs)
- Detailed modeling: Baseline simulations capture programs in as much detail as feasible, given the limits of the survey data. When policies vary at the state level—in particular for TANF, CCDF, and state income taxes—the state variations are captured in great detail.
- Interactions: TRIM3’s simulations are internally consistent, capturing the interactions that occur across programs. For example, benefits from SSI and TANF are counted as income by the SNAP program, so if a change in SSI or TANF is modeled, the secondary impact of that change on SNAP benefits can also be estimated.
- Ability to capture employment effects: External estimates of how a policy change would affect employment can be applied to the data (e.g., identifying some people to either start or stop working or to work more or less), and benefit and tax programs can be resimulated including the estimated employment changes. The TRIM3
- employment effects simulations for this analysis were carried out by Kevin Werner, a former Urban Institute TRIM3 employee, through an independent consulting agreement with the National Academies. The methods used to model employment effects are described in Appendix F.
- Flexibility: The system can be used to simulate changes in existing programs and to simulate proposed new programs.
CPS ASEC Data Preparation
The underlying input data file for this analysis was the 2022 CPS ASEC, which captured families’ demographic characteristics as of spring 2022 and their incomes and employment statuses during calendar year (CY) 2021. The file includes information on about 152,732 people in 59,148 households and group quarters.4 When tabulated using the sampling weights developed by the Census Bureau, the file is statistically representative of the civilian noninstitutionalized U.S. population. (The institutionalized population—including people in homeless shelters, detention facilities, or residential programs for people with special needs—is not included in the CPS ASEC and therefore not covered by this analysis.)
The CPS ASEC provides very detailed information on household demographics, employment, and income. However, the survey is missing some information that is important for simulating benefit and tax programs that affect lower-income families. The two most relevant limitations for this analysis are lack of monthly income data and lack of data on noncitizens’ immigrant status.
Monthly Income Data
Monthly income information is required by the simulations to capture the changes that may occur during the year in which a family is eligible for a safety net program and, if they are eligible, the amount for which they are eligible. For example, a family may be eligible for SNAP for the first four months of a year when a parent is unemployed but then lose eligibility once that parent finds employment. If eligibility were assessed using only annual income, the family might incorrectly appear to be eligible for the entire year or ineligible for the entire year.
Various methods are used to allocate different types of income across the year, with the most detailed approach taken to allocate earnings and
___________________
4Current Population Survey 2022 Annual Social and Economic Supplement, https://www2.census.gov/programs-surveys/cps/techdocs/cpsmar22.pdf.
other employment-based income. For individuals who are reported to work fewer than 52 weeks, a starting-point week is chosen and then the survey-reported weeks of employment from that point forward are assigned (“wrapping” from December to January if needed). The starting point is selected in such a way that the trend in weeks of employment across the months of the calendar year follows the trend from the monthly Bureau of Labor Statistics (BLS) data as closely as possible (Figure H-1). Similarly, for people who are reported to be unemployed (looking for a job) for part of the year but not the entire year, one or more spells of unemployment is identified (Figure H-2). TRIM3 methods generally reflect the BLS trends in employment and unemployment, though tend to overstate the number of people employed in the first month and understate the number unemployed in the first month and to a lesser extent in the other months of the year. TRIM3 does not generate weeks of unemployment beyond what is reported in the CPS ASEC and therefore typically reflects slightly lower levels of unemployment than are reflected in the BLS data.
After the weeks of employment have been identified, earnings are generally assigned evenly across those weeks, implicitly assuming that a person’s weekly earnings are unchanged throughout the year. However, for people who report that they worked part time in some weeks and full time in
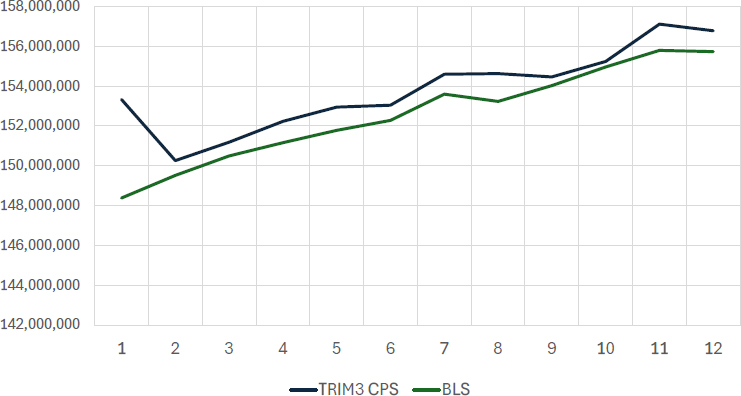
NOTE: BLS = Bureau of Labor Statistics, CPS = Current Population Survey.
SOURCE: TRIM3 applied to data from the 2022 CPS ASEC. Bureau of Labor Statistics Series Id: LNU02000000, 2021 Employment Level, Not Seasonally Adjusted.
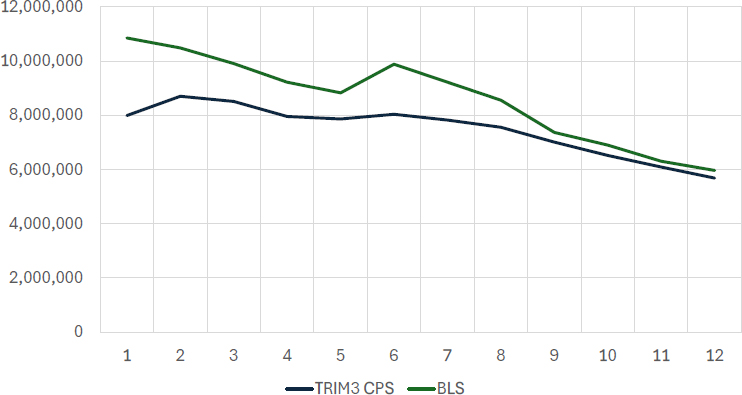
NOTE: BLS = Bureau of Labor Statistics, CPS = Current Population Survey.
SOURCE: TRIM3 applied to data from the 2022 CPS ASEC. Bureau of Labor Statistics Series Id: LNU03000000, 2021 Unemployment Level, Not Seasonally Adjusted.
other weeks, the assignment of weekly earnings reflects those differences.5 Monthly earnings amounts are then generated, treating each month as having 4.333 weeks.
Monthly allocation methods for other types of income are as follows:
- Workers’ compensation: Workers’ compensation is generally divided over all weeks in which a person was either unemployed or out of the labor force; but a portion of recipients are simulated to receive their workers’ compensation as a lump sum.
- Child support and alimony: The number of months over which alimony and child support income is allocated is determined probabilistically based on look-up tables generated from the Survey of Income and Program Participation. Different tables are used for families that do and do not receive TANF; within a subgroup, the probability of a particular number of months of positive child support varies by the annual amount of child support or alimony
___________________
5If a person reports usually working full time (35 or more hours per week) but also reports some part-time weeks, the person is assumed to work 20 hours per week in the part-time weeks. If a person reports usually working part time, but also reports some full-time weeks, the person is assumed to work 40 hours per week in the full-time weeks.
- income, in ranges. Once a number of months is established, the specific months are selected randomly.6
- Other unearned income: Other unearned income amounts—including Social Security, pension income, interest, dividends, rental income, veterans’ payments, regular contributions, educational assistance, black lung/miner benefits, and unspecified “other” income—are allocated evenly across the months of the year.
Note that the above discussion of the monthly allocation of annual values does not mention UC, SSI, TANF, or SNAP amounts, each of which is also reported in the CPS ASEC in annual terms. Monthly amounts for those programs are developed as part of the baseline simulations, described below.
Immigrant Status
The CPS ASEC asks if people are citizens and, if they are not, asks when they came to the United States. However, the survey does not ask about a noncitizen’s legal status—whether she or he is a lawful permanent resident (LPR), refugee/asylee, temporary resident (e.g., residing in the United States with a student or work visa), or undocumented immigrant. Whether a noncitizen is potentially eligible for various benefits and for some tax credits depends on his/her specific legal status.
To enable detailed modeling of the program rules regarding immigrant eligibility, an immigrant status is assigned to each noncitizen (Table H-1). The methods follow an approach first developed by Passel and Clark (1998) and further developed by Passel and coauthors (Passel & Cohn, 2011; Passel et al., 2006). The methodology for the 2021 TRIM3 immigrant status imputations (developed on the 2022 CPS ASEC data) are nearly identical to the methods used by Passel and Cohn (2018) to develop estimates for the American Community Survey. In brief, the approach proceeds as follows:
- Reclassification of some naturalized citizens: Among people who report being naturalized citizens, 1.9 million are reclassified as noncitizens, based on prior analyses indicating overreporting of naturalization.
- Temporary residents: 823 thousand noncitizens are identified as temporary residents, due to having demographic and employment
___________________
6For people who report both child support and TANF income, and whose annual child support income equals their state’s “pass through” amount times their reported months of TANF income, the months of child support receipt is automatically set equal to the months of reported TANF receipt.
TABLE H-1 Key Results of Immigrant Status Imputation Procedures, CY 2021 CPS-TRIM3 Data
| Group | Imputation result |
|---|---|
| Status modified from naturalized citizen to noncitizen | 1.9 million |
| Total noncitizens after adjustment | 26.0 million |
| Imputed to be temporary residents | 0.823 million |
| Imputed to be refugees/asylees | 1.0 million |
| Imputed to be LPRs | 12.0 million |
| Imputed to be undocumented noncitizens | 12.1 million |
SOURCE: TRIM3 applied to data from the 2022 CPS ASEC.
- characteristics suggesting that they are in the United States on a work or student visa.
- Refugees/asylees: Noncitizens are initially identified as refugees/asylees if, in the year that they entered the United States, more than half of the people arriving from their country of origin were refugees or asylees. Some random adjustments are made to the initial determinations to come closer to externally derived targets. The final results include 1.0 million noncitizens imputed to have had an initial status of refugee or asylee.
- Among noncitizens not already identified as refugees/asylees or temporary residents, people are identified as LPRs if they are in an occupation that would require legal status (e.g., police officer) or if they report a type of benefit that would require legal status.
- Among the remaining noncitizens, people are probabilistically assigned to either LPR status or undocumented immigrant status based on their characteristics, coming very close to a set of externally derived targets for the number and characteristics of undocumented immigrants in the CPS ASEC data.7
- Adjustments are made as needed to the person-level imputations to ensure logical intrafamily consistency.
The targets that guide the imputation of undocumented status use numerous sources of data on legal entrants to the United States over time.8
___________________
7The results match the national targets for undocumented immigrants and LPRs, are within a tenth of a percent of target for the six states with the largest immigrant populations and are within a tenth of a percent of target by Mexican and non-Mexican origin. The TRIM3 imputations exceed the LPR target for children under 18 by 4.6% and are 3.7% below the undocumented target for children under 18.
8This includes, for example, data on numbers of people arriving as LPRs or having their status adjusted to LPR, arriving in the United States as refugees, and being granted asylee status by various characteristics.
Each year those figures are adjusted to account for age progression, naturalization, emigration, and death; this results in estimates of people in the country legally. The total noncitizens in the CPS ASEC data minus the number in the country legally provides the estimate of undocumented immigrants in the CPS ASEC data. The final imputations include 12.1 million undocumented immigrants and 12.0 million LPRs.
BASELINE SIMULATION METHODS
Before any use of TRIM3 to assess the potential impacts of changes in policies, a set of baseline simulations must first be completed. The baseline simulations apply the actual rules that were in place in the year of the data being used as input to the households in those data. The simulations create new items of information for each household, telling if they are eligible for various programs, their level of tax liability, and so on. Each simulation follows the same steps that an individual would use to compute his or her income taxes or that a case worker would use to determine a family’s eligibility for benefits. Simulations of benefit programs also identify which of the eligible people or families receive benefits from, and hence participate in, the program, to create a simulated caseload that comes close to the actual caseload size and characteristics obtained from external administrative and government sources.
In the case of most of the benefit programs discussed here (all except CCDF-funded child care subsidies), the simulated data on program receipt are used to augment, and to some extent replace, the survey-reported CPS ASEC data on those programs. Specifically, the CPS ASEC includes annual income and benefit amounts for UC, SSI, TANF, SNAP, and LIHEAP, and includes variables telling whether a household is in public or subsidized housing and whether a family receives benefits from WIC. However, this information is not sufficient to support modeling of alternative policies, for a few reasons. First, the reported amounts and caseloads fall substantially short of targets, even after missing survey responses have been adjusted through the Census Bureau’s imputation procedures. Second, the survey-reported receipt sometimes does not appear consistent with known program rules. For example, there are cases of families with no young children and no woman of childbearing age who report WIC benefits, or people reporting SSI who are younger than 65 and whose other data show no indications of disability. Third, even when individuals who report receiving benefits from a given program appear generally eligible for that program, the specific amounts that are reported are usually not perfectly consistent with what would be computed by applying the program rules to the family’s income and demographic data. That is to be expected, since many respondents probably round various dollar amounts, and since some amounts
are imputed by the Census Bureau. However, when the committee s policy options are modeled, the benefits under the new policy are computed based on the rules and the survey-reported household income and demographic data; it is important that the only difference between the baseline benefit amount and the alternative benefit amount is that resulting from the policy change, and the only way for that to be the case is for the baseline benefits to be computed with the same methods that are used in modeling the committee’s policy options.
Although the CPS ASEC includes questions about benefit receipt, the survey does not ask respondents about their tax liabilities. The Census Bureau imputes federal and state income tax liabilities to the households in the CPS ASEC as part of their development of SPM poverty estimates, and they make those imputations available to researchers; however, to ensure complete consistency with other simulated data, the TRIM3 analyses use the baseline tax liability amounts modeled within the TRIM3 system.
The baseline simulations are performed sequentially, so that information from one baseline can be used as input to subsequent simulations, creating an internally consistent picture of families’ benefits, tax liabilities, and tax credits. Unemployment compensation and cash benefits are simulated first, followed by in-kind benefits (which may include cash benefits as part of their income definition). Similarly, federal income taxes are simulated prior to state income taxes, since many states’ income tax systems use information from the federal tax form. Additional key points about the baselines are provided below.
Baseline Simulations of Benefit Programs
In general, the simulations of benefit programs proceed in three steps: determining eligibility, computing potential benefits, and determining which eligible families are enrolled in the program. These steps are performed month by month, capturing the fact that a family with part-year work might be eligible for different benefits during months of employment than during months of unemployment.
The steps in eligibility modeling often include defining the “filing unit” (i.e., the individuals in the household who are considered together in assessing eligibility and benefits); applying immigrant-related restrictions9 and
___________________
9TRIM3 captures key rules related to the eligibility of noncitizens with different statuses (for the statues identified in the imputations), including variations by age group or years in the country, as well as optional state policies in some programs. The model also approximates the impact of sponsor deeming policies and captures the way that various programs treat mixed-status families when determining program eligibility and benefits. For further detail about real-world immigrant eligibility requirements, see Overview of Immigrant Eligibility for Federal Programs.
other restrictions based on demographic characteristics (e.g., two-parent families are ineligible for TANF in some states); determining countable income; applying assets tests; and applying income tests. When eligibility policies vary by state, TRIM3 captures the state-by-state variations in eligibility policies with a high degree of detail.
Benefits are computed according to each program’s actual policies. Benefit computation formulas often vary by income levels and other characteristics, but may also be flat amounts (e.g., in the case of LIHEAP). In the case of housing and child care subsidies, TRIM3 computes the value of the benefit as an assumed full value of what is being provided minus the family’s required payment. As with eligibility modeling, state-level variations in benefits-related policies are captured in detail. Benefit amounts are computed for all families and individuals who appear to be eligible, including those for whom there is a benefit amount in the public-use data. This ensures that all the baseline benefit data are completely consistent with the known policies and the reported income and family characteristics, which is an important precondition for assessing the impact of policy changes.
Specific methods for determining which eligible families or individuals are enrolled in a program vary across the programs, but similar principles are followed:
- If an eligible person or family reported receiving a benefit in the CPS ASEC (a true report, not an imputed report), that person or family is automatically included in the program’s caseload.
- Among eligible people/families who did not report receipt of a benefit, recipients are selected probabilistically in a way that comes acceptably close to the size and characteristics of the actual caseload—the caseload “targets.” Those targets are derived from administrative data, with adjustments as needed for greater consistency with the TRIM3 universe (e.g., targets for SSI exclude the institutionalized recipients, since the CPS ASEC surveys only noninstitutionalized households). Targets vary by program but generally include national-level targets according to the characteristics most relevant to that program and state-level targets for caseload size.
- Probabilistic assignments are made by comparing a potential assistance unit’s estimated probability of enrollment (based on a variety of characteristics, which vary across programs) to a random number. Specifically, if the unit’s probability of participation exceeds the unit’s random number for purposes of participation for this program, the unit is simulated to participate.
- For each benefit program, a unique set of random numbers is used for all probabilistic enrollment assignments for that program for a particular year of data. This ensures that when an alternative
- simulation results in a change to the unit’s probability of participation, any changes in enrollment decisions are logically consistent with the alternative policy change. For example, assume that a hypothetical policy change increases a unit’s potential TANF benefit, raising the unit’s probability of participation. If the unit participated in TANF in the baseline, the unit will not stop participating; if the probability was previously higher than the random number, the now-higher probability will still be higher than the random number, since the random number did not change. However, if the unit was previously an eligible nonparticipant, the unit may start to participate, if the now-higher probability exceeds the unchanged random number.
- Only families and individuals who are simulated to be eligible for a program are considered as possible program recipients. Because of that assumption, if an ineligible person or family reports a benefit, it is implicitly assumed that the report was made in error (or other aspects of the respondent’s characteristics affecting eligibility have been reported in error), and that person or family is not included in the simulated caseload. This simplification avoids complications that would arise from applying policy changes to a simulated baseline caseload that included ineligible participants.10
Details of the methods for each simulation are available on the TRIM3 project’s website (http://trim3.urban.org). Next, key points are summarized and some challenges involved in modeling each program are noted.
- Unemployment Compensation
- Portion of program modeled: Benefits to unemployed individuals (partial benefits for people working reduced hours are not modeled).
- Unit definition: The unit is the individual person.
- Policies:
- COVID-19 response policies including expanded eligibility rules through Federal Pandemic Unemployment Compensation (FPUC), Pandemic Unemployment Assistance (PUA), and Pandemic Emergency Unemployment Compensation (PEUC).
___________________
10Future model development could consider some allowance for technically ineligible units being in the caseload, based on administrative estimates of the extent of that type of enrollment error. However, this would require decisions regarding how to handle these cases in alternative simulations. For example, if an ineligible unit that has been included in the caseload is modeled to receive higher earnings due to a minimum wage increase, it is unclear whether it would be more appropriate to continue to include the unit in the caseload, or whether to assume the unit would lose benefits due to exceeding the eligibility limit by an even greater amount.
- Standard UC rules beginning in September (and earlier in some states).
- Timeframe: Monthly
- Policies: Both national and state level; with pandemic policies ending in all states by early September.
- Eligibility and benefit challenges: Base period wages must be inferred from wages that can be observed during the simulation year.
- Caseload selection: The caseload is aligned to reach targets for weeks of unemployment benefits by key national-level characteristics (i.e., age group, race/ethnicity, sex, and industry), and by state.
- Supplemental Security Income:
- Portion of program modeled: Benefits to individuals in households (not institutionalized).
- Unit definition: Individual adult or child or a married couple in which both members are eligible for SSI. Captures rules that deem income from a parent or ineligible spouse.
- Timeframe: Monthly
- Policies: Primarily national-level; state-level supplement amounts are obtained from a combination of national- and state-level sources.
- Eligibility and benefits challenges: Assessing potential eligibility based on age (65 or older) is straightforward, but assessing potential eligibility based on disability is complex. For adults, disability is inferred through a combination of the survey-reported reason for not working and survey-reported disability income. Disability cannot be assessed for children.
- Caseload selection: For adults, the caseload is aligned to targets by reason for eligibility (age vs. disability), type of unit (single or couple), state, and citizenship status. For children, after identifying children whose parents appear to be reporting SSI on behalf of their children, the rest of the caseload is randomly selected from among children in income-eligible families, to reach targets by family structure (two-parent, single-parent, no-parent), detailed age groups, and by state.
- Temporary Assistance for Needy Families:
- Portion of program modeled: TRIM3 models cash aid provided through TANF and Separate State Program (SSP) funds. The model also identifies benefits paid through Solely State Funded (SSF) programs; those are separately classified as SSF, not TANF.
- Unit definition: TRIM3 captures state variation in rules defining which family members are included in the assistance unit—for example, whether stepparents are considered part of the filing unit, and the treatment of nonparent caretakers. The simulation captures state variability in deeming of income from household members outside the assistance unit.
- Timeframe: Monthly
- Policies: Almost entirely state level; source of rules is the Welfare Rules Database (for the 2021 policies, see Knowles et al., 2023).
- COVID-19-specific policies: The baseline captures the special COVID-19 benefits paid in several states. In most cases, these were one-time additions to the state’s standard TANF benefit.
- Eligibility and benefits challenges: Data do not allow direct assessment of whether a family that appears eligible may in fact be ineligible due to previously having reached a time limit. A portion of otherwise-eligible families are treated as ineligible due to time limits, to reach estimated state-level targets for time-limited families; the targets are derived from administrative data. Also, the families simulated to be eligible nonparticipants include some who have been excluded due to failure to meet program requirements. Benefits are computed based on family characteristics and detailed state policies, but they do not incorporate the impact of either special-needs payments (i.e., additional payments in some states for reasons such as the start of the school year, pregnancy, or a special hardship) or monetary sanctions (i.e., reductions of benefits for failure to comply with a requirement).
- Caseload selection: For the TANF/SSP caseload, key targets include type of unit (i.e., single-parent units with and without earnings, two-parent units, and child-only units by various reasons for child-only status), state, and presence of noncitizens. An underlying participation function also incorporates varying probabilities of participation by other characteristics, including level of potential benefit, race/ethnicity, and number and ages of children. There is no single source for SSF targets; SSF targets are derived from caseload-reduction reports submitted to the federal government and from various state data systems and reports.
- Child Care and Development Fund:
- Portion of program modeled: Children subsidized through CCDF funds. (States may combine other funds with CCDF funds to serve more children; however, the baselines for this
- analysis identify only the children viewed by the Department of Health and Human Services’ Administration for Children and Families as served by CCDF funds.)
- Unit definition: Includes children and their parents (including both unmarried parents); captures state variation in whether older siblings, relatives (such as a grandparent), teen parents, and nonparent caretakers are included in the assistance unit.
- Timeframe: Monthly
- Policies: Almost entirely state level; source of rules is the CCDF Policies Database (for 2021 policies, see Kwon et al., 2023).
- COVID-19-specific policies: The baseline captures the fact that many states waived copayments for all cases. However, the estimates do not capture other details of states’ COVID-19-related child care policies (e.g., TRIM3 does not attempt to determine which workers might be considered essential workers).
- Eligibility and benefits challenges: In some cases, the family’s required copayment depends in part on the hours that the children require care; that is inferred based on the mother’s usual hours of work. The model treats all months of the year the same, without any special treatment of the summer months.
- Caseload selection: The key target is the average monthly number of children served, by state. Probabilities vary by age of child, single-parent versus two-parent families, and relative income levels. The simulation also takes into account the survey-reported amount of child care expenses; to the extent feasible, eligible families whose simulated copayment is similar to what they reported spending on child care expenses have a higher likelihood of being included in the simulated caseload, and eligible families whose simulated copayment is quite different from what they reported spending (e.g., their simulated copayment was $50/month, but they reported spending $3,600 across the year) have a lower likelihood of being included in the simulated caseload. Administrative targets for 2021 were not available at the time the TRIM3 baseline was created, and so the caseload was aligned to targets from 2020.
- Public and Subsidized Housing:
- Portion of program modeled: Public housing and vouchers for obtaining rental housing.
- Unit: The unit is the CPS ASEC household.
- Timeframe: Monthly
- Policies: The same policies are applied nationally for the definition of income and the computation of each assisted household’s required rent. Fair market rents (FMRs) and income
- limits are obtained from the U.S. Department of Housing and Urban Development (HUD) and vary by county and metropolitan area.
- Eligibility and benefits challenges: Because eligibility policies may vary from one Public Housing Authority to another, baseline simulations do not explicitly model eligibility beyond requiring that household income be below 80% of area median income. However, among households reported to be in public or subsidized housing in the CPS ASEC data, required rents are estimated based on the national-level formulas and the household’s income, and each assisted household’s subsidy value is estimated as the appropriate FMR (based on the county or metropolitan area and the needed apartment size) minus the required rent.
- Caseload selection: Unlike other simulated benefit programs, the public and subsidized housing simulation does not include a participation function or alignment to external targets. Among households reported to be in public or subsidized housing in the CPS ASEC data, if the required rent is less than the assumed FMR (based on location and estimated number of bedrooms), the household is treated as enrolled. If the required rent is greater than the assumed FMR, the household is treated as though it is not in public or subsidized housing.
- Supplemental Nutrition Assistance Program:
- Portion of program modeled: All recipients except those who are homeless or in institutions.
- TRIM3 assigns SNAP units so as to maximize the household’s total SNAP benefit, subject to the constraint that married couples must file together and children under 22 must file with their parents.11 The CPS ASEC does not ask which household members buy and prepare food together, so this aspect of the program’s household definition is not modeled.
- Timeframe: Monthly
- Policies: Policies are obtained from the Food and Nutrition Service (FNS); state COVID-19 waivers are obtained from the FNS website; some state-level variations are obtained from the SNAP State Options Report (Food and Nutrition Service, 2018) and other sources.
___________________
11Unmarried parents are both included in the unit containing their child. When identifying the unit assignments that maximize the household’s total benefit, TRIM3 also imposes the constraint that at least one child under 18 remains eligible (if any are present in the household).
- COVID-19-specific policies: The following changes stemming from the response to the COVID-19 pandemic are captured:
- 15% increase in maximum monthly SNAP benefit—through September 30, 2021.
- SNAP emergency allotments that provide all recipients with the maximum SNAP benefit for their family size. Estimates capture state variation in the month in which emergency allotments ended.
- Expansion of the emergency allotment beginning in April 2021, that guarantees that all SNAP households (in states providing emergency allotments) receive at least $95 more than the benefit for which they would otherwise qualify.
- Temporary partial suspension of the time limit for Able Bodied Adults without Dependents (ABAWD) who do not meet work requirements. The estimates do not deny anyone eligibility due to the ABAWD time limit.
- Expanded eligibility for students of post-secondary education.
- The maximum benefit modeled for October 2021 to December 2021 reflects the increased maximum SNAP benefit arising from the reevaluation of the Thrifty Food Plan.
- Eligibility and benefits challenges: Estimates of SNAP eligibility are very sensitive to assumptions about which members of complex households would jointly file for SNAP. TRIM3 methods follow explicit rules about which family members are required to file for SNAP together and make assumptions about other situations.
- Caseload selection: Key enrollment targets include unit composition (one adult with children, multiple adults with children, presence of a person 60 or older, presence of a person under 60 with a disability, other), presence of cash benefits (SSI or TANF), level of potential SNAP benefit, presence of earnings, state, and citizenship status. State-level targets for 2021 are obtained from the FNS website. The distribution of the caseload by characteristic is obtained from SNAP Quality Control (QC) data. QC data for 2021 were not available at the time the baseline was developed and so the distribution of the caseload by characteristic is based on 2020 SNAP QC data.
- COVID-19-specific policies: The following changes stemming from the response to the COVID-19 pandemic are captured:
- Special Supplemental Nutrition Program for Women, Infants, and Children:
- Portion of program modeled: Benefits to infants, their mothers, and young children (benefits to pregnant women are captured
- only to the extent that a childless woman of childbearing age reports WIC in the CPS ASEC).
- Unit: Federal regulations specify the unit for applying for WIC as the “economic unit”—people living together sharing income and expenses—but there is no explicit definition of this unit. TRIM3 defines the WIC economic unit to include all related people within the household, including both of a child’s unmarried parents.
- Timeframe: Monthly
- Policies: Obtained from FNS data. Basic policies are national, but there is state variation in the value of the benefit and in the certification period for children.
- COVID-specific policies: TRIM3 captures the temporary (4-month) increase to the value of the WIC benefit for the purchase of fruits and vegetables.
- Eligibility and benefits challenges: WIC does not explicitly define whose income is counted in determining eligibility; it is assumed that the eligibility process considers all people related to the children, including both parents in the case of unmarried couples. One aspect of WIC eligibility—nutritional risk—cannot be observed in the CPS ASEC data. The simulation assumes that all people who pass the demographic and financial eligibility tests are at nutritional risk.
- Caseload selection: For infants and children, enrollment is aligned to state-level targets.
- Low Income Home Energy Assistance Program:
- Portion of program modeled: Heating and cooling help (weatherization help is not modeled).
- Unit: The unit is the CPS ASEC household.
- Timeframe: Annual
- Policies: State-specific eligibility policies are obtained from the LIHEAP Clearinghouse website (https://liheapch.acf.hhs.gov/). Because most LIHEAP benefits are provided in the winter, based on eligibility determination in the fall, the simulation uses the eligibility policies in place in the fall of the calendar year; specifically, the CY 2021 LIHEAP eligibility simulation used the fiscal year (FY) 2022 eligibility policies (which went into effect in October 2021).
- COVID-specific policies: Baseline estimates reflect the additional funding made available in response to the pandemic, which allowed more households and higher benefits.
- Eligibility and benefits challenges: Local programs may differ
- in their income definitions or the period over which they assess income, at the point that a household applies for help; all local programs are assumed to use annual income.
- Caseload selection: The simulated caseload is aligned to state-specific targets, which are estimates of the unduplicated count of households receiving heating and/or cooling help over that calendar year.
BASELINE SIMULATIONS OF TAX PROGRAMS
The simulations of taxes require the identification of the tax unit and then the computation of the tax amounts. People are assumed to pay all the taxes that they owe, and with only a few exceptions are assumed to take all available tax credits; therefore, the modeling of taxes does not involve alignment to caseload targets in the same way as the modeling of benefits does. All people are simulated to pay taxes regardless of immigrant or citizenship status. However, undocumented immigrants and temporary residents are assumed to lack Social Security Numbers (SSNs) and to be ineligible for the EITC.12 People without SSNs can claim the CTC for children who have SSNs, and so TRIM3 permits undocumented immigrants and temporary residents to claim the CTC on behalf of their children who are citizens or legal immigrants. Key aspects of the tax simulations are
- Payroll taxes:
- Portion of program modeled: Old Age, Survivors, Disability, and Health Insurance taxes (OASDHI); includes taxes on self-employment earnings and Civil Service Retirement Service (CSRS) contributions.
- Unit definition: The unit is the individual person.
- Timeframe: Annual
- Policies: Social Security website
- Federal income taxes:
- Portion of program modeled: Most aspects of individual income tax computation. Some tax features that are applicable only to very-high-income taxpayers or very rare situations are not modeled.
- Unit definition: Each married couple and unmarried individual age 15 or older in the household is categorized as a tax unit. Children with unmarried parents are assigned to the parent in whose family they appear in the CPS ASEC data. If a child’s parent is a dependent of the household reference person, the
___________________
12To claim the EITC, the tax unit head, spouse, and qualifying children must all have SSNs.
- child also becomes a dependent of the household reference person. Details regarding assignment of children as qualifying children for the EITC are provided in the TRIM3 online documentation.13
- Timeframe: Annual
- Policies: 1040 (and supporting schedule) forms and instructions
- COVID-specific policies: Estimates include the following temporary policy expansions made in response to the COVID-19 pandemic:
- Expanded CTC
- Expanded EITC for workers without qualifying children
- Expansion to the Child and Dependent Care Credit
- Imputations preceding the modeling: Data from the IRS Statistics of Income Public Use File are used to impute amounts of itemized deductions, capital gains/losses, and Individual Retirement Account contributions.
- Alignment of usage of selected credits: In general, taxpayers are assumed to take all credits for which they appear eligible. However, the modeling of the child and dependent care expense credit assumes that a portion of the units who appear eligible—based on having working parents, children under age 13, and child care expenses—do not in fact take the credit for some reason (e.g., because they are ineligible because they have only one qualifying child and are receiving flexible-spending-account benefits).14 The take-up of the credit is aligned to data on the actual number of tax units taking the credit.
- State income taxes:
- Portion of program modeled: Most aspects of states’ individual income tax computation. Some tax features that are applicable only to very-high-income taxpayers or very rare situations are not modeled.
- Unit definition: The state income tax unit definition generally follows the TRIM3 federal tax assignment. For additional details see the TRIM3 online documentation.15
___________________
14In the 2021 baseline, all tax units with adjusted gross income (AGI) below $50,000 who are found eligible for the CDCTC are simulated to claim it. Fifteen percent of eligible tax units with AGI between $50,000 and $100,000 and 70% of those with AGI above $100,000 are simulated as participating in a child and dependent care flexible spending account. Families participating in a flexible spending account who have only one child are generally ineligible for the CDCTC, while those with two or more children qualify for a reduced amount of the CDCTC.
- Timeframe: Annual
- Policies: State-by-state tax rules from state websites and tax forms; some rules based on research conducted by a team led by Dr. Jon Bakija at Williams College.
- COVID-specific policies:
- The estimates do not include any changes to state income tax rules made in response to the pandemic but do reflect the secondary effects of the EITC and CDCTC federal expansion on state credits in some states.
- Economic Impact Payments
- Estimates include EIPs enacted through the Coronavirus Response and Relief Supplemental Appropriations Act in December 2020 and ARPA in March 2021.
- Timeframe: EIPs are modeled as annual additions to family resources. Distribution of the second EIP began in the last couple of days of 2020 and is counted as increasing family resources in 2021.16
- Policies: TRIM3 models the eligibility rules for the EIPs as defined in legislation. In addition to providing the second EIP, the December 2020 legislation extended eligibility for the first EIP (enacted by the Coronavirus Aid, Relief, and Economic Security [CARES] Act in 2020) to certain families with mixed immigrant status who were ineligible under the CARES legislation. EIPs, including retroactive CARES payments, are assigned to all families found eligible.
COVID-19 RESPONSE POLICIES NOT CAPTURED IN THE ESTIMATES
Some COVID-19 response policies are not captured in TRIM3 estimates. Examples of pandemic policies not included in the estimates include Emergency Rental Assistance Payments, eviction moratoria, the EITC “lookback” provision (i.e., enabling tax filers to claim the 2021 EITC based on 2019 earnings if this would result in a higher benefit), expansions to the Premium Tax Credit, and stimulus checks provided by some states. Although insurance status does not directly affect the SPM, out-of-pocket medical costs are counted as a necessary expense. To the extent that changes in Medicaid and premium tax credits during the pandemic affected
___________________
16The Census Bureau’s SPM counts the second EIP in the 2020 SPM rather than in the 2021 SPM.
out-of-pocket medical costs, the effect will be captured through the out-of-pocket medical costs reported in the CPS ASEC.
TRIM3 does not model Pandemic Electronic Benefit Transfer (P-EBT), through which eligible schoolchildren received nutrition benefits on an electronic benefit transfer card. However, the SPM poverty estimates presented here include the Census Bureau’s estimate of the value of free and reduced-price lunch, which includes an imputed P-EBT amount for households that do not report receiving SNAP benefits. The Census Bureau’s SPM assumes that households that report receiving SNAP benefits in the CPS ASEC reported P-EBT as part of the SNAP benefit. Because the TRIM3 estimates use simulated SNAP, rather than reported SNAP, they do not capture P-EBT benefits that would have been reported as part of the SNAP benefit.
2021 BASELINE SIMULATION RESULTS VERSUS TARGETS
The 2021 simulations of benefit programs were, in almost all cases, very successful at meeting administrative targets. As discussed previously, these simulations generally select a simulated caseload from among the households that appear to be eligible, to meet overall caseload targets (shown in Tables H-2 through H-8) as well as subgroup targets. The simulation of taxes differs from the simulation of benefits in that there is almost no alignment involved. Instead, the results are determined almost entirely by applying the tax rules to the survey data. Results are then compared to administrative data for validation purposes, but overall results are not aligned to come closer to those targets. The result of the TRIM3 baseline simulations is a data file that comes as close as feasible to capturing the real-world incidence and amounts of benefits and taxes in 2021.
UNEMPLOYMENT COMPENSATION COMPARED WITH TARGETS
Twenty-three million people have unemployment insurance benefits in the 2021 TRIM3 baseline estimates, receiving a total of 469 million weeks of unemployment benefits and total aggregate annual benefits of $255 billion (Table H-2). Estimates capture 83% of the total administrative target for weeks of unemployment and 80% of total benefits according to administrative data. TRIM3 falls short of the administrative target despite assigning benefits to all those who appear eligible. Some of the shortfall is likely due to UC fraud (not reflected in the TRIM3 estimates). The Government Accountability Office (GAO) has estimated that fraud accounted for 11% to 15% of unemployment insurance paid during the pandemic; there were also additional overpayments that were nonfraudulent (GAO, 2023).
MEANS-TESTED BENEFIT PROGRAM SIMULATIONS COMPARED WITH TARGETS
The simulated caseloads for SSI, TANF, SNAP, and LIHEAP come very close to administrative data figures (Table H-2). For each of these programs, the simulated caseload is within 2% of total national targets. In addition, the simulations come very close to the actual distribution of the caseload in terms of state of residence and key demographic characteristics. The aggregate amounts of simulated benefits are within 2% of the available administrative targets for each of these programs except TANF, for which the TRIM3 baseline falls 8% below the administrative target for TANF-funded benefits.
TRIM3 simulated amounts correct for the underreporting of benefits in survey data (including both truly reported amounts and amounts imputed by the Census Bureau), increasing the total dollars represented in the data by 8% in the case of SSI, 30% in the case of TANF, and 68% in the case of LIHEAP. The 2021 TRIM3 SNAP baseline increases the average monthly number of households receiving SNAP from 14.3 million reported in the CPS ASEC to 21.7 million and increases the total amount of SNAP benefits reflected in the data from $45 billion reported in the CPS ASEC to $112 billion.
Administrative targets for CCDF-funded child care subsidies were not available at the time the TRIM3 CCDF baseline was prepared, and the baseline was aligned to 2020 targets. The CCDF baseline exceeds the 2021 administrative target for the number of participating children by 4%. An administrative target for the total amount of subsidies distributed in 2021 is not yet available and so the simulated estimates are compared to the 2020 target. TRIM3 falls 1% below the 2020 administrative target for CCDF-funded child care subsidies. CCDF-funded child care subsidies are not reported in the survey data.
TRIM3 assigns housing subsidies to any households living in public or subsidized housing according to the public-use survey data, as long as their income is below 80% of the area median income published by HUD and their required rent payment would be lower than the HUD Fair Market Rent based on the number of bedrooms estimated for the household and their county or metropolitan area; these methods overshoot by about 25% the number of households in public housing or with housing vouchers for low-income families funded by HUD, probably because some of the identified households are receiving other types of housing help.
The WIC simulation comes very close to targets for the number of infants and children with WIC. However, the simulation is only able to capture WIC receipt by women who are the mothers of infants; benefits received by pregnant women are not fully captured because the CPS does not identify pregnancy.
TABLE H-2 TRIM3-Simulated Benefits Compared with Administrative Totals, 2021
| CPS ASEC reported dataa | TRIM-simulated | 2021 admin. datab | TRIM as % of admin. data | |
|---|---|---|---|---|
| Unemployment Insurance Benefits | ||||
Number of people receiving benefits | 9,609 | 23,090 | na | – |
Weeks of unemployment benefits | na | 469,154 | 562,635 | 83.4% |
Aggregate annual benefits | $89,588 | $255,120 | $316,953 | 80.5% |
| Supplemental Security income (SSI; noninstitutionalized)c | ||||
Adults with SSI during year for self or child | 6,035 | na | na | na |
Avg. monthly adult recipients (persons) | na | 6,699 | 6,592 | 101.6% |
Avg. monthly child recipients | na | 1,013 | 1,027 | 98.6% |
Annual benefits (for self or child)d | $52,269 | $56,414 | na | na |
Annual benefits to adults | na | $47,599 | $48,538 | 98.1% |
Annual benefits to children | na | $8,815 | na | – |
| Cash Aid to Families – Temporary Assistance for Needy Families (TANF) and Solely State Funded (SSF) | ||||
Avg. monthly caseload (families)e | 816 | 925 | 936 | 98.8% |
Annual benefits | $4,154 | $5,387 | na | na |
Annual benefits for TANF-funded familiesf | – | $4,691 | $5,091 | 92.1% |
Annual benefits for SSF-funded families | – | $697 | na | – |
| CPS ASEC reported dataa | TRIM-simulated | 2021 admin. datab | TRIM as % of admin. data | |
|---|---|---|---|---|
| Supplemental Poverty Measureg | ||||
Avg. monthly units (households)f | 14,324 | 21,663 | 21,689 | 99.9% |
Annual benefits | $44,872 | $111,735 | $114,320 | 97.7% |
| Public and subsidized housing | ||||
Ever-subsidized householdsh | 6,533 | 5,679 | 4,537 | 125.2% |
Annual benefits | na | $55,094 | na | – |
| Low Income Home Energy Assistance Programi | ||||
Assisted households | 4,225 | 5,460 | 5,513 | 99.0% |
Annual benefits | $2,856 | $4,806 | $4,854 | 99.0% |
| Special Supplemental Nutrition Program for Women, Infants, and Children | ||||
Families with any benefits | 2,708 | na | na | na |
Avg. monthly recipients, infants/children | na | 4,751 | 4,774 | 99.5% |
Avg. monthly recipients, womenj | na | 715 | 1,356 | 52.7% |
Annual food benefits, all recipientsk | na | $3,712 | $3,989 | 93.0% |
| Child Care and Development Fund (CCDF)-funded child care subsidiesl | ||||
Avg. monthly children with CCDF subsidy | na | 1,498 | 1,440 | 104.0% |
Aggregate value of subsidy | na | $9,818 | $9,877 | 99.4% |
NOTES: Counts of persons or units are in thousands; dollar amounts are in millions. admin. = administrative, avg. = average, CPS ASEC = Current Population Survey Annual Social and Economic Supplement, na = not available.
a CPS ASEC-reported data included the data that are “allocated” by the Census Bureau in cases of nonresponse. Items not asked in the survey that are imputed by the Census Bureau (such as tax liabilities) are not shown.
b Administrative figures are adjusted or combined for consistency with simulation concepts. In particular, FY administrative data are adjusted for greater comparability with calendar year simulated data, and benefits paid to individuals in the territories are excluded. Benefits include both federally funded and state-funded amounts.
c SSI figures include state supplements. Simulated data include people receiving only state supplements even if those supplements are state administered. Administrative figures are based on federally administered payments with adjustments to reflect supplements in state-administered states.
d Administrative data for SSI include retroactive payments, which are approximately 9% of total payments; TRIM does not simulate retroactive payments.
e For TANF/SSF and SNAP, an average monthly survey-reported caseload is computed using the CPS-reported number of months that benefits are received. The administrative figure combines TANF/SSP program administrative data (adjusted to exclude cases receiving only small worker supplements or pregnancy-only benefits) with state-level SSF caseload figures obtained from state reports and websites.
f The administrative figure for aggregate benefits from TANF is computed as the average per unit benefit from administrative microdata applied to the actual caseload.
g The administrative figures for SNAP exclude SNAP disaster assistance.
h Administrative figure is the number of occupied public and assisted units in Department of Housing & Urban Development programs.
i An exact unduplicated number of assisted households is not available; an unduplicated count is estimated using estimates of the overlap between groups receiving heating, cooling, and crisis benefits.
SOURCE: 2022 CPS ASEC, TRIM3 applied to data from the 2022 CPS ASEC Urban Institute tabulations of Administrative Tax and Benefit Program Data.
TAX SIMULATIONS COMPARED WITH TARGETS
Payroll Taxes
The TRIM3 number of workers observed as subject to OASDI taxes is about 10% below the actual figure (Table H-3). However, the aggregate taxable earnings seen in the data and the resulting simulated payroll taxes are somewhat higher than the administrative data target. This pattern of falling short of the target for the number of workers who are subject to OASDI taxes while exceeding the total amount of taxes is consistent with other baseline years and is driven by reported employment and earnings in the CPS ASEC. A contributing factor to the excess in OASDI taxes is that CPS ASEC respondents are likely to report their full earnings, rather than their earnings less nontaxable components such as pre-tax health insurance premium payments and contributions to medical and dependent care flexible benefits plans. Such reductions to earnings are not captured in the
TABLE H-3 TRIM3-Simulated Payroll Taxes Compared with Administrative Targets, 2021
| TRIM-simulated | 2021 admin. dataa | TRIM as % of admin. data | |
|---|---|---|---|
| Workers subject to OASDI tax | |||
Workers | 162,001 | $176,870 | 91.6% |
OASDI taxable earnings | $8,695,660 | $8,260,589 | 105.3% |
OASDI taxes paidb | $1,078,260 | $1,040,496 | 103.6% |
| Workers subject to HI tax | |||
Workers | 166,246 | 180,359 | 92.2% |
HI taxes paidc | $299,384 | $309,268 | 96.8% |
a Counts of workers are in thousands, dollar amounts are in millions. admin. = administrative, HI = Hospital Insurance, OASDI = Old-Age, Survivors and Disability Insurance.
b OASDI administrative data are obtained from Annual Statistical Supplement to the Social Security Bulletin, 2024, https://www.ssa.gov/policy/docs/statcomps/supplement/2024/index.html
c HI administrative data are obtained from Annual Statistical Supplement to the Social Security Bulletin, 2023, https://www.ssa.gov/policy/docs/statcomps/supplement/2023/indexhtml. The taxes paid include the employer and worker portions. Only the worker portion is counted in the SPM.
SOURCE: The Urban Institute, authors of chapter, based on TRIM3 applied to data from the 2022 CPS ASEC.
baseline simulation. TRIM3 falls about 8% below the administrative target for workers subject to the Hospital Insurance (HI) tax and about 3% below the target for total HI taxes paid.
Federal and State Incomes Taxes
The federal income tax simulation estimate of tax returns with positive income tax liability is 10% higher than the actual number of returns with positive income tax liability for tax year 2021 (Table H-4). TRIM3 typically exceeds the number of tax returns with positive income tax liability by 5% to 7%. The larger discrepancy for 2021 may in part be attributable to TRIM3 modeling all eligible families as having received the advance CTC and third EIP during 2021 and not modeling any of these payments as received with tax returns (claiming these amounts on tax returns would cause some returns with positive tax liability to have negative tax liability, lowering the real-world number of positive tax returns relative to TRIM3). TRIM3 falls short of the actual amount of tax liability on positive-tax returns by 11%. The recovery rebate credit and American Opportunity
TABLE H-4 TRIM3-Simulated Federal and State Income Taxes Compared with Administrative Targets, 2021
| TRIM-simulated | 2021 admin. dataa | TRIM as % of admin. data | |
|---|---|---|---|
| Federal income taxesa | |||
| Total AGI | $14,267,200 | $14,795,614 | 96.4% |
| Total taxable income | $11,312,100 | $11,767,185 | 96.1% |
| Number of positive-tax returns | 115,358 | 104,550 | 110.3% |
| Total taxes (positive returns)b | $1,959,470 | $2,203,442 | 88.9% |
| State income taxes | |||
| Taxes paid, net of creditsc | $502,639 | $532,291 | 94.4% |
| Total tax units | |||
| Number of positive-tax returns | 97,850 | na | – |
| Number of negative-tax returns | 9,091 | na | – |
NOTES: Counts of returns are in thousands, dollar amounts are in millions. admin. = administrative, AGI = adjusted gross income, na = not available.
SOURCE: TRIM3 applied to data from the 2022 CPS ASEC. Poverty in the United States: 2021.
Credit were excluded from the IRS target for positive tax liability for this comparison, because TRIM3 models all eligible families to receive the EIP (so none claim the recovery rebate credit) and TRIM3 does not model the American Opportunity Credit. The shortfall in taxes is likely due to the CPS ASEC not capturing all the income in the highest portion of the income distribution. The same issue is observed in the simulation of state income taxes, which identifies an aggregate amount of state income liability that is 6% below the aggregate target.
Child and Dependent Care Tax Credit
The baseline captures 97% of the IRS target for the number of returns with the CDCTC and 91% of the amount claimed according to the IRS (Table H-5).
Earned Income Tax Credit
TRIM3 captures 71% of the number of returns claiming the EITC according to IRS data and 60% of the dollars claimed. The shortfall in simulated EITC is not unique to TRIM3 and is commonly observed in other microsimulation estimates based on CPS ASEC data (Wheaton & Stevens, 2016). TRIM3 captures a higher share of the EITC for returns without qualifying children17 in 2021 (83% of returns and 77% of benefits according to IRS data) than for returns with qualifying children (60% of returns and 56% of EITC benefits). TRIM3 assigns EITC to all units found eligible according to the CPS ASEC data. The shortfall in simulated EITC likely arises from the combined effect of real-world noncompliance (not modeled in TRIM3) and CPS ASEC data limitations. The IRS estimates that 28% of EITC benefits in FY 2021 and 32% of EITC benefits in FY 2022 were claimed in error (IRS, 2023), although caution has been advised in interpreting noncompliance estimates (Greenstein et al., 2019; Taxpayer Advocate Service, 2018). The most common reasons for EITC overclaims include claiming children who do not qualify (primarily because they do not live with the claimant), misreporting income (primarily, misreporting self-employment income), and using an incorrect filing status (primarily, married couples filing as head of household or single instead of jointly (Crandall-Hollick, 2015).
Approximately 30% of earnings responses in the CPS ASEC are imputed. To the extent that earnings and other responses in the CPS ASEC are inconsistent with actual earnings and family circumstances, TRIM3 estimates will be affected. There is also evidence to suggest that single-parent families may be underrepresented in the CPS ASEC. Both the TRIM3 and Mathematica SNAP models find fewer single-parent families eligible for SNAP than receive SNAP according to administrative data, and an analysis of linked CPS ASEC and SNAP administrative data in three states shows evidence of underrepresentation of single-parent families (Wheaton et al., 2021).
Assigning additional families to receive the EITC would likely require some combination of modeling noncompliant receipt of the EITC and
___________________
17TRIM3 identifies “qualifying children” according to IRS rules and includes children who meet SSN, relationship, residency, and joint return requirements and are under 19, age 19–23 and a full-time student, or fully disabled of any age.
adjusting earnings and family composition data and weights in the CPS ASEC. The committee chose not to request any such adjustments for this study.
The Child Tax Credit
The TRIM3 baseline reflects nearly the full amount of 2021 CTC distributed to families according to IRS data. TRIM3 calculates the total amount of CTC for which families are eligible and assigns half to be received as advance CTC and half to be received when tax returns are filed. Under this methodology, TRIM3 captures 96% of the tax returns with advance CTC according to IRS data and 97% of the 2021 tax returns with CTC. TRIM3 captures 96% of the total amount of CTC according to the IRS data.
The advance CTC was sent to families based on prior year tax information. Some families received amounts for which they were ineligible based on their 2021 incomes and numbers of qualifying children. Most low-income families were not required to pay excess amounts back. TRIM3 does not capture the excess amounts covered by this “safe harbor,” estimated at $5 billion (Splinter et al., 2025). If not for this safe harbor, TRIM3 would capture 98% of the total CTC in 2021.
The credit for other dependents is a nonrefundable $500 credit for dependents who do not qualify for the CTC. It is typically not separable from the CTC but is separable from the ARPA-expanded CTC in 2021. Children not meeting U.S. residency requirements were ineligible for the expanded CTC in 2021 but continued to qualify for the “nonrefundable CTC” if eligible. TRIM3 does not simulate taxes or credits for people living abroad and so falls somewhat short of the combined IRS target for the credit for other dependents and the nonrefundable CTC—capturing 93% of the target number of returns with these credits and 75% of the amount claimed.
Distribution of CTC by AGI level and Filing Status
Although TRIM3 comes close to the total aggregate amount of CTC in 2021, the distribution of the advance CTC by AGI level and filing status differs substantially from the distribution according to IRS administrative data. TRIM3 assigns families with AGI below $10,000 47% more advance CTC dollars than were distributed according to the IRS and finds far fewer families with AGI between $10,000 and $40,000 eligible for the advance CTC than received the credits according to the IRS (Table H-6). TRIM3 exceeds the IRS totals for advance CTC sent to tax units with AGI between $60,000 and $400,000. Similar patterns are observed in the Census Bureau’s advance CTC estimates (Bee et al., 2023b).
TABLE H-5 TRIM3-Simulated CDCTC, EITC, and CTC Compared with Administrative Totals, 2021
| TRIM-simulated | 2021 admin. dataa | TRIM as % of admin. data | |
|---|---|---|---|
| Child and Dependent Care Tax Credit (CDCTC) | |||
| Returns with credit | 6,051 | 6,234 | 97.1% |
| Total credit | $11,858 | $13,059 | 90.8% |
| Earned Income Tax Credit (EITC), total | |||
| Returns with credit | 22,891 | 32,216 | 71.1% |
| Total credit | $39,099 | $65,684 | 59.5% |
| EITC, Returns with no qualifying children | |||
| Returns with credit | 12,585 | 15,109 | 83.3% |
| Total credit | $9,521 | $12,428 | 76.6% |
| EITC, Returns with qualifying childrenb | |||
| Returns with creditb | 10,306 | 17,108 | 60.2% |
| Total credit | $29,578 | $53,257 | 55.5% |
| Child Tax Credit (CTC) and credit for other dependents | |||
| Returns receiving advance CTC | 36,623 | 37,962 | 96.5% |
| Returns receiving some or all CTC at tax filing | 36,623 | 37,772 | 97.0% |
| Returns receiving nonrefundable CTC or credit for other dependents | 10,926 | 11,779 | 92.8% |
| Total CTC credit including advance payment | $201,304 | $209,490 | 96.1% |
| Nonrefundable CTC/credit for other dependents | $6,523 | $8,725 | 74.8% |
NOTES: Counts of units are in thousands, dollar amounts are in millions. admin. = administrative.
a Federal income tax credit totals are obtained from IRS SOI Tax Stats—Individual income tax returns complete report (Publication 1304) for tax year 2021, https://www.irs.gov/statistics/soi-tax-stats-individual-income-tax-returns-publication-1304-complete-report. Advance CTC totals are obtained from the IRS table “Table 1. Advance Child Tax Credit Payments,” https://www.irs.gov/statistics/soi-tax-stats-advance-child-tax-credit-payments-in-2021.
b EITC-qualifying children include children under 19, full-time students under 24, and children of any age who are permanently and totally disabled, all of whom are included in the TRIM3 EITC-qualifying child totals shown here. Tables in this report that are restricted to SPM units with children under 18 will only reflect EITC paid on behalf of older children if they are part of an SPM unit containing a child under 18.
SOURCE: 2022 CPS ASEC, TRIM3 applied to data from the 2022 CPS ASEC Urban Institute tabulations of Administrative Tax and Benefit Program Data.
| IRS tax units | TRIM3 tax units | TRIM3/IRS tax units | IRS dollars | TRIM3 dollars | TRIM3/IRS dollars | |
|---|---|---|---|---|---|---|
| Total | 37,962 | 36,623 | 96% | $93,621 | $100,652 | 108% |
| <10k | 2,619 | 3,223 | 123% | $6,257 | $9,225 | 147% |
| 10k–<20k | 4,149 | 1,983 | 48% | $10,181 | $5,986 | 59% |
| 20k–<30k | 4,725 | 2,775 | 59% | $11,829 | $8,111 | 69% |
| 30k–<40k | 4,211 | 2,813 | 67% | $10,629 | $8,032 | 76% |
| 40k–<50k | 3,125 | 2,654 | 85% | $8,074 | $7,968 | 99% |
| 50k–<60k | 2,436 | 2,376 | 98% | $6,335 | $6,804 | 107% |
| 60k–<100k | 6,823 | 7,299 | 107% | $18,084 | $21,257 | 118% |
| 100k–<200k | 7,144 | 9,399 | 132% | $17,710 | $25,842 | 146% |
| 200k–<400k | 2,414 | 3,802 | 158% | $4,168 | $7,068 | 170% |
| 400k+ | 316 | 302 | 96% | $354 | $358 | 101% |
NOTES: Counts of units are in thousands, dollar amounts are in millions. TRIM3 assigns the advance CTC to 23% percent more married couples than received the payment according to IRS data (Table H-7). Despite assigning the advance Child Tax Credit (CTC) to all tax units that appear eligible, TRIM3 captures just 68% of the IRS total for tax returns other than joint filers that receive the advance CTC. TRIM3 assigns the CTC consistently with the income and demographic information provided in the Current Population Survey Annual Social and Economic Supplement. Further analysis would be needed to explain the reasons for these differences.
SOURCE: IRS data: https://www.irs.gov/statistics/soi-tax-stats-advance-child-tax-credit-payments-in-2021
| IRS tax units | TRIM3 tax units | TRIM3/IRS Tax units | IRS dollars | TRIM3 dollars | TRIM3/IRS dollars | |
|---|---|---|---|---|---|---|
| Single | 2,432 | 1,787 | 73% | $5,249 | $4,175 | 80% |
| Married joint | 19,481 | 24,006 | 123% | $51,666 | $67,055 | 130% |
| Married separate | 728 | na | na | $1,535 | na | na |
| Head of household | 15,279 | 10,831 | 71% | $35,074 | $29,421 | 84% |
| Qualifying widow/widower | 42 | na | na | $97 | na | na |
| Total | 37,962 | 36,623 | 96% | $93,621 | $100,652 | 108% |
| Married joint | 19,481 | 24,006 | 123% | $51,666 | $67,055 | 130% |
| All other | 18,481 | 12,618 | 68% | $41,956 | $33,597 | 80% |
NOTES: Counts of units are in thousands, dollar amounts are in millions. na = not available.
SOURCE: IRS data: https://www.irs.gov/statistics/soi-tax-stats-advance-child-tax-credit-payments-in-2021
EIP SIMULATIONS COMPARED WITH TARGETS
The baseline estimates assign EIPs to all people who appear eligible. TRIM3 simulates an aggregate amount of $142 billion for the second EIP (Table H-8). According to IRS data, $141 billion had been distributed to families for the second EIP as of February 2021. Families who were eligible but did not receive a payment from the IRS or did not receive the full amount to which they were entitled were able to claim the additional amount through the recovery rebate credit on their 2020 tax returns. According to IRS data, $45.4 billion was claimed in recovery rebate credits on 2020 tax returns—however, this reflects the total rebate for the first and second stimulus checks. Data showing the amount paid for the second stimulus check alone are unavailable, to the committee’s knowledge.
TRIM3 assigns $461 million for the retroactive CARES benefit for mixed-status families. The committee is not aware of an IRS target to which to compare this amount.
TRIM3 assigns an aggregate amount of $347.3 billion for the third EIP (provided by ARPA). The IRS reports distributing $401.5 billion in the third round of EIPs as of December 31, 2021, and taxpayers claimed an additional $20.9 billion in recovery rebate credits on their 2021 tax returns. TRIM3 therefore captures about 87% of third EIP dollars distributed in
TABLE H-8 TRIM3-Simulated Economic Impact Payments Compared with Administrative Totals, 2021
| TRIM-simulated | 2021 admin. data | |
|---|---|---|
| Federal Economic Impact Payments (EIP) | ||
| Second EIP (modeled) | $141,838 | na |
| Second EIP distributed (as of Feb 2021)a | na | $141,472 |
| Recovery rebate credit on 2020 returns (1st and 2nd EIPs)b | na | $45,428 |
| Retroactive CARES benefit for mixed-status families (modeled) | $461 | na |
| American Rescue Plan EIP (modeled) | $347,294 | na |
| American Rescue Pan EIP (distributed 2021)c | na | $401,512 |
| Recovery rebate credit on 2021 returnsd | na | $20,863 |
NOTES: Dollar amounts are in millions. admin. = administrative, na = not available.
a IRS Second Round EIP Statistics, Table 1, https://www.irs.gov/statistics/soi-tax-stats-coronavirus-aid-relief-and-economic-security-act-cares-act-statistics
b IRS Table 3.3 All Returns: Tax Liability, Tax Credits, and Tax Payments by Size of Adjusted Gross Income, Tax year 2020 (Filing Year 2021), https://www.irs.gov/statistics/soi-tax-stats-individual-statistical-tables-by-size-of-adjusted-gross-income
c IRS Third Round EIP Statistics Table 1, Cumulative through December 31, 2021, https://www.irs.gov/statistics/soi-tax-stats-coronavirus-aid-relief-and-economic-security-act-cares-act-statistics
d IRS Table 3.3 All Returns: Tax Liability, Tax Credits, and Tax Payments by Size of Adjusted Gross Income, Tax Year 2021 (Filing Year 2022), https://www.irs.gov/statistics/soi-tax-stats-individual-statistical-tables-by-size-of-adjusted-gross-income
SOURCE: 2022 CPS ASEC, TRIM3 applied to data from the 2022 CPS ASEC Urban Institute tabulations of Administrative Tax and Benefit Program Data.
2021 and about 82% of third EIP dollars including amounts distributed by the IRS in 2021 and amounts paid through the recovery rebate credit on 2021 tax returns. TRIM3 does not capture amounts paid to armed forces personnel not included in the CPS ASEC, U.S. citizens living abroad, people living in institutions, and people experiencing homelessness, all of which are included in the IRS totals. TRIM3 estimates do not capture overpayments of stimulus checks, which occurred when the IRS sent checks based on prior year tax information to people who would not be eligible, or would be eligible for a lower amount, based on their current incomes. Families were able to retain the overpayments—they did not need to be returned to the IRS.
2021 Baseline Child Poverty
This project assessed child poverty using the concepts of the SPM. The SPM uses a broader definition of resources than the Official Poverty Measure, including the value of noncash benefits and the impact of tax liabilities and credits. The SPM also uses different thresholds for determining poverty status than the Official Poverty Measure. For further details, see Creamer et al. (2022).
The poverty calculations used in this report follow the Census Bureau approach to calculating the SPM but substitute certain components of SPM resources and expenses with TRIM3-simulated amounts. For some components (i.e., UC, SSI, TANF, SNAP, LIHEAP) the TRIM3-simulated amounts replace amounts that are reported in the survey data (Table H-9). These benefits are substantially underreported in the CPS ASEC, whereas the TRIM3-simulated amounts come close to the actual level of benefits provided according to administrative data. For other SPM components, the TRIM3-simulated amounts replace amounts (e.g., taxes and housing subsidies) that are not included in the survey but are calculated or imputed by the Census Bureau. Using TRIM3 rather than Census Bureau amounts for these variables preserves the internal consistency between TRIM3-simulated benefits in different programs and ensures consistency between baseline and alternative policy simulations.18
To validate the TRIM3 SPM calculations, first the SPM was calculated following the Census Bureau methodology using unadjusted CPS ASEC variables and Census Bureau imputed variables.19 Then TRIM3 variables were substituted for the CPS ASEC and Census Bureau imputed variables and compared the effects of the TRIM3 variables on the estimates.
When the TRIM3 is used to calculate SPM poverty using only the CPS ASEC and the Census Bureau imputed values, 3.804 million children are found to be in SPM poverty in 2021, compared with 3.829 million according to the Census Bureau (Table H-4).20 Small differences such as this arise because the calculated results are generated using public-use data rather than internal Census Bureau files and because certain household heads younger than 18 who are living with parents are classified as “children”
___________________
18See Wheaton and Stevens (2016) for a review and comparison of the Census Bureau and TRIM3 tax methodology.
19See Creamer et al. (2022) for discussion of the Census Bureau’s methods.
20See Appendix table B-4 of Creamer et al. (2022).
TABLE H-9 TRIM3 Benefits and Expenses Incorporated into the 2021 SPM
| SPM Benefit or Expense | Notes |
|---|---|
| UC | TRIM3 UC amounts are used instead of the reported amounts. |
| SSI | TRIM3 SSI amounts are used instead of the reported amounts. |
| TANF | TRIM3 TANF amounts are used instead of the reported amounts. |
| SNAP | TRIM3 SNAP amounts are used instead of the reported amounts. |
| WIC | TRIM3-simulated amounts are used instead of the Census Bureau values assigned to people who report WIC receipt in the Current Population Survey Annual Social and Economic Supplement. |
| LIHEAP | TRIM3-simulated amounts are used instead of reported amounts. |
| Public and subsidized housing | Uses TRIM3 public and subsidized housing subsidies rather than amounts imputed by the Census Bureau to households reporting receipt of public and subsidized housing assistance. TRIM3 follows the Census Bureau SPM methodology of capping the amount of the subsidy counted for the SPM at the share of the SPM threshold representing shelter and utility expenses, less the household’s required rental payment. |
| Child care expenses | Primarily reflects Current Population Survey reported amount. However, for families simulated by TRIM3 to receive Child Care and Development Fund child care subsidies, reflects the required copayment amount. Child care expenses are counted as an expense in the SPM. |
| Payroll taxes | TRIM3-simulated amounts are used instead of Census Bureau-simulated amounts. |
| Realized capital gains/loss | Reported amounts are augmented with values statistically matched from the IRS Public Use File as part of the federal income tax baseline. (The Census Bureau SPM does not include realized capital gains/loss.) |
| Federal income tax | TRIM3-simulated amounts are used instead of Census Bureau-simulated amounts. Includes taxes on capital gains (not included in the Census Bureau estimate). Includes refundable credits. |
| State income tax | TRIM3 baseline simulated amounts are used instead of Census Bureau-simulated amounts. Includes taxes on capital gains. Includes refundable credits. Replaces Census Bureau-simulated amounts. |
| Economic Impact Payments | TRIM3-simulated amounts are used instead of Census Bureau-simulated amounts. |
NOTE: LIHEAP = Low Income Home Energy Assistance Program, SNAP = Supplemental Nutrition Assistance Program, SPM = Supplemental Poverty Measure, SSI = Supplemental Security income, TANF = Temporary Assistance for Needy Families, UC = Unemployment Compensation, WIC = Special Supplemental Nutrition Program for Women, Infants, and Children.
SOURCE: Compiled by Urban Institute, authors of this appendix.
when calculating the SPM threshold in the calculated results, but not in the published results.21
Next, the incremental effects of substituting TRIM3 variables for the CPS ASEC and Census Bureau variables are shown in the poverty calculation, focusing first on TRIM3 correction for underreporting of UC, SSI, TANF, SNAP, WIC, and LIHEAP, and then describing the effects of incorporating other TRIM3 variables.
Substituting TRIM3-simulated UC income into the Census Bureau SPM poverty definition lowers the estimated SPM child poverty rate from 5.2% to 4.4%. If the TRIM3-simulated UC is kept in the SPM definition and CPS-reported SSI is replaced with the TRIM3-simulated SSI amount, the child poverty rate drops from 4.4% to 4.2%. Replacing CPS-reported TANF with TRIM3-simulated TANF lowers the child poverty rate from 4.2% to 4.0%. Replacing CPS-reported SNAP with TRIM3-simulated SNAP decreases the estimated child poverty rate from 4.0% to 2.7%. Replacing the Census Bureau’s WIC and LIHEAP values with TRIM3-simulated WIC and LIHEAP has little effect on the poverty rate. Taken together, the TRIM3 adjustments for underreporting reduce the estimated SPM child poverty rate from 5.2% to 2.6%, with the largest percentage point reductions coming from SNAP and UC.
Table H-10 shows the effects on the SPM poverty estimate as other TRIM3 adjustments (i.e., housing subsidies, child care expenses, taxes, and the third EIP) are incorporated into the SPM definition. The Census Bureau’s SPM counts the second EIP in the 2020 SPM rather than in the 2021 SPM, and so results are compared prior to incorporating the second EIP. As noted previously, adjustments to housing subsidies, child care expenses, taxes, and EIPs do not replace reported variables but instead replace values imputed by the Census Bureau. They are included in the TRIM3 poverty estimates to preserve internal consistency between simulated programs and between the baseline and the committee’s simulated policy options.
Incorporating TRIM3 housing subsidies into the SPM estimate that includes TRIM3 correction for underreporting increases the estimated child
___________________
21The change in the number of children results from TRIM3’s restructuring of “inverted households” in the TRIM3 conversion process. These households are ones in which a teen or young adult is reported to be the household reference person, despite having one or both parents present. Many of these households involve immigrants, and it is likely that the teen or young adult was selected as the reference person because of his/her English capability. TRIM3 reorganizes the inverted households, so that a parent is the household reference person. If the teen is under the age of 18, reclassifying the teen from “head” to “child” increases the number of children in the unit, thus affecting the SPM poverty threshold. If the teen is working, then reclassification as a “child” also affects the unit’s work expenses, as the SPM methodology does not assign work expenses to children under the age of 18 unless they are the head or spouse of the SPM unit.
TABLE H-10 Effect of TRIM3 Adjustments on SPM Child Poverty and Deep Poverty Estimates, 2021
| Children in poverty | Children in deep poverty | |||
|---|---|---|---|---|
| Total (1000s) | Percent | Total (1000s) | Percent | |
| Census Bureau (published) | 3,829 | 5.2% | 1,029 | 1.4% |
| Census Bureau (calculated) | 3,804 | 5.2% | 1,009 | 1.4% |
| TRIM3 adjustments: | ||||
| Correction for underreportinga | ||||
| UC | 3,244 | 4.4% | 897 | 1.2% |
| + SSI | 3,078 | 4.2% | 770 | 1.0% |
| + TANF | 2,952 | 4.0% | 713 | 1.0% |
| + SNAP | 2,019 | 2.7% | 415 | 0.6% |
| + WIC | 1,972 | 2.7% | 406 | 0.6% |
| + LIHEAP | 1,937 | 2.6% | 402 | 0.5% |
| Other TRIM3 adjustmentsb | ||||
| + Housing | 1,963 | 2.7% | 414 | 0.6% |
| + Child care expenses | 1,962 | 2.7% | 415 | 0.6% |
| + Retirement contributions | 1,954 | 2.7% | 411 | 0.6% |
| + Taxes and tax credits | 2,149 | 2.9% | 430 | 0.6% |
| + American Rescue Plan Stimulus | 2,334 | 3.2% | 520 | 0.7% |
| Additional (not in Census Bureau SPM)c | ||||
| + EIP #2 and retroactive CARES benefit | 2,055 | 2.8% | 488 | 0.7% |
NOTE: EIP = Economic Impact Payment, LIHEAP = Low Income Home Energy Assistance Program, SNAP = Supplemental Nutrition Assistance Program, SPM = Supplemental Poverty Measure, TANF = Temporary Assistance for Needy Families, UC = Unemployment Compensation, WIC = Special Supplemental Nutrition Program for Women, Infants, and Children.
a The “correction for underreporting” rows show the effects of replacing the Current Population Survey Annual Social and Economic Supplement (CPS ASEC) amounts with TRIM3simulated variables that correct for underreporting. First, TRIM3-simulated UC is substituted for reported UC. Starting from that simulation, TRIM3-simulated SSI is then substituted for reported SSI, and so on. TRIM3 child support income adjustments are incorporated at the same time as TANF.
b The “other TRIM3 adjustments” rows show the effects of replacing the other values in the SPM with TRIM3-simulated variables. Starting from the correction for underreporting simulation that includes LIHEAP, TRIM3-simulated housing subsidies are substituted for the Census Bureau imputed subsidies. Next, TRIM3 child care expenses (based on reported amounts but adjusted to reflect required copayments of people simulated to receive Child Care and Development Fund subsidies) are substituted for the amounts reported in the CPS ASEC. The Census Bureau does not include retirement distributions for people under 59 in money income and so excludes such distributions from the SPM. The TRIM3 tax model simulates taxes on all retirement distributions and so retirement distributions for people under 59 are
included in resources for consistency with the tax estimates. The next row shows the effect when TRIM3 payroll taxes, federal income taxes and credits (including the advance Child Tax Credit), and state income taxes and credits are substituted for the Census Bureau calculated values. TRIM3 realized capital gains (and loss) are incorporated at the same time as taxes. The next row shows the effect of substituting the TRIM3 simulated American Rescue Plan Act economic impact payment for the Census Bureau’s calculated value.
c The Census Bureau counts the second economic impact payment (EIP #2) as resources for the 2020 SPM, not the 2021 SPM. The second economic impact payment was enacted by the Coronavirus Response and Relief Supplemental Appropriations Act in December 2020 and began to be distributed on December 29, 2020. (See https://www.irs.gov/newsroom/treasury-and-irs-begin-delivering-second-round-of-economic-impact-payments-to-millions-ofamericans.) The Census Bureau does not explicitly model ineligibility for the Child Tax Credit due to lack of a social security number, so the retroactive CARES benefit for families with mixed immigrant status is not relative to their estimates. The retroactive benefit was authorized in the December 2020 legislation and is included with EIP #2 in the final row of the table.
SOURCE: TRIM3 tabulations using data from the 2022 CPS ASEC. Census Bureau, 2021, https://www.census.gov/content/dam/Census/library/publications/2022/demo/p60-277.pdf
poverty rate by 0.1 percentage points, while incorporating TRIM3 child care expenses does not affect the estimated poverty rate. The Census Bureau does not include retirement distributions to people under 59 in money income and so excludes these distributions from the SPM. The TRIM3 tax model simulates taxes on all retirement distributions and so the TRIM3 SPM measure includes retirement distributions to people under 59 in resources for consistency with the tax estimates. Doing so does not affect the estimated 2021 child poverty rate. Substituting TRIM3 taxes and tax credits for the Census Bureau amounts and incorporating TRIM3-realized capital gains and losses increases the child poverty rate 0.2 percentage points. Substituting the TRIM3 third EIP for the Census Bureau’s imputed amount raises the child poverty rate by 0.3 percentage points. In contrast to the Census Bureau, TRIM3 models the relevant SSN requirements for the EITC, EIP, and CTC and so some families that would be found eligible for these payments by the Census Bureau are found ineligible by TRIM3, reducing their estimated antipoverty effect. Taken together, the TRIM3 corrections for underreporting and other TRIM3 adjustments (prior to the addition of the second EIP and Retroactive Cares benefit) reduce the child poverty rate from 5.2% in the Census Bureau’s estimate to 3.2%. Adding in the second EIP and the retroactive CARES benefit for mixed status families lowers the estimated poverty rate to 2.8%.
The TRIM3 adjustments also affect the deep poverty rate—the share of children below half of the poverty threshold. Correction for underreporting reduces the estimated deep poverty rate from 1.4% to 0.5% for children. Incorporating TRIM3 housing subsidies, child care expenses, and taxes and tax credits increases the deep poverty rate for children by 0.2 percentage points. Adding in the second EIP and retroactive CARES benefit does
not affect the deep poverty rate for children. Most children eligible for the second EIP and retroactive CARES benefit are already lifted out of deep poverty by other pandemic benefit expansions, including the third EIP, expanded CTC, and expanded SNAP benefits.
EFFECT OF EITC AND CTC ON BASELINE POVERTY
At the committee’s request, estimates were prepared showing the effect of the EITC and CTC on baseline poverty under several scenarios. All references to EITC and CTC are to federal amounts (the secondary effect of any change in state CTC or state EITC is not included). In addition, all scenarios that exclude the CTC include the credit for other dependents received on behalf of children and other dependents who would not qualify for the CTC under the typical year (not under ARPA) rules. Poverty is shown under the following scenarios:
- No CTC or EITC:
- excludes CTC and advance CTC
- excludes EITC
- With EITC Only:
- includes the EITC
- excludes CTC and advance CTC
- With non-expansion CTC Only:
- excludes the EITC
- models the CTC without the 2021 expansion
- With both EITC and non-expansion CTC:
- includes the EITC
- models the CTC without the 2021 expansion
In the text of the report, poverty rates are reported for these four scenarios as well as for a fifth scenario representing the actual 2021 configuration, which includes the EITC and both the non-expansion CTC and the expansion CTC.
ALTERNATIVE POVERTY ESTIMATES
The antipoverty effect of the EITC and CTC relative to two alternative measures of SPM poverty in 2021 were also estimated. The first alternative estimates the effects of the EITC and CTC in the absence of other pandemic expansions. The second measure estimates poverty with all pandemic expansions in effect but only counts refundable credits received during the calendar year (i.e., it does not include refundable credits accrued on 2021 income that are received based on tax returns filed in 2022, and it includes an approximation of refundable credits received on 2020 tax returns). Details of each alternative are provided below.
SPM Poverty Without Other Pandemic Expansions
The first alternative set of poverty estimates examines the effect of the EITC and CTC in 2021 under a hypothetical scenario in which there were no pandemic-related policy expansions in other programs. The scenario assumes no change in employment and “backs out” the pandemic-related policy expansions for UC, TANF, CCDF, LIHEAP, SNAP, WIC, and the CDCTC. EIPs are also excluded from the estimate.
Modeling UC Without Pandemic Expansions
Policies related to unemployment compensation changed markedly during the COVID-19 pandemic. Policies were temporarily modified related to eligibility for unemployment benefits, duration of benefits, and amount of benefits. Below, an overview of the various policy changes is provided, and the following section provides additional detail on modeling the impact of whether individuals did or did not have to look for work as a condition of eligibility.
Overview of UC Policies
Table H-11 provides an overview of the UC policies in place during 2021 under two scenarios: the actual policies (the baseline) and the alternative scenario with no COVID-19 response policies. In the case of the baseline, the chart shows the policies in place during two portions of the year: from January to the point when the expansion policies ended and the remainder of the year. Some states opted out of the expansion policies as early as late spring/early summer; in states that did not opt out early, the expansion policies remained in place until the second week of September.
Relative to the baseline, the alternative simulation with no COVID-19policies produces the following changes:
- Some recipients receive unemployment in both simulations but have fewer weeks of benefits than they had in the baseline; these are people who still have some weeks of regular state unemployment benefits and/or extended benefits remaining in 2021.
- Other people have 0 weeks of unemployment benefits in the noCOVID-19-policies simulation, even though they had it in the baseline, due to any of several reasons:
- They used up all their available weeks of benefits in 2020.
- They are in a group ineligible under standard rules (e.g., self-employed).
- They do not report looking for work in the CPS; this aspect of the simulation is discussed in more detail below.
TABLE H-11 Assumptions for Modeling Unemployment Benefits in 2021
| With pandemic policies (base) | No pandemic policies (alternative) | |||
|---|---|---|---|---|
| January to end of expansiona | Remainder of year | January to end of expansiona | Remainder of year | |
| Weeks available | Include federal weeks due to COVID-19 | Regular policies, COVID-19 weeks no longer available | Regular policies, assume no COVID-19 weeks were ever available (not even in 2020) | |
| Amount of benefits | Includes extra $300/week | No extra federal amount | No extra federal amount | |
| Eligibility groups | Includes additional groups (e.g., self-employed, students) | Standard eligibility restrictions for specific groups | Standard eligibility restrictions for specific groups | |
| Work-history requirements | Reduced | Standard | Standard | |
| Looking-for-work requirements | Not imposedb | Yes, imposed | Imposed, but assume some people started to lookc | Yes, imposed |
a End date is earlier of state’s opt-out point or first week of September.
b People with part-year work, but who also have weeks of nonwork, are not required to have weeks of looking for work to be eligible. (People not looking for work whose nonwork is due to retirement, disability, or student status are still not considered eligible.)
c Half of the group defined in note b are considered eligible during this period, which assumes that they would have started to look for work—at least to the extent needed for Unemployment Compensation eligibility—if that had been a requirement. The other half are not considered eligible. The halves are determined randomly.
SOURCE: Compiled by Urban Institute, authors of this appendix.
- For weeks of benefits prior to the point that expansions ended, all recipients have lower benefit amounts under the alternative scenario than under the baseline.
Modeling Whether or Not UC Recipients Must Look for Work
One of the aspects of pandemic unemployment policy was to either entirely remove or lessen the standard requirement for people to be looking for work to receive benefits. Shortly after the outset of COVID-19, all states used federal flexibility to change procedures so that people did not have to prove or attest that they were looking for work, even for “regular” weeks
of unemployment. Those policies reverted to the standard “look for work” requirements by summer 2021 in most places.22
In baseline modeling for 2021, the standard requirement that people report looking for work to be assigned unemployment benefits was removed. Instead, the simulation allowed some people with weeks of nonwork (but also some connection to the labor force) to be considered eligible for assignment of UC, with certain restrictions. Specifically, if an individual had some weeks of work (which were more likely to be toward the end of 2021) but also weeks of nonwork (more likely to be at the start of 2021), and their weeks of nonwork were not reported as being due to retirement, disability, or student status, they were considered eligible for UC in their nonwork weeks even if they did not report to the CPS that they were looking for work, during the period that expansion policies were in place in their state. (People were required to be looking for work as a condition of UC receipt starting from the second week of September, or the point when a state opted out of the federal expansion in opt-out states. Although specific policies vary by state, the simulation does not capture that additional detail.) Because the administrative targets for UC were very high relative to the eligible group in most states, most of this subset of eligible people (i.e., part-year nonworkers without weeks of looking) wound up having UC benefits in the 2021 baseline simulation.
To develop the alternative scenario, an assumption was required regarding people’s looking-for-work behavior during COVID-19, and how that might have changed if receipt of unemployment benefits had required looking for work. Specifically: if unemployment benefit receipt had required looking for work, even during COVID-19, some people who did not look for work in the expansion portion of 2021 might have started looking for work to whatever extent was required to gain eligibility. In the absence of information on what portion of nonworkers might have started looking for work, the following assumptions were used:
- For the portion of the year previously covered by the expanded pandemic policies, the simulation selected half of the potentially affected group—part-year workers, part-year nonworkers, with 0 weeks of looking for work—as being eligible for unemployment benefits during their weeks of nonwork. This approach implicitly assumes that the selected individuals would have looked for work if that was what was required to receive unemployment benefits.
- From the point that a state opted out of federal expansions, or the second week of September (whichever is earlier), the fully standard
___________________
22https://www.cnbc.com/2021/08/04/collecting-unemployment-most-states-re-impose-work-search-rules.html
- policies were used—the same as in the baseline—requiring explicitly looking for work.
Modeling Other Benefits and CDCTC Without Pandemic Expansions
The alternative scenario without pandemic expansions makes the following changes to means-tested benefits and the CDCTC:
- TANF
- Removes special COVID-19 benefits paid in some states.
- CCDF
- Replaces COVID-19-response rules (e.g., waived requirements for copayments) with 2019 rules.
- LIHEAP
- Scales down benefits across the board, to reflect typical-year spending levels, under the following rough assumption:
- Benefits increase (relative to 2019) by the same percentage as the increase in the LIHEAP block grant between 2019 and 2021, excluding additional allocations from CARES and ARP.
- There is no variation by state in the percentage increase.
- Scales down benefits across the board, to reflect typical-year spending levels, under the following rough assumption:
- SNAP
- Removes the following expansions:
- 15% increase in maximum benefit through September 30.
- Emergency allotments.
- Expanded eligibility for students in post-secondary education.
- For simplicity, retains the waiver of ABAWD time limits in all states (households containing children are not affected by ABAWD time limits).
- Removes the following expansions:
- WIC
- Removes the temporary four-month increase in the value of WIC for fruits and vegetables.
- CDCTC
- Models typical year rules.
Due to data limitations, the estimates do not “back out” the P-EBT benefits captured in the Census Bureau’s school lunch estimate and the increased school lunch subsidies arising from expanded availability of free school lunch during the pandemic.
SPM Poverty with Credits Counted in Year of Receipt
The second alternative poverty measure reflects federal income taxes and credits experienced during 2021 under the assumption of perfect
withholding under nonexpansion rules, counts refundable credits received in spring 2021 on 2020 tax returns, and includes advance CTC payments distributed in July to December 2021. This approach differs from SPM estimates that count the taxes and credits based on calendar year income, regardless of when taxes are paid or credits are received. The estimates include the pandemic-related expansions to UC, TANF, CCDF, LIHEAP, SNAP, and WIC, the second and third EIPs, and the retroactive CARES benefit for mixed-status families.
The 2022 CPS ASEC only provides income data for 2021. To approximate refundable credits received based on 2020 income when federal income taxes are filed in spring 2021, 2021 income amounts were deflated to 2020 using the chained Consumer Price Index and 2020 federal income tax rules were modeled. To summarize, the alternative baseline includes the following CTC and EITC amounts:
- The refundable portion of CTC and EITC received on 2020 tax returns (approximated by deflating 2021 income to 2020 and simulating 2020 tax rules).
- The CTC and EITC reducing positive tax liability through withholding in 2021 (assumes perfect withholding based on nonexpansion rules).
- The advance CTC.
The effect of the CTC and EITC on poverty in 2021 were then calculated, relative to this alternative baseline, under the following scenarios:
- No CTC or EITC:
- Excludes all federal CTC and federal EITC from the SPM.
- Continues to include the credit for other dependents, assigning the credit on behalf of children and other dependents who would not qualify for the CTC under standard-year CTC rules.
- Comparisons are made to an “actual” that only counts credits received in 2021. So, the following credits are excluded:
- Refundable portion of EITC and the refundable portion of the CTC estimated to be received on 2020 tax returns (approximated by deflating income to 2020 and simulating 2020 tax rules).
- CTC and EITC reducing positive tax liability when simulated without ARPA expansion (this reflects the assumption of what would be experienced through perfect withholding, without adjustment for ARPA).
- Advance CTC.
- With EITC Only:
- Excludes all federal CTC including advance CTC from the SPM.
- Continues to include the credit for other dependents, assigning the credit on behalf of children and other dependents who would not qualify for the CTC under standard-year CTC rules.
- Comparisons are made to an “actual” that only counts credits received in 2021. So, the following credits are excluded:
- Refundable portion of the CTC estimated to be received on 2020 tax returns (approximated by deflating income to 2020 and simulating 2020 tax rules).
- CTC reducing positive tax liability when simulated without ARPA expansion (this reflects the assumption of what would be experienced through perfect withholding, without adjustment for ARPA).
- Advance CTC.
- With nonexpanded CTC Only:
- Excludes all federal EITC and the advance CTC from the SPM.
- Includes the credit for other dependents.
- Comparisons are made to an “actual” that only counts credits received in 2021. So, the following counted credits are excluded:
- Refundable portion of EITC estimated to be received on 2020 tax returns (approximated by deflating income to 2020 and simulating 2020 tax rules but without the EITC). Captures the secondary effect of the absence of the EITC on increasing the refundable portion of the CTC for some families with more than two children.
- EITC reducing positive tax liability when simulated without ARPA expansion (this reflects the assumption of what would be experienced through perfect withholding, without adjustment for ARPA).
- Advance CTC.
- With both EITC and nonexpanded CTC:
- Models federal CTC without the ARPA expansions to the CTC; calculates SPM poverty based on these CTC estimates.
- Includes the credit for other dependents.
- Comparisons are made to an “actual” that only counts credits received in 2021. So, the following counted credits are excluded:
- Advance CTC.
POVERTY TABLES AND SUBGROUP DEFINITIONS
The poverty tables produced for this analysis include top-line estimates for the entire population, but most of the tables focus on families (SPM units) containing at least one person under 18. The SPM unit is defined according to the Census Bureau’s methodology (Creamer et al., 2022) to include all related people in the CPS ASEC household. Cohabiting partners and their families are combined into the same SPM unit. Foster children under 22 and children under 15 without parents present are included in the SPM unit of the householder.
As described previously, all benefit and tax calculations are performed using the appropriate unit definition for the benefit or tax program being simulated. Individually based benefits (UC and payroll taxes) are summed across the members of the SPM unit. TRIM3 divides each means-tested benefit equally across the eligible members of the assistance unit and then sums the individual-level benefits for the members of the SPM unit. TRIM3 assigns federal and state income taxes to the tax unit “head.” These amounts are then summed to the SPM unit level.
Subgroups in the poverty tables are defined according to the characteristics of the SPM unit. In the poverty tables, “head” refers to the head of the SPM unit. If there is only one SPM unit in the household, the head is the CPS ASEC household reference person. If the household contains unrelated families or unrelated individuals who are not combined with another SPM unit because of a cohabiting partner relationship, then the unrelated family reference person, or unrelated individual, is the “head” of his or her SPM unit.
Below are key concepts used to describe demographic subgroups in the poverty tables.
Age of mother, father, or unit head: Reflects the age of the biological, adoptive, or stepmother (if present), or else the biological, adoptive, or stepfather (if present). If neither the father nor mother is present, then the characteristics of the SPM unit head are used, unless the child is the unit head, spouse, or cohabiting partner, in which case the child is excluded.
Child and parent or unit head nativity: If a child has at least one biological, adoptive, or stepparent that was born in another country, the child is classified as having an immigrant parent. Persons born abroad to American parents are counted as U.S. born. If a child does not have a parent present, the immigrant status of the unit head and the unit head’s spouse are used, unless the child is the unit head, spouse, or cohabiting partner, in which case the child is excluded.
Child in nonimmigrant family: A child is classified as being in a nonimmigrant family if the child is U.S. born and any parent(s) present in the
household are U.S. born. If the child’s parents are not in the household, then a U.S.-born child is classified as in a nonimmigrant family if the head and spouse (if present) of the SPM poverty unit are U.S. born. Individuals who report that they were “born abroad to American parents” are counted as U.S. born.
Child in mixed-status family: A citizen child is classified as being in a mixed-status family if there is at least one noncitizen in the SPM unit.
Citizenship/legal status of unit members: Citizens include both U.S.born and naturalized citizens.
Employment status of adults in unit: Reflects the work status of persons aged 18 or older in the SPM poverty unit. “Full-year” is classified as 50 weeks or more, and “full-time” is classified as 35 hours per week or more. Children in units without adults (i.e., those aged 15 to 17 living without parents or caretakers) are included in the “no workers” row.
Noncitizen child in a mixed-status family: All noncitizen children are classified as being in mixed-status families.
Other noncitizens: Noncitizens not classified as undocumented or recent. These include legal permanent residents who have been in the United States for more than five years, refugees/asylees, and “temporary residents”—noncitizens legally admitted to the United States for a specified period and for a specified purpose, such as students, guest workers, intra-company transfers, diplomats, and au pairs.
Other race: Includes non-Hispanic children who are American Indian or Alaska Natives or report more than one race.
Participation in a major safety net program: At least one member of the SPM poverty unit receives SNAP, Medicaid, CHIP, TANF or GA, SSI, or public and subsidized housing.
Recent immigrant: A person entering as a legal permanent resident within the last five years.
Unit with disabled nonelderly member: A child is classified as being in an SPM poverty unit with a person with a disability if there is at least one person in the unit who is younger than 65 and is identified as disabled according to the definition used when determining SSI eligibility.
ABOUT THE URBAN INSTITUTE
The Urban Institute strives to meet the highest standards of integrity and quality in its research and analyses and in the evidence-based policy recommendations offered by its researchers and experts. We believe that operating consistent with the values of independence, rigor, and transparency is essential to maintaining those standards. As an organization, the Urban Institute does not take positions on issues, but it does empower and support its experts in sharing their own evidence-based views and policy
recommendations that have been shaped by scholarship. Funders do not determine our research findings or the insights and recommendations of our experts. Urban scholars and experts are expected to be objective and follow the evidence wherever it may lead.
Acknowledgments
This project was funded by the National Academies of Sciences, Engineering, and Medicine to provide microsimulation support for the consensus study Pathways to Reduce Child Poverty: Impacts of Federal Tax Credits. The views expressed are those of the authors and should not be attributed to the Urban Institute, its trustees, or its funders.
Information presented here is derived in part from the Transfer Income Model version 3 (TRIM3) and associated databases. TRIM3 requires users to input assumptions and/or interpretations about economic behavior and the rules governing federal programs. Therefore, the conclusions presented here are attributable only to the authors of this report.
We thank the following people for their contributions to this project: Margot Crandall-Hollick for providing policy and data background on the 2021 tax credits and EIPs; Dilovar Haydarov and Paul Johnson for programming support, and Sarah Knowles, Katherine Hueston, and Margaret Todd for research support. We also thank current and former members of the TRIM3 project team (not already mentioned) whose work contributed to the development of the 2021 TRIM3 baseline simulations and technical maintenance of the system, including Joyce Morton (lead programmer), Elaine Maag and Sarah Minton (senior research staff); and Ilham Dehry, Kelly Dwyer, Limor Goldsmith, Kevin Moclair, Lauren Simpson, Silke Taylor, and Kevin Werner.
We are grateful to the U.S. Department of Health and Human Services, Office of the Assistant Secretary for Planning and Evaluation (HHS/ASPE), for the ongoing support they provide to maintain the CPS-based TRIM3, and for granting permission for the HHS-funded TRIM3 baseline simulations to be used as the foundation for other analyses such as this one.
URBAN INSTITUTE TRIM3 PROJECT CONSULTANTS
Laura Wheaton
is a Senior Fellow in the Urban Institute’s Division of Tax and Income Supports, specializing in analyzing government safety net programs, poverty estimation, and the microsimulation modeling of tax and transfer programs. She co-directs the TRIM3 microsimulation model project
and leads TRIM3 and ATTIS microsimulation work focused on public and subsidized housing, SNAP, federal income taxes, and poverty measurement. Her research focuses primarily on SNAP, child support, and the effect of changes in tax and benefit policy affecting lower-income families.
Linda Giannarelli
is the Practice Area Lead for Income, Benefits, and Poverty analysis within Urban’s Division of Tax and Income Supports. She currently co-leads the State of the Safety Net Initiative using the ATTIS model and co-directs development and use of the TRIM3 microsimulation model, with a focus on TANF, unemployment benefits, and employment changes. Her research focuses on program participation rates, the interactions across safety net programs, and the ways in which changes to safety net policies affect the economic well-being of lower-income families.


