Pathways to Reduce Child Poverty: Impacts of Federal Tax Credits (2026)
Chapter: 9 Alternative Policy Options
9
Alternative Policy Options
The statement of task charged the committee to consider: “What changes to the tax rules and requirements and the procedures for administering the Child Tax Credit (CTC) and Earned Income Tax Credit (EITC), if adopted, would further reduce the number of U.S. children in poverty?” This chapter presents the committee’s estimates of the potential impact of several alternative policy options, with reference to provisions under the permanent tax code (for the EITC) and the Tax Cuts and Jobs Act of 2017 (TCJA; for the CTC) and to the provisions of the CTC and EITC put in place in 2021 by the American Rescue Plan Act (ARPA). As noted in Chapter 8, estimated impacts of provisions of the EITC and CTC policies in 2021 on child poverty were clearly affected by the pandemic economy and the other pandemic programs that prevailed in that year (see Chapter 6). In attempt to mitigate these confounding influences, the committee estimated the impacts of a range of longer-term policy options in a more typical economic and policy context, namely 2018.
The committee evaluated a number of alternative policy options that are described in detail in this chapter. Constrained in the number of policy options that it could evaluate, the committee had to balance multiple, albeit related, goals in selecting the options it analyzed, including relevance to recent policy and policy proposals and variation across important dimensions. The committee primarily focused on variations of the CTC, including policy options that vary in several key dimensions, including eligibility, phase-in or phase-out rates, and maximum credit levels. (Chapter 2 reviews these policy parameters of EITC and CTC.) The next section provides a more detailed discussion of the policy options the committee considered.
To evaluate how alternative EITC and CTC policy options might impact child poverty, the committee relied on the Transfer Income Model version 3 (TRIM3; see Chapter 3 and Appendix H for details). The committee used TRIM3 to estimate the antipoverty impacts of alternative policy options without adjusting for employment responses, referred to below as the baseline estimates. The committee also produced estimates of the impacts of a subset of the policy options after accounting for employment (and thus earnings) responses to the policy options considered. The committee also estimated the impacts of the policy options on various measures of poverty, namely deep poverty (50% of the Supplemental Poverty Measure [SPM] poverty threshold) and near poverty (150% of the SPM poverty threshold). Given the limitations of available data and TRIM3 and, importantly, the specific requests included in its statement of task, the committee did not attempt to model and analyze impacts of a “lookback” option, variations in credit eligibility by household structure, or indicators of child well-being not captured by income measures.1
The main messages from this chapter are highlighted in Box 9-1.
KEY FEATURES OF ALTERNATIVE POLICY OPTIONS
The policy options that the committee considered primarily focus on changes to the CTC that would be expected to reduce child poverty, although a few involve changes to the provisions of the EITC. The committee discussed and selected the options aiming to meet multiple goals—including relevance to recent policy and policy proposals, variation across important dimensions (e.g., refundability, age of children, phase-in and phase-out rates)—and reflecting a range of policy considerations. These policy options are compared to two baselines. The first—which is the starting point for most of the policy options the committee considered—consists of the non-ARPA and permanent provisions of the EITC (“non-ARPA EITC”) and the CTC under TCJA in place before and after 2021 (“TCJA CTC Only”). This baseline is referred to in this chapter as either “current policy” or, more precisely, as “Non-ARPA EITC + TCJA CTC Policies” (see Box 1-2). The committee also evaluated some policy options against a second baseline that is a modified version of the CTC Policy in 2021 and the EITC Policy in 2021.2 More precisely, the “Modified CTC Policy in 2021” was the CTC policy that prevailed in 2021, except, as detailed below, it used
___________________
1 As noted in Chapter 3, TRIM3 cannot account for previous year earnings and therefore cannot estimate the impact of “lookback” options. Available data and resources also limited the number of alternatives that could be estimated.
2 While this policy is referred to as the “EITC Policy in 2021” throughout this chapter, as discussed in Chapter 2 the provisions of the EITC Policy in 2021 for families with children are almost identical to those under the non-ARPA EITC (i.e., current EITC policy).
BOX 9-1
Chapter 9 Main Messages
- All of the alternative policy options that the committee considered reduce child poverty relative to current Earned Income Tax Credit (EITC) and Child Tax Credit (CTC) policy, but by varying amounts.
- Policy options that maintain the current $2,000 maximum credit have relatively modest effects, while those that increase the credit result in larger reductions. More generous EITC payments also modestly reduce child poverty.
- For almost all policy options, incorporating employment responses reduces their estimated impact on child poverty compared to not adjusting for such responses.
- Using alternative measures of poverty (i.e., deep poverty and near poverty) yields consistent results: the policy options the committee considered reduce child poverty relative to existing policy.
- With respect to fiscal outlays and relative to current policy, all policy options increase the share of funds going to children in families with incomes below 50% of the Supplemental Poverty Measure (SPM) poverty threshold (deep poverty) and those in families with incomes between 50% and 100% of the threshold. However, even while the policy options reduce child poverty, only a small share of these policies’ fiscal outlays go to children living in poverty.
- While the incidence of child poverty differs greatly by race and ethnicity, immigration status, family demographics, and program participation, most of the policy options the committee considered reduce poverty by similar proportions across most groups. However, the largest percentage point changes are typically for groups with the highest poverty rates under current EITC and CTC policies.
a faster phase-out of CTC benefits which would reduce the fiscal outlays compared to the CTC Policy in 2021 and thereby reduce the CTC benefits going to middle- and higher-income households. The combined EITC and CTC provisions of this second baseline are referred to as the “Modified Combined EITC & CTC Policies in 2021” to distinguish it from the term “Combined EITC & CTC Polices in 2021” used in Chapter 8 and elsewhere in the report to describe the combined EITC and CTC policies implemented under ARPA in 2021 (see Box 1-2).
All analyses use data from the U.S. Census Bureau’s Current Population Survey Annual Social and Economic Supplement (CPS ASEC) for calendar year 2018 (collected in spring 2019), since this is the most recent year unaffected by COVID-19 pandemic-era (hereafter, “pandemic”) programs for which TRIM3 estimates are available. However, all dollar amounts
discussed and presented in this chapter are denominated in 2021 dollars, for consistency with results presented in Chapter 8.3
The committee’s policy options vary several parameters of the CTC:
- The maximum credit (from $2,000 to $5,600).
- The phase-in4 (from a 15% total phase-in starting with earnings over $2,500, to 30% per child starting with the first dollar, to no earnings requirement).
- Refundability (from a maximum of $1,600 per child to the full credit amount).
- Additional innovations, including a $1,000 minimum credit, or a phased-in $2,000 supplement to a base CTC with no earnings requirement.
- Exemptions for policy options with a CTC dependent on earnings (i.e., for families with young children or a caretaker who is over 65 or disabled).
- Extension of credit to families in which children and/or parents do not have Social Security Numbers (SSNs).
- A faster phase-out of CTC benefits that start at $75,000 for single and heads of household (HoH) tax filers and $110,000 for married filing jointly (MFJ) filers. Under current CTC policy, the phase-out starts at $200,000 for single and HoH filers and $400,000 for MFJ filers. (In all policy options considered, a phase-out rate of 5% was used.) This faster phase-out is used not only in the modified version of the CTC policy implemented in 2021 but also for other options and, as will be discussed below, reduces the fiscal outlays for CTC benefits relative to existing policy by reducing CTC benefits going to middle- and higher-income households.
As described below, the committee focused on only a subset of these policy options in some of the analyses discussed in this chapter.
Some policy options also are evaluated in combination with an 8 percentage point increase in the EITC amount (i.e., from credit rates of 34%, 40%, and 45% for one, two, or three or more children to rates of 42%, 48%, and 53%). The committee primarily considers this expanded EITC combined with policy options that reduce the extent to which the CTC is tied to earnings. Expanding the generosity of the EITC may counteract reductions in the incentive to work resulting from the CTC changes.
Table 9-1 summarizes the parameters underlying the 16 policy options considered. As noted above, this list includes the first baseline (the
___________________
3 See footnote 5 for details on how adjustments are made to dollar amounts.
4 See Chapter 2 for detailed explanations of parameters, including phase-out, phase-in, and refundability.
TABLE 9-1 Parameters for Child Tax Credit (CTC) Components of Policy Options (POs)a
| Description | Max nonrefundable per child credit (older|younger) | Cap on max refundable credit per child (older|younger) | Age restrictions | Earnings requirement | Minimum CTC with no earnings | Phase-in start | Phase-in rate | Ex-emptionsb | Phase-out startc (HoH)|(MFJ) | 8 percentage point increase in EITC evaluated?d | |
|---|---|---|---|---|---|---|---|---|---|---|---|
| *PO 1 | Base: Approximate Current Policy | $2000|$2000 | $1600|$1600 | Under 17 | 2500 | 0 | 2500 | 15% | No | $200,000|$400,000 | No |
| 2324.3 | |||||||||||
| PO 2 | PO 1 + Extend to 17-year-old children | $2000|$2000 | $1600|$1600 | Under 18 | 2500 | 0 | 2500 | 15% | No | $200,000|$400,000 | No |
| 2324.3 | |||||||||||
| PO 3 | PO 2 + Faster phase-out | $2000|$2000 | $1600|$1600 | Under 18 | 2500 | 0 | 2500 | 15% | No | $110,000|$75,000 | No |
| PO 4 | PO 3 + Phase-in with first dollar of earnings | $2000|$2000 | $1600|$1600 | Under 18 | 0 | 0 | 1 | 15% | No | $110,000|$75,000 | No |
| PO 5 | PO 4 + Phase-in at 15% per child | $2000|$2000 | $1600|$1600 | Under 18 | 0 | 0 | 1 | 15% per child | No | $110,000|$75,000 | No |
| PO 6 | PO 5 + Minimum $1000 per child credit (only PO 6) | $2000|$2000 | $1600|$1600 | Under 18 | 0 | $1000 | 1 | 15% per child | No | $110,000|$75,000 | No |
| Description | Max nonrefundable per child credit (older|younger) | Cap on max refundable credit per child (older|younger) | Age restrictions | Earnings requirement | Minimum CTC with no earnings | Phase-in start | Phase-in rate | Ex-emptionsb | Phase-out startc (HoH)|(MFJ) | 8 percentage point increase in EITC evaluated?d | |
|---|---|---|---|---|---|---|---|---|---|---|---|
| PO 7 | PO 5 + Fully refundable | $2000|$2000 | None | Under 18 | 0 | 0 | 1 | 15% per child | No | $110,000|$75,000 | No |
| $2000|$2000 | |||||||||||
| PO 8 | PO 7 + Phase-in at 30% per child | $2000|$2000 | None | Under 18 | 0 | 0 | 1 | 30% per child | No | $110,000|$75,000 | Yes |
| $2000|$2000 | |||||||||||
| PO 9 | PO 8 + Exempt elderly, disabled and w/children <6 from earnings | $2000|$2000 | None | Under 18 | 0 | 0 | 1 | 30% per child | Yes | $110,000|$75,000 | Yes |
| $2000|$2000 | |||||||||||
| PO 10 | PO 9 + Maximum credit $3000 ($3600 child <6) | $3000|$3600 | None | Under 18, Young children under 6 | 0 | 0 | 1 | 30% per child | Yes | $110,000|$75,000 | Yes |
| $3000|$3600 | |||||||||||
| PO 11 | PO 10 + Minimum 50% of max credit (only PO 11) | $3000|$3600 | None | Under 18, Young children under 6 | 0 | Half the max credit | 1 | 30% per child | Yes | $110,000|$75,000 | Yes |
| $3000|$3600 |
| **PO 12 | Modified version of Combined EITC & CTC Policy in 2021; uses faster phaseout than actual CTC Policy in 2021 | $3000|$3600 | None | Under 18, Young children under 6 | 0 | $3000|$3600 | n/a | Eliminated | No | Yes | |
| $3000|$3600 | |||||||||||
| PO 13 | PO 12 + Add $2000 phased in at 15% (only PO 13) | $5000|$5600 | None | Under 18, Young children under 6 | 0 | $3000|$3600 | 1 | 15% | Yes | $110,000|$75,000 | Yes |
| $5000|$5600 | |||||||||||
| PO 14 | PO 12 + Maximum credit $3600 ($4200 child <6; only PO 14) | $3600|$4200 | None | Under 18, Young children under 6 | 0 | $3600|$4200 | n/a | Eliminated | No | $110,000|$75,000 | Yes |
| $3000|$3600 | |||||||||||
| PO 15 | PO 12 + Extend to children w/out SSN | $3000|$3600 | None | Under 18, Young children under 6 | 0 | $3000|$3600 | n/a | Eliminated | No | $110,000|$75,000 | Yes |
| $3000|$3600 |
| Description | Max nonrefundable per child credit (older|younger) | Cap on max refundable credit per child (older|younger) | Age restrictions | Earnings requirement | Minimum CTC with no earnings | Phase-in start | Phase-in rate | Ex-emptionsb | Phase-out startc (HoH)|(MFJ) | 8 percentage point increase in EITC evaluated?d | |
|---|---|---|---|---|---|---|---|---|---|---|---|
| PO 16 | PO 15 + Extend to parents w/out SSN | $3000|$3600 | None | Under 18, Young children under 6 | 0 | $3000|$3600 | n/a | Eliminated | No | $110,000|$75,000 | Yes |
| $3000|$3600 |
NOTES: EITC = Earned Income Tax Credit, HoH = Head of Household, MFJ = Married Filed Jointly. * PO 1 is the non-American Rescue Plan Act of 2021 (ARPA) EITC + Tax Cuts and Job Act Child Tax Credit (CTC) PO.
** PO 12 is the Modified Combined EITC & CTC Policies in 2021.
a Bolded POs denote focal options.
b Exemption definitions: Families with young children: tax units with dependent children under age 6. Caregivers with disabilities: adults with dependent children under age 18 who report they (1) received Supplemental Security Income in 2012 for a disability, blindness, or another reason; (2) are under age 65 and received Social Security income. Caregivers over age 65: tax units with dependent children under age 18 and at least one tax filer over age 65.
c A phase-out rate of 5% was used for all policy options. This is the phase-out rate under current CTC policy.
d All policy options evaluated assuming current or non-ARPA EITC schedule in place. Those options marked “Yes” are also evaluated with an 8 percentage point increase in these benefits.
SOURCE: Estimates from TRIM3 commissioned by the committee.
non-ARPA EITC + TCJA CTC Policy provisions or current policy, that is denoted as PO 1);5 and the second baseline (the Modified Combined EITC & CTC Policies in 2021), in which, as noted above, the CTC benefits are phased out faster than under the actual CTC Policy in 2021. The other policy options are structured so that each differs in only one dimension from another, allowing estimated changes in poverty to be attributed to a specific parameter change. These changes are mostly sequential, which means the impacts associated with each policy depend in part on the order in which changes are made. The bolded cells in Table 9-1 show the parameter changes for each policy option. For example:
- PO 1 (non-ARPA EITC + TCJA CTC policies) and PO 2 are identical, except PO 2 includes children under 18 (rather than under 17).
- In PO 3, the CTC phases in after $2,500 of earnings, whereas in PO 4 the CTC phases in with the first dollar of earnings.
- PO 5 further changes the phase-in rate from 15% total to 15% per child (maintaining the phase-in starting with the first dollar of earnings).
In a few cases, a parameter is temporarily altered and then reverted back to its previous value. For example:
- PO 6 provides for a $1,000 minimum credit, regardless of earnings, with all other parameters identical to PO 5. PO 7 reverts (i.e., does not include a $1,000 minimum), and eliminates the cap on refundability.
- PO 13 is identical to PO 12 except that it adds a $2,000 per child CTC that phases in at a total of 15% of earnings. For example, the CTC for a child over 6 would be $3,000 (as in PO 12), plus an additional $2,000 if parents earned at least $13,333.
- PO 15 and PO 16 extend the credits to families in which the children (PO 15) and parents (PO 16) do not have SSNs.
___________________
5 As noted above, the dollar values for the policy parameters of the various policy options, including PO 1, are denominated in 2021 dollars. So, for example, the CTC maximum benefit per child under PO 1 is $2,000 in 2021 dollars. In the TRIM3 estimation of the impacts of these various policies on child poverty and fiscal outlays using 2018 CPS ASEC data, all dollar-denominated parameters are deflated to 2018 dollars for the purposes of estimation, and results are reported in 2021 dollars when relevant. Because, as discussed in Chapter 2, under TCJA the CTC maximum credit amount as well as income thresholds for credit phase-out were not indexed to inflation, PO 1 is not exactly the same as the CTC policy that prevailed after the expiration of ARPA. Nonetheless, it is close to that policy and, as such, it is referred to as “current policy” in this chapter.
Results for all 16 policy options are presented in most of the tables and figures in this chapter, although some only include subsets of policy options for reasons explained below.
The committee selected seven focal policy options for this discussion, including options that reflect non-ARPA EITC + TCJA CTC policies and Modified Combined EITC & CTC Policies in 2021:
- PO 1: $2,000 per child phased in at 15% of earnings over $2,500 (non-ARPA EITC + TCJA CTC policies).
- PO 5: $2,000 per-child maximum CTC, phased in at 15% per child from the first dollar of earnings.
- PO 6: $2,000 per-child maximum CTC, phased in at 15% per child from the first dollar of earnings, along with a $1,000 per-child minimum credit.
- PO 9: Exempts from any earnings requirement for caretakers who are elderly, disabled, or with children under 6.
- PO 11: Provides 50% of maximum credit to families without earnings, with the rest phased in at the current rate.
- PO 12: The Modified Combined EITC & CTC Policies in 2021 is a faster phase-out of CTC benefits; provides the full credit to families without earnings.
- PO 13: Adds to PO 12 a maximum $2,000 per-child credit phased in at 15% of earnings.
These focal policy options vary the generosity of the CTC and the extent to which they increase or decrease the return to work (see Table 9-1).
Figure 9-1 provides a visual summary of the variation in key parameters for the committee’s seven focal policy options—the slope of the phase-in and phase-out, the credit available to those without earnings, and the maximum credit amount—for single-parent households (i.e., HoH tax filers). These illustrations consider a HoH with one child under 6 and one child over 6, a family structure for which the differences across policy options are particularly salient, as CTC options vary with family size and by age of children.
Panels A through D of Figure 9-1 compare the CTC benefit schedules for focal options PO 5, PO 6, PO 9, and PO 11 with PO 1, which is current (non-ARPA) policy—the TCJA CTC Only policy. (PO 9 is not shown because it varies only in the exemption of some families from earnings requirements, which does not change the figure.) These policy options primarily vary in the speed and structure of the phase-in and all of them phase out CTC benefits faster than current policy by starting their phase-out at lower levels of household income/earnings than does current CTC policy.


Panel D of Figure 9-1 compares the CTC schedule for PO 12, the Modified CTC Policy in 2021, with the schedule for the unmodified version or actual version of the CTC policy that was in place in 2021. As noted above, the Modified CTC schedule has a faster phase-out of benefits than the actual CTC Policy in 2021 and, as a result, would provide lower CTC benefits to middle- and higher-income households than did the actual CTC Policy in 2021.
For each of the 16 policy options, the impact on child poverty rates is estimated with the current or non-ARPA EITC schedule and no other policy changes. In addition, the impact on child poverty rates is also estimated for PO 6 through PO 12, combined with an 8 percentage point increase in the EITC.6 Consistent with the analysis in Chapter 8, the primary focus was on how variations in key policy parameters are estimated to impact rates of child poverty, as well as deep poverty and near poverty. Results are reported for selected subgroups and consider the sensitivity to a range of estimated employment effects. Fiscal outlays are also considered, as are the distribution of the EITC and CTC across groups defined by family income relative to the poverty threshold.
Finally, as noted above, the committee considered the impacts of various policy options with and without adjusting for the employment responses to these options by the parents/adults in households. “Baseline results” are presented for the (estimated) impacts on child poverty of all of the policy options listed in Table 9-1 that do not adjust for employment effects. Then, for a subset of policy options, estimates of their impacts are presented after adjusting for employment effects using the approach described in Chapter 7. Unlike the temporary policy changes that were considered in Chapter 8, the policy options considered in this chapter are assumed to be permanent.7 (See the discussion of these employment effect adjustments below in the Methods section.)
___________________
6 An 8 percentage point increase would constitute a 20% increase in the current rate of credit (40%) for families with two children and an 18% increase in the current rate (45%) for those with three or more children. Several past increases in the federal EITC—such as those in 1986 (10% to 14%), in 1990 (14% to 18.5%), and in 1993 (18.5% to 40%)—were larger in percent terms. Also, of the 31 states plus the District of Columbia that have their own earned income credits, the median increase above the federal level is 15%, while 13 of those states have increases of 20% or higher. See Figure 9-2.
7 Considering permanent versus temporary policy changes matters for how employment effects are calculated, as explained in Chapter 7. Because the options considered in this chapter are assumed to be permanent, the elasticities reported in Panel B of Table 7-1 are used to account for employment effects.

NOTE: ARPA = American Rescue Plan Act, CTC = Child Tax Credit, EITC = Earned Income Tax Credit, TCJA = Tax Cuts and Job Act.
METHODS
Results presented in this chapter are based on calculations using TRIM3, unless noted otherwise. As discussed in greater detail in Appendix H and Chapter 8, the TRIM3 simulation uses data from the CPS ASEC and calculates the poverty status for each household in the survey, using the SPM. For the TRIM3 calculations in this chapter, data for calendar year 2018 are used, obtained from the CPS ASEC conducted in spring 2019 and thus capturing income in the prior year. Using 2018 data provides estimates from a nonpandemic period of near-full employment, which could lead to different impacts than would have occurred during the pandemic-associated recession.
In interpreting the committee’s findings, three features of TRIM3 are important to consider:
- TRIM3 uses government administrative data to adjust for known measurement and reporting errors in the CPS ASEC with respect to various government benefits (see Appendix H). Net adjustments result in increases in reported participation and benefits received from all major transfer programs, and thus lower estimated poverty rates compared to those reported by the Census Bureau.
- TRIM3 estimates EITC and CTC amounts each household would receive by applying the formulas for those credits embedded in the tax rules, thereby assuming 100% take-up.
- Credits are assigned in the year they are accrued—not the following calendar year, when they are more likely to be received.
Additional discussion of these features and their implications is provided in Chapter 8, which used the same approach.8
ESTIMATED IMPACTS OF THE COMMITTEE’S POLICY OPTIONS
Poverty Reduction: Baseline Results
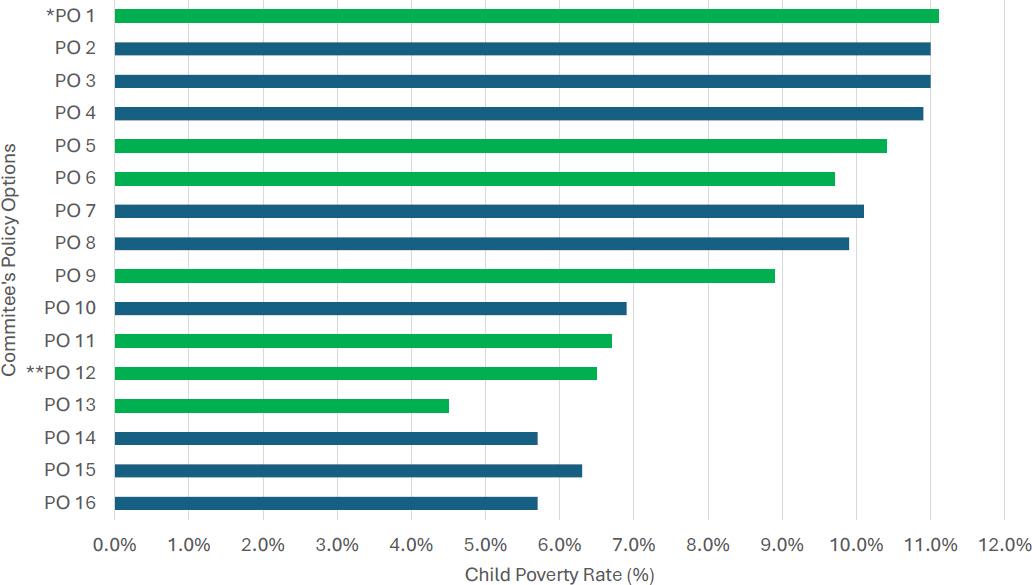
Table 9-2 and Figure 9-3 show estimated child poverty rates for all policies considered, without incorporating EITC changes or employment
___________________
8 The methodology for computing poverty rates in TRIM3 differs in important ways from methods used by the Census Bureau, including that TRIM3 adjusts for the underreporting of transfer program benefits in the CPS ASEC (see Appendix H). While estimates using unadjusted CPS ASEC data show higher poverty levels for each policy option, the proportional poverty reduction associated with each baseline option is qualitatively similar when using unadjusted CPS ASEC data or TRIM3.
| Child Poverty Rate^ | Change relative to PO 1 | % Change Relative to PO 1 | # Poor (in millions) | Change in # of Poor relative to PO 1 | |
|---|---|---|---|---|---|
| *PO 1 | 11.1% | 8.16 | |||
| PO 2 | 11.0% | 0.0% | –0.3% | 8.14 | –0.02 |
| PO 3 | 11.0% | 0.0% | –0.2% | 8.14 | –0.02 |
| PO 4 | 10.9% | –0.2% | –1.5% | 8.04 | –0.12 |
| PO 5 | 10.4% | –0.7% | –6.0% | 7.67 | –0.49 |
| PO 6 | 9.7% | –1.3% | –12.1% | 7.17 | –0.99 |
| PO 7 | 10.1% | –0.9% | –8.3% | 7.48 | –0.68 |
| PO 8 | 9.9% | –1.2% | –10.6% | 7.29 | –0.86 |
| PO 9 | 8.9% | –2.1% | –19.4% | 6.58 | –1.58 |
| PO 10 | 6.9% | –4.2% | –38.0% | 5.06 | –3.10 |
| PO 11 | 6.7% | –4.3% | –39.3% | 4.96 | –3.20 |
| **PO 12 | 6.5% | –4.6% | –41.5% | 4.77 | –3.39 |
| PO 13 | 4.5% | –6.6% | –59.5% | 3.31 | –4.85 |
| PO 14 | 5.7% | –5.4% | –48.9% | 4.17 | –3.99 |
| PO 15 | 6.3% | –4.7% | –42.9% | 4.66 | –3.50 |
| PO 16 | 5.7% | –5.3% | –48.0% | 4.24 | –3.92 |
NOTES: Bolded POs denote focal options. ARPA = American Rescue Plan Act of 2021, CTC = Child Tax Credit, EITC = Earned Income Tax Credit, TCJA = Tax Cuts and Job Act.
^ Child poverty rate is percent of child-containing families with incomes below 100% of the SPM poverty threshold.
* PO 1 is the non-ARPA EITC + TCJA CTC PO.
** PO 12 is the Modified Combined EITC & CTC Policies in 2021.
SOURCE: Estimates from TRIM3 commissioned by the committee.
responses. The estimated baseline poverty rate under the non-ARPA EITC + TCJA CTC policy is 11.1%, which is close to the 11.6% estimated in 2021 in the absence of the ARPA-expanded CTC and other pandemic programs (see Chapter 8).
The results presented in Table 9-2 indicate that moving from the non-ARPA EITC + TCJA CTC policy option (PO 1) to the Modified Combined EITC & CTC Policies in 2021 (PO 12) leads to a 4.6 percentage point drop and a 41.5% decline in child poverty—from 11.1% of children in poverty under the non-ARPA EITC + TCJA CTC policy to 6.5%, which represents moving 3.39 million children out of poverty. (This is relatively consistent with estimates in Chapter 8.) The policy changes in PO 2 through PO 4
NOTES: Focal policy options shown in green.
*PO 1 is the non-American Rescue Plan Act of 2021 (ARPA) Earned Income Tax Credit (EITC) + Tax Cuts and Job Act Child Tax Credit (CTC) PO.
**PO 12 is the Modified Combined EITC & CTC Policies in 2021 under ARPA.
SOURCE: Estimates from TRIM3 commissioned by the committee.
reduce poverty very modestly; but for each policy option “step” between and including PO 5 and Modified Combined EITC & CTC Policies in 2021 (PO 12), child poverty declines by at least half a percentage point relative to non-ARPA EITC + TCJA CTC policy (PO 1), and more so in many cases. Specifically:
- With the increase in the phase-in to 15% per child (PO 5), child poverty drops by about half a percentage point (relative to PO 1).
- With a $1,000 minimum CTC (PO 6), child poverty drops by over 1 percentage point (relative to PO 1).
- When exempting disabled and elderly caregivers and caregivers with young children from earnings requirements (PO 9), child poverty drops by 2 percentage points (relative to PO 1).
- When increasing the maximum CTC to $3,000, and $3,600 for children younger than 6 (PO 10)—an increase that also carries through to focal policy options PO 11 and PO 12—child poverty drops by 4 or more points (relative to PO 1).
Several policy options that would reduce child poverty below the levels of the Modified Combined EITC & CTC Policies in 2021 were also considered. For example, when the Modified Combined EITC & CTC Policies in 2021 are combined with an additional $2,000 credit phased in at 15% (see PO 13), child poverty falls to 4.5%, a 6.6 percentage point (59.5%) decline from non-ARPA EITC + TCJA CTC policy (PO 1), lifting an estimated 4.85 million children out of poverty.
Beyond the committee’s focal policy options:
- PO 14, which increases the maximum credits to $3,600 and $4,200 (for those age 5 and below)—less generous than PO 13 but more generous than the Modified Combined EITC & CTC Policies in 2021, but eliminating the phase-in of CTC benefits as in PO 13—reduces child poverty from 6.5 under the Modified Combined EITC & CTC Policies in 2021 option (PO 12) to 5.7%.
- Exempting children and then parents without SSNs while keeping the same credit generosity as in 2021 (PO 15 and PO 16, respectively), reduces child poverty modestly relative to the Modified Combined EITC & CTC Policies in 2021 (PO 12).9
___________________
9 Doing so only for children without SSNs reduces child poverty from 6.5% (Modified Combined EITC & CTC Policies in 2021) to 6.3% (PO 15), removing approximately an additional 110,000 children out of poverty relative to the same policy that excludes children without SSNs. Extending the 2021 tax credits to children whose parents do not have SSNs is estimated to reduce child poverty to 5.7% (PO 16), lifting an additional 420,000 children out of poverty relative to extending the credits only to children without SSNs.
For selected policy options, the committee estimates impacts of an 8 percentage point increase in the EITC amount relative to the non-ARPA rates (i.e., from credit rates of 34%, 40%, and 45% for one, two, or three children to rates of 42%, 48%, and 53%). Table 9-3 and Figure 9-4 display the estimated effect of combining PO 8 through PO 16 with an 8 percentage point increase in the EITC. Adding 8 percentage points to the EITC further reduces poverty rates—by 0.5 percentage points, or almost 5%, in PO 9—compared to the same policy option without the hypothetical EITC expansion—and by 0.2 to 0.3 percentage points, or by about 2% to 3%, for most other policy options estimated.10
Employment Effects
As discussed in Chapters 7 and 8, the credits under the non-ARPA EITC + TCJA CTC policy provide an incentive to work versus not to work at all, since both typically provide no credit for nonworkers and a positive credit for workers; and both provide an incentive to increase earnings until the credit plateau is reached at higher earnings or income levels.
Policy options discussed in this chapter include those that increase the generosity of the EITC, which further increases the incentive to work until it phases out. Policy options considered for the CTC include the following:
- Current policy, in which no credit is received for earnings below $2,500 and credits are phased in at a rate of 15% over its phase-in range.
- PO 5, which phases in starting with the first dollar earned at a rate of 15% per child and thus provides a stronger incentive to work in the phase-in range than PO 1 or the non-ARPA EITC + TCJA CTC policy (see benefit schedules for these options in Figure 9-1).
- PO 9, which conditions the credit on earnings but exempts parents and caretakers with children under 6 or who are elderly or disabled, reducing work incentives for exempted caretakers relative to PO 1.
- PO 12, PO 14, PO 15, and PO 16, which do not condition credit receipt on having any earnings or on the level of earnings (see Figure 9-2), which reduces incentives to work relative to PO 1 by reducing the additional credit received for any amount of earnings relative to benefits when not working.
___________________
10 These baseline estimates assume no employment effects. As noted above, adding 8 percentage points to the EITC combined with policy options that reduce the extent to which the CTC is tied to earnings were considered, given that increasing the EITC may counteract reductions in the incentive to work resulting from the CTC change.
| Child Poverty Rate^ | Change Relative to PO 1 | % Change Relative | # Poor (in to PO 1 millions) | Change in # of Poor Relative to PO 1 | |
|---|---|---|---|---|---|
| *PO 1 | 11.1% | 8.16 | |||
| PO 8: Base EITC | 9.9% | -1.2% | -10.6% | 7.29 | -0.86 |
|
Higher EITC |
9.4% | -1.7% | -15.1% | 6.93 | -1.23 |
| PO 9: Base EITC | 8.9% | -2.1% | -19.4% | 6.58 | -1.58 |
|
Higher EITC |
8.4% | -2.6% | -23.8% | 6.22 | -1.94 |
| PO 10: Base EITC | 6.9% | -4.2% | -38.0% | 5.06 | -3.10 |
|
Higher EITC |
6.5% | -4.5% | -40.9% | 4.82 | -3.34 |
| PO 11: Base EITC | 6.7% | -4.3% | -39.3% | 4.96 | -3.20 |
|
Higher EITC |
6.4% | -4.7% | -42.4% | 4.96 | -3.20 |
| **PO 12: Base | 6.5% | -4.6% | -41.5% | 4.77 | -3.39 |
| EITC | |||||
|
Higher EITC |
6.1% | -4.9% | -44.5% | 4.77 | -3.39 |
| PO 13: Base EITC | 4.5% | -6.6% | -59.5% | 3.31 | -4.85 |
|
Higher EITC |
4.3% | -6.8% | -61.1% | 3.17 | -4.99 |
| PO 14: Base EITC | 5.7% | -5.4% | -48.9% | 4.17 | -3.99 |
|
Higher EITC |
5.4% | -5.7% | -51.3% | 3.97 | -4.19 |
| PO 15: Base EITC | 6.3% | -4.7% | -42.9% | 4.66 | -3.50 |
|
Higher EITC |
6.0% | -5.1% | -45.8% | 4.42 | -3.74 |
| PO 16: Base EITC | 5.7% | -5.3% | -48.0% | 4.24 | -3.92 |
|
Higher EITC |
5.3% | -5.7% | -51.8% | 3.94 | -4.22 |
NOTES: CTC = Child Tax Credit, EITC = Earned Income Tax Credit, PO = policy option.
^ Child poverty rate is percent of child-containing families with incomes below 100% of the Supplemental Poverty Measure threshold.
* PO 1 is the non-American Rescue Plan Act of 2021 EITC + Tax Cuts and Job Act CTC PO.
** PO 12 is the Modified Combined EITC & CTC Policies in 2021. Higher EITC policy increases EITC by 8 percentage points; bolded POs denote focal options.
SOURCE: Estimates from TRIM3 commissioned by the committee.

NOTES: CTC = Child Tax Credit, EITC = Earned Income Tax Credit.**PO 12 is the Modified Combined EITC & CTC Policies in 2021.
SOURCE: Estimates from TRIM3 commissioned by the committee.
- PO 6, PO 11, and PO 13, which combine a minimum credit unrelated to earnings with an additional, phased-in credit, with mixed effects on work incentives relative to PO 1.
In Chapter 7, the committee reviewed existing evidence and calculated a range of estimated employment responses to the EITC and CTC. As these responses reflect the existing literature, which is necessarily limited to evaluations of current and historical policies, they do not encompass the full range of policy options considered here. Nonetheless, the range of employment responses reflects the committee’s judgment of the best available evidence. Thus far, the estimates provided in this chapter have assumed no employment response. Incorporating employment responses is expected to result in a greater estimated reduction in child poverty when the policy option increases the incentive to work, as is the case for the options that increase the generosity of the EITC or CTC but do not provide a credit to households without earnings, since employment likely increases. In contrast, smaller estimated reductions in the poverty rate are expected for options providing a large CTC unrelated to earnings, as these options reduce incentives to work, so employment may fall. Options that combine a non-earnings-related credit with one that is phased in with earnings may result in either greater or smaller estimated reductions in poverty (relative to PO 1), depending on the net effect on employment.
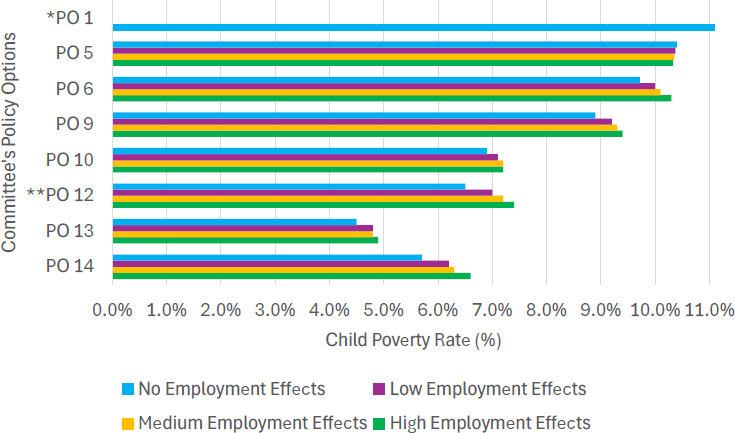
Table 9-4 and Figure 9-5 display estimates of the impacts of the policy options described above on child poverty, with and without employment effects. Included are options estimated to produce at least a 0.5 percentage point decline in the child poverty rate (relative to non-ARPA EITC + TCJA CTC policy), as well as estimates for the Modified Combined EITC & CTC Policies in 2021. The first panel of Table 9-4 and the second set of bars in Figure 9-5 show estimates of child poverty given a $2,000 maximum CTC with a $1,600 cap on refundability, and a 15% per-child phase-in starting with the first dollar of earnings (PO 5). Assuming no employment effects, child poverty is estimated to be 10.4% under this option, or 0.7 percentage points less than non-ARPA EITC + TCJA CTC policy (PO 1). Estimates incorporating employment effects are similar, though those incorporating the highest employment effects suggest child poverty would fall further, but only slightly, to 10.3%. Under this option, as expected, incorporating employment effects when the CTC is conditioned on earnings increases the magnitude of estimated poverty reductions, though the impact is modest.
For PO 6 and other more generous options (through PO 14), adjusting for employment effects reduces the impacts of each policy option on child poverty, relative to not adjusting for employment; that is, adjusting for employment cuts the decline in poverty rates associated with each policy
TABLE 9-4 Estimated Child Poverty for Committee’s Policy Options (POs), Including Employment Effects
| Child poverty rate^ | Change relative to no EE | % Change relative to no EE | Change relative to PO 1 | % Change relative to PO 1 | # Poor (in millions) | Change in # poor relative to no EE | Change in # poor relative to PO 1 | |
|---|---|---|---|---|---|---|---|---|
| *PO 1 | 11.1% | 8.159 | ||||||
| PO 5: No EE | 10.4% | –0.7% | –5.9% | 7.668 | –0.492 | |||
|
Low EE |
10.4% | –0.03% | 0.3% | –0.7% | –6.2% | 7.654 | –0.014 | –0.506 |
|
Med EE |
10.4% | –0.05% | –0.5% | –0.7% | –6.4% | 7.638 | –0.030 | –0.521 |
|
High EE |
10.3% | –0.1% | –0.7% | –0.7% | –6.6% | 7.621 | –0.047 | –0.538 |
| PO 6: No EE | 9.7% | –1.3% | –12.1% | 7.171 | –0.989 | |||
|
Low EE |
10.0% | 0.3% | 2.9% | –1.1% | –9.6% | 7.408 | 0.238 | –0.751 |
|
Med EE |
10.1% | 0.4% | 3.9% | –1.0% | –8.7% | 7.478 | 0.307 | –0.681 |
|
High EE |
10.3% | 0.6% | 6.0% | –0.8% | –6.8% | 7.567 | 0.396 | –0.593 |
| PO 9: No EE | 8.9% | –2.2% | –19.5% | 6.576 | –1.583 | |||
|
Low EE |
9.2% | 0.3% | 3.4% | –1.9% | –16.8% | 6.794 | 0.218 | –1.365 |
|
Med EE |
9.3% | 0.4% | 4.5% | –1.8% | –15.9% | 6.877 | 0.301 | –1.283 |
|
High EE |
9.4% | 0.5% | 5.6% | –1.7% | –15.0% | 6.949 | 0.373 | –1.211 |
| PO 10: No EE | 6.9% | –4.2% | –37.6% | 5.062 | –3.097 | |||
|
Low |
7.1% | 0.2% | 2.9% | –4.0% | –35.8% | 5.250 | 0.188 | –2.909 |
| EE | ||||||||
|
Med EE |
7.2% | 0.3% | 4.3% | –3.9% | –34.9% | 5.287 | 0.224 | –2.872 |
|
High EE |
7.2% | 0.3% | 4.3% | –3.9% | –34.9% | 5.329 | 0.266 | –2.831 |
| **PO 12: No | 6.5% | –4.6% | –41.5% | 4.772 | –3.388 | |||
| EE | ||||||||
|
Low EE |
7.0% | 0.6% | 8.6% | –4.0% | –36.5% | 5.182 | 0.411 | –2.977 |
|
Med EE |
7.2% | 0.7% | 11.1% | –3.9% | –35.0% | 5.301 | 0.529 | –2.859 |
|
High EE |
7.4% | 0.9% | 14.3% | –3.7% | –33.1% | 5.456 | 0.684 | –2.703 |
| PO 13: No EE | 4.5% | –6.6% | –59.5% | 3.307 | –4.853 | |||
|
Low EE |
4.8% | 0.3% | 6.2% | –6.3% | –56.9% | 3.513 | 0.206 | –4.647 |
|
Med EE |
4.8% | 0.3% | 7.4% | –6.2% | –56.5% | 3.552 | 0.246 | –4.607 |
|
High EE |
4.9% | 0.4% | 8.8% | –6.2% | –55.9% | 3.597 | 0.291 | –4.562 |
| PO 14: No EE | 5.7% | –5.4% | –48.9% | 4.171 | –3.988 | |||
|
Low EE |
6.2% | 0.5% | 9.7% | –4.9% | –43.9% | 4.576 | 0.405 | –3.583 |
|
Med EE |
6.3% | 0.7% | 12.3% | –4.7% | –42.6% | 4.682 | 0.511 | –3.477 |
|
High |
6.6% | 0.9% | 16.0% | –4.5% | –40.7% | 4.840 | 0.669 | –3.319 |
| EE | ||||||||
NOTES: The elasticities in Panel B of Table 7-1 are used to account for employment effects
(EE). See Chapter 7 for discussion of how employment effects are calculated and the definitions of low, medium, and high employment effects. Bolded POs denote focal options.
^ Child poverty rate is percent of child-containing families with incomes below 100% of the Supplemental Poverty Measure poverty threshold.
* PO 1 is the non-American Rescue Plan Act of 2021 Earned Income Tax Credit (EITC) + Tax Cuts and Job Act Child Tax Credit (CTC) PO.
** PO 12 is the Modified Combined EITC & CTC Policies in 2021.
SOURCE: Estimates from TRIM3 commissioned by the committee.
NOTES: Limited to focal policy options.
*PO 1 is the non-American Rescue Plan Act of 2021 (ARPA) Earned Income Tax Credit (EITC) + Tax Cuts and Job Act Child Tax Credit (CTC) PO.
**PO12 is the Modified Combined EITC & CTC Policies in 2021.
SOURCE: Estimates from TRIM3 commissioned by the committee.
option by 0.2 to 0.9 percentage points, or by between 2.9% and 16%, compared to making no adjustment for employment effects. Relative to no adjustments, adjusting for employment effects cuts the decline in child poverty rates most for the Modified Combined EITC & CTC Policies in 2021 option (PO 12) and PO 14, which is the same as PO 12 except it increases the maximum CTC benefit by $600 per child. Specifically:
- Adjusting with the low employment effects decreases the estimated impacts on child poverty of the remaining focal policy options—PO 6, PO 9, the Combined EITC & CTC Policies in 2021 (PO 12), and PO 13—by 0.2 to 0.6 percentage points or by 2.9% to 8.6% relative no adjustments for employment effects, with the largest decrease in poverty reduction occurring in PO 12.
- Adjusting with the medium employment effects reduces the estimated impacts of these same focal policy options by 0.3 to 0.7 percentage points or by 3.9% to 11.1% relative to no employment adjustments, again with the Combined EITC & CTC Policies in 2021 (PO 12) producing the largest decrease in poverty impacts.
- Adjusting with the high employment effects reduces estimated impacts on child poverty rates by 0.3 to 0.9 percentage points or 4.3% to 14.3% for these focal options relative to no employment adjustments, with PO 12 again showing the largest decrease in poverty impacts.11
With employment effects incorporated, impacts on child poverty were also estimated for selected policy options with and without a higher EITC benefit. A higher EITC increases work incentives and is expected to increase the magnitude of poverty reduction (or reduce the negative employment effect of expanded CTC benefits for families with lower earnings). As shown in Table 9-5, with an increased EITC, incorporating employment effects very modestly raises the magnitude of poverty reduction, by about 0.1 or 0.2 percentage points in most policy options considered, relative to adjusting for the same employment effects when not increasing the EITC (in other words, comparing the third and fourth columns in Table 9-5). For
___________________
11 These findings are consistent with estimates from earlier studies that conducted comparable simulations. For example, when implementing PO 12 (Modified Combined EITC & CTC Policies in 2021) without employment effects, the estimated child poverty rate falls by 4.6 percentage points (41%) relative to current policy (see Table 9-2). Corinth et al. (2023) also estimated a decline of 4.6 percentage points (34%), albeit off a higher baseline poverty rate, and Bastian (2024) estimated a decline of 4.5 percentage points (32%). Incorporating medium estimates of employment effects, child poverty is estimated to decline by 3.9 percentage points (35%) according to the committee’s calculations, compared to a decline of 3.4 points (25%) for Corinth et al. (2023), and 4.2 points (30%) for Bastian (2024).
| Child Poverty Rate | Change Relative to Same Model with no EE | |||
|---|---|---|---|---|
| Current EITC | Higher EITC (+8 ppts) | Current EITC | Higher EITC (+8 ppts) | |
| *PO 1 | 11.1% | |||
| PO 9: No EE | 8.9% | 8.4% | 0.0% | 0.0% |
|
Med EE |
9.3% | 8.7% | 0.4% | 0.3% |
| PO 10: No EE | 6.9% | 6.5% | 0.0% | 0.0% |
|
Med EE |
7.2% | 6.7% | 0.3% | 0.2% |
| **PO 12: No EE | 6.5% | 6.1% | 0.0% | 0.0% |
|
Low EE |
7.0% | 6.6% | 0.6% | 0.5% |
|
Med EE |
7.2% | 6.7% | 0.7% | 0.6% |
|
High EE |
7.4% | 6.9% | 0.9% | 0.8% |
| PO 14: No EE | 5.7% | 5.4% | 0.0% | 0.0% |
|
Low EE |
6.2% | 5.9% | 0.5% | 0.5% |
|
Med EE |
6.3% | 6.0% | 0.7% | 0.6% |
|
High EE |
6.6% | 6.1% | 0.9% | 0.7% |
NOTES: Bolded POs denote focal options. EE = employment effects, EITC = Earned Income Tax Credit, ppts = percentage points.
* PO 1 is the non-American Rescue Plan Act of 2021 EITC + Tax Cuts and Job Act Child Tax Credit (CTC) PO.
** PO 12 is the Modified Combined EITC & CTC Policies in 2021.
SOURCE: Estimates from TRIM3 commissioned by the committee.
example, the Combined EITC & CTC Policies in 2021 (PO 12) is estimated to result in a child poverty rate of 6.5% with no employment effects, and 7.0%, 7.2%, and 7.4% with low, medium, and high employment effects, respectively, reducing the impact on child poverty by 0.5 to 0.9 percentage points relative to no employment adjustments. When the EITC is increased by 8 percentage points in PO 12, child poverty declines, as do the estimated impacts when adjusting for the various employment effects. Child poverty is estimated to be 6.1% with no employment effects, and 6.6%, 6.7%, and 6.9% with low, medium, and high employment effects, respectively, reducing the impact on child poverty by between 0.5 to 0.8 percentage points.
Conclusion 9-1: Policy options that increase the generosity of the Child Tax Credit (CTC) relative to non-ARPA Earned Income Tax Credit (EITC) + Tax Cuts and Jobs Act (TCJA) CTC policy all reduce child poverty, even after incorporating employment effect adjustments, but by
very different amounts. Those that maintain current CTC benefit levels and work incentives reduce child poverty by less; those that increase CTC benefits, even for those with low earnings, reduce it by more, despite weakening work incentives; and those that increase benefits for those with low earnings and even more for those with higher earnings, which maintain work incentives, have the largest antipoverty effects. But policy options that reduce work incentives decrease child poverty rates by less when considering their employment effects, relative to not considering them. In particular:
- Changes in the structure and rate of CTC phase-in, while maintaining the $2,000 per-child maximum credit, typically have relatively modest impacts on child poverty.
- Policies that substantially increase the maximum credits reduce child poverty by much larger amounts, relative to non-American Rescue Plan Act of 2021(ARPA) EITC + TCJA CTC policy (PO 1), even when they reduce work incentives and employment. At the same time, policies like those implemented in ARPA and policies that eliminate work requirements for parents reduce child poverty by less when considering employment effects (relative to not considering employment effects), although they still produce sizeable reductions in child poverty relative to non-ARPA EITC + TCJA CTC policy.
- Increasing the EITC by a moderate amount (8 percentage points) relative to the current or non-ARPA EITC further reduces child poverty rates by roughly an additional 0.5 percentage points, in comparison with the same options without an increase in the EITC.
Alternative Poverty Thresholds
As discussed in Chapters 3 and 8, poverty thresholds used in the SPM, which vary by year and by the size and composition of families, are based on differing assumptions about the level of income needed to meet a family’s basic needs. Examining poverty rates using poverty thresholds above and below the SPM poverty threshold allows an assessment of whether the antipoverty effects of the committee’s policy options depend on where the poverty line is drawn, and whether the policy options have differential impacts on families with somewhat higher and somewhat lower incomes.
Table 9-6 and Figure 9-6 display the estimated impact of the committee’s policy options on deep poverty (i.e., income below 50% of the SPM poverty threshold), poverty (i.e., income below 100% of the SPM poverty threshold), and near poverty (i.e., income below 150% of the SPM poverty
| Deep Poverty (below 50% of poverty line) | Poverty (below 100% of poverty line) | Near Poverty (below 150% of poverty line) | Below 200% of poverty line | |
|---|---|---|---|---|
| *PO 1 | 1.9% | 11.1% | 32.1% | 48.4% |
| PO 2 | 1.9% | 11.0% | 31.9% | 48.3% |
| PO 3 | 1.9% | 11.0% | 31.9% | 48.3% |
| PO 4 | 1.9% | 10.9% | 31.7% | 48.3% |
| PO 5 | 1.8% | 10.4% | 31.0% | 48.2% |
| PO 6 | 1.5% | 9.7% | 30.8% | 48.2% |
| PO 7 | 1.7% | 10.1% | 30.7% | 48.2% |
| PO 8 | 1.7% | 9.9% | 30.6% | 48.1% |
| PO 9 | 1.4% | 8.9% | 30.3% | 48.1% |
| PO 10 | 1.2% | 6.9% | 25.6% | 45.6% |
| PO 11 | 1.1% | 6.7% | 25.6% | 45.6% |
| **PO 12 | 1.0% | 6.5% | 25.5% | 45.6% |
| PO 13 | 0.8% | 4.5% | 19.5% | 40.3% |
| PO 14 | 0.8% | 5.7% | 23.5% | 44.0% |
| PO 15 | 0.9% | 6.3% | 25.4% | 45.5% |
| PO 16 | 0.8% | 5.7% | 25.1% | 45.4% |
NOTES: Bolded POs denote focal options. APRA = American Rescue Plan Act of 2021, CTC = Child Tax Credit, EITC = Earned Income Tax Credit, TCJA = Tax Cuts and Job Act.
* PO 1 is the non- American Rescue Plan Act of 2021 EITC + Tax Cuts and Job Act Child Tax Credit (CTC) PO.
** PO 12 is the Modified Combined EITC & CTC Policies in 2021.
SOURCE: Estimates from TRIM3 commissioned by the committee.
threshold) for families with children. (Corresponding rates are displayed in Table 9-6 for families with children whose incomes are below 200% of the SPM poverty threshold.) Figure 9-7 illustrates the full distribution of children across poverty-defined income categories for each policy option (i.e., the first section shows the percent of children below 50% of the poverty threshold, the second section the percent of children between 50% and less than 100% of the poverty threshold, etc.). The top bar in Figure 9-7 shows the share of children in each of these income categories given non-ARPA EITC + TCJA CTC policy (PO 1) and the remaining bars display the distributions across categories for the committee’s policy options. The deep poverty rate under the non-ARPA EITC + TCJA CTC policy is much lower

NOTES: *PO 1 is the non-American Rescue Plan Act of 2021 (ARPA) Earned Income Tax Credit (EITC) + Tax Cuts and Job Act Child Tax Credit (CTC) PO.
**PO 12 is the Modified Combined EITC & CTC Policies in 2021.
SOURCE: Estimates from TRIM3 commissioned by the committee.

NOTES: ARPA = American Rescue Plan Act of 2021, CTC = Child Tax Credit, EITC = Earned Income Tax Credit, TCJA = Tax Cuts and Job Act.
*PO 1 is the non-ARPA EITC + TCJA CTC PO.
**PO 12 is the Modified Combined EITC & CTC Policies in 2021.
SOURCE: Estimates from TRIM3 commissioned by the committee.
than the poverty rate—1.9% relative to 11.1%—and the absolute change associated with each policy option is smaller (i.e., the percentage point change and number of children removed from deep poverty are smaller; see Table I-1 in Appendix I for more details). However, the proportionate change is similar or greater.
The child poverty rate for families classified as being in near poverty is much higher than for families classified as being in poverty—32.1% relative to 11.1%. The estimated impacts of the committee’s policy options are, in most cases, somewhat greater on near poverty (compared to poverty) when measured by percentage point change, and substantially smaller when measured in terms of percent change. For example, the percentage of children in near poverty falls from 32.1% to 25.5% moving from the non-ARPA EITC + TCJA CTC policy option to the Modified Combined EITC & CTC Policies in 2021 option, a 6.6 percentage point decline that represents a 20.5% decrease in the proportion of children in families near poverty. The 4.6 percentage point decline for children in families in poverty (i.e., those with incomes below 100% of the SPM poverty threshold) is smaller (i.e., 4.6 percentage points is less than 6.6) but represents a 41.5% estimated decrease in the proportion of children in families in poverty (see Appendix I, Table I-1). In other words, the change in near poverty has a smaller proportional impact on a much larger population—almost three times as many children are in near poverty as are in poverty. The final column of Table 9-6 shows that the estimated impact of the committee’s policy options on the proportion of children below 200% of the SPM poverty threshold is relatively modest. For example, the percentage of children below 200% of the threshold falls from 48.4% to 45.6% moving from the non-ARPA EITC + TCJA CTC policy to the Modified Combined EITC & CTC Policies in 2021 option, a 2.9 percentage point and 5.9% decline (see Appendix I, Table I-1).
Conclusion 9-2: With the current baseline policy (non-American Rescue Plan Act of 2021 Earned Income Tax Credit + Tax Cuts and Jobs Act Child Tax Credit), the committee’s estimated deep poverty rate is much lower than the poverty rate—1.9% relative to 11.1%. This means that the absolute change in deep poverty associated with each of the committee’s policy options is smaller, though the relative change is similar or greater. The most expansive option is estimated to reduce deep poverty in these families to 0.8%, a nearly 60% decrease, which lifts 0.8 million children out of deep poverty. In contrast, the change in poverty (from 11.1% to 4.5%) raises nearly 5 million children out of poverty. For near poverty, there is a smaller proportional impact on a much larger population; the policy is estimated to reduce near poverty from 32% to just under 20%, a roughly 40% decrease, which raises out of near poverty over 9 million children.
Program Fiscal Outlays and Distribution of Benefits
As discussed in Chapter 8 and Appendix H, TRIM3 does not fully capture all resources from tax credits/liabilities compared to Internal Revenue Service administrative totals, especially for the EITC. Thus, some caution is warranted in interpreting fiscal outlays produced by TRIM3 for the EITC and CTC. Nonetheless, comparing fiscal outlays across the committee’s policy options provides some indication of the relative magnitudes of associated expenditures. Table 9-7 presents estimates of the fiscal outlays for the EITC and CTC12 for all policy options across the distribution of families, by levels of poverty-based family income, that do not include EITC and CTC benefits. Panel A displays estimates for the CTC, and Panel B for the EITC. Columns (1) and (2) display estimated fiscal outlays (in millions of dollars) for all families and for those families in poverty (i.e., those below 100% of the SPM threshold) for the various policy options. Results can be summarized as follows:
- PO 1: Fiscal outlays of current TCJA CTC policy are estimated to be approximately $108 billion, of which about $11.7 billion goes to families in poverty.
- PO 12: The committee’s Modified Combined EITC & CTC Policies in 2021, which is similar to the EITC and CTC policy implemented in 2021 but includes a faster phase-out of the CTC benefits than occurred under ARPA, is estimated to require an outlay of $185 billion, including about $39 billion for families in poverty, which is about $27 billion more for these families compared to the non-ARPA EITC + TCJA CTC policy.
- PO 3: Assumes a faster phase-out of the CTC at higher income levels, saving about $18 billion in outlays relative to the non-ARPA EITC + TCJA CTC policy and $25 billion relative to PO 2. This means that all modest expansions of the CTC up through PO 8 cost less in total than the non-ARPA EITC + TCJA CTC policy, with more of the outlay going to families in poverty.
- PO 5: Requires an estimated outlay of about $95 billion, about $4.6 billion more than an otherwise equivalent policy option (PO 4) with a 15% total phase-in, rather than PO 5’s 15% per-child
___________________
12 Estimates of fiscal outlays associated with the EITC and CTC include only changes in tax and credit collections and distributions, not administrative costs. Furthermore, these estimates are limited to families with children under age 18 and do not capture any EITC going to childless tax filers or tax filers with only older dependents. They also exclude the credits for other dependents. Finally, these baseline estimates do not incorporate estimated employment effects or associated changes in taxes.
| Estimated Outlays (Millions): | ||||||
|---|---|---|---|---|---|---|
| All Families^ (1) | Families below 100% of SPM^ (2) | <50% of SPM^ (Deep Poverty) (3) | <100% of SPM^ (Poverty) (4) | <150% SPM^ (Near Poverty) (5) | <200% of SPM^ (6) | |
| Share of Children | 2.7% | 18.1% | 38.8% | 52.6% | ||
| Panel A: Fiscal Outlays for CTC: | ||||||
| *PO 1 | $108,301 | $11,674 | 0.8% | 10.6% | 30.2% | 45.9% |
| PO 2 | $114,375 | $12,070 | 0.8% | 10.4% | 29.8% | 45.4% |
| PO 3 | $89,289 | $12,010 | 0.9% | 13.5% | 38.1% | 57.9% |
| PO 4 | $90,725 | $12,812 | 1.1% | 13.9% | 38.8% | 58.5% |
| PO 5 | $95,377 | $15,473 | 1.4% | 16.0% | 41.4% | 19.1% |
| PO 6 | $100,634 | $18,435 | 2.1% | 18.1% | 43.6% | 62.1% |
| PO 7 | $98,803 | $17,340 | 1.5% | 17.3% | 42.9% | 61.6% |
| PO 8 | $100,491 | $18,423 | 1.8% | 18.0% | 43.7% | 62.2% |
| PO 9 | $108,317 | $22,634 | 2.4% | 20.6% | 46.6% | 64.2% |
| PO 10 | $181,199 | $36,125 | 2.3% | 19.6% | 44.5% | 61.4% |
| PO 11 | $183,145 | $37,348 | 2.5% | 20.1% | 44.9% | 61.7% |
| **PO 12 | $185,033 | $38,985 | 2.8% | 20.8% | 45.6% | 62.4% |
| PO 13 | $309,546 | $59,728 | 2.5% | 19.0% | 42.7% | 58.8% |
| PO 14 | $223,637 | $46,302 | 2.8% | 20.4% | 44.9% | 61.3% |
| PO 15 | $187,970 | $39,985 | 3.0% | 21.0% | 45.9% | 62.6% |
| PO 16 | $187,970 | $39,985 | 3.0% | 21.0% | 45.9% | 62.6% |
| Panel B: Fiscal Outlays for EITC (only for families with children): | ||||||
| POs 1-14: Baseline | $36,630 | $15,436 | 3.7% | 41.1% | 79.5% | 91.0% |
|
High (+8%) |
$48,713 | $19,251 | 3.7% | 41.0% | 79.5% | 90.9% |
| PO 15: Baseline | $36,647 | $15,450 | 3.7% | 41.1% | 79.5% | 91.0% |
|
High (+8%) |
$48,739 | $19,271 | 3.4% | 38.5% | 77.7% | 90.3% |
| PO 16: Baseline | $42,437 | $19,137 | 4.3% | 44.2% | 81.2% | 91.8% |
|
High (+8%) |
$56,246 | $23,823 | 4.0% | 41.5% | 79.4% | 91.1% |
NOTES: Bolded POs denote focal options; all dollar amounts are in 2021 dollars.
* PO 1 is the non-ARPA EITC + TCJA CTC PO.
** PO 12 is the Modified Combined EITC & CTC Policies in 2021.
SOURCE: Estimates from TRIM3 commissioned by the committee.
- phase-in (e.g., for a family with two children the phase-in would be 30%).
- PO 6: Adding a minimum $1,000 per-child credit requires an estimated $100.6 billion outlay, an extra $5.2 billion on top of the outlay for PO 5.
- PO 9: Exempting caregivers who are elderly, disabled, or who have children under 6 from earnings requirements increases outlays by about $7.8 billion relative to the prior policy option (PO 8) that does not include those exemptions. The total cost of PO 9 is almost identical to the non-ARPA EITC + TCJA CTC policy (PO 1), with about $11 billion more going to families in poverty.
- PO 11 and PO 12: These options are estimated to require more substantial increases in outlays due to increasing the maximum credit amount to $3,000 and $3,600, respectively, for children under 6. This credit amount change is estimated to add a total of about $75 billion to $77 billion in outlays, with $13.5 billion more going to children in poverty, compared to PO 9.
- PO 10 and PO 11: Going from PO 10 to PO 11, which provides a minimum 50% credit, produces a relatively modest additional outlay of about $2 billion.
- As noted above, eliminating the earnings requirement completely (PO 12)—the 2021 policy, albeit with a faster phase-out—is estimated to require an outlay of $185 billion, again a modest $2 billion increase relative to PO 11 but over $76 billion more than the non-ARPA EITC + TCJA CTC policy option (PO 1).
- PO 13: Adding a $2,000 per-child credit phased in at 15% of earnings increases total outlays by about an estimated $124.5 billion ($20.7 billion going to families in poverty) relative to the Combined EITC & CTC Policies in 2021 option (PO 12), and $201 billion relative to the non-ARPA EITC + TCJA CTC policy option (PO 1).
- PO 15: Extending benefits to children without SSNs has a relatively modest impact on estimated total outlays of $3 billion compared to PO 12.
None of the CTC policy options are structured such that outlays primarily benefit children in poverty. That said, outlays are distributed differentially across policy options and have differential effects on deep poverty, poverty, and near poverty. This reflects variation in the credits available to families at different levels of income—see Figure 9-1—as well as the shape of the pre-credit income distribution (i.e., how many children are in each income category). The first row under columns (3) through (7) of Table 9-7 displays the distribution of children across groups defined by pre-CTC
and pre-EITC family income relative to the SPM poverty threshold. For example, 2.7% of children lived in families with incomes below 50% of the threshold, and 18.1% lived in families with incomes below 100% of the threshold. Thus, if an identical credit were provided for each child, 2.7% of the outlay would go to children below 50% of the SPM poverty threshold and 18.1% would go to children below 100% of the threshold. However, the provisions of each option (e.g., the phase-in and phase-out rates) lead to different distributions of outlays.
Table 9-7 also displays the estimated shares of the CTC for children in families with incomes less than 50% of the SPM poverty threshold (deep poverty), and less than 100%, 150%, and 200% of the threshold, respectively, with groups based on family incomes before receiving the EITC and CTC. Under the non-ARPA EITC + TCJA CTC policy, about 0.8% of CTC outlays are estimated to go to children in deep poverty (i.e., below 50% of the SPM poverty threshold), and 10.6% of CTC outlays are estimated to go to children living in families with incomes below 100% of threshold—that is, the lowest-income 18.1% of children (with incomes below 100% of the poverty threshold) received 10.6% of CTC outlays, a gap of 7.5 (18.1 minus 10.8) percentage points. The committee’s other policy options reduce the gap between population share and share of total CTC outlays—from 7.5 percentage points in PO 1 to just 1.9 percentage points in PO 5 (with a 15% phase-in per child starting at the first dollar of earnings) and provide children in poverty a 3 percentage point higher share of outlays than that population under the Modified Combined EITC & CTC Policies in 2021.13
As shown in Table 9-7, the largest shift in the distribution of outlays toward children in poverty and near poverty occurs with the shift to the earlier phase-out, which reduces the proportion of CTC outlays directed to children at or above 200% of the SPM poverty threshold from 54.2% (i.e., 100% minus 45.9%) in the non-ARPA EITC + TCJA CTC policy option (PO 1) and 54.6% in PO 2 to 42.1% (i.e., 100% minus 57.9%) in PO 3.
The distribution of fiscal outlays for the non-ARPA EITC (Table 9-7, Panel B) is consistent across the first 15 policy options, with approximately 42% of outlays going to the 18.1% of families with incomes below 100% of the SPM poverty threshold, and 91.0% to the 52.6% of families with incomes below 200% of the threshold. That is, the proportion of EITC
___________________
13 Distribution of outlays for children in each of the income groups reflects how likely they are to receive the credit, as well as the credit amount. The detailed distribution is shown in Appendix I, Table I-2, for selected policy options. The relatively small proportion of the CTC going to children below the SPM poverty threshold in current policy reflects that children in poverty were less likely to receive the CTC and that they received lower amounts than children in higher-income families. The relatively high proportion of credits that go to children in poverty in many of the committee’s policy options reflect both relatively large increases in the proportion receiving the credits, and relatively large increases in the credit amount.
outlays substantially exceeds the population share for children in poverty or near poverty. Extending the credits to parents without SSNs increases to 45.1% (from 42.1%) the proportion going to children with incomes below 100% of the SPM threshold. Increasing the EITC by 8 percentage points relative to the non-ARPA EITC (current) version results in modestly higher proportions of the credit going to children in near poverty and those above 200% of the SPM poverty threshold, across all of the committee’s policy options.
Figure 9-8 displays the estimated shares of the fiscal outlays for the CTC in a slightly different way than is shown in Table 9-7—namely, illustrating the distribution of outlays based on families with incomes less than 50% of the SPM poverty threshold (i.e., deep poverty), and those at 50% to 100%, 100% to 150%, 150% to 200%, and 200% or higher of the threshold, respectively. Again, these groups are based on family incomes that do not include EITC or CTC benefits. In this figure, shares for all five groups total 100%.
The top bar in Figure 9-8 displays the shares of children in these poverty rate groups, with 2.7% of children living in deep poverty and 15.4%, 20.6%, 13.8%, and 47.4% of children living in families with incomes that fall between the ranges of 50% to 100%, 100% to 150%, 150% to 200%, and 200% or more of the SPM poverty threshold, respectively. With respect to the estimated fiscal outlays for the CTC under the non-ARPA EITC + TCJA CTC policy option (PO 1), Figure 9-8 indicates that 0.8% of estimated fiscal outlays go to children in deep poverty, while 9.9%, 19.5%, 15.6%, and 54.1% of estimated fiscal outlays go to families with incomes that fall within the ranges of 50% to 100%, 100% to 150%, 150% to 200%, and 200% or more of the SPM threshold, respectively.
Moving down the rows of policy options in Figure 9-8, shares of the estimated fiscal outlays increase modestly for children in deep poverty, increase more substantially for children in families with incomes between 50% and 100% of the SPM threshold, slightly increase for children in families with incomes between 100% and 150% of this threshold, and barely change for those children in families with incomes between 150% and 200% of the SPM threshold. The estimated share of outlays for the CTC tends to decrease to children in families with incomes above 200% of the SPM threshold, especially for PO 3 through PO 13, PO 15, and PO 16.
Conclusion 9-3: Estimates of fiscal outlays for the Earned Income Tax Credit (EITC) and Child Tax Credit (CTC) produced by Transfer Income Model version 3 indicate that the current Tax Cuts and Jobs Act (TCJA) CTC Only disproportionately benefits children in families with incomes more than twice the Supplemental Poverty Measure’s poverty threshold, while the EITC disproportionately benefits children

NOTES: ARPA = American Rescue Plan Act of 2021, CTC = Child Tax Credit, EITC = Earned Income Tax Credit, SPM = Supplemental Poverty Measure, TCJA = Tax Cuts and Job Act. *PO 1 is the non-ARPA EITC + TCJA CTC policy option.
**PO 12 is the Modified Combined EITC & CTC Policies in 2021.
SOURCE: Estimates from TRIM3 commissioned by the committee.
in families who are in deep poverty, poverty, and near poverty. The committee’s alternative policy options are estimated to disproportionately benefit children in poverty. However, most policies require larger fiscal outlays relative to the non-American Rescue Plan Act of 2021 EITC + TCJA CTC policy and, under almost all policy options, only a small percentage of the estimated fiscal outlays go to children living in poverty.
Subgroup Effects
Table 9-8 presents estimated changes in child poverty rates associated with the committee’s policy options for various subgroups. Panel A displays estimates for subgroups defined by family demographics (e.g., age and number of children, family composition); Panel B by residential location (e.g., urbanicity, census division); Panel C by employment, education, disability status, and program participation (e.g., major safety net program participation, health insurance); and Panel D by race and ethnicity and immigration status. None of the estimated child poverty impacts presented account for employment responses to the EITC or CTC and none incorporate an increase in the maximum EITC.
Similar to results presented earlier, Table 9-8 indicates that policy options that raise maximum benefit levels (i.e., PO 12 and PO 13) reduce child poverty the most. However, baseline poverty rates under the non-ARPA EITC + TCJA CTC policy option (PO 1) vary across subgroups, and changes in child poverty rates for any given policy option also vary. The percentage change in child poverty associated with each policy option is relatively similar across subgroups. For example, the Modified Combined EITC & CTC Policies in 2021 are estimated to reduce the overall child poverty rate by 41.5% (see Table 9-2) and reduce the child poverty level by about a third to one-half for most subgroups. With respect to differences by family composition, estimated percentage reductions of children in poverty are smaller (about 20% or less) for children in families with only one child, shown in Panel A (the CTC benefit is typically calculated per child, while the SPM poverty threshold rises more slowly with family size); for foreign-born children and noncitizen children, displayed in Panel D; and for children living in mixed-status families, who are often ineligible for the CTC, in Panel A. As shown in Panel A, the greatest percentage reductions are for families with three or more children—from 12.6% in poverty to 5.3% in poverty, a 58% reduction.
While the percentage change in child poverty associated with each policy option is relatively similar across groups, variance is seen in the percentage point change, which is larger for groups that have higher baseline poverty rates under the non-ARPA EITC + TCJA CTC policy option.
TABLE 9-8 Estimated Child Poverty Rates for Committee’s Policy Options (POs) by Subgroups
| *PO 1 | PO 2 | PO 3 | PO 4 | PO 5 | PO 6 | PO 7 | PO 8 | PO 9 | PO 10 | PO 11 | **PO 12 | PO 13 | PO 14 | PO 15 | PO 16 | |
|---|---|---|---|---|---|---|---|---|---|---|---|---|---|---|---|---|
| A. Family Structure Characteristics | ||||||||||||||||
| Family Composition | ||||||||||||||||
| Married parents (both bio or adoptive) | 6.7% | 6.7% | 6.7% | 6.6% | 6.4% | 6.3% | 6.2% | 6.0% | 5.9% | 4.4% | 4.4% | 4.4% | 2.8% | 3.7% | 4.3% | 3.7% |
| Married parents (at least one step) | 8.2% | 8.2% | 8.2% | 7.9% | 7.3% | 6.8% | 7.1% | 7.1% | 6.6% | 4.9% | 4.9% | 4.8% | 2.9% | 4.1% | 3.9% | 3.4% |
| Two unmarried cohabiting biological/adoptive parents | 18.4% | 18.4% | 18.4 | 18.2% | 17.5% | 15.3% | 17.5% | 16.8% | 13.6% | 10.4% | 10.3% | 9.8% | 6.9% | 8.5% | 9.8% | 9.3% |
| Biological/adoptive parent with cohabiting partner | 12.1% | 12.1% | 12.1 | 11.9% | 11.6% | 10.3% | 11.6% | 10.7% | 9.4% | 7.3% | 6.5% | 6.4% | 4.4% | 5.6% | 6.4% | 6.0% |
| Single bio/adoptive parent | 20.4% | 20.3% | 20.4 | 20.0% | 18.9% | 17.3% | 18.4% | 17.9% | 15.6% | 12.2% | 11.7% | 10.9% | 8.0% | 9.6% | 10.7% | 10.2% |
| Living with other relatives (including grandparent, stepparent only, other relatives) | 18.1% | 18.1% | 18.1 | 18.1% | 17.8% | 15.5% | 17.5% | 17.3% | 13.0% | 10.4% | 10.3% | 9.7% | 7.9% | 9.2% | 9.7% | 9.5% |
| Living with nonrelatives | 25.0% | 25.0% | 25.0 | 25.0% | 25.0% | 23.1% | 25.0% | 25.0% | 23.1% | 22.8% | 22.8% | 22.2% | 21.3% | 22.2% | 22.2% | 22.1% |
| *PO 1 | PO 2 | PO 3 | PO 4 | PO 5 | PO 6 | PO 7 | PO 8 | PO 9 | PO 10 | PO 11 | **PO 12 | PO 13 | PO 14 | PO 15 | PO 16 | |
|---|---|---|---|---|---|---|---|---|---|---|---|---|---|---|---|---|
| Number of Children in SPM Unit | ||||||||||||||||
| 1 | 11.9% | 11.9% | 11.9% | 11.9% | 11.9% | 11.5% | 11.7% | 11.6% | 11.0% | 9.8% | 9.8% | 9.5% | 8.0% | 9.0% | 9.4% | 9.1% |
| 2 | 9.1% | 9.1% | 9.1% | 9.0% | 8.7% | 8.3% | 8.6% | 8.3% | 7.6% | 6.2% | 6.0% | 5.8% | 4.0% | 5.2% | 5.7% | 5.0% |
| 3+ | 12.6% | 12.5% | 12.5% | 12.3% | 11.2% | 10.2% | 10.8% | 10.4% | 9.0% | 5.8% | 5.6% | 5.3% | 2.8% | 4.1% | 5.0% | 4.5% |
| Child’s Age | ||||||||||||||||
| <6 | 11.4% | 11.4% | 11.4% | 11.2% | 10.7% | 9.9% | 10.5% | 10.2% | 8.9% | 6.5% | 6.5% | 6.5% | 4.1% | 5.6% | 6.3% | 5.8% |
| 6 to 17 | 10.9% | 10.9% | 10.9% | 10.7% | 10.2% | 9.6% | 10.0% | 9.7% | 8.9% | 7.0% | 6.8% | 6.5% | 4.7% | 5.7% | 6.3% | 5.7% |
| Age of Mother, Father, or Unit Head | ||||||||||||||||
| <25 | 18.1% | 18.1% | 18.1% | 18.0% | 17.6% | 16.0% | 17.2% | 16.6% | 13.5% | 11.0% | 10.9% | 10.9% | 8.0% | 9.9% | 10.9% | 10.2% |
| 25 to 34 | 12.4% | 12.4% | 12.4% | 12.2% | 11.5% | 10.5% | 11.1% | 10.7% | 9.4% | 6.7% | 6.6% | 6.4% | 3.8% | 5.4% | 6.3% | 5.6% |
| 35+ | 9.9% | 9.9% | 9.9% | 9.8% | 9.4% | 8.9% | 9.2% | 9.0% | 8.3% | 6.5% | 6.4% | 6.1% | 4.4% | 5.4% | 5.9% | 5.4% |
| *PO 1 | PO 2 | PO 3 | PO 4 | PO 5 | PO 6 | PO 7 | PO 8 | PO 9 | PO 10 | PO 11 | **PO 12 | PO 13 | PO 14 | PO 15 | PO 16 | |
|---|---|---|---|---|---|---|---|---|---|---|---|---|---|---|---|---|
| B. Family Socioeconomic Status | ||||||||||||||||
| Education of Mother, Father, or Unit Head | ||||||||||||||||
| Less than high school | 28.9% | 28.8% | 28.8% | 28.5% | 26.7% | 24.7% | 26.1% | 25.6% | 22.5% | 16.4% | 16.2% | 15.8% | 10.6% | 13.6% | 15.5% | 12.6% |
| High school graduate/GED | 15.9% | 15.9% | 15.9% | 15.6% | 14.8% | 13.8% | 14.4% | 14.0% | 12.7% | 9.8% | 9.5% | 9.0% | 6.1% | 7.9% | 8.7% | 8.0% |
| Some college | 9.3% | 9.2% | 9.2% | 9.2% | 8.9% | 8.2% | 8.6% | 8.3% | 7.3% | 5.5% | 5.4% | 5.2% | 3.3% | 4.4% | 5.1% | 5.0% |
| BA or more | 3.8% | 3.8% | 3.8% | 3.8% | 3.7% | 3.6% | 3.7% | 3.6% | 3.5% | 2.9% | 2.9% | 2.8% | 2.2% | 2.6% | 2.7% | 2.6% |
| Employment Status of Adults in Unit | ||||||||||||||||
| 1+ full-year, full-time workers | 5.9% | 5.8% | 5.9% | 5.8% | 5.4% | 5.3% | 5.2% | 5.1% | 5.0% | 3.6% | 3.6% | 3.5% | 2.2% | 2.9% | 3.4% | 2.8% |
| 1+ part-time or part-year workers (and no adults who work full-time for the full-year) | 24.1% | 24.1% | 24.1% | 23.7% | 21.8% | 20.7% | 21.2% | 19.5% | 18.1% | 14.2% | 14.0% | 13.3% | 9.3% | 11.7% | 13.2% | 12.0% |
| No workers | 62.7% | 62.7% | 62.7% | 62.7% | 62.7% | 54.6% | 62.7% | 62.7% | 49.9% | 41.4% | 39.9% | 37.2% | 30.0% | 34.6% | 37.1% | 37.1% |
| Unit participates in major safety net program (not counting tax credit) | ||||||||||||||||
| At least one unit member participates in major safety net program | 21.4% | 21.4% | 21.4% | 21.1% | 20.0% | 18.6% | 19.5% | 18.9% | 16.8% | 12.9% | 12.6% | 12.0% | 8.2% | 10.5% | 11.8% | 10.8% |
| *PO 1 | PO 2 | PO 3 | PO 4 | PO 5 | PO 6 | PO 7 | PO 8 | PO 9 | PO 10 | PO 11 | **PO 12 | PO 13 | PO 14 | PO 15 | PO 16 | |
|---|---|---|---|---|---|---|---|---|---|---|---|---|---|---|---|---|
| No member participates in major safety net program | 2.3% | 2.3% | 2.3% | 2.3% | 2.3% | 2.2% | 2.2% | 2.2% | 2.2% | 1.8% | 1.8% | 1.8% | 1.3% | 1.5% | 1.7% | 1.5% |
| Unit has nonelderly member with disability | ||||||||||||||||
| 1+ members with disability | 25.7% | 25.7% | 25.7% | 25.5% | 24.8% | 20.9% | 24.6% | 24.2% | 18.3% | 13.3% | 12.7% | 12.0% | 8.5% | 10.6% | 11.9% | 11.8% |
| No members with disability | 9.5% | 9.5% | 9.5% | 9.4% | 8.9% | 8.5% | 8.6% | 8.4% | 7.9% | 6.2% | 6.1% | 5.9% | 4.1% | 5.1% | 5.7% | 5.1% |
| Child’s Health Insurance | ||||||||||||||||
| Has private | 4.0% | 4.0% | 4.0% | 4.0% | 3.9% | 3.8% | 3.8% | 3.8% | 3.6% | 2.7% | 2.7% | 2.7% | 2.0% | 2.4% | 2.6% | 2.5% |
| Has public (no private) | 23.2% | 23.1% | 23.2% | 22.8% | 21.5% | 19.9% | 20.9% | 20.3% | 17.9% | 13.6% | 13.2% | 12.6% | 8.3% | 10.9% | 12.3% | 11.1% |
| Uninsured | 16.5% | 16.4% | 16.4% | 16.2% | 15.5% | 14.7% | 15.4% | 15.1% | 13.7% | 11.7% | 11.6% | 11.5% | 8.5% | 9.9% | 11.1% | 9.6% |
| *PO 1 | PO 2 | PO 3 | PO 4 | PO 5 | PO 6 | PO 7 | PO 8 | PO 9 | PO 10 | PO 11 | **PO 12 | PO 13 | PO 14 | PO 15 | PO 16 | |
|---|---|---|---|---|---|---|---|---|---|---|---|---|---|---|---|---|
| C. Residential Location | ||||||||||||||||
| Metropolitan/Nonmetropolitan Area | ||||||||||||||||
| Inside metropolitan area | 11.4% | 11.4% | 11.4% | 11.2% | 10.7% | 10.1% | 10.4% | 10.2% | 9.3% | 7.1% | 7.0% | 6.8% | 4.7% | 6.0% | 6.6% | 6.0% |
| Outside metropolitan area | 9.0% | 9.0% | 9.0% | 8.9% | 8.5% | 7.5% | 8.5% | 8.2% | 6.2% | 5.1% | 4.8% | 4.3% | 2.9% | 3.7% | 4.3% | 4.2% |
| Metropolitan status not disclosed | 6.8% | 6.8% | 6.8% | 6.8% | 6.8% | 6.4% | 6.8% | 6.7% | 6.2% | 4.4% | 3.8% | 3.8% | 2.6% | 2.9% | 3.8% | 2.6% |
| Census Division | ||||||||||||||||
| New England | 8.2% | 8.1% | 8.1% | 8.1% | 7.5% | 7.4% | 7.4% | 7.3% | 7.1% | 5.7% | 5.6% | 5.2% | 3.4% | 4.4% | 4.8% | 4.3% |
| Middle Atlantic | 10.4% | 10.3% | 10.3% | 10.2% | 9.7% | 9.1% | 9.4% | 9.2% | 8.5% | 6.8% | 6.7% | 6.4% | 4.7% | 5.8% | 6.2% | 5.6% |
| East North Central | 7.2% | 7.2% | 7.2% | 7.1% | 6.8% | 6.4% | 6.5% | 6.1% | 5.5% | 3.8% | 3.7% | 3.5% | 2.2% | 3.0% | 3.5% | 3.2% |
| West North Central | 5.8% | 5.7% | 5.7% | 5.7% | 5.6% | 5.1% | 5.5% | 5.3% | 4.4% | 2.9 | 2.7% | 2.7% | 1.7% | 2.4% | 2.7% | 2.5% |
| South Atlantic | 13.3% | 13.2% | 13.2% | 13.1% | 12.7% | 11.8% | 12.4% | 12.2% | 11.0% | 8.9% | 8.8% | 8.5% | 6.3% | 7.5% | 8.0% | 7.3% |
| East South Central | 11.1% | 11.1% | 11.1% | 11.0% | 9.9% | 9.1% | 9.8% | 9.4% | 8.0% | 6.5% | 6.2% | 6.0% | 4.4% | 5.8% | 6.0% | 5.8% |
| West South Central | 13.3% | 13.3% | 13.3% | 12.8% | 12.2% | 11.1% | 11.8% | 11.5% | 9.7% | 7.3% | 7.1% | 6.7% | 4.7% | 5.7% | 6.7% | 5.8% |
| Mountain | 9.3% | 9.3% | 9.3% | 9.1% | 8.5% | 7.8% | 8.4% | 8.1% | 7.2% | 5.6% | 5.5% | 5.3% | 3.3% | 4.4% | 5.3% | 4.4% |
| Pacific | 14.2% | 14.1% | 14.2% | 14.1% | 13.6% | 13.1% | 13.4% | 13.3% | 12.6% | 9.6% | 9.4% | 9.1% | 6.1% | 7.8% | 9.0% | 8.5% |
| *PO 1 | PO 2 | PO 3 | PO 4 | PO 5 | PO 6 | PO 7 | PO 8 | PO 9 | PO 10 | PO 11 | **PO 12 | PO 13 | PO 14 | PO 15 | PO 16 | |
|---|---|---|---|---|---|---|---|---|---|---|---|---|---|---|---|---|
| D. Race/Ethnicity and Citizenship/Immigration Status | ||||||||||||||||
| Race-ethnicity | ||||||||||||||||
| White Non-Hispanic | 5.7% | 5.7% | 5.7% | 5.6% | 5.4% | 5.0% | 5.4% | 5.3% | 4.6% | 3.6% | 3.5% | 3.3% | 2.4% | 3.0% | 3.3% | 3.3% |
| Black Non-Hispanic | 15.8% | 15.8% | 15.8% | 15.4% | 14.4% | 12.9% | 14.0% | 13.5% | 11.3% | 8.9% | 8.7% | 8.0% | 5.6% | 7.1% | 7.5% | 7.5% |
| Hispanic | 19.3% | 19.2% | 19.3% | 19.0% | 18.2% | 17.3% | 17.7% | 17.4% | 16.3% | 12.3% | 12.1% | 11.8% | 7.8% | 10.1% | 11.6% | 9.6% |
| Asian Pacific Islander Non-Hispanic | 10.6% | 10.6% | 10.6% | 10.6% | 10.3% | 9.9% | 9.7% | 9.4% | 9.1% | 7.5% | 7.4% | 7.3% | 5.9% | 6.7% | 7.3% | 6.8% |
| Other (Non-Hispanic) | 9.5% | 9.5% | 9.5% | 9.5% | 9.1% | 8.6% | 8.9% | 8.3% | 7.3% | 5.6% | 5.2% | 5.2% | 3.1% | 4.7% | 5.2% | 5.2% |
| Child and Parent or Family Head Nativity | ||||||||||||||||
| U.S.-born child/Immigrant Head | 18.1% | 18.1% | 18.1% | 18.0% | 17.1% | 16.7% | 16.5% | 16.2% | 15.7% | 11.7% | 11.7% | 11.5% | 7.3% | 9.7% | 11.3% | 9.2% |
| U.S.-born child/U.S.-born Head | 8.0% | 8.0% | 8.0% | 7.8% | 7.4% | 6.7% | 7.3% | 7.1% | 5.9% | 4.5% | 4.3% | 4.1% | 2.8% | 3.5% | 4.1% | 4.1% |
| Foreign-born child | 23.6% | 23.5% | 23.5% | 23.5% | 22.5% | 22.0% | 21.9% | 21.8% | 21.0% | 19.3% | 19.2% | 18.8% | 15.9% | 18.1% | 15.7% | 13.5% |
| Citizenship/Immigration Status of SPM Family Members | ||||||||||||||||
| Child in all-U.S. citizen family | 8.2% | 8.1% | 8.2% | 8.0% | 7.6% | 6.9% | 7.5% | 7.2% | 6.2% | 4.7% | 4.5% | 4.3% | 3.0% | 3.7% | 4.3% | 4.3% |
| Child in mixed-status family | 23.0% | 22.9% | 22.9% | 22.8% | 21.8% | 21.3% | 21.2% | 20.9% | 20.2% | 15.8% | 15.8% | 15.5% | 10.6% | 13.8% | 14.7% | 11.8% |
| Citizen child in mixed-status family | 22.3% | 22.2% | 22.2% | 22.1% | 21.0% | 20.5% | 20.5% | 20.1% | 19.4% | 14.6% | 14.5% | 14.2% | 9.1% | 12.3% | 14.1% | 11.1% |
| Citizen child in mixed-status family with undocumented member | 30.0% | 30.0% | 29.8% | 28.3% | 28.2% | 27.5% | 26.8% | 26.7% | 25.8% | 19.1% | 19.2% | 19.0% | 12.5% | 16.6% | 18.1% | 9.8% |
| Noncitizen child in mixed-status family | 26.9% | 26.8% | 26.8% | 26.8% | 26.2% | 25.5% | 25.6% | 25.4% | 24.5% | 22.8% | 22.7% | 22.4% | 18.9% | 21.6% | 18.5% | 15.9% |
| Noncitizen child in mixed-status family with undocumented member | 38.0% | 38.0% | 38.0% | 38.0% | 37.3% | 36.8% | 37.0% | 37.0% | 36.1% | 34.4% | 34.2% | 33.9% | 32.1% | 33.9% | 24.4% | 18.0% |
NOTES: Bolded POs denote focal options.
* PO 1 is the non-American Rescue Plan Act of 2021 Earned Income Tax Credit (EITC) + Tax Cuts and Job Act Child Tax Credit (CTC) PO.
** PO 12 is the Modified Combined EITC & CTC Policies in 2021.
SOURCE: Estimates from TRIM3 commissioned by the committee.
Again, using estimates for the Modified Combined EITC & CTC Policies in 2021 to illustrate, Panel D shows that poverty is reduced from 5.7% to 3.3% for White non-Hispanic children, and from 15.8% to 8.0% for Black non-Hispanic children. The relatively similar 42.0% and 49.2% reductions for White and Black children, respectively, equate to a 2.4 percentage point decline in poverty for White children, relative to a much larger 7.8 percentage point decline for Black children. This pattern of larger percentage point changes among those with the highest baseline poverty rates is reflected across most subgroups. Comparing the non-ARPA EITC + TCJA CTC policy and the Modified Combined EITC & CTC Policies in 2021, the percentage point change is 4.6% across all children (see Table 9-2), but it is at least twice that for citizen children in mixed-status families with an undocumented member (Table 9-8, Panel D); for children in single-parent families (Panel A); and for children in families with no full-time workers, those with a nonelderly family member with a disability, and those with a family head with less than high school education (Panel B); and for children in households in which at least one member participates in a major safety net program, and children with public, but no private, health insurance (Panel B)—all groups with baseline poverty rates of at least 20%.
In the case of the Modified Combined EITC & CTC Policies in 2021, both percentage and percentage point poverty reductions were relatively small for foreign-born children and those living in mixed-status families (Panel D). In contrast, PO 16, in which parents and children are exempted from required citizenship or resident alien status and do not need to have SSNs to qualify for credits, generates somewhat higher child poverty reductions overall, especially for these groups.
Finally, sample sizes in some analyzed subgroup categories are small, increasing the uncertainty of estimates. However, many differences across groups are substantial enough that they are likely to be statistically significant.
Conclusion 9-4: Child poverty differs greatly by race and ethnicity, immigration status, family demographics, and program participation. Most of the committee’s policy options reduce poverty by similar proportions across most groups, but the largest percentage point changes are typically for groups with the highest poverty rates.
ADDITIONAL CONSIDERATIONS
It is important to consider several limitations when evaluating the results presented in this chapter. Consistent with the statement of task, the committee’s estimates focused on effects of various policy options on child poverty using SPM thresholds and TRIM3. The limitations of TRIM3 are discussed in Appendix H, and many have been addressed in the discussions
of the estimates. Limitations also constrained the range of policy alternatives considered. For example, the Combined EITC & CTC Policies actually implemented in 2021 included a “lookback” provision that allowed parents to use prior-year earnings to calculate their credits. However, because TRIM3 relies on CPS ASEC data that generally do not include earnings from multiple years, this option could not be analyzed.
When parents live apart, the CPS ASEC collects income and benefit information only for the parent residing in the survey-taking household at the time of the survey. As a result, the committee’s analysis does not account for the potential impact of a noncustodial parent’s EITC or CTC on child poverty; moreover, policy options that would allow children in shared custody arrangements to qualify for credits based on both parents’ earnings were not analyzed.
As discussed in Chapter 3, the SPM measures cash and near-cash resources. While it accounts for child care costs, it does not capture other resources that contribute to child well-being. Thus, the committee’s analysis incorporates estimates of how employment effects influence poverty by changing earnings but does not account for the value of parents’ time associated with those employment effects—other than through child care costs. As noted in Chapter 7, employment effects are greatest for single mothers with young children, which may reflect the high value of time spent at home in this situation.
CONCLUSION
The statement of task charged the committee to consider policy options that could further reduce the number of U.S. children in poverty. The committee estimated 16 policy options, each differing from others along a single dimension and typically assessed sequentially, such that estimated impacts associated with each policy option depend in part on the order changes are made. This chapter focused on the non-ARPA EITC + TCJA CTC policy, a modified version of Combined EITC & CTC Policies in 2021 in which the CTC benefits were phased out faster than the actual CTC policy under ARPA that was implemented in 2021, and five other alternatives that include a range of maximum credit amounts and provide greater or lesser additional income tied to earnings.
The committee considered several relatively modest changes to the structure and rate of the CTC phase-in, which generally results in modest impacts on poverty and program outlays. The non-ARPA EITC + TCJA CTC policy includes a $2,000 per-child credit phased in at 15% after the first $2,500 of earnings. Phasing in the credit with the first dollar of earnings and at 15% of earnings per child (PO 5) results in a modest reduction in poverty relative to the non-ARPA EITC + TCJA CTC policy option
(PO 1)—approximately 0.7 percentage points or 490,000 children lifted out of poverty—and (combined with a faster phase-out) a decrease in outlays of about $13 billion relative to PO 1. Policy options that were not among the focal options analyzed—such as those extending credits to 17-year-old children (PO 2) and making the CTC fully refundable (PO 7)—also show relatively small estimated impacts (see Table 9-2). A faster phase-out of CTC benefits that reduced benefits to middle and higher-income families (PO 3 through PO 16) is estimated to save approximately $25 billion in outlays (compared to PO 2).
Providing a $1,000 minimum per-child CTC in the context of a 15% per-child phase-in (PO 6), or exempting earnings requirements for caretakers who are elderly, disabled, or caring for children under 6 (PO 9), are estimated to result in somewhat larger poverty reductions—about 0.5 million or 1 million children, respectively, would be lifted out of poverty compared to a policy option without these features, such as PO 5. Comparing these options to those preceding them—for example, comparing PO 6 to PO 5 and PO 9 to PO 8—indicates increases in total outlays by $5.3 billion (of which $2.9 billion goes to families in poverty) and $7.8 billion (of which $4.2 billion goes to families in poverty), respectively, or approximately $13 billion in total outlays.
Policy options estimated to have the greatest impact on poverty include substantial increases in the maximum credit amount. Moving from a maximum credit of $2,000 per child to $3,000 per child (or $3,600 for children under 6) and allowing half of that maximum to go to families with no earnings (PO 11) is estimated to remove an additional 1.6 million children from poverty compared to PO 9, and a total of 3.2 million relative to the non-ARPA EITC + TCJA CTC policy option (PO 1). This would increase outlays by an additional $74.8 billion ($14.7 billion going to families in poverty)—a similar increase in total outlays relative to PO 1, but a larger increase in outlays going to families in poverty. Further increasing the maximum credit to $3,600 (or $4,200 for children under 6) reduces child poverty by even more, as does a policy option with a $2,000 per-child credit phased in at 15% added to the Modified Combined EITC & CTC Policies in 2021—again, a higher credit, but with eligibility for the addition contingent on earnings. Making the EITC modestly more generous increases the reduction in child poverty in each case by about 0.5 percentage points.
For several policy options, the committee also accounted for employment responses to changes in the EITC and CTC, to evaluate their consequences for estimating impacts on child poverty. A range of assumptions about employment elasticities was used, which are described in Chapter 7. For almost all policy options considered, incorporating employment responses increases estimated child poverty rates compared to estimates that
do not account for such responses.14 Nonetheless, even after accounting for employment effects, all policy options considered are estimated to reduce child poverty, some quite substantially.
The more generous policy options considered reduce child poverty by 50% to 60% or more in virtually all cases, though the numbers of children raised out of poverty depend heavily on which poverty threshold is used. The numbers of children raised out of poverty are smallest for children living in deep poverty and largest for children in near poverty (i.e., those living in families with incomes below 150% of the SPM threshold). Fiscal outlays needed for such increases are large, since much of the CTC goes to families that are not in poverty or near poverty. Increases in the EITC are better targeted to lifting children in poverty or near poverty out of poverty.
___________________
14 For example, incorporating medium employment effects in evaluating the increase in maximum credit to $3,000/$3,600 results in the estimated number of children removed from poverty increasing from 1.5 million to 1.6 million.
This page intentionally left blank.


