Pathways to Reduce Child Poverty: Impacts of Federal Tax Credits (2026)
Chapter: 8 Impact of the EITC and CTC on Child Poverty in 2021
8
Impact of the EITC and CTC on Child Poverty in 2021
This chapter presents the committee’s estimates of the effects of the Earned Income Tax Credit (EITC) and Child Tax Credit (CTC) on the child poverty rate and number of children in poverty in 2021 using the Supplemental Poverty Measure (SPM). These estimates represent the committee’s work in addressing the first element of the statement of task as discussed in Chapter 1, including the mandated use of the SPM to measure poverty. The chapter begins by outlining the committee’s preferred estimates and detailing the methods and data sources used, along with their strengths and limitations. It then reviews the elements of the EITC and CTC that existed prior to 2021 as well as the changes made to those programs in response to the COVID-19 pandemic (hereafter, “pandemic”), under the American Rescue Plan Act of 2021 (ARPA; discussed in detail in Chapter 2). ARPA added new provisions to both policies, although changes to the EITC primarily affected the size of credits for childless adults and not those for children, making the structure of the EITC in 2021 almost identical to its structure just prior to 2021, for the purpose of assessing impacts on child poverty. Baseline child poverty estimates are first presented without adjustments for employment effects and, where possible, compared with U.S. Census Bureau estimates. The next section incorporates a range of assumptions about how the EITC and CTC policies in 2021 may have affected parental employment. Additional estimates—without employment adjustments—assess antipoverty impacts of those tax credits in the absence of other pandemic-era programs, as well as impacts on deep and near poverty. The chapter also examines how results change when EITC and CTC benefits are credited in the year received rather than accrued. Finally, the
BOX 8-1
Chapter 8 Main Messages
- After adjusting for employment effects, the combined provisions of the Earned Income Tax Credit (EITC) and Child Tax Credit (CTC) in place in 2021—referred to below as the “Combined EITC & CTC Policies in 2021”—were estimated to reduce the child poverty rate by 3.1 to 3.4 percentage points (53% to 55% relative reduction) and removed between 2.2 and 2.5 million children from poverty compared to having no provisions of EITC or CTC policies in place.
- The combination of provisions of the CTC in place under the Tax Cuts and Jobs Act (TCJA) plus the elements of EITC in place in 2021—referred to below as “EITC in 2021 + TCJA CTC” policies—would have reduced the child poverty rate by 1.5 to 1.8 percentage points (25% relative reduction) and removed between 1 and 1.3 million children from poverty, again after adjusting for employment effects and relative to no provisions of the EITC or CTC in place.
- Antipoverty effects of components of the EITC and CTC policies in 2021 would have been larger if other major pandemic programs had not already removed millions of children from poverty.
- Income-increasing effects of the provisions of the EITC and CTC policies in 2021 were considerably larger for children in families with incomes somewhat above the poverty line because eligibility and benefits were tied to higher earnings among that group; but effects were smaller for children in families with incomes somewhat below the poverty line.
- Adjusting the antipoverty impacts of the Combined EITC & CTC Policies in 2021 for employment responses increases the size of those impacts in reducing poverty because the effect of the EITC in increasing employment outweighs the effect of the CTC in reducing it.
- Considering that many families received much of their 2021 credits in 2022 when filing their taxes, the antipoverty effects of the Combined EITC & CTC Policies in 2021 only partly increased incomes in 2021, while also increasing incomes in 2022—implying that the antipoverty impact of the credits was spread across both calendar years.
- Reductions in child poverty were largest for children in single-parent families, families with low parental education, nonworking or part-time working families, and in Hispanic and non-Hispanic Black families—demonstrating the credits’ varying reach and effectiveness.
- Estimated poverty rates reported by the U.S. Census Bureau are considerably above those presented in this chapter because of differences in methodology, making the percentage point reduction presented less on average; but the percent reductions in poverty from the EITC and CTC are quite similar on average.
chapter provides subgroup estimates (excluding employment effects) by family composition, socioeconomic status, geography, race/ethnicity, and citizenship, consistent with the committee’s statement of task. Findings and conclusions are discussed throughout. See Box 8-1 for a summary of the main messages in Chapter 8.
METHODS
Unless otherwise noted, all results presented in this chapter are based on calculations using the Transfer Income Model version 3 (TRIM3), which has been used by the U.S. Department of Health and Human Services for calculating the effect of government benefit programs on poverty rates since the early 1970s (Zedlewski & Giannarelli, 2015). TRIM3 was developed and is maintained by the Urban Institute, with primary funding from the Department of Health and Human Services, Office of the Assistant Secretary for Planning and Evaluation. TRIM3 is a simulation model that draws on the same survey dataset used by the Census Bureau in cooperation with the Bureau of Labor Statistics and by most studies that calculate U.S. poverty rates. The dataset used is the Annual Social and Economic Supplement (ASEC) to the Current Population Survey (CPS) conducted by the Census Bureau. The CPS ASEC surveys a random sample of the noninstitutional U.S. population each year and obtains information from survey respondents on their income, receipt of government transfer benefits, and other forms of government support, all measured in the calendar year prior to the survey, as well as basic information on household structure (e.g., marital status, presence of children, family size), number and ages of children, and other demographic characteristics. TRIM3 uses the CPS ASEC sample and its reported income, combined with TRIM3-simulated benefits, taxes, and tax credits, and calculates the poverty status for each household in the survey, using the SPM, whose definition and construction are discussed in Chapter 3. Poverty rates for children are calculated as the fraction of children in family units with incomes below the poverty line (as well as adults, though adults are not examined here).1 For the calculations in this chapter, TRIM3 employed data for calendar year 2021. Those data were obtained from the CPS ASEC conducted in spring 2022, which asked questions about income in the prior calendar year.
TRIM3 has specific strengths and limitations (see Box 8-2), with most limitations related to limitations in the underlying CPS ASEC data and not
___________________
1The word “family” represents the unit used by the Census Bureau in its calculations of resources for the SPM. The Census Bureau defines the family unit as consisting of all related individuals living at the same address, any coresident unrelated children who are cared for by the family, and any cohabitors and their children (U.S. Census Bureau, 2024).
BOX 8-2
Transfer Income Model Version 3 (TRIM3) Strengths and Limitations
Strengths
- Comprehensively models all major tax and transfer programs using detailed eligibility rules and benefit formulas for each.
- Models all major COVID-19 pandemic programs, both eligibility and benefits, to the extent possible with available data.
- Adjusts for respondent underreporting of transfer benefits in the Current Population Survey (CPS) Annual Social and Economic Supplement.
- Estimates legal status of noncitizen families and individuals and uses that information in simulating benefits and tax credits.
Limitations of the CPS ASEC data
- Survey respondents do not report Earned Income Tax Credit (EITC) or Child Tax Credit (CTC) received, so credits were estimated in TRIM3.
- Estimation of tax credits requires assumptions on tax filing units, filing status, income, number of qualifying children, and other tax credit-related variables.
- TRIM3 assumes all eligible families file tax returns and receive the credit for which they are eligible.
- Aggregate estimated EITC and CTC recipient counts and credit sizes do not always align with Internal Revenue Service–reported aggregates, including differences sometime by income stratum.
- Year of actual receipt of tax credits cannot be directly estimated.
to TRIM3 per se.2 Among the core strengths of TRIM3 is its comprehensive, detailed modeling of all major tax and transfer programs in the United States. TRIM3 captures benefits received from all major transfer programs by each family and uses program rules to check eligibility for all major programs—including important 2021 pandemic programs related to expansion of benefits and eligibility in the Unemployment Insurance program, the Economic Impact Payments, and others. Another important strength of TRIM3 is that it adjusts the transfer benefit amounts reported by respondents for the well-known problem of underreporting such income.3 As shown later in this chapter, this adjustment has a significant effect on estimated rates of child poverty. Finally, TRIM3 estimates the legal status of noncitizens, which
___________________
2See Appendix H for details.
3See Wheaton and Giannarelli (2000), Meyer and Sullivan (2003), and Meyer et al. (2015). Also, see the discussion in Chapter 3.
matters in terms of eligibility for most benefit programs and tax credits, including the EITC and CTC.4
An important limitation for present purposes is that the CPS ASEC does not collect information on tax liabilities and tax credits because respondents are likely unable to accurately report those amounts. Consequently, TRIM3, like the Census Bureau model and almost all other models that estimate U.S. poverty rates, estimates respondents’ taxes, including EITC and CTC amounts each family could receive, by applying the formulas for those credits embedded in the tax rules (Wheaton & Stevens, 2016). However, this requires assumptions about how households form tax filing units, whether income reports in the CPS ASEC match those on federal tax returns, whether the household structure (e.g., marital status, numbers of qualifying children) in the March CPS ASEC is the same as that in the prior calendar year, and whether any ineligible families receive credits. These factors may lead to a different estimate of what a family might receive than what that family actually claimed on their tax return.
Another limitation of TRIM3 and most other models is that it makes the assumption that all families who are eligible for a tax credit file tax returns and receive those credits. However, as discussed in Chapter 4, studies have indicated that the number of families eligible and the number who actually receive benefits differs, with one reason being that some eligible families do not file tax returns. This is referred to as incomplete take-up, and the antipoverty impact of the EITC and CTC can be overestimated when incomplete take-up occurs.5
Relatedly, aggregate EITC and CTC amounts estimated by TRIM3 as received by families do not always align with the total number of families reported by the Internal Revenue Service (IRS) as receiving the credits or with the aggregate amounts of those credits reported by the IRS. Misalignment differs for the EITC and the CTC, but in several cases the estimated recipient count and benefit aggregates in IRS data exceed those estimated by TRIM3.6 Misalignment could result from CPS ASEC characteristics not representing the family structure and income amounts reflected on filed tax returns, the characteristics of the weighted population in the CPS ASEC not reflecting the characteristics of the population suggested by tax return data, or other reasons. However, it is not possible to determine whether the TRIM3-estimated tax credits make the estimated antipoverty impacts of
___________________
4See Appendix H.
5However, as also discussed in Chapter 4, offsetting factors can lead to underestimation. For transfer programs other than the EITC and CTC, however, the TRIM3 estimates incomplete take-up.
6See Appendix H and Chapter 4 for details.
the EITC and CTC too large or too small, and more research on this issue is recommended.
Finally, TRIM3 and other models that use the CPS ASEC calculate the amounts of the credits for which a family is eligible based on their 2021 income and assign those credits to income in 2021, even though many families received some of those credits in calendar year 2022, after filing 2021 tax returns. In addition, the model cannot directly estimate tax credits received in spring 2021 because that requires knowledge of 2020 income, which is not reported on the CPS ASEC administered in spring 2022. Consequently, TRIM3, like most other models, assigns credits in the year they are accrued, not the year they are received.7 Nevertheless, an estimate of credits received in 2021 using TRIM3 is reported below.
The EITC and CTC Policies in 2021
Eligibility rules for the EITC and CTC policies in 2021, and the formulas for calculating the credit amount a tax filing unit was entitled to, were reviewed in Chapter 2. The programs are briefly described again here.
The EITC is a tax credit that provides credits to eligible units who have earnings, with the size of the benefit amount depending on a household’s taxable earnings (i.e., the credit rises at a certain rate as earnings increase, reaches a peak over a moderate range of earnings, and then phases out at a gradual rate). Families with no earnings receive no credit, as do families with earnings above the maximum earnings point.8 The 2021 ARPA legislation expanded the EITC but primarily by increasing the size of the credit for childless taxpayers, which has little impact on the poverty rate of children.9 Consequently, the antipoverty impact of the 2021 total EITC—including its pre-2021, permanent structure and its ARPA provisions—is almost identical. For this reason, the analyses presented below report antipoverty impacts only for the combination of the pre-ARPA components of the EITC
___________________
7See Chapter 3 for discussion of allocating tax credits to the year accrued versus the year received.
8The credit is phased out by income instead of earnings, but the two are closely related for low-income families. Eligibility also requires low asset income.
9A few families with children also have adults present in the family who are eligible for the childless portion of the EITC. All estimates in this chapter include in family income the estimated EITC for any such adults, but their impact on child poverty is negligible. ARPA also included a “lookback” provision that allowed families to use 2020 earnings as well as 2021 earnings to establish eligibility and credit amounts. This feature cannot be captured by the CPS ASEC because the spring 2022 interview asked respondents about their 2021 earnings but not about their 2020 earnings. However, this is likely to have a relatively small impact on the estimates reported in this chapter.
and the ARPA changes noted above; the combination of these components is referred to as the “EITC Policy in 2021.”10
CTC policy in 2021 also can be broken into two components: one reflecting what was established prior to (and after) 2021, under the Tax Cuts and Jobs Act (TCJA) of 2017, and the other consisting of features that were added by the ARPA legislation (i.e., the ARPA CTC Expansion). (See Figures 2-5 and 2-6 for a visualization of these two components for head-of-household [HoH] and married filing jointly [MFJ] tax filers, respectively.) This first component is referred to as the TCJA CTC Only. It provided no benefits to families with less than $2,500 in earnings, including those with no earned income, but provided a positive credit that generally grew as earnings and taxable income grew above that level.11 The TCJA CTC Only paid a maximum credit of $2,000 per child and began to phase out at income levels that varied with filing status and number of children (e.g., a little over $200,000 for a HoH tax filer with one child) and was not fully phased out until quite high levels of income (e.g., about $450,000 for MFJ filers and $250,000 for single-parent filers with one child). The second component, referred to as the “ARPA CTC Expansion,” provided a so-called “fully refundable” credit, made eligible to all families earning less than the amount needed to claim the full credit, including families with no earnings. This component also eliminated the phase-in by paying a constant credit amount over a low range of income. For those with low and moderate incomes, the ARPA CTC Expansion resulted in credit amounts considerably higher than those in the pre-2021 TCJA CTC Only.12
For most of the analyses below, starting with Figure 8-3, the antipoverty impacts of the four components of EITC and CTC policies in 2021 are presented and all are compared to the counterfactual situation of no EITC or CTC being available. First, the impacts of the components of the “EITC Policy in 2021” are considered, with no attempt to separate this impact into the pre-ARPA and ARPA provisions for the EITC. The second set are estimates of what impact the provisions of the CTC under the TCJA—referred to as “TCJA CTC Only”—would have had on child poverty. The third set present estimates of what the impact of the combination of the provisions of the EITC policy in 2021 and those of TCJA CTC—referred to as “EITC in 2021 + TCJA CTC Only”—would have been on child poverty.
___________________
10See Box 1-2 for a complete description of this and the other terms used to describe EITC and CTC policy in 2021.
11The refundable portion of the credit is based on earnings, but the credit is phased out with income.
12The ARPA CTC Expansion only increased credits for families with incomes below approximately $150,000 for head-of-household tax filers with a child aged 0 to 5 and approximately $180,000 for married filers with a child aged 0 to 5, for example. Above those levels, the credits were the same as those for the TCJA CTC Only. See Chapter 2.
Finally, estimates of the impact of the combination of the provisions of the EITC and CTC in place in 2021—referred to as the “Combined EITC & CTC Policies in 2021”—on child poverty are presented, where the difference between this effect and those for the EITC in 2021 + TCJA CTC Only provisions reflect the impact that just the provisions of the “ARPA CTC Expansion” would have on child poverty. (See Box 1-2 in Chapter 1 for full descriptions of these and the other policy components considered in this report. See also the discussion in Chapter 1 about the rationale the committee developed for evaluating the above components.)
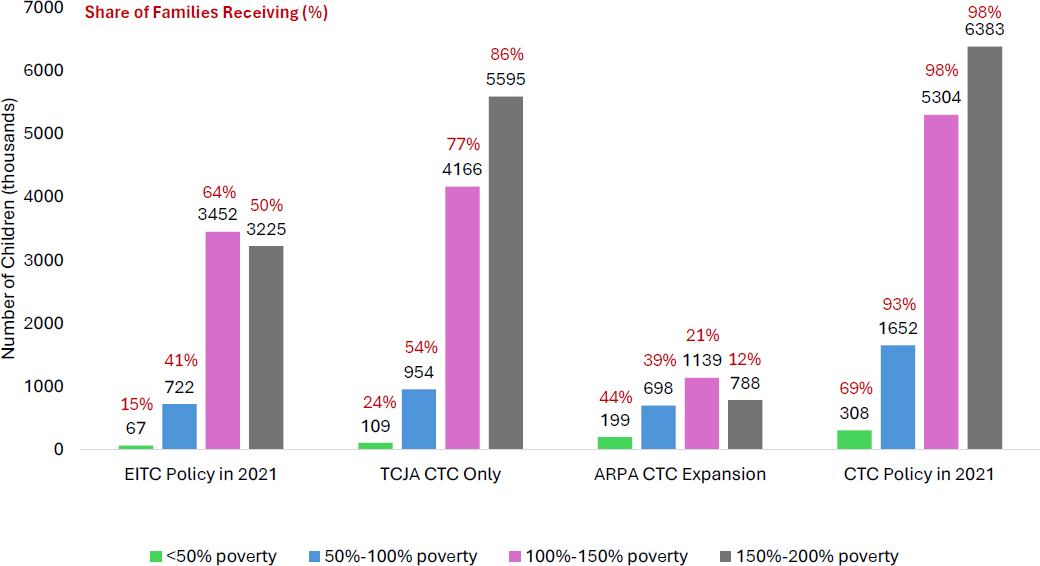
Figures 8-1 and 8-2 show the 2021 distribution of estimated EITC and CTC credits over parts of the pre-credit income distribution for families with children, with Figure 8-1 showing the number and percent of each income group estimated to receive each credit and Figure 8-2 showing the size of the credits for each group.13 Both figures separate families into four groups: those with pre-credit incomes that put them into “deep poverty” (i.e., incomes less than 50% of the poverty line), “shallow poverty” (i.e., incomes more than 50% but less than 100% of the poverty line), “near poverty” (i.e., incomes more than 100% but less than 150% of the poverty line), and “above poverty” (i.e., incomes more than 150% but less than 200% of the poverty line). In 2021, the average poverty line for a family of four was $27,740 (Creamer et al., 2022, p. 20), meaning that families of that size with incomes less than $13,870 were considered to be in deep poverty, those making over $27,740 but less than $41,160 were considered to be in near poverty, and those making between $41,160 and $55,480 were considered to be not in poverty. The figures show receipt rates and credit sizes for a slightly different, but closely related, configuration of policy components than those described above and used in the figures starting with 8-3: the EITC Policy in 2021, the TCJA CTC Only, the ARPA CTC Expansion, and the CTC Policy in 2021, which is the combination of provisions of the TCJA CTC Only and ARPA CTC Expansion. (Again, see Box 1-2 in Chapter 1 for full descriptions of these components and Figures 2-5 and 2-6 in Chapter 2, which display the various components of the CTC Policy in 2021.)
In terms of distribution of the EITC Policy in 2021, key results include the following:
- The EITC helped many more families (over 50%) with pre-credit incomes between 100% and 200% of the poverty line than the lowest income families (only 15%) with pre-credit incomes below 50% of their poverty threshold (Figure 8-1); the average benefit provided by the EITC was also lowest for the families with the lowest incomes (Figure 8-2).
___________________
13Tables for all figures in this chapter are included in Appendix G.
NOTE: ARPA = American Rescue Plan Act of 2021, CTC = Child Tax Credit, EITC = Earned Income Tax Credit, TCJA = Tax Cuts Job Act.
SOURCE: Estimates from TRIM3 commissioned by the committee.
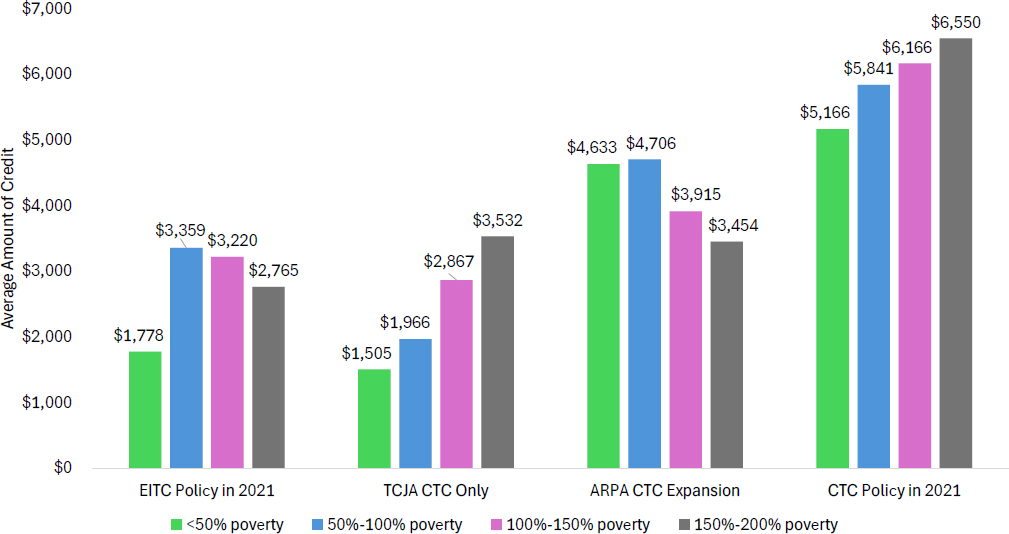
NOTES: TRIM3 estimates average credit amounts for each of the four policy components for those households who were eligible to receive a particular component. Since eligibility of households for TCJA CTC Only and ARPA CTC Expansion differ by level of income, the sum of the averages of each of the bars in these two panels need not equal the means in the corresponding bars in the “CTC Policy in 2021” panel. ARPA = American Rescue Plan Act of 2021, CTC = Child Tax Credit, EITC = Earned Income Tax Credit, TCJA = Tax Cuts Job Act.
SOURCE: Estimates from TRIM3 commissioned by the committee.
NOTE: CTC = Child Tax Credit, EITC = Earned Income Tax Credit, TCJA = Tax Cuts Job Act.
SOURCE: Estimates from TRIM3 commissioned by the committee.
- The lower eligible share and lower credit amounts for the lowest-income families reflect the nature of the EITC, which is based on earned income—the lowest-income families have, on average, lower earnings than families with incomes closer to the poverty line. Moreover, families with no earners (i.e., no one who is self-employed or with wages and salary in the labor market) are generally not eligible for the EITC at all.
- An additional factor that works to lower the rate of EITC receipt among the lowest-income families is that 26% of the children in those families are citizen children in family units with undocumented persons present, and 9% are noncitizens in immigrant families containing undocumented members. If the child or the child’s parents are undocumented, they cannot receive the EITC.
- In contrast, families with pre-credit incomes between 100% and 200% of their poverty threshold not only have earnings in the range where the EITC credit is maximized, but also typically have other sources of income (e.g., cash and in-kind transfer payments other than the EITC and CTC) that put them above the poverty line.
In terms of distribution of the TCJA CTC Only, the ARPA CTC Expansion, and the CTC Policy in 2021, key results include the following:
- Figures 8-1 and 8-2 show, similar to the EITC, that estimated rates of receipt and average credit amounts for the TCJA CTC were relatively low for the families with the lowest incomes compared to estimated rates of receipt and average credit amounts for families with incomes just above their poverty line. In contrast, the ARPA CTC Expansion provided much larger benefits to families with pre-credit incomes below 50% and between 50% and 100% of their poverty threshold. Overall, the CTC Policy in 2021 (i.e., the combination of the provisions of the TCJA CTC and ARPA CTC Expansion) provided benefits to 69% of families with pre-credit incomes below 50% of their poverty threshold, and 93% of families with pre-credit incomes between 50% and 100% of their poverty thresholds.14
- The estimated size of the credit for the ARPA CTC Expansion was much larger than that of the EITC Policy in 2021 or the TCJA CTC Policy. These results suggest that the ARPA CTC Expansion likely had the greatest impact on reducing the child poverty rate, as will be seen below.
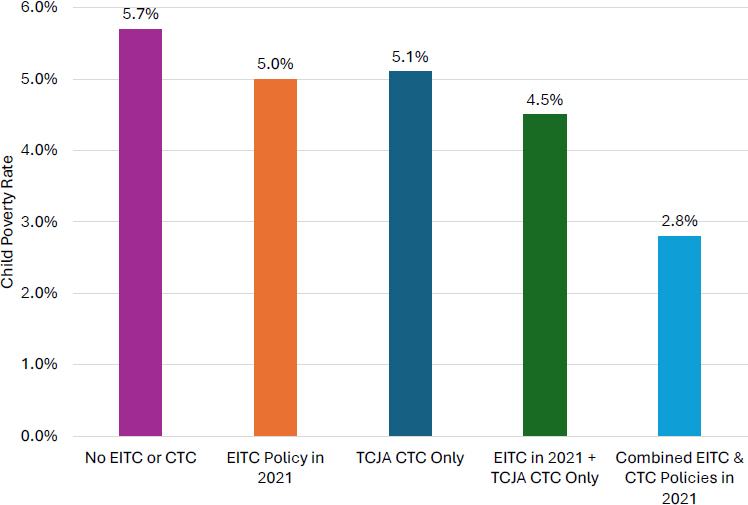
Baseline Results for Credit Impacts
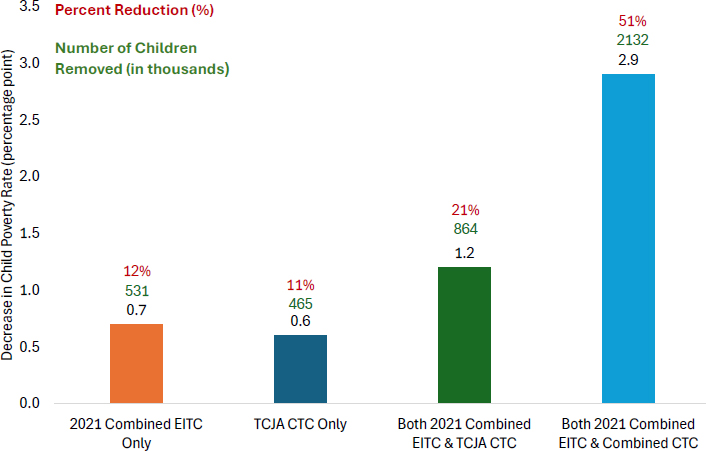
Figure 8-3 shows simple baseline estimates for the levels of the poverty rate in 2021 for the various EITC and CTC programs, and Figure 8-4 shows how each of the programs affected the poverty rate relative to having no EITC or CTC in that year. The figures illustrate poverty levels and changes for a sequence of four programs: first, for the EITC Policy in 2021; second, for the TCJA CTC Only; third, for the EITC in 2021 + TCJA CTC Only; and fourth, for the Combined EITC & CTC Policies in 2021, with the last representing the total effect of the 2021 EITC and CTC programs. This particular sequence is designed to illustrate the differing contributions of the programs that were already present before 2021 and that of the ARPA CTC Expansion, and how they combined to create the total effect of both. As noted in Chapter 2, the programs had quite different structures, with differing implications for poverty reduction.15
___________________
14Although the ARPA CTC Expansion is fully refundable, TRIM3 estimated that only 69% of the families with the lowest incomes received it. Several special categories are not eligible, but the largest is that of undocumented immigrants, who constitute 68% of the families with the lowest incomes ineligible for the EITC.
15These estimates ignore employment effects, the presence of other major pandemic programs, and use the year of accrual and not the year of receipt.
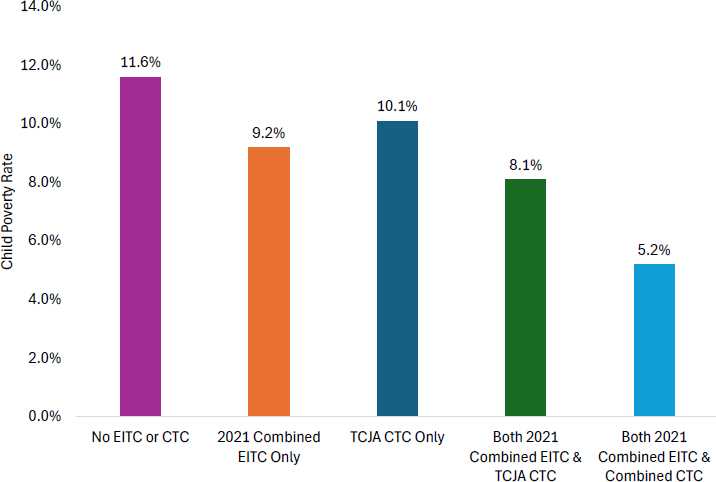
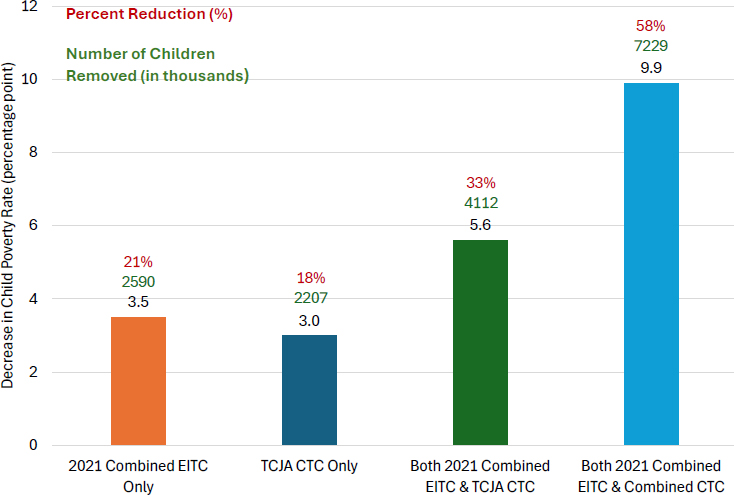
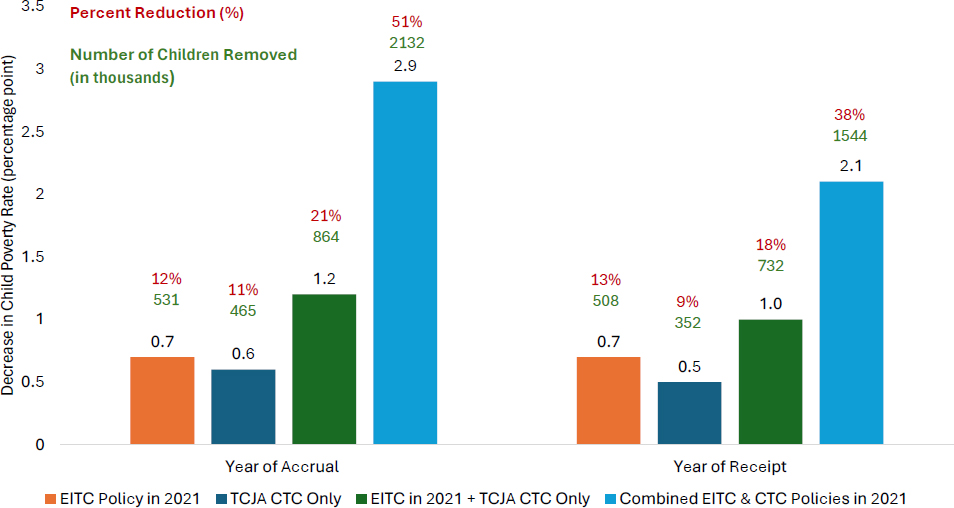
The estimate of the 2021 child poverty rate is 2.8%, or 2.1 million children.16 Figure 8-3 shows that the child poverty rate is estimated to have been 5.7% in the absence of either program in 2021 (no EITC or CTC). If the EITC Policy in 2021 had been introduced alone, without any CTC component, the poverty rate would have fallen to 5.0%, thus decreasing by 0.7 percentage points, amounting to a 12% decline, as shown in Figure 8-4. About half a million children (531,000) would have been removed from poverty. If the TCJA CTC Only had been in place in 2021, without the EITC, the poverty rate would have fallen from 5.7% to 5.1%, a decline of 0.6 percentage points, amounting to an 11% decline, removing a little less than half a million children (465,000) from poverty.17 The estimates therefore show that the EITC Policy in 2021 and TCJA CTC Only had roughly the same impacts on the child poverty rate. If combined, they would have reduced the child poverty rate from 5.7% to 4.5%, a 21% decline, which would have removed nearly 900,000 children from poverty. The
NOTE: CTC = Child Tax Credit, EITC = Earned Income Tax Credit, TCJA = Tax Cuts Job Act.
SOURCE: Estimates from TRIM3 commissioned by the committee.
___________________
16This poverty rate is below that reported by the Census Bureau. See below.
17Please note the limitations of these estimates described in Box 8-2.
combination consequently would have had impacts slightly less than double the magnitude of the credits’ individual impacts.18
The addition of the ARPA CTC Expansion, on top of the EITC Policy in 2021 and the TCJA CTC Only, had an additional impact on the 2021 child poverty rate. With this combination, the estimated child poverty rate was 2.8% (see Figure 8-3), which is 1.7 percentage points below the 4.5% poverty rate estimated to have resulted from the EITC Policy in 2021 and TCJA CTC Only. An additional 1.3 million children (i.e., 2.132 million minus 864,000) are estimated to have been removed from poverty as a result. The total impact of all three programs combined is estimated to have constituted a large, 2.9 percentage point (51%) reduction in the child poverty rate, removing over 2 million children from poverty.
Conclusion 8-1: Estimates that ignore employment effects show that the Earned Income Tax Credit (EITC) Policy in 2021 alone reduced the child poverty rate in 2021 by 0.7 percentage points (equivalent to a 12% relative reduction), removing 631,000 children from poverty. The TCJA CTC Only, the version of the Child Tax Credit (CTC) in place prior to the changes introduced by the American Rescue Plan Act of 2021, reduced the child poverty rate by 0.6 percentage points (11% relative reduction), removing 485,000 children from poverty. The effect of the combined policies in place in 2021—the Combined EITC & CTC Policies in 2021—reduced the 2021 child poverty rate by 2.9 percentage points (51% relative reduction), removing 2.1 million children from poverty.
The Census Bureau estimates of the 2021 child poverty rate differ from those presented in this report. One notable difference is that this report estimates the 2021 child poverty rate to be 2.8%, while the Census Bureau estimates it to be 5.2% (Creamer et al., 2022). The methodology for computing poverty rates in TRIM3 differs from the Census Bureau’s methods in several ways (see Appendix H). While many are minor, one important difference is that TRIM3 adjusts for underreporting of transfer and social insurance program participation and benefits in the CPS ASEC, as discussed in Chapter 3. As repeatedly documented in the research literature, those program participation and benefit amounts are significantly underreported in the CPS ASEC.19 TRIM3 adjusts for these undercounts while the Census
___________________
18This result implies that each credit individually increased the incomes of many families below the poverty line, but not enough to actually cross the line, with the addition of the second credit moving just as many additional families over the line.
19See Chapter 3 for the history of research on this topic and a discussion of how underreporting might have worsened over time and could have been particularly large during the pandemic.
Bureau does not. The most important undercounts are for the Unemployment Insurance and Supplemental Nutrition Assistance Program (SNAP), and those participation and benefits figures are adjusted upward the most by TRIM3. Adjustments are made for other programs as well, including Supplemental Security Income, Temporary Assistance for Needy Families, the Special Supplemental Nutrition Program for Women, Infants, and Children (WIC), and the Low Income Home Energy Assistance Program (LIHEAP).20
The committee estimated poverty rates and the impacts of the EITC and CTC on child poverty using Census Bureau methodology, as shown in Figure 8-5 and Figure 8-6, with Figure 8-5 showing the levels of poverty for the different programs and Figure 8-6 showing the differences in the poverty rates (i.e., effects on the poverty rate) for the different programs relative to having no EITC or CTC. Again, the figures show results for the
NOTE: CTC = Child Tax Credit, EITC = Earned Income Tax Credit, TCJA = Tax Cuts Job Act.
SOURCE: Estimates from TRIM3 commissioned by the committee.
___________________
20A few other minor adjustments in the TRIM3 approximate certain amounts in the household resources that are smaller than those used by the Census Bureau, resulting in downward adjustments of resources but only a 0.2 percentage point increase in the poverty rate. See Appendix H for details.
NOTE: CTC = Child Tax Credit, EITC = Earned Income Tax Credit, TCJA = Tax Cuts Job Act.
SOURCE: Estimates from TRIM3 commissioned by the committee.
EITC Policy in 2021, the TCJA CTC Only, the combination of both of those programs—EITC Policy in 2021 + the TCJA CTC Only, and the Combined EITC & CTC Policies in 2021. Using Census Bureau methods, reductions in the child poverty rate from introducing the EITC Policy in 2021 + TCJA CTC Only, both alone and in combination, are larger in absolute and percentage terms because Census Bureau methodology presumes far more children in poverty from the start. However, using Census Bureau methodology, introducing the EITC and all components of the CTC, including the ARPA CTC Expansion, results in almost the same percent reduction in poverty as shown in the committee’s estimates: 51% (committee’s estimate; Figure 8-4) and 55% (Census Bureau estimate; Figure 8-6). The percent impact is similar between the two estimates, even though the estimated level of poverty and the numbers of children removed from poverty differ.
Conclusion 8-2: Compared to impacts calculated using U.S. Census Bureau methodology, the model used by this committee (Transfer Income Model version 3) generated smaller absolute impacts but similar percent effects of the Earned Income Tax Credit and Child Tax Credit policies in 2021. The difference primarily reflects underreporting of transfer program participation and benefits, which significantly affect estimates
of child poverty. The committee’s estimates adjust for this underreporting while Census Bureau methodology does not. The committee’s baseline child poverty rate (2.8%) is much lower than that reported by the Census Bureau (5.2%). Both estimates ignore employment effects, the effects of other major pandemic programs, and year of credit receipt.
Impacts After Adjusting for Employment Effects
As noted in Chapter 7, the EITC and CTC alter incentives to work. Briefly summarizing the discussion in that chapter, the focus of past research has been on the decision to work at least some amount versus not working at all, because existing evidence suggests that this is the decision that appears to be the most likely to respond to changing incentives. Both the EITC Policy in 2021 and the TCJA CTC Only policy provide incentives to work at least some amount because they provide no credits for households that have no labor earnings. When considered relative to the TCJA CTC Only, the ARPA CTC Expansion, because it provides a credit for households with no labor earnings, reduces the incentive to work. Studies have shown that some fraction of individuals respond to these incentives. The committee reviewed existing evidence and calculated a range of possible employment responses to the EITC and CTC based on this evidence (see Chapter 7 and Appendix F). While the baseline estimates provided in the previous section assume no employment response, existing evidence suggests that a greater poverty rate reduction would be estimated when introducing the EITC Policy in 2021 and the TCJA CTC Only, and a smaller reduction in the poverty rate for the ARPA CTC Expansion, compared to those baseline estimates.
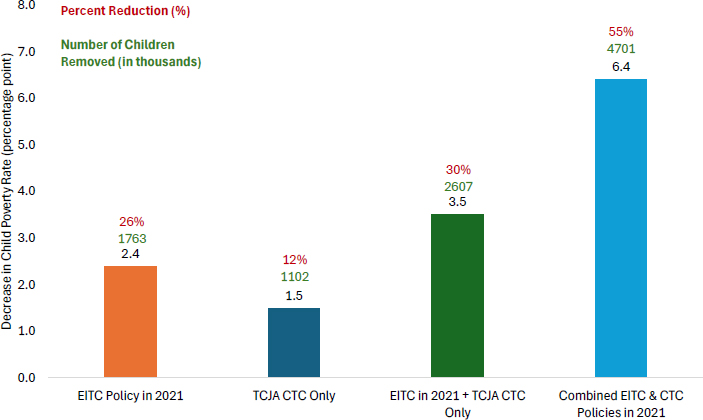
Figure 8-7 shows the results of the committee’s calculations adjusting for estimated employment effects using the low, medium, and high adjustments discussed in Chapter 7.21 Using the lowest employment effect values the committee estimated from the research literature, results show that the poverty rate would have fallen by 1.0 percentage point if the EITC Policy in 2021 had been introduced by itself (a 17% reduction compared to the 12% reduction shown in Figure 8-4, when employment responses are ignored), a 0.8 percentage point reduction had the TCJA CTC Only been introduced by itself (a 14% reduction compared to the 11% reduction when employment responses are ignored), and a 1.5 percentage point reduction if the EITC Policy in 2021 + TCJA CTC Only policies had been introduced (a 25% reduction compared to a 21% reduction when employment responses are ignored). With employment responses at this level, 717,000 children
___________________
21Because, as discussed in Chapter 7, the policies under ARPA were only implemented in 2021 and were presumed to be viewed as temporary, the elasticities reported in Panel A of Table 7-1 are used to account for employment effects in this chapter.
NOTE: CTC = Child Tax Credit, EITC = Earned Income Tax Credit, TCJA = Tax Cuts Job Act.
SOURCE: Estimates from TRIM3 commissioned by the committee.
would have been removed from poverty due to the EITC Policy in 2021 (vs. 531,000 in the no-employment-response scenario), and 611,000 children due to the TCJA CTC Only (vs. 465,000 children in the no-employment-response scenario). The greater poverty rate reductions arise because both the EITC Policy in 2021 and the TCJA CTC Only would each increase employment, which lowers poverty rates.
Close examination of Figure 8-7 shows that, again using the committee’s low estimate to account for employment effects, the provisions of the ARPA CTC Expansion when added to those under the EITC Policy in 2021 + TCJA CTC Only would reduce the child poverty rate by 1.6 percentage points (3.1 minus 1.5), compared to an additional 1.7 percentage points, ignoring employment responses (4.5 minus 2.8 in Figure 8-3). The smaller reduction arises from the estimated work disincentives of the ARPA CTC Expansion. The number of children removed from poverty is also lower when employment effects are considered. However, the positive employment effects from the Combined EITC & CTC Policies in 2021 outweigh the negative employment effects associated with the ARPA CTC Expansion. Thus, the reduction in poverty arising from the introduction of all three programs together is greater when employment effects are accounted for: the reduction in the child poverty rate is 3.1 percentage points instead of 2.9, and the number of children removed from poverty is 2.2 million rather than 2.1 million (Figure 8-4 vs. Figure 8-7).22
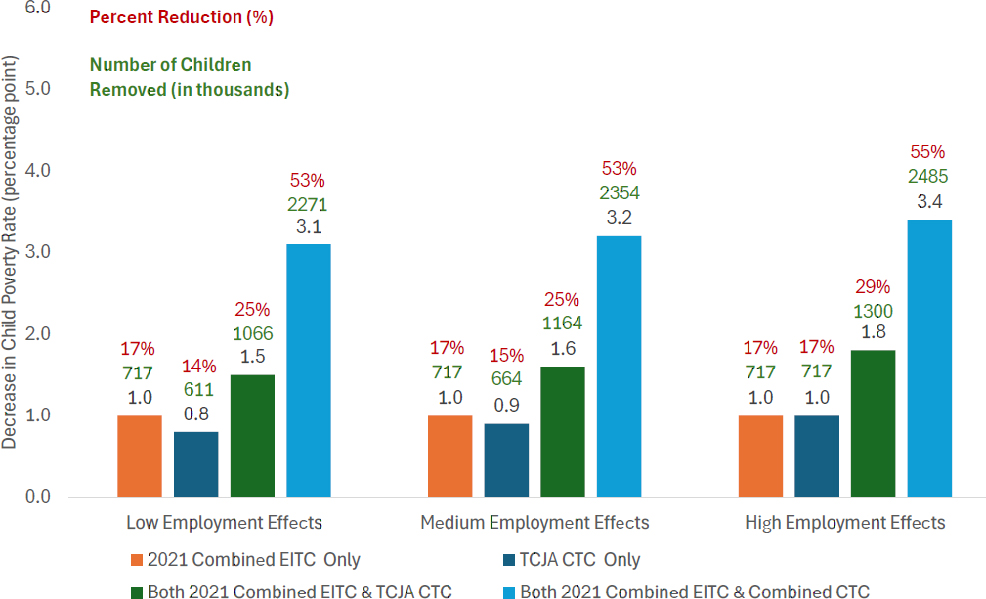
When using the assumed medium and high employment effects, all of the differences in the directions of effect are amplified except for the effects of introducing the EITC Policy in 2021 alone.23 Poverty rate reductions and the number of children removed from poverty are greater when the EITC Policy in 2021 and TCJA CTC Only are simultaneously introduced, and the incremental effect of adding the ARPA CTC Expansion on top of those two credits is slightly smaller. However, once again, the net effect of introducing all three programs together is to reduce the child poverty rate more than when estimated employment effects are ignored—for the high employment effects case, the child poverty rate is reduced by 3.4 percentage points instead of 2.9, which translates to an additional approximately 350,000 children removed from poverty (Figures 8-4 and Figure 8-7).
___________________
22As discussed in Chapter 7, the employment disincentives from the ARPA CTC Expansion are modest given the temporary nature of this policy change, which is why these adjustments have a fairly small impact on 2021 poverty estimates.
23For this case, even the medium and high employment effects were not very different than those for the low employment effects. See Chapter 7.
Conclusion 8-3: Using the committee’s preferred estimates, which adjust for employment effects, the Earned Income Tax Credit (EITC) and Child Tax Credit (CTC) policies in 2021 reduced the 2021 U.S. child poverty rate by large amounts. On top of other COVID-19 pandemic-related programs enacted in 2021:
- The EITC Policy in 2021 alone reduced the child poverty rate by one full percentage point, lifting an estimated 717,000 children from poverty—a 17% reduction.
- The version of the CTC in effect prior to the American Rescue Plan Act of 2021 (TCJA CTC Only) reduced the child poverty rate by between 0.8 and 1.0 percentage points, lifting an estimated 611,000 to 748,000 children out of poverty—a 14% to 17% reduction.
- The combination of the EITC Policy in 2021 + TCJA CTC Only reduced the child poverty rate by 1.5 to 1.8 percentage points, lifting over 1 million children from poverty—a 25% to 29% reduction.
- Added on top of the EITC Policy in 2021 + TCJA CTC Only, the ARPA CTC Expansion reduced the child poverty rate by 1.6 additional percentage points, lifting 1.1 to 1.2 million additional children out of poverty, with an additional percent impact of 26% to 27%.
- Taken together, the Combined EITC & CTC Policies in 2021 reduced the child poverty rate by between 3.1 and 3.4 percentage points, removing 2.2 to 2.5 million children from poverty—a 53% to 55% reduction.
Impacts When Other Pandemic Programs Are Excluded
The committee’s statement of task requested an estimate of the effects on child poverty of the EITC and CTC policies that were put in place in 2021, but did not specify whether to take into account the many other transfer programs and social insurance programs expanded during the pandemic, many of which shared the goal of providing assistance to families disadvantaged by the recession. The committee’s estimates of the antipoverty impacts of the EITC Policy in 2021 and CTC Policy in 2021 are calculated after other pandemic programs have already been accounted for. However, those programs had already removed millions of children from poverty, leaving less scope for reducing poverty than would have occurred without those programs. It is reasonable to consider an alternative baseline to examine the impacts of the EITC and CTC—one that assumes those other pandemic programs were not in place. Both approaches are of policy
interest. This section presents estimates of the 2021 EITC and 2021 CTC’s effects on child poverty in 2021 after removing income families received from major pandemic programs.24
TRIM3 has limitations regarding which pandemic programs can be removed from household resources before applying the EITC and CTC, but most major programs can be captured. TRIM3 captures the pandemic Unemployment Insurance expansions of both benefits and eligibility (Federal Pandemic Unemployment Compensation, Pandemic Unemployment Assistance, and Pandemic Emergency Unemployment Compensation), the Economic Impact Payments, SNAP emergency allotments, the expanded Child and Dependent Care Tax Credit, and expansions to WIC, LIHEAP, and Temporary Assistance to Needy Families.25 For the calculations in this section, the benefits from these pandemic programs were subtracted from family incomes. A few pandemic programs are not represented, including portions of pandemic Electronic Benefit Transfer benefits, Emergency Rental Assistance Program payments, and emergency child care funding, as well as some other programs that may have affected housing and employment. Also, TRIM3, like most similar models including those used by the Census Bureau, cannot capture the impacts of changes to health insurance policies like Medicaid and Affordable Care Act premium tax credits, given that the value of public health insurance programs are not directly captured in the SPM.26
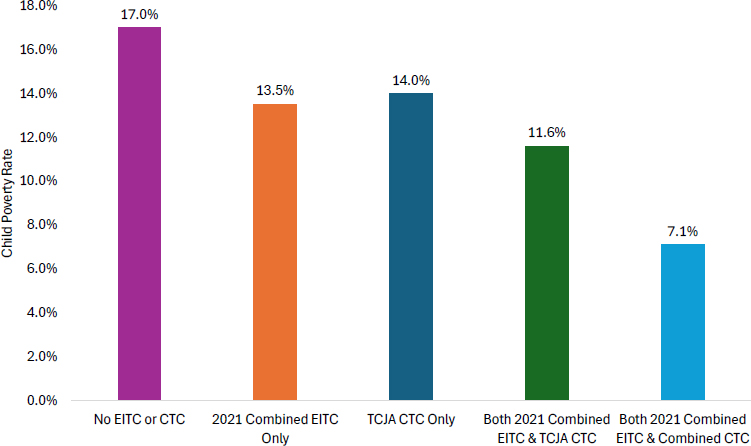
Figure 8-8 shows the estimated levels of the child poverty rate with and without the EITC and CTC, and Figure 8-9 shows the impact on child poverty of introducing those programs, both after excluding the other major pandemic programs. Compared to the committee’s baseline results in Figure 8-3, which include resources from other pandemic programs, poverty rates without those resources are considerably higher. This is to be expected, as those other programs had a large impact on the initial child poverty rate, lowering it by over 11 percentage points in the absence of the EITC and CTC (17.0 [from Figure 8-8] minus 5.7 [from Figure 8-3] = 11.3). At these higher rates, the EITC in 2021 + TCJA CTC Only lowers the poverty rate by much more than seen in the committee’s baseline calculations, both in absolute terms and percent terms. The EITC Policy in 2021 + TCJA CTC Only would have reduced the child poverty rate by 3.5 and 3.0 percentage
___________________
24Employment effects are ignored for these and the rest of the results reported in this chapter.
25TRIM3 broadly captures SNAP recertification and reporting requirements but does not capture state-specific waivers during the pandemic.
26The SPM captures the impact of health insurance by deducting medical out-of-pocket expenses from income but does not represent the need for health insurance in the threshold and does not directly represent health insurance transfer programs and subsidies. Note that the Medicaid caseload grew substantially during the pandemic, and this is also not captured.
NOTE: CTC = Child Tax Credit, EITC = Earned Income Tax Credit, TCJA = Tax Cuts Job Act.
SOURCE: Estimates from TRIM3 commissioned by the committee.
points, respectively, if the other pandemic programs had not already removed some children from poverty, compared to 0.7 and 0.6 percentage points when resources from these other pandemic programs were included in household resources (Figure 8-3). Percent reductions would have been 21% and 18%, respectively, instead of 12% and 11%. Using this starting point and adding all three resources—the Combined EITC & CTC Policies in 2021—the resulting 58% reduction is only slightly greater than that in the baseline calculations (51%). However, the absolute number of children removed from poverty by both credits is much greater when assuming the other pandemic programs had not been in place—over 7 million children would have been removed from poverty (Figure 8-9) instead of slightly over 2 million (Figure 8-4).
Conclusion 8-4: Other COVID-19 pandemic programs, including new and expanded benefits such as those in the Unemployment Insurance Program, Economic Impact Payments, and many others, reduced the child poverty rate and removed millions of children from poverty. In the absence of those other programs, and not considering employment effects, the 2021 Earned Income Tax Credit and 2021 Child Tax Credit,
NOTE: CTC = Child Tax Credit, EITC = Earned Income Tax Credit, TCJA = Tax Cuts Job Act.
SOURCE: Estimates from TRIM3 commissioned by the committee.
including its American Rescue Plan Act expansions, would have had larger effects on poverty, removing 7 million children from poverty instead of the 2 million removed after the impact of the other pandemic programs, thereby lifting 3 or 4 times more children from poverty.
Impacts on Deep and Near Poverty Rates
The average poverty line used in the SPM for a family of four in 2021 was $27,740. The poverty line is chosen by a method originally suggested in a National Research Council report (1995) but requires a subjective assessment of the basic needs necessary to allow a household to escape poverty as well as the income needed to afford those basic needs. Thus, examining poverty rates using thresholds above and below the SPM poverty threshold allows a determination of whether the antipoverty effects of the EITC and CTC depend on exactly where the poverty line is drawn, and if there are differential effects of the EITC and CTC policies in 2021 on households with somewhat higher or lower incomes.
NOTE: CTC = Child Tax Credit, EITC = Earned Income Tax Credit, TCJA = Tax Cuts Job Act.
SOURCE: Estimates from TRIM3 commissioned by the committee.
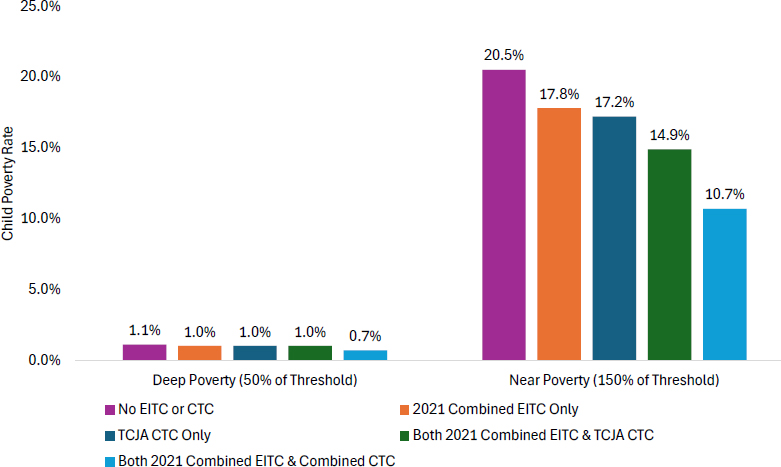
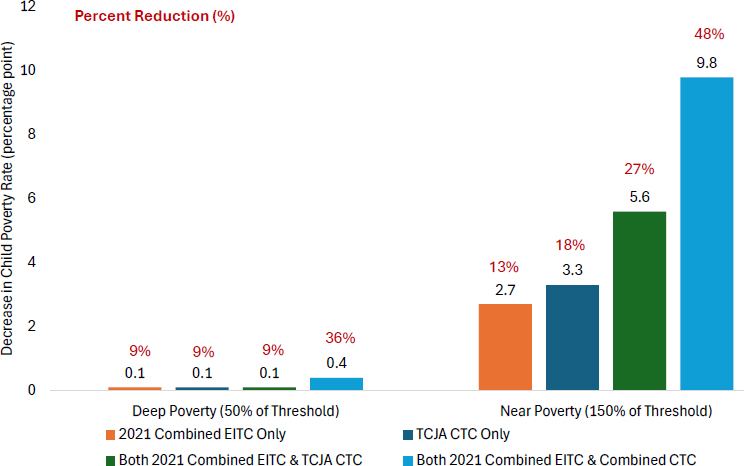
Similar to Figures 8-3 and 8-4, respectively, Figure 8-10 shows the levels of deep poverty and near poverty for the different EITC and CTC programs, while Figure 8-11 shows the impact of introducing each of the programs relative to having no EITC or CTC in 2021. (Both figures now assume the other pandemic programs were already in place.)27 The committee’s estimate of the deep poverty rate for children in 2021 is 0.7%. This is considerably lower than the Census Bureau estimate (1.4%; Creamer et al., 2022), again showing the substantial impact of accounting for underreporting of transfers. In the absence of either the EITC or CTC, this rate is estimated to be only 1.1%, which is quite low but still constitutes almost 800,000 children living in families with extremely low incomes (e.g., less than $13,870 for a family of four). These families frequently have little earned income and hence benefit minimally from the EITC, and such
___________________
27As noted previously, deep poverty is defined as having income less than 50% of the poverty threshold and near poverty is defined as having income less than 150% of the poverty threshold. Some studies define near poverty as those with incomes between 100% and 150% of the poverty line. Near poverty is defined here to include those families as well as those with incomes below 100% of the poverty line.
NOTE: CTC = Child Tax Credit, EITC = Earned Income Tax Credit, TCJA = Tax Cuts Job Act.
SOURCE: Estimates from TRIM3 commissioned by the committee.
families benefit little from the TCJA CTC as well. Consequently, the impacts of these programs on deep poverty rates for children are quite small, reducing poverty by only 0.1 percentage point or 9% (Figure 8-11). However, the Combined EITC & CTC Policies in 2021, which offers much larger credits to low-income families, leads to a greater total impact, with deep poverty falling by 0.4 percentage points or 36%, lifting more than 300,000 children out of deep poverty.
Near poverty rates are, by definition, higher than normal using the initial poverty line, given its higher level of 1.5 times the initial poverty line (e.g., averaging $41,160 for a family of four). The near poverty rate of 10.7% is almost four times the 2.8% normal poverty rate in Figure 8-3 because of the correspondingly larger number of families in that income range (see Figure 8-1). The reductions in the near poverty rate from introducing the EITC in 2021 + TCJA CTC Only are estimated to be 2.7 and 3.3 percentage points, respectively, which are slightly larger reductions in percent terms than those reported in Figure 8-4 (13% and 18% for Figure 8-11 compared with 12% and 11% for Figure 8-4), reflecting the large number of recipients of those credits whose income in the absence of the credits is in the 100% to 150% range (see Figure 8-1). Introducing the ARPA CTC
Expansion—the Combined CTC & EITC Policies in 2021—further reduces the near poverty rate by 4.2 percentage points (i.e., 9.8 minus 5.6), lifting more than 3 million additional children out of near poverty (see Appendix G). Children in families with incomes above the normal poverty line but below the near poverty threshold (i.e., in the approximate range from $27,000 to $41,000 for a family of four) typically have sufficiently high employment rates and enough earnings to receive significant EITC and CTC benefits, resulting in large improvements in their incomes and reductions in near poverty status.
Conclusion 8-5: Based on the committee’s estimates, less than 1% of children lived in families in deep poverty in 2021, with incomes less than half the poverty line. Given the low incomes of families in deep poverty, the Earned Income Tax Credit (EITC) Policy in 2021 and the version of the Child Tax Credit (CTC) in place prior to the American Rescue Plan Act of 2021 (ARPA) (the TCJA CTC) provided little support and thus made very little impact on deep child poverty. However, the ARPA CTC Expansion, which provided more support to children in very low-income families, removed an additional 240,000 children from deep poverty. Taken together, the Combined EITC & CTC Policies in 2021 removed about 308,000 children from deep poverty. This constitutes a 0.4 percentage point reduction in the child deep poverty rate, cutting this rate by more than one-third.
Conclusion 8-6: Based on the committee’s estimates, the Combined Earned Income Tax Credit (EITC) & Child Tax Credit (CTC) Policies in 2021 removed over 7 million children from near poverty in 2021, defined as the fraction of children living in families with incomes below 150% of the poverty line. The large number of children removed from near poverty reflects the large number of children living in working families with modest incomes but enough earnings to receive relatively large benefits through the EITC and CTC.
Impacts by Year of Credit Receipt
As previously noted, the work of both the Census Bureau and this committee assigns EITC and CTC benefits to the year of accrual rather than the year of receipt.28 This is important because using the year of accrual means that, in practice, some of those resources were unavailable to families in the year they were distributed. Calculations were performed to assess the effects of the EITC and CTC on the poverty rate using the year of receipt.
___________________
28See Meyer et al. (2024) for another discussion of the issue.
NOTE: CTC = Child Tax Credit, EITC = Earned Income Tax Credit, TCJA = Tax Cuts Job Act.
SOURCE: Estimates from TRIM3 commissioned by the committee.
NOTE: CTC = Child Tax Credit, EITC = Earned Income Tax Credit, TCJA = Tax Cuts Job Act.
SOURCE: Estimates from TRIM3 commissioned by the committee.
For the EITC Policy in 2021 + TCJA CTC Only, credits estimated to have been received in spring 2022 (based on 2021 income) were eliminated from 2021 family income. 2020 income was then estimated (using 2021 income as a proxy) and the permanent EITC and TCJA CTC rules were applied to that income to obtain an estimate of tax year 2020 credits received in calendar year 2021 (i.e., upon tax filing, primarily in spring 2021). For the ARPA CTC Expansion, rules stipulated that one-half of the credit could be received in 2021, so 50% of the credit amount was assigned to 2021, with the remaining 50% assumed to be received in 2022.
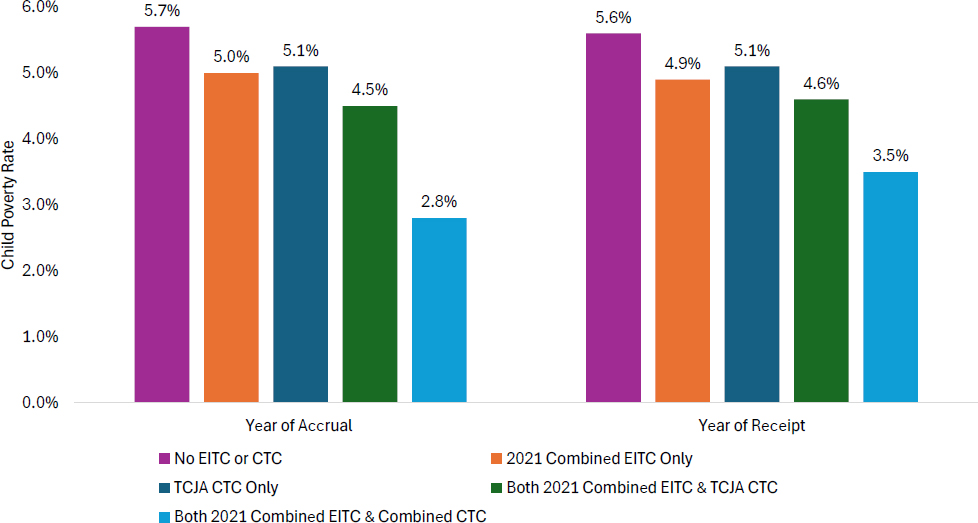
Results are shown in Figure 8-12 and Figure 8-13, with the first figure showing the level of child poverty with and without the EITC and CTC programs and the second showing the impact of those programs on child poverty. In both figures, the bars on the left repeat the results from Figures 8-3 and 8-4 with effects based on year of accrual, while the bars on the right show estimated effects based on year of receipt. The effect of introducing the EITC Policy in 2021 is almost identical in both cases, because the spring 2021 credit receipt is estimated to be approximately equal to that received in spring 2022 on the basis of 2021 income—which was used in the accrual calculation (12% reduction in child poverty in the accrual case, 13% in the receipt case) and because the EITC excluding ARPA and EITC Policy in 2021 were almost identical for families with children. The impact of adding the TCJA CTC Only is also estimated to be similar regardless of which basis is used (11% vs. 9%), but the impact of adding the ARPA CTC Expansion results in a cumulative poverty reduction of only 2.1 percentage points (38% in relative terms) based on year of receipt compared to the 2.9 percentage point reduction (51% in relative terms) on an accrual basis. This is because one-half of the ARPA CTC Expansion’s effect on poverty is estimated to have occurred in 2022 instead of 2021.29 This also implies that estimated child poverty rates for calendar year 2022 are overestimated if those estimates assign credits using the typical accrual basis employed by the Census Bureau and others. In effect, the antipoverty impact of the ARPA
___________________
29There is a slightly different base for the 38% and 51% figures, as seen by the difference in the poverty rates in the baseline and year-of-receipt poverty rates in the absence of the EITC and CTC. The year-of-receipt exercise considered the absence of the non-ARPA EITC + TCJA CTC Only, and hence the absence of credits received in spring 2021, whereas the baseline exercise considered the absence of 2021 accrued credits.
CTC Expansion was spread over two years instead of being concentrated in only one.30
Conclusion 8-7: All estimates thus far assign Earned Income Tax Credits and Child Tax Credits based on their accrual dates. This means that credits based on 2021 income are added to family income in 2021, even if some of those credits are received by families when they file federal taxes in spring 2022. Poverty reductions estimated by adding to family incomes only credits estimated to be received in 2021 are much smaller than reductions estimated using accrual as the basis for assignment, but additional reductions in child poverty would also occur in 2022.
Impacts by Distribution of Estimated Fiscal Outlays
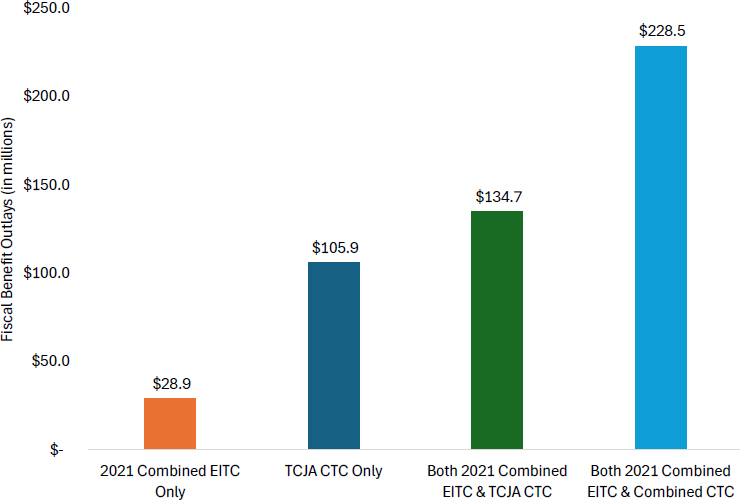
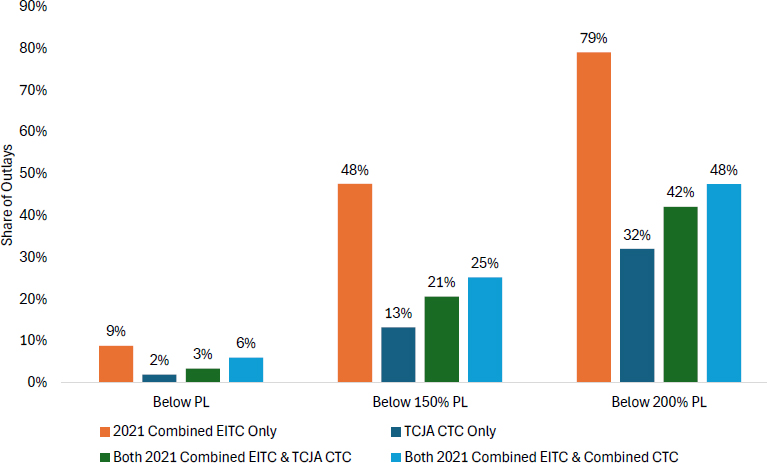
Figure 8-14 shows estimated additional fiscal outlays from introducing the EITC Policy in 2021 and CTC Policy in 2021, including only the EITC and CTC benefit payments and not administrative costs.31 Figure 8-15 shows outlays by pre-credit poverty stratum. The incremental benefit outlay for both programs in 2021 is estimated in TRIM3 to have been about $228 billion. Of that expenditure, only about 6% is estimated to have gone to children who would have been in families with incomes below the poverty line if both credits had not been in place, but 94% went to children who would have been in families already above the poverty line without those credits. These figures reflect the distribution of EITC and CTC benefits across the income distribution, as discussed above and shown in Figures 8-1 and 8-2—illustrating the larger rates of receipt and generally higher credit amounts for those above the poverty line pre-credit. However, while the percent of outlays estimated to go to children in families with pre-credit incomes below the poverty line is small, it nevertheless corresponds to an absolute dollar amount of almost $14 billion spent on those children, removing over 2 million from poverty.
___________________
30Note that, for periods when the economy is approximately steady, when incomes are consequently approximately steady, and when tax credit rules do not change, little difference is likely to exist between credits received on an accrual basis and on a receipt basis, since credits received in the spring of a given year will be approximately the same as those received in the spring of the following year. This will apply in Chapter 9, when poverty impacts are estimated for a fixed economy and a fixed set of credit rules.
31Fiscal benefit outlays are the estimated total cost of the tax credits paid to eligible families. Note that these estimated outlays are tabulated from TRIM3 which, compared to administrative totals, does not fully capture all resources from tax credits/liabilities the way it does for transfer program totals. Thus, resources from tax credits, especially the EITC, are lower using TRIM3 than the actual total outlays reported in IRS data.
NOTE: CTC = Child Tax Credit, EITC = Earned Income Tax Credit, TCJA = Tax Cuts Job Act.
SOURCE: Estimates from TRIM3 commissioned by the committee.
The percent of total fiscal outlays going to children below the poverty line differs from program to program and based on where the poverty line is drawn. More of the outlays from the EITC Policy in 2021 alone go to children who would have been in poverty in the absence of the EITC and CTC compared to the TCJA CTC alone (9% vs. 2% in the “Below PL” Panel in Figure 8-15); and the outlays going to children in poverty that are added by the ARPA CTC Expansion ($228.5 million minus $134.7 million, or $93.8 million in Figure 8-14) is 70% of the outlay they would have received from the EITC Policy in 2021 + TCJA CTC Only ($134.7 million). In addition, if the poverty line is drawn 50% higher and children in near poverty are considered, about a quarter of outlays went to children in poverty or near poverty; and if children in families below 200% of the poverty line are considered, about half of the outlays went to children in families with incomes below that threshold (see the “Below 150% PL” and “Below 200% PL” panels in Figure 8-15).
NOTE: CTC = Child Tax Credit, EITC = Earned Income Tax Credit, TCJA = Tax Cuts Job Act.
SOURCE: Estimates from TRIM3 commissioned by the committee.
In terms of the key results with respect to fiscal outlays in 2021:
- Only about 6% of the fiscal outlays for the EITC and CTC policies in 2021 are estimated to have gone to children who would have been in families with incomes below the poverty line if both credits had not been in place, with the remaining going to children who would have been in families already above the poverty line without those credits.
- A much larger share of the fiscal outlays for the EITC Policy in 2021 (9%) went to children in poverty than was the case for the outlays associated with the TCJA component of the CTC in 2021.
- However, the fiscal outlays estimated by TRIM3 do not capture all resources from tax credits/liabilities reported in IRS data. This underestimation is especially true for fiscal outlays associated with the EITC.
Impacts on Subgroups with Different Family Characteristics
Estimates of the effects of the Combined EITC & CTC Policies in 2021 on child poverty rates were calculated for children in families with different characteristics, with a focus on family composition and size, parents’ socioeconomic characteristics, place of residence, race/ethnicity, nativity, and citizen status of children and parents.
Family Composition
Table 8-1 shows the antipoverty impacts of the EITC and CTC for children living in families of various types and compositions.32
- Family type—Children living in families with cohabiting parents or with a single parent have higher pre-credit poverty rates (about 10%) than children living with married parents (4%).33 The first two groups are also generally estimated to have the highest reductions in poverty, in percentage point terms, due to the introduction of the EITC Policy in 2021 + TCJA CTC Only. When the ARPA CTC Expansion is added, child poverty rates decrease by an estimated total of about 6 percentage points for children in single-parent families, 4 percentage points for children in cohabiting-parent families, and 2 percentage points for children in married-parent families.
- Number of children—Children living in one-child families have the highest pre-credit poverty rates (about 7%), followed closely by children living in families with three or more children (6% rate). Children living in two-child families have a pre-credit poverty rate of almost 5%. The group estimated to experience the largest reduction in poverty from Combined CTC & EITC Policies in 2021 includes children living in families with three or more children—their poverty rate decreases by almost 4 percentage points.
- Age of children—No large differences were identified in pre-credit poverty rates between children living in families with at least one child younger than age 6 and other families with children—each
___________________
32Estimates are without employment effects, as noted in the footnote to Table 8-1. Also, all numbers cited in the text are rounded from the numbers shown in the underlying tables, which are shown in Appendix F.
33Differences across these groups, and across most groups in these subgroup tables, could result from differences in income, employment, or other characteristics. Underlying reasons for the differences are not determined. Note also that the sample sizes for some groups are relatively small and hence may have high standard errors. Tests of significance of differences were not conducted.
| No EITC or CTC | EITC Policy in 2021 | TCJA CTC Only | EITC in 2021 + TCJA CTC Only | Combined EITC & CTC Policies in 2021 | |
|---|---|---|---|---|---|
| Family Composition | |||||
| Married Parents | 3.8% | 3.2% | 3.1% | 2.8% | 1.9% |
| 0.6 | 0.7 | 1.1 | 1.9 | ||
| Cohabiting Parents | 9.8% | 8.7% | 9.1% | 8.3% | 6.0% |
| 1.1 | 0.8 | 1.5 | 3.8 | ||
| Single Parent | 9.9% | 8.7% | 9.2% | 8.3% | 4.2% |
| 1.1 | 0.6 | 1.6 | 5.6 | ||
| Number of Children in Family | |||||
| One | 6.5% | 5.8% | 6.1% | 5.5% | 4.5% |
| 0.7 | 0.4 | 1.0 | 2.0 | ||
| Two | 4.9% | 4.2% | 4.3% | 3.7% | 2.5% |
| 0.8 | 0.6 | 1.2 | 2.4 | ||
| Three+ | 6.0% | 5.3% | 5.2% | 4.7% | 2.1% |
| 0.7 | 0.8 | 1.2 | 3.9 | ||
| Age of Children Present | |||||
| <6 | 6.0% | 5.1% | 5.2% | 4.6% | 2.8% |
| 0.8 | 0.7 | 1.4 | 3.2 | ||
| 6 to 17 | 5.6% | 4.9% | 5.0% | 4.5% | 2.8% |
| 0.7 | 0.6 | 1.1 | 2.8 | ||
NOTES: Percentage point change shown in italics. Estimates do not include employment effects. “Family” refers to the SPM unit. CTC = Child Tax Credit, EITC = Earned Income Tax Credit, TCJA = Tax Cuts and Job Act.
SOURCE: Estimates from TRIM3 commissioned by the committee.
- group had an approximate 6% pre-credit poverty rate. Both groups also had similar reductions in their poverty rates (about 3 percentage points) from the Combined EITC & CTC Policies in 2021, although the reductions are somewhat greater for families with a child younger than 6, as expected from their higher credit amounts from the ARPA CTC Expansion.
Conclusion 8-8: In the absence of both the Earned Income Tax Credit (EITC) and Child Tax Credit (CTC) in 2021, children in single-parent and cohabiting-parent families would have had the highest poverty rates (9.9%) of the various family types estimated, and those in single-parent
families also have the largest reduction (6 percentage points) in child poverty from the effects of the Combined EITC & CTC Policies in 2021. Poverty rates for families with three or more children declined the most from these policies in 2021. Differences in the ages of children are of relatively little consequence for pre-credit and post-credit child poverty rates.
Socioeconomic Characteristics
Table 8-2 shows the antipoverty impacts of the EITC and CTC on groups of children by various family socioeconomic characteristics.
- Educational attainment of family head—Pre-credit child poverty rates are higher the lower the level of the family’s parental education—over 18% for families in which the parent has less than a high school education, 8% for families in which the parent completed high school, almost 4% for families in which the parent has some years of college, and only 2% for families in which the parent completed college.34 The largest reduction in child poverty from introducing the Combined EITC & CTC Policies in 2021 is seen for families in which the parent has less than a high school education—the child poverty rate for these families is estimated to drop from 18% to about 10%.
- Adult employment—Children living in families with no adult workers have a very high pre-credit poverty rate (almost 35%), triple the rate of children in families with part-time, part-year workers but no full-time, full-year workers (12%). Children in families with at least one full-time, full-year worker have a pre-credit poverty rate of only about 3%. The largest impacts of the EITC in 2021 + TCJA Only policies, however, are on children with parents working part-time, part-year, for whom about a 3 percentage point reduction in poverty rate was estimated; compared to a 1 percentage point reduction for children with parents working full-time, full-year; and no antipoverty effect for children in families with no working adults. The greater antipoverty impact for parents working part-time, part-year results from the nature of the EITC Policy in 2021 + TCJA CTC Only schedules discussed in Chapter 2, which phase in as earnings grow to a certain maximum, then phase out as earnings grow further, so that part-time, part-year workers are more
___________________
34Measurement of educational attainment of the “parent” may be for one of two parents (i.e., the parent named as the reference person in the CPS ASEC), a single parent, or another family member named as the reference person.
- likely to receive the highest credits. The largest impact of adding the ARPA CTC Expansion is seen for children in families with no workers, for whom a reduction in poverty rate of 14 percentage points was estimated from the ARPA CTC Expansion alone. This result reflects the full refundability of the expanded CTC and its extension of that credit to families with no earnings.
- Receipt of other major safety net programs—Children living in families receiving benefits from at least one other major safety net program, such as SNAP, are estimated to have a pre-credit poverty rate of 11%, compared to 2% for children living in families receiving no safety net benefits. Children in families receiving safety net benefits are also estimated to have a reduction in their poverty rate of almost 6 percentage points from the Combined EITC & CTC Policies in 2021 compared with less than 1 percentage point for children in families not receiving safety net benefits.
- Presence of nonelderly disabled member—Children living in families with at least one nonelderly member with a disability are estimated to have a higher pre-credit poverty rate (11%) than other children (5%). They are also estimated to have the largest reduction in poverty rate from the Combined EITC & CTC Policies in 2021 (6 percentage points compared with 3 percentage points for children in other families). The percentage point reductions from the Combined EITC & CTC Policies in 2021 separately and together, however, are larger for children in families without a nonelderly member with a disability.
Conclusion 8-9: Without the 2021 Earned Income Tax Credit (EITC) and 2021 Child Tax Credit (CTC), estimated poverty rates are highest for children in families with no adult workers (35%) and families in which the family head has less than a high school education (18%). Children in families with part-time but not full-time workers, families receiving benefits from other safety net programs, and families with a nonelderly member with a disability have pre-credit poverty rates in the range of 11% to 12%. The estimated antipoverty effect of the Combined EITC & CTC Policies in 2021 is largest in percentage point terms for children in families with a parent or family head with less than a high school education (9 percentage points). The estimated antipoverty effect of the American Rescue Plan Act CTC Expansion alone is largest for children living in families with no adult workers (14 percentage point reduction from that program alone). Children in families with part-time but not full-time workers, families receiving benefits from other safety net programs, and families with a nonelderly member with a disability are estimated to have their poverty rates reduced by 6 percentage points.
TABLE 8-2 Estimated 2021 Child Poverty Rate Under the EITC and CTC by Family Socioeconomic Status
| No EITC or CTC | EITC Policy in 2021 | TCJA CTC Only | EITC in 2021 + TCJA CTC Only | Combined EITC & CTC Policies in 2021 | |
|---|---|---|---|---|---|
| Educational Attainment of Mother, Father, or Family Heada | |||||
| Less than High School | 18.4% | 16.5% | 17.1% | 15.1% | 9.5% |
| 1.9 | 1.3 | 3.2 | 8.8 | ||
| High School | 7.6% | 6.3% | 6.4% | 5.7% | 3.3% |
| 1.3 | 1.2 | 1.9 | 4.3 | ||
| Some College | 4.3% | 3.7% | 3.7% | 3.3% | 1.7% |
| 0.6 | 0.6 | 0.1 | 2.5 | ||
| College+ | 2.1% | 2.0% | 1.9% | 1.8% | 1.3% |
| 0.2 | 0.2 | 0.4 | 0.9 | ||
| Employment Status of Adults in the Familyb | |||||
| At least one full-time, full-year worker | 2.7% | 2.1% | 2.1% | 1.7% | 1.1% |
| 0.6 | 0.6 | 1 | 1.6 | ||
| No full-time, full-year workers but at least one part-time, part-year worker | 11.6% | 9.8% | 6.9% | 8.9% | 5.5% |
| 1.8 | 4.7 | 2.8 | 6.1 | ||
| No workers | 34.9% | 34.9% | 34.9% | 34.9% | 20.7% |
| 0 | 0 | 0 | 14.2 | ||
| Other Safety Net Receipt | |||||
| Yes | 10.7% | 9.3% | 9.6% | 8.5% | 4.9% |
| 1.4 | 1.1 | 2.1 | 5.7 | ||
| No | 1.7% | 1.5% | 1.4% | 1.3% | 1.1% |
| 0.2 | 0.3 | 0.4 | 0.6 | ||
| Family Has Nonelderly Member with Disabilityc | |||||
| Yes | 10.5% | 10.1% | 10.2% | 9.9% | 5.0% |
| 0.4% | 0.3% | 0.6% | 5.5 | ||
| No | 5.3% | 4.5% | 4.6% | 4.0% | 2.6% |
| 0.8 | 0.7 | 1.2 | 2.7 | ||
NOTES: Percentage point change shown in italics. Estimates do not include employment effects. “Yes” under Other Safety Net Receipt means at least one family member received Supplemental Nutrition Assistance Program, Medicaid, Children’s Health Insurance Program, Temporary Assistance for Needy Families, General Assistance, Supplemental Security Income, or public/subsidized housing. “Family” refers to the SPM unit. “Family head” refers to Supplemental Poverty Measure (SPM) reference person. CTC = Child Tax Credit, EITC = Earned Income Tax Credit, TCJA = Tax Cuts and Job Act.
a These rows reflect the characteristics of the child’s biological, adoptive, or stepmother (if present), else the biological, adoptive, or stepfather (if present). If neither the father nor mother is present, then the characteristics of the SPM unit head are used, unless the child is the unit head, spouse, or cohabiting partner, in which case, the child is excluded from these rows.
b These rows reflect the work status of persons aged 18 or older in the SPM poverty unit. “Full-year” is classified as 50 weeks or more, and “full-time” is classified as 35 hours per week or more. Children in units without adults (i.e., those aged 15 to 17 living without parents or caretakers) are included in the “no workers” row.
c A child is classified as being in an SPM poverty unit with a person with a disability if there is at least one person in the unit who is younger than 65 and is identified as disabled according to the definition used when determining SSI eligibility.
SOURCE: Estimates from TRIM3 commissioned by the committee.
Residence
Table 8-3 shows the antipoverty impacts of the EITC and CTC for children living in different areas. Children living in metropolitan areas have higher pre-credit poverty rates (6%) than children living outside metropolitan areas (4%). For both groups, the estimated antipoverty effects of introducing the Combined EITC & CTC Policies in 2021 are similar although slightly greater for those living in metropolitan areas (reduction of 3 percentage points versus about 2 percentage points for children living in nonmetropolitan areas). In terms of census division, pre-credit child poverty rates are highest in the West South Central states (8%), followed by the Middle Atlantic, South Atlantic, and Pacific states (pre-credit child poverty rates of 6% to 7%). Percentage point reductions from introducing the Combined EITC & CTC Policies in 2021 differ somewhat from one another, ranging from 1.6 to 3.7 points, and adding the ARPA CTC Expansion has a relatively large effect in the West South Central and Pacific states, reducing child poverty rates by 3 to 4 percentage points below their pre-credit levels.
Conclusion 8-10: Estimated pre-credit poverty rates are highest for children living in the West South Central states (8%), followed by the Middle Atlantic, South Atlantic, and Pacific states census regions and children living in metropolitan areas (rates of 6% to 7%). The Combined Earned Income Tax Credit & Child Tax Credit Policies in 2021 reduce estimated poverty the most for children living in West South Central and Pacific state census regions (reductions of 3 to 4 percentage points).
Appendix G, Tables G-1 to G-3, show poverty rate reductions for the groups discussed thus far in both percent terms and percentage point terms. In most cases, the percent reductions are largest for the same groups that have the greatest percentage point reductions. Most exceptions occur when the pre-credit poverty rate is very small, and the percentage point reduction is equally small but large in percent terms. For example, the poverty reduction for families headed by a person with a college degree is less than 1 percentage point (0.9), but because individuals in these families have a pre-credit poverty rate of just 2.1%, this level of poverty reduction still reduces the group’s poverty rate by nearly half. This large percent reduction is misleading given the small absolute poverty reduction.
The committee’s estimates of antipoverty reductions for different subgroups assume that all families file taxes and receive the EITC and CTC benefits they are eligible for. However, as reported in Chapter 4, evidence indicates that the take-up rate of tax credits among those eligible is often less than 100% and differs across groups. Families with heads who have lower levels of education had lower take-up rates of the EITC Policy in 2021 and TCJA CTC, for example, which could lead to overestimates of the antipoverty effects of the programs. Those with higher levels of earnings had higher take-up rates of the ARPA CTC Expansion. Married-couple families also typically have higher take-up rates than single-parent families.
Race and Ethnicity, Nativity, and Citizenship
Table 8-4 shows the antipoverty effects of the EITC and CTC by race and ethnicity, nativity, and citizenship status of children and parents.
- Race and ethnicity—Pre-credit child poverty rates are highest for Hispanic families (11%) followed by Black non-Hispanic families (7%), and lowest for White non-Hispanic families (2%). Children in Hispanic families also have the greatest percentage point reduction in poverty from the Combined EITC & CTC Policies in 2021 (almost 6 percentage point reduction), followed by children in Black non-Hispanic families (4 percentage point reduction).
- Child and parent nativity—Pre-credit child poverty rates are highest for families with a foreign-born child (21%), followed by families with a U.S.-born child and an immigrant parent (11%). These two groups of children have similar estimated percentage point reductions in poverty rates from the Combined EITC & CTC Policies in 2021 (about 5 percentage points).
- Child and parent citizenship status—Pre-credit child poverty rates are highest for noncitizen children in mixed-status families (i.e., families with both citizen and noncitizen members) with an
TABLE 8-3 Estimated 2021 Child Poverty Rate Under the EITC and CTC by Residential Location
| No EITC or CTC | EITC Policy in 2021 | TCJA CTC Only | EITC in 2021 + TCJA CTC Only | Combined EITC & CTC Policies in 2021 | |
|---|---|---|---|---|---|
| Metropolitan/Nonmetropolitan Residence | |||||
| Metropolitan | 6.0% | 5.2% | 5.3% | 4.7% | 2.9% |
| 0.8 | 0.7 | 1.3 | 3.0 | ||
| Nonmetropolitan | 3.9% | 3.5% | 3.6% | 3.3% | 1.9% |
| 0.4 | 0.2 | 0.6 | 2.0 | ||
| Division of Residence | |||||
| New England | 4.8% | 4.4% | 4.1% | 3.9% | 3.2% |
| 0.4 | 0.7 | 0.9 | 1.6 | ||
| Middle Atlantic | 6.0% | 5.3% | 5.1% | 4.8% | 2.9% |
| 0.7 | 0.8 | 1.2 | 3.1 | ||
| East North Central | 3.3% | 0.4% | 0.3% | 0.7% | 2.4% |
| 0.0 | 0.0 | 1.0 | 2.0 | ||
| West North Central | 3.1% | 2.8% | 2.9% | 2.7% | 1.5% |
| 0.3 | 0.2 | 0.4 | 1.6 | ||
| South Atlantic | 6.5% | 5.9% | 5.9% | 5.3% | 3.5% |
| 0.7 | 0.7 | 1.2 | 3.1 | ||
| East South Central | 4.9% | 4.1% | 4.3% | 4.0% | 2.1% |
| 0.8 | 0.6 | 0.9 | 2.8 | ||
| West South Central | 8.1% | 7.0% | 7.5% | 6.6% | 4.4% |
| 1.0 | 0.6 | 1.4 | 3.7 | ||
| Mountain | 4.8% | 4.3% | 4.5% | 4.1% | 2.6% |
| 0.6 | 0.3 | 0.8 | 2.3 | ||
| Pacific | 6.6% | 5.5% | 5.5% | 4.6% | 3.0% |
| 1.1 | 1.1 | 2 | 3.6 | ||
NOTES: Percentage point change shown in italics. Estimates do not include employment effects. CTC = Child Tax Credit, EITC = Earned Income Tax Credit, TCJA = Tax Cuts and Job Act.
SOURCE: Estimates from TRIM3 commissioned by the committee.
- undocumented family member (34%), followed by noncitizen children in mixed-status families and citizen children in mixed-status families with an undocumented family member (25% and 22%, respectively). Rates are also high for all children in mixed-status families and citizen children in mixed-status families (16% and 14%, respectively). The largest estimated percentage point reductions in child poverty from the Combined EITC & CTC Policies in 2021 are for citizen children in mixed-status families with an undocumented family member (9 percentage points), followed by all children and citizen children in mixed-status families (both about 7 percentage points).
Appendix G, Table G-4, shows reductions for these groups in percent terms, which usually aligns with reductions in percentage point terms—most exceptions occur when the pre-program poverty rate is very low or very high. For some racial/ethnic groups and some nativity/citizenship groups, percent reductions are largest for groups that do not have the largest percentage point reductions. For example, in percent terms, poverty reductions are larger for Black non-Hispanic children than for Hispanic children, because of the smaller pre-credit poverty rates of the former group. Take-up rates also vary by race and ethnicity, as reported in Chapter 4. Hispanic families have the lowest take-up rates for the Combined EITC & CTC Policies in 2021 relative to non-Hispanic White and non-Hispanic Black families. This could mean that the antipoverty effects for children in Hispanic families are overstated. Non-Hispanic Black families tend to have higher take-up rates than non-Hispanic White families.
Conclusion 8-11: Estimated pre-credit poverty rates are highest for noncitizen children in families with citizen and noncitizen members, including an undocumented immigrant (34%), followed by noncitizen children in families with citizen and noncitizen members (25%), all foreign-born children and citizen children in families with citizen and noncitizen members, including an undocumented immigrant (21% to 22%). Rates are also high for all children in families with citizen and noncitizen members (16%) and citizen children in families with citizen and noncitizen members (14%). Children in Hispanic families have an estimated pre-credit poverty rate of 11%. The largest percentage point reductions in child poverty from the Combined Earned Income Tax Credit & Child Tax Credit Policies in 2021 are for citizen children in mixed-status families with an undocumented family member (9 percentage points), followed by all children in mixed-status families and citizen children in mixed-status families (7 percentage points) and by children in Hispanic families (6 percentage points).
| No EITC or CTC | EITC Policy in 2021 | TCJA CTC Only | EITC in 2021 + TCJA CTC Only | Combined EITC & CTC Policies in 2021 | |
|---|---|---|---|---|---|
| Race/Ethnicity | |||||
| White non-Hispanic | 2.4% | 2.1% | 2.1% | 1.8% | 1.1% |
| 0.4 | 0.3 | 0.6 | 1.3 | ||
| Black non-Hispanic | 7.1% | 6.6% | 6.7% | 6.2% | 3.0% |
| 0.5 | 0.4 | 0.9 | 4.1 | ||
| Hispanic | 11.6% | 10.2% | 10.4% | 9.1% | 6.2% |
| 1.5 | 1.3 | 2.5 | 5.5 | ||
| Asian Pacific Islander (non-Hispanic) | 5.4% | 4.6% | 4.7% | 4.3% | 2.8% |
| 0.7 | 0.7 | 1.1 | 2.6 | ||
| Other (non-Hispanic)a | 4.0% | 3.1% | 3.2% | 3.1% | 1.5% |
| 0.8 | 0.7 | 0.8 | 2.5 | ||
| Child and Parent or Family Head Nativityb | |||||
| U.S.-born child/immigrant family head | 10.6% | 9.3% | 9.1% | 8.1% | 5.4% |
| 1.2 | 1.4 | 2.5 | 5.2 | ||
| U.S.-born child/U.S.born family head | 3.3% | 2.8% | 2.9% | 2.6% | 1.2% |
| 0.5 | 0.4 | 0.7 | 2.1 | ||
| Foreign-born child | 21.4% | 19.8% | 20.2% | 18.7% | 16.5% |
| 1.6 | 1.2 | 2.7 | 4.9 | ||
| Citizenship/Immigration Status of Family Membersc | |||||
| Child in all-citizen family | 3.3% | 2.8% | 2.9% | 2.6% | 1.3% |
| 0.5 | 0.4 | 0.7 | 2.0 | ||
| Child in mixed-status family | 16.0% | 14.4% | 14.2% | 12.8% | 9.4% |
| 1.6 | 1.8 | 3.2 | 6.6 | ||
| Citizen child in mixed-status familyd | 14.3% | 12.8% | 12.4% | 11.1% | 7.4% |
| 1.6 | 1.9 | 3.3 | 7 | ||
| No EITC or CTC | EITC Policy in 2021 | TCJA CTC Only | EITC in 2021 + TCJA CTC Only | Combined EITC & CTC Policies in 2021 | |
|---|---|---|---|---|---|
| Citizen child in mixed-status family with undocumented member | 21.5% | 21.4% | 18.9% | 18.7% | 12.8% |
| 0.1 | 2.6 | 2.8 | 8.7 | ||
| Noncitizen child in mixed- status familye | 24.6% | 23.1% | 23.5% | 21.9% | 19.8% |
| 1.5 | 1.1 | 2.7 | 4.8 | ||
| Noncitizen child in mixed-status family with undocumented member | 34.1% | 34.1% | 32.9% | 32.9% | 31.0% |
| 0 | 1.2 | 1.2 | 3.1 |
NOTES: Percentage point change shown in italics. An “other noncitizen” includes noncitizens not classified as unauthorized or recent. These include legal permanent residents who have been in the United States for more than 5 years, refugees/asylees, and “temporary residents”—noncitizens legally admitted to the United States for a specified period and for a specified purpose, such as students, guest workers, intra-company transfers, diplomats, and au pairs. “Family” refers to the Supplemental Poverty Measure (SPM) unit. “Family head” and “Family members” refer to SPM reference person. CTC = Child Tax Credit, EITC = Earned Income Tax Credit, TCJA = Tax Cuts and Job Act.
a The “other” race category includes non-Hispanic children who are American Indian or Alaska Natives or report more than one race.
b If a child has at least one biological, adoptive, or stepparent that was born in another country, the child is classified as having an immigrant parent. Persons born abroad to American parents are counted as native born. If a child does not have a parent present, the immigrant status of the unit head and the unit head’s spouse are used, unless the child is the unit head, spouse, or cohabiting partner, in which case the child is excluded from these rows.
c The child is placed in the first row that applies. Citizens include both native-born and naturalized citizens.
d A citizen child is classified as being in a mixed-status family if there is at least one noncitizen in the SPM unit.
e All noncitizen children are classified as being in mixed-status families.
SOURCE: Estimates from TRIM3 commissioned by the committee.
TABLE 8-5 Estimated 2021 Child Poverty Under Alternative Specifications—Summary
| No EITC or CTC | EITC Policy in 2021 | TCJA CTC Only | EITC in 2021 + TCJA CTC Only | Combined EITC & CTC Policies in 2021 | |
|---|---|---|---|---|---|
| With Employment Adjustments | |||||
| Low Employment Effect | |||||
Poverty Rate | 5.9 | 4.9 | 5.1 | 4.4 | 2.8 |
Decrease in Poverty Rate | 1.0 | 0.8 | 1.5 | 3.1 | |
| Medium Employment Effect | |||||
Poverty Rate | 6.0 | 4.9 | 5.1 | 4.4 | 2.8 |
Decrease in Poverty Rate | 1.0 | 0.9 | 1.6 | 3.2 | |
| High Employment Effect | |||||
Poverty Rate | 6.2 | 4.9 | 5.2 | 4.4 | 2.8 |
Decrease in Poverty Rate | 1.0 | 1.0 | 1.8 | 3.4 | |
| Without Employment Adjustments | |||||
| Committee Baseline | |||||
Poverty Rate | 5.7 | 5.0 | 5.1 | 4.5 | 2.8 |
Decrease in Poverty Rate | 0.7 | 0.6 | 1.2 | 2.9 | |
| Census Replication | |||||
Poverty Rate | 11.6 | 9.2 | 10.1 | 8.1 | 5.2 |
Decrease in Poverty Rate | 2.4 | 1.5 | 3.5 | 6.4 | |
| Other Major Pandemic Programs Not in Place | |||||
Poverty Rate | 17.0 | 13.5 | 14.0 | 11.6 | 7.1 |
Decrease in Poverty Rate | 3.5 | 3.0 | 5.6 | 9.9 | |
| Deep Poverty | |||||
Poverty Rate | 1.1 | 1.0 | 1.0 | 1.0 | 0.7 |
Decrease in Poverty Rate | 0.1 | 0.1 | 0.1 | 0.4 | |
| Near Poverty | |||||
Poverty Rate | 20.5 | 19.8 | 19.4 | 14.9 | 10.7 |
Decrease in Poverty Rate | 2.7 | 3.3 | 5.6 | 9.8 | |
| Year of Credit Receipt | |||||
Poverty Rate | 5.6 | 4.9 | 5.1 | 4.6 | 3.5 |
Decrease in Poverty Rate | 0.7 | 0.5 | 1.0 | 2.1 | |
NOTE: CTC = Child Tax Credit, EITC = Earned Income Tax Credit, TCJA = Tax Cuts and Job Act.
SOURCE: Estimates from TRIM3 commissioned by the committee.
Other pandemic-era programs had already lifted millions of children out of poverty before the additional effects of the EITC Policy in 2021 and CTC Policy in 2021 were applied. These credits could have removed significantly more children from poverty—up to 7 million—if those other programs had not been in place. The impacts of the Combined EITC & CTC Policies in 2021 on deep poverty were relatively modest in percentage point terms, but they still removed almost 800,000 children from deep poverty. The impact of the credits on near poverty was substantially greater, reducing the near-poverty rate by nearly 10 percentage points. This reflects the relatively large tax credit benefits received by families with modest but sufficient earnings who qualified for the highest benefits. When impacts were calculated based on the year credits were received instead of the year they were accrued, the estimated antipoverty effect declined, because only half of the ARPA CTC was typically received during that year; the remainder contributed to poverty reduction in 2022.
Building on the analysis in this chapter, the next chapter focuses on future policy design, exploring how alternative EITC and CTC structures and benefit levels—modeled in a more typical economic environment—could further reduce child poverty.
CONCLUSION
Table 8-5 summarizes the results of this chapter, presenting the committee’s estimates of the antipoverty impacts of the Combined EITC & CTC Policies in 2021. The committee’s preferred estimates, presented in the top panel, incorporate potential employment effects and show that these programs together reduced the child poverty rate by 3.1 to 3.4 percentage points—lifting between 2.2 and 2.5 million children from poverty. The estimated poverty rates and the effects of the EITC and CTC on child poverty when employment effects are ignored are not far different, reducing child poverty by 2.9 percentage points and corresponding to about 2.1 million children removed from poverty. Using Census Bureau methodology, more children are estimated to be in poverty even before they receive the EITC and CTC, and more are removed from poverty by those programs, but these estimates ignore the underreporting of transfers in the underlying CPS ASEC data.
This page intentionally left blank.


