Pathways to Reduce Child Poverty: Impacts of Federal Tax Credits (2026)
Chapter: Appendix F: Synthesizing Elasticity Estimates from the EITC and CTC Literature
Appendix F
Synthesizing Elasticity Estimates from the EITC and CTC Literature
This appendix provides details on how the substitution elasticities between work and not working (i.e., the “extensive margin”) are derived using estimates of employment responses from the existing literature, and how the resulting elasticities are used to incorporate a behavioral labor supply response into the poverty estimates. This discussion focuses on the elasticities for unmarried women, because the literature on the employment effects of the Earned Income Tax Credit (EITC) and Child Tax Credit (CTC) has focused predominantly on this group. The EITC and CTC literature has given much less attention to other groups—married mothers and other families with children, including unmarried or married fathers—so elasticities for these other groups are not estimated. Instead, elasticity estimates are drawn from surveys of the broader literature on labor supply responses (not just studies of the EITC and CTC) as explained in Chapter 7. These elasticities for other groups tend to be much smaller than those for unmarried mothers.
For unmarried mothers, the range of substitution elasticity estimates is derived from the review of a large set of studies. Specifically, the review considered studies that meet the following criteria: (1) they used quasi-experimental variation in the EITC or CTC (across demographic groups and over time) to identify the causal effect of tax policy changes on employment or labor force participation, using at least some variation from 1986 onward; and (2) they reported sufficient information to calculate an
employment elasticity.1 A third criterion is applied: the only papers included provided estimates for unmarried mothers or a sample that was predominantly unmarried mothers, because the literature indicates that this group has had the largest response to these policy changes. The papers considered (listed in Table F-1) have received attention from other recent reviews of this literature (Bastian, 2024; Corinth & Winship, 2024; Corinth et al., 2023).
For each paper in Table F-1, an elasticity is derived from the point estimate for the effect of the EITC or CTC on employment, or on labor force participation if no estimate of effects on employment was provided, for a sample of unmarried mothers, or for a group that is predominantly unmarried mothers. In cases in which separate estimates were provided for all unmarried mothers and for less-educated unmarried mothers—those with a high school degree or less—estimates are included for both samples.
Because many of these studies did not report an elasticity, the committee calculated its own. The aim was to calculate elasticities as consistently as possible across all studies to facilitate comparisons. As discussed below (see Section Calculation of Employment Elasticities for Articles and Papers Included in Table F-1), the substitution elasticity can be expressed as the percentage change in employment divided by the percentage change in the return to work generated by the policy expansion. For each study, the percent change in employment is calculated as the change in employment generated by the policy change of interest (e.g., the point estimate for the effect of the EITC on employment), divided by the employment rate reported for the population of interest. One caveat to note is that many of the studies reported overall employment rates from their overall sample, rather than pre-policy employment rates. The discussion of each study below describes how employment is measured.
The percent change in the return to work is measured as the change in the return to work generated by the policy change evaluated in each study, divided by the baseline return to work: the difference in after-tax and transfer income if an individual works, compared to the after-tax and transfer income if an individual does not work. For the numerator, in most
___________________
1One study that satisfies these criteria but is not included in Table F-1 is Kleven et al. (2024), which argued that the EITC has had very little effect on employment. The committee chose not to include this study in this review given that his results are sensitive to the specification used; Schanzenbach and Strain (2021) showed that for the 1990s Kleven’s finding of no effect of the EITC is sensitive to the inclusion of three-way interactions of whether the state had welfare waivers, year, and presence of children in the household. Schanzenbach and Strain argued that these three-way fixed effects absorbed much of the variation in the EITC, which is why he found this null effect. Including Kleven et al. (2024) in the committee’s set of reviewed studies would not substantively affect the range of elasticities used for unmarried mothers—it would not change the high and low elasticities at all and would decrease the medium elasticity slightly from 0.66 to 0.59.
TABLE F-1 EITC and Pre-ARPA CTC Studies Included to Determine Elasticities
| Policy | Sample | Implied Elasticity | |
|---|---|---|---|
| Panel A: EITC and Pre-ARPA CTC Studies for Unmarried Mothers | |||
| EITC | Unmarried Mothers without a college degree | 0.97 | |
| EITC | Unmarried Mothers | 0.82 | |
| EITC | Unmarried Mothers with HS degree or less | 0.98 | |
| EITC | Unmarried Mothers without a college degree | 0.44 | |
| EITC | Unmarried Mothers | 0.87 | |
| EITC | Welfare recipients | 1.33 | |
| EITC | Unmarried Mothers | 0.53 | |
| EITC | Unmarried Mothers with HS degree or less | 0.59 | |
| EITC | Unmarried Mothers | 0.42 | |
| EITC | Unmarried Mothers with HS degree or less | 0.74 | |
| EITC | Unmarried Mothers | 2.05 | |
| EITC | Unmarried Mothers | 1.85 | |
| pre-ARPA CTC | Low-income parents with older children | 0.43 | |
| pre-ARPA CTC | Unmarried Mothers | 0.07 | |
| pre-ARPA CTC | Unmarried Mothers with HS degree or less | 0.24 | |
| pre-ARPA CTC | Unmarried Mothers | 0.14 | |
25th | 0.43 | ||
Median | 0.66 | ||
75th | 0.97 | ||
Average | 0.78 | ||
| Policy | Sample | Implied Elasticity | |
|---|---|---|---|
| Panel B: ARPA CTC Studies for Unmarried Mothers | |||
| ARPA CTC | Unmarried mothers with young children | 0.47 | |
| ARPA CTC | Low-income families with young children | 0.50 | |
| ARPA CTC | SNAP-eligible families | 0.27 | |
| ARPA CTC | Unmarried Mothers without a college degree | 0.45 | |
| ARPA CTC | Mothers with a HS degree or less | 0.37 | |
| Panel C: ARPA CTC Studies for Other Groups | |||
| ARPA CTC | Parents with children under age 18 | 0.00 | |
| ARPA CTC | Parents with children under age 18 | 0.01 | |
| ARPA CTC | Parents with children under age 18 | 0.12 | |
| ARPA CTC | Families with young children | 0.34 | |
cases the point estimates can be expressed as the change in employment due to a $1,000 change in average EITC or CTC benefits, so the change in the return to work due to the policy is $1,000.
CALCULATING A BASELINE RETURN TO WORK
Very few papers reported a baseline return to work. This is calculated for each of the papers in the EITC literature using an approach similar to Meyer and Rosenbaum (2001). First, a fixed sample of unmarried mothers with positive earnings is defined using the 1997 Current Population Survey Annual Social and Economic Supplement (CPS ASEC). A fixed sample is used to ensure that differences in the baseline return to work across years reflect changes in the tax code and benefit rules, rather than changes in sample composition. For subsets of the fixed sample that match the sample for each paper (e.g., samples restricted by age, education, etc.), Supplemental Nutrition Assistance Program (SNAP) benefits and Aid to Families with Dependent Children/Temporary Assistance for Needy Families (AFDC/-
TANF) benefits are calculated for two scenarios: if the unmarried mother is working and if she is not working. These benefits for the two scenarios are calculated for both the first and last year of the study sample. A fixed value for earnings when working is calculated as the mean observed earnings for a subset of the fixed sample that matches the sample definition for the study, adjusted to the study year using the Consumer Price Index. Taxes (credits and liabilities) when working are calculated for these same subsamples using National Bureau of Economic Research’s Tax Simulation Model (TAXSIM). To determine SNAP benefits when working, 100% take-up is assumed and assigned the maximum benefit based on state, number of children, and the study year using data from the University of Kentucky Center for Poverty Research (UKCPR) National Welfare Data. The amount of SNAP benefits is then calculated by the effective benefit reduction rate of $0.24 for each dollar of inflation-adjusted observed earnings, until a $0 benefit is reached.2 These unmarried mothers are assumed to receive no AFDC/TANF benefits when working. For SNAP and AFDC/TANF benefits when not working, the maximum amount of these combined benefits from UKCPR National Welfare Data is assigned by family size, state, and study year.3 See Table F-2 for more details.
Given these values for each study, for those that rely on variation in simulated EITC benefits to estimate an employment effect, baseline return to work is typically calculated as the average of the return to work for the study sample in the first and last year of the sample. For studies that employed a simple difference-in-differences analysis, the baseline return to work is calculated as the return to work in the first year of the study. See the discussion of the approach for each study below in the section Calculation of Employment Elasticities for Articles and Papers Included in Table F-1.4
___________________
2Note that the University of Kentucky Welfare Rules database only provides maximum SNAP benefit amounts for families with one, two, three, or four people. To adjust for larger family sizes, the committee determined the difference in benefit amounts for families with three and four people as an estimate of how benefits would increase for each additional person in the family. The committee then adjusted maximum benefit amounts using this estimate to account for different family sizes.
3Similar to the description in footnote 2, the University of Kentucky Welfare Rules database only provides maximum SNAP + TANF/AFDC amounts for families with one, two, three, or four people. The committee followed the same procedure described in footnote 2 to adjust benefit levels for larger families.
4Some of the EITC papers the committee reviewed employed a simple difference-in-differences strategy comparing changes in outcomes before and after a policy change for a group that is likely to be affected by the policy compared to the same sort of changes in outcomes for a group that is not likely to be affected (e.g., Eissa & Liebman, 1996). Other papers estimated the effect of the EITC on employment using variation in the amount of EITC that a family is eligible for based on characteristics such as family composition, state, year, etc., while controlling for national shocks and time-invariant group characteristics. The committee refers to this as a simulated benefits approach.
| Study | Study years used for baseline RTW calculation | Sample restrictions | Baseline RTW | $Year |
|---|---|---|---|---|
| Michelmore and Pilkauskas (2021) | 1991, 1998 | Unmarried mothers age 19+ without a college degree and at least one resident child under age 18 | $13,330 | 2016 |
| Schanzenbach and Strain (2021) | 1983, 2016 | Unmarried women ages 20–50, with EITC age-eligible children (including those ages 19–23 who are in school) | $18,202 | 2019 |
| Schanzenbach and Strain (2021) | 1983, 2016 | Unmarried women ages 20–50, with a HS degree or less and an EITC age-eligible children (including those ages 19–23 who are in school) | $12,645 | 2019 |
| Hoynes and Patel (2018) | 1991 | Unmarried mothers ages 24–48 without a college degree or who are not ill, disabled, or in school, who have an EITC age-qualifying child (including those ages 19–23 who are in school) | $14,712 | 2016 |
| Grogger (2003) | 1983, 1999 | Unmarried mothers with at least one child under age 18 | $9,887 | 1998 |
| Meyer and Rosenbaum (2001) | 1984, 1996 | Unmarried mothers ages 19–44 who are not in school and have at least one child under age 18 | $9,260 | 1996 |
| Meyer and Rosenbaum (2001) | 1984, 1996 | Unmarried mothers ages 19–44 with a HS degree or less and who are not in school and have at least one child under age 18 | $6,291 | 1996 |
| Eissa and Liebman (1996) | 1984 | Single mothers ages 16–44 with EITC-eligible child (including those ages 19–23 who are in school) | $12,282 | 1996 |
| Eissa and Liebman (1996) | 1984 | Single mothers ages 16–44 with a HS degree or less and an EITC-eligible child (including those ages 19–23 who are in school) | $9,472 | 1996 |
| Bastian and Jones (2021) | 1990, 2017 | Unmarried women aged 19–64 who are not themselves dependents and have an EITC age-qualifying child (including those ages 19–23 who are in school) | $17,872 | 2016 |
| Bastian and Lochner (2022) | 2003, 2018 | Unmarried women aged 19–64 who have an EITC age-qualifying child (including those ages 19–23 who are in school) | $21,167 | 2018 |
NOTE: Baseline RTW calculations are for a fixed sample from the 1997 CPS ASEC using the policy rules in place in the study years reported in column 2.
For the reforms of the CTC under the TCJA reforms, which also do not typically report a baseline return to work and are for more recent samples, the calculation largely relies on the percent change in return to work for different demographic groups as calculated by Corinth et al. (2023).
ELASTICITY ESTIMATES USED TO ADJUST FOR EMPLOYMENT EFFECTS FOR UNMARRIED MOTHERS
The committee considered 16 different estimates from 12 different papers from the pre-American Rescue Plan Act (ARPA) EITC and CTC literatures to determine an employment elasticity for unmarried mothers for the policy scenarios discussed in Chapter 9.5 Panel A of Table F-1 lists these papers along with the policy (EITC or pre-ARPA CTC), sample, and elasticity estimate. See the section Calculation of Employment Elasticities for Articles and Papers Included in Table F-1 below for more detail on how each of these elasticities was calculated. While all the estimates are positive, the range of elasticities is wide, extending from 0.07 to 2.05. The elasticities derived from the EITC literature are considerably larger than those from the pre-ARPA CTC literature. So, the range of elasticity estimates is somewhat narrower within policy groups.
There is also considerable variation in the precision of these estimates. To obtain some sense of precision, the committee calculated a 95% confidence interval for all 16 elasticity estimates reported in Panel A of Table F-1.6 Figure F-1, which reports these elasticity estimates—unweighted and ordered by magnitude, along with their confidence intervals, and where the 25th percentile elasticity is 0.43, the 50th percentile is 0.66, and the 75th percentile is 0.97—shows that these estimates not only vary in magnitude but also in precision.7 Furthermore, the confidence intervals are systematically wider for larger elasticities, as might be expected.
___________________
5The committee is aware that a few other working papers on the employment effects of the pre-ARPA CTC that were released since the initial literature review and the determination of elasticities used in the committee’s calculations. The estimates the committee is aware of are all within the range of estimates used here; it is unlikely that their inclusion would substantively alter the recommended elasticities.
6The committee calculated confidence intervals as 1.96 times the standard errors for the key point estimates above and below each paper’s point estimate to determine the range (noting that the degrees of freedom are from the individual studies and may not reflect most current practices for confidence intervals and thus may be an underestimate of the ranges). Also, some of the studies contributed estimates for more than one population, but this is likely to be relevant for reporting the ranges, given the emphasis the literature has placed on estimates for unmarried mothers with lower education.
7The note below Figure F-1 provides a list of the papers from which the elasticities displayed are drawn, in the order of their magnitudes. This same order is used in Figures F-2 and F-3.
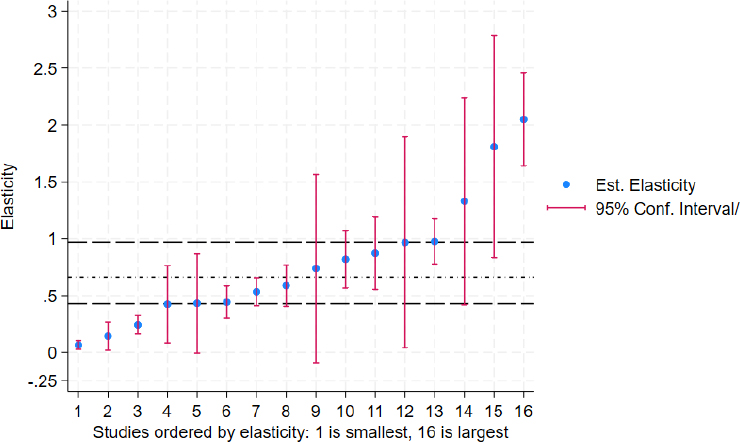
NOTES: Dashed lines are 25th (0.427), 50th (0.663), and 75th (0.972) percentiles of unweighted elasticity distribution to be used in evaluating employment effects. The order of the studies by magnitudes of the elasticities in Figures F-1 through F-3 is as follows: 1. Kang (2024); 2. Zheng (2023); 3. Kang (2024) High School or Less; 4. Eissa and Liebman (1996); 5. Lippold (2019); 6. Hoynes and Patel (2018); 7. Meyer and Rosenbaum (2001); 8. Meyer and Rosenbaum (2001) High School or Less; 9. Eissa and Liebman (2001) High School or Less; 10. Schanzenbach and Strain (2021); 11. Grogger (2003); 12. Michelmore and Pilkauskas (2021); 13. Schanzenbach and Strain (2021) High School or Less; 14. Hotz et al. (2002); 15. Bastian and Lochner (2022); 16. Bastian and Jones (2021). See Table F-1 for more details about these studies. CTC = Child Tax Credit, EITC = Earned Income Tax Credit.
SOURCE: Committee created from data in Tables F-1 and F-2.
The committee discussed different approaches for selecting a range of estimates. One common way to incorporate the uncertainty in estimates is to weight the distribution of elasticities inversely to their precision. In Figure F-2, elasticities are weighted by the inverse of their standard errors. Alternatively, one could weight each elasticity, elas, by the inverse of its coefficients of variation, i.e., 1/CV(elas) = elas/SE(elas) where SE(elas) is the standard error of the estimated elasticity elas to account for the fact that the larger elasticity estimates tended to have larger standard errors (see Figure F-3).
If one weighted elasticities by the inverse of the standard error, that is, 1/SE(elas), the 25th, 50th, and 75th percentiles are all much smaller than
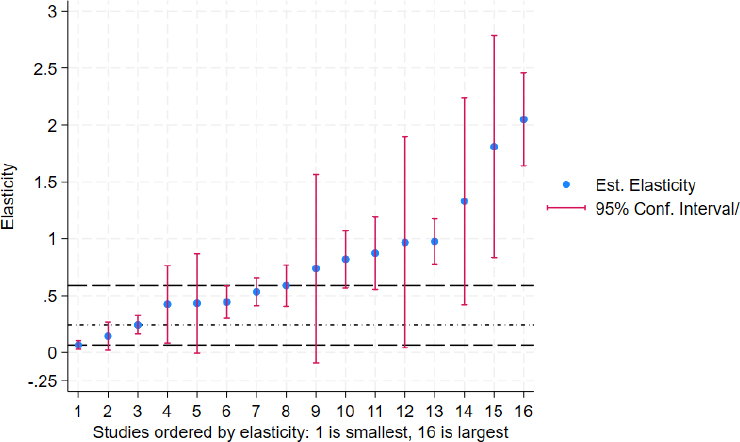
NOTES: Dashed lines are 25th and 75th percentiles of weighted elasticity distribution (0.066 and 0.587) and the dash-dotted line is median (0.243). Also see notes for Figure F-1. CTC = Child Tax Credit, EITC = Earned Income Tax.
SOURCE: Committee created from data in Tables F-1 and F-2.
their corresponding values based on the unweighted distribution of the elasticity estimates. This is because the larger elasticity estimates tended to have larger standard errors. However, based on this weighting scheme, the eight largest elasticity estimates would exceed the 75th percentile of this weighted distribution. When estimates are weighted by the inverse of their coefficient of variation, the resulting distribution is quite similar to the unweighted distribution, and values for the 25th and 75th percentiles are close to the values of those for the unweighted distribution; the median is slightly higher (0.820) than the median of the unweighted distribution (0.663).
After discussing these approaches, the committee agreed to use a low, medium, and high elasticity when considering employment effects. Specifically, the committee concluded that using the 25th, 50th, and 75th percentiles from the unweighted distribution of elasticity estimates displayed in Figure F-1 was a reasonable and principled way of applying elasticities from the literature to account for employment effects.
The committee concluded that it was important to consider a range of elasticity estimates due to the considerable uncertainty about the appropriate value. This uncertainty stems from variability in estimates across studies,
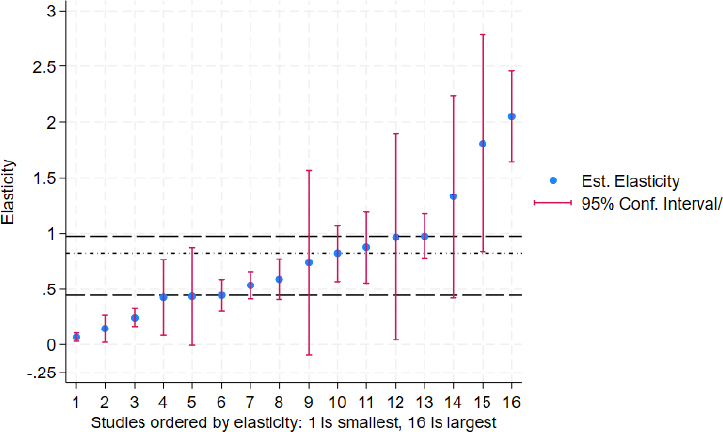
NOTES: Dashed lines are 25th and 76th percentiles of weighted elasticity distribution (0.442 and 0.976) and dash dotted line is median (0.820). Also see notes for Figure F-1.
SOURCE: Committee created from data in Tables F-1 and F-2.
the imprecision of many estimates (i.e., large confidence intervals), and the fact that several EITC and CTC policy options under evaluation extend beyond the range of observed historical data. In addition, because of this uncertainty the committee concluded it was not appropriate to privilege any one elasticity within this range when accounting for possible employment effects associated with these alternative policies. The committee also concluded that, for additional context, results without an employment adjustment are also important to report for each of the policy scenarios considered.
ACCOUNTING FOR LABOR SUPPLY RESPONSES IN POVERTY ESTIMATES
To incorporate a behavioral labor supply response to a policy change into the estimates of poverty, the elasticities specified in Table F-1 need to be translated into actual changes in employment, % ∆ employmentig for each individual i in group g. This percentage change in the probability of working for each individual is the sum of the percent change in the probability
of working due to the substitution effect and the percent change in the probability of working due to the income effect, or
| (1) |
The analysis proceeds by defining each of the terms on the right-hand side of the expression in (1).
The Substitution Effect Component of the Employment Effect
Starting with the substitution effect, note that the percent change in the probability of working due to the substitution effect () is equal to the product of the group specific elasticity () and the individual specific percent change in the return to work (% ∆ RTWig),8
| (2) |
where
% RTWig = (RTWig, under counterfactual policy – RTWig, baseline)/RTWig, baseline | (3) |
The denominator in (3) is the individual’s baseline return to work (RTW), or the difference in income when working versus not working under the baseline policy scenario, which is given by
RTWig, baseline = Incomeig, baseline|work=1 – Incomeig, baseline|work=0.
For the substitution effect, Incomeig is calculated as after-tax income plus noncash benefits.9 Note, as explained in Chapter 3, the income measure used to calculate poverty includes income sources for all individuals in the Supplemental Poverty Measure (SPM) living unit (i.e., those related by blood or marriage as well as other individuals such as cohabiting partners or foster children). However, taxes are calculated at the tax filing unit level, so for SPM units with multiple tax units, % ∆ RTWig will depend on which tax unit the individual is assigned to. For example; for an unmarried,
___________________
8Although only relevant in rare cases, the committee restricted % ∆ employmentSig to be between 0 and 100% for policy scenarios that increase the RTW and between –100% and 0 for policies that decrease the RTW.
9This income measure differs slightly from the measure the committee used to calculate poverty, which is based on the measure used to estimate the SPM, but adjusted using TRIM3 as explained in Chapter 3. For example, this measure does not include work or child care expenses.
cohabiting couple with children, the mother and children are assigned to one tax unit, while the cohabiting partner is assigned to a separate tax unit, and, because the partner’s tax unit does not include any children, there is no effect on the return to work for this partner of a policy that requires a qualifying child for eligibility. Also, in these rare cases in which an SPM unit contains more than one tax unit, the analysis only allows a potential change in employment for those in the lowest-earning tax unit with a CTC-qualifying child within the SPM unit.10 For married couples, the analysis allows each individual to have an employment response independent of their partner’s, which assumes that each individual’s return to work is based only on the incentive provided by their own employment. Alternatively, one could model labor supply decisions for married couples jointly, but this approach would also require strong assumptions about such decisions.
The numerator in Equation (3) can be rewritten as
RTWig, under counterfactual policy – RTWig, baseline = (Incomeig, under counterfactual policy – Incomeig, under counterfactual policy|work=0) – (Incomeig, baseline|work=1 – Incomeig, baseline|work=0).
which is equal to the net change in income due to the policy when working minus the net change in income due to the policy when not working.11
The Income Effect Component of the Employment Effect
The percent change in the probability of working due to the income effect () is equal to the group-specific income elasticities (), which are listed in Table F-1, multiplied by the individual specific percent change in income (% Incomeig) due to the policy change, or
| (4) |
where
___________________
10For policies that decrease the RTW this would be the tax unit with the lowest reported earnings, while for policies that increase the RTW this would be the tax unit with the lowest imputed earnings. Similarly, Corinth et al. (2023) only modeled a response for the tax unit within the household with the highest probability of changing employment. See p. A-38, footnote 13 of Corinth et al. (2023).
11Note that because the percentage change in the return to work is zero for anyone who is not eligible for the policy that is changing (i.e., either the EITC or CTC) the committee did not make any employment adjustments for individuals whom TRIM3 imputed to be ineligible for these policies.
Incomeig = (Incomeig, under counterfactual policy – Incomeig, baseline)/Incomeig, baseline).
For the income effect, Incomeig is the same measure used to estimate poverty. As explained in Chapter 3, this measure is based on the income measure used to calculate the SPM but is adjusted using Transfer Income Model version 3 (TRIM3).
Counterfactual Income for Policy Simulations That Decrease the Return to Work
Some policy simulations considered, such as making the ARPA CTC permanent, will decrease the RTW, thereby incentivizing some individuals who are working to not work. Thus, constructing a counterfactual income value for when they are not working is needed. In these scenarios, this baseline RTW for an individual who is currently working is simply current earnings minus additional tax liability accrued due to working, minus any benefits forgone due to working. TRIM3 was used to simulate the change in benefits that results from moving from working to not working. For calculating the baseline return to work, TRIM3 allows for changes in Supplemental Security Income (SSI), SNAP, TANF, Unemployment Insurance (UI), Special Supplemental Nutrition Program for Women, Infants, and Children (WIC), and Low Income Home Energy Assistance Program (LIHEAP). Note that this ignores other benefits that might change with changes in earnings such as school lunch and housing subsidies, Disability Insurance (DI), and Old-Age and Survivors Insurance (OASI). It also excludes other components of the resource measure used to calculate SPM such as work and child care expenses. Other recent work modeling labor supply effects has only considered SNAP benefits (Bastian, 2024; Corinth et al., 2023).12 TRIM3 calculates these benefits based on program eligibility criteria as well as estimated take-up rates, so some individuals who would be eligible for benefits are not imputed to receive them, which corresponds to take-up in the population.13
___________________
12Corinth et al. (2023) assigned counterfactual benefits by allocating the maximum SNAP benefit for which individuals are eligible given family size and household earnings.
13Although the committee accounted for employment effects within TRIM3, very similar percent changes in employment were obtained within each of the groups when a similar procedure was implemented using just the public-use CPS ASEC data and TAXSIM.
COUNTERFACTUAL INCOME FOR POLICY SIMULATIONS THAT INCREASE THE RETURN TO WORK
Some policy simulations considered, such as replacing the ARPA CTC with the TCJA CTC, will increase the RTW, thereby incentivizing some individuals who are not working to work. Thus, determining what the income of nonworkers would be if they were to work is needed. In this case, imputing counterfactual earnings and counterfactual benefits (because some workers receive benefits) is needed. This is predicted as follows: The initial sample contained individuals age 18 or older with earnings (i.e., a sum of wage/salary income, farm self-employment, and business self-employment) that are positive but less than $80,000, total income less than $80,000, at least one dependent child in the tax unit, and who are not a dependent themselves and whose earnings were not imputed.14 For this sample, total annual earnings are regressed on the following observable characteristics: age indicators (< 25, 25–34, 35+), education indicators (less than high school, high school graduate/GED, some college, bachelors degree or more), race or ethnicity indicators (White-only (non-Hispanic), Black-only (non-Hispanic), Hispanic, Asian/Pacific Islander (non-Hispanic), other or multirace (non-Hispanic), gender, urbanicity, number of children in the SPM unit, presence of children under age 6, number of adults in the SPM unit, presence of a partner in the unit (either married with a spouse present or living with an unmarried partner), census division, and an interaction between female and presence of partner.
The estimates from this (unweighted) regression model are used to predict earnings for individuals with zero annual earnings.15 For counterfactual benefits, TRIM3 is used to simulate the change in benefits (SSI, SNAP, TANF, UI, WIC, and LIHEAP) that results from moving from not working to working.
INCORPORATING EMPLOYMENT RESPONSE INTO POVERTY ESTIMATES
The total percent change in the probability of working for each worker is then used to incorporate a behavioral labor supply response into the poverty estimates. This process includes three steps: (1) determine which individuals’ employment statuses are reassigned, (2) recalculate income given each individual’s new employment status, and (3) calculate poverty given these new values for income for affected units.
___________________
14Those who reported earnings within a range were included in the model. Specifically, individuals with CPS ASEC variable interval less than 4 were included.
15A few TRIM3 imputations rely on having an hourly wage, so the committee also imputed a wage by dividing imputed annual earnings by 2,080.
For policy scenarios that decrease the RTW, such as making the provisions of the CTC under ARPA permanent, the process for identifying those to be reclassified from working to not working was as follows: First, for each of the three groups—unmarried mothers, other mothers, and others with dependents—calculate the target number of workers who would exit employment due to this policy as the sum of the product of the person weight and the individual’s total percentage change in the probability of working for the sample of current workers. Then, who exits employment is selected by sorting each group by the difference between each individual’s percent change in employment and a random number uniformly distributed between 0 and 1. Finally, workers are reassigned as nonworkers sequentially, starting with those with the highest value of this difference and continuing until the weighted sum of workers who are reassigned comes as close as possible to the target number of workers. This approach allows for some randomness in who changes their employment status, while also allowing those with a higher likelihood of changing work to be more likely to actually change. A similar process is followed for policy scenarios that increase the return to work but instead reassign a sample of nonworkers to be workers.
For any SPM unit that has an individual whose work status has been reassigned, income is then recalculated to account for the change in employment status. For example, if an individual within an SPM unit is reassigned from employment to nonemployment, then income would be adjusted to account for the net change in after-tax earnings plus benefits, where counterfactual benefits are calculated within TRIM3. Poverty estimates are then calculated using these adjusted values for income.
CALCULATION OF EMPLOYMENT ELASTICITIES FOR ARTICLES AND PAPERS INCLUDED IN TABLE F-1
EITC Papers Used to Calculate an Elasticity for Unmarried Mothers
Michelmore and Pilkauskas (2021)
This study used the CPS ASEC from 1990 through 2017 to estimate the labor supply responses of unmarried mothers (those who have at least one child under the age of 18) with less than a college degree to expansions of the federal and state EITC using a simulated benefit strategy. Table 2 of the paper used data only from 1992 through 1999 to estimate the impact of the Omnibus Budget Reconciliation Act of 1993 (OBRA) EITC expansion. The point estimate was used from column 3, panel B of the table that indicated a 4.5 percentage point employment response to a $1,000 increase in federal and state EITC benefits (in 2016 dollars) off of a baseline employment of
62%. This implied a 7.25% increase in employment per $1,000 of EITC benefits. The baseline return to work over this time period for this sample of unmarried mothers was calculated at $13,300, yielding an elasticity of 0.968. Their regressions included demographic (i.e., parental age, educational attainment, race) and state-year characteristics (i.e., welfare generosity, food stamp generosity, minimum wage, unemployment rate, gross domestic product) as well as state, year, and number-of-child fixed effects; interactions of state characteristics with number-of-child fixed effects; and excluding all states that had an AFDC waiver prior to welfare reform.
Schanzenbach and Strain (2021)
This paper used a simulated benefit strategy and the CPS ASEC between 1971 and 2018 to estimate the labor supply responses of unmarried mothers to the EITC. They made the following sample restrictions: unmarried mothers, ages 20 to 50, with and without EITC-dependent children (under the age of 19 or age 24 and full-time students). Averaging over all the reforms, they found that a $1,000 increase in the maximum EITC (in 2019 dollars) increased the probability of employment of single mothers by 1.9 percentage points (Table 5, column 6, panel B of their paper). Following Corinth et al. (2023), the labor supply response was converted from a response to a change in the maximum credit to a response to a change in the average credit, which they argued is at least 1.73 times the size of the change in the maximum credit. Inflating the 1.9 percentage point response by 1.73, Corinth et al. (2023) estimated that Schanzenbach and Strain (2021) found a 3.2 percentage point increase in employment for a $1,000 increase in average EITC benefits. Using a baseline employment rate of 73% (reported in Table A1 of Schanzenbach & Strain, 2021) and a baseline economic return to work of $18,202, an elasticity of 0.82 was calculated. Their models included the following controls: demographic controls, state, year, and controls for state annual unemployment rates, and state unemployment rates interacted with presence of EITC-eligible children.
Hoynes and Patel (2018)
This study examined the labor supply effects of the 1993 OBRA expansion to the EITC on unmarried mothers with less than a college degree using data from the CPS ASEC from 1992 to 1999 (for the employment responses). They made the following sample restrictions: unmarried women ages 24 to 48 without a college degree or who are not ill, disabled, or in school and who have a qualifying child (under age 19 or 19 to 23 and full-time student). A challenge in estimating an elasticity from this paper is that the authors reported results using both a basic difference-in-differences
strategy to estimate the impact of the EITC on employment, as well as a simulated benefit strategy, which produced different estimates. Because of the transparency of the difference-in-differences estimates, as well as comparability with how elasticities from other studies are estimated (such as Eissa & Liebman 1996, discussed below), the difference-in-differences estimates were used to calculate elasticities from this analysis. In Appendix Table 7, column 1 of their paper, they reported a difference-in-differences estimate of 6.1 percentage points for women with at least one child relative to those with no children before and after the 1993 expansion. Controls included state by year fixed effects; indicators for number of children (0, 1, 2, 3+); and demographic controls, including age, education, race, ethnicity, and divorced status of the mother. They reported a baseline employment rate of 75%, which means that they found an 8% increase in employment before and after the OBRA expansion. A value for the return to work was calculated for the first and last years of the study—1991 and 1998—equal to after-tax earnings plus the value of food stamp benefits when this sample was working, less the value of AFDC/TANF and food stamp benefits when not working. For both of these years, the value of earnings was fixed and equal to average earnings among those working (in 2016 dollars) for the fixed sample. So, the change in the return to work between these two years was driven by changes in taxes, AFDC/TANF, and food stamp benefits. The latter two are included, because the model from Appendix Table 7 of Hoynes and Patel (2018) did not control for changes in these policies. This produced a baseline return to work of $14,712, and a change in return to work between the first and last years of the analysis of $2,706 (2016 dollars), an increase of 18.4%, resulting in an elasticity of 0.442. Other studies that have derived elasticity estimates from the results in this paper have relied on the simulated benefits estimates and found much larger elasticities. For example, Corinth et al. (2023) calculated an elasticity of 1.25.
Grogger (2003)
This paper used a simulated benefit strategy and the CPS ASEC between 1979 and 2000 to estimate the labor supply responses of unmarried mothers to the EITC. He found that a $1,000 increase in the maximum EITC (in 1998 dollars) increased the probability of employment of single mothers by 3.6 percentage points (Table 2). This effect was multiplied by 1.73, following the scaling used for converting the maximum EITC to average EITC as was done with Schanzenbach and Strain (2021), resulting in a 6.2 percentage point increase in employment for a $1,000 increase in average EITC benefits. Using a baseline employment rate of 71% (reported in Table 1) and a baseline economic return to work of $9,931 (in 1998 dollars), an elasticity of 0.87 was calculated. Their models included the following
controls: demographic controls, state, year, controls for state annual unemployment rates, and state unemployment rates interacted with presence of EITC-eligible children.
Hotz, Mullin, and Scholz (2002)
This paper estimated the effect of the EITC on labor force participation for a sample of welfare recipients in California. Unlike the other papers, this study relied on administrative data on employment rather than CPS ASEC survey data. Consequently, there are no data for a comparable sample to calculate a baseline return to work in a way that is comparable to the approach for the other papers. Instead, the analysis relied on calculations of the elasticity from Hotz and Scholz (2003). In Table 3.4 of that survey, they reported a range for the labor force participation elasticity in Hotz et al. (2002) of between 0.97 and 1.69. Taking the midpoint of this range, an elasticity of 1.33 was used.
Meyer and Rosenbaum (2001)
The paper modeled the impact of changes to the social safety net in the 1980s and 1990s on maternal labor force participation. Using expansions to the EITC in the 1980s and 1990s to evaluate labor supply responses of single mothers, they found that a $1,000 increase in the EITC (in 1996 dollars) increased employment of single mothers by 4.5 percentage points (off of a base of 78%). To calculate an employment effect for those with a high school degree or less, a weighted average of the point estimates from Table IV was used, columns 6 and 7 of their paper, which separately estimated employment responses for women with less than a high school diploma and those with exactly a high school diploma. These point estimates were weighted according to the share of the sample each group represented (e.g., those with a less than high school education represented 28% of the sample while those with a high school degree represented 72% of the sample) to arrive at an estimate of 6.3 percentage points. Based on CPS ASEC data, a baseline employment rate was estimated to be 68% for this group, which implied a 9.33% increase in employment due to a $1,000 increase in the EITC (in 1996 dollars). Over this time period, a baseline return to work of $9,260 was calculated for the full sample and $6,291 for the less-educated sample. This implies elasticities of 0.534 and 0.587 for the full sample and the less-educated sample, respectively.
Eissa and Liebman (1996)
This study used data from the March CPS ASEC (1985 to 1987; 1989 to 1991) to estimate the labor supply response of unmarried mothers to the 1986 expansions to the EITC, using a difference-in-differences strategy comparing single women with and without children before and after the expansion. They found that single women with children increased their labor supply by 2.2 percentage points over this time period (Table III, column 5 of their paper) for the full sample, relative to single women without children. Before the expansion, Eissa and Liebman (1996) reported that single mothers had a labor force participation rate of 73% (see Table II of their paper), which implied that labor force participation increased by approximately 3% after the reform. For individuals with a high school degree or less, a weighted average was calculated (using the ratio of high school graduates to those without a degree) of the employment responses reported in Table IV by educational attainment, yielding a 3.5 percentage point increase in employment for this population. Using a similar weighted average calculation to calculate baseline employment (reported in Table II), 69% of unmarried women with a high school degree or less were working. A baseline return to work of $12,282 was calculated for the full sample, and $9,472 for those with a high school degree or less (all measured in 1996 dollars). Over this time period, calculations showed that the return to work increased by $1,188 for the sample overall, and $978 for those with a high school degree or less, generating elasticities of 0.423 and 0.738, respectively. Note that because Eissa and Liebman (1996) controlled for maximum welfare benefits in their regression model, welfare benefits were excluded from the calculation of the change in return to work over this time period (since the regression estimates reflected employment responses net of welfare benefits).
Bastian and Jones (2021)
This study used matched IRS and CPS data between 1990 and 2017 to examine labor market effects of the EITC among unmarried mothers. They made the following sample restrictions: 19- to 64-year-old women (both married and unmarried, with and without dependents), no education restrictions, but did restrict to those who were not themselves dependents. They then modeled the labor market effects using the maximum EITC in a given year for a given number of children. In the model from which employment effects were drawn, an interaction between the maximum EITC and marital status was used to identify the differential employment responses of married and unmarried women. From their Table A.4, they estimated that a $1,000 increase in the maximum EITC (in 2016 dollars) led to a
5.1 percentage point increase in employment among unmarried women. Employment was modeled as positive weekly hours worked, though they stated that effects were similar when using annual employment or labor force participation instead. This effect was multiplied by 1.73, following the scaling used for converting the maximum EITC to average EITC as was done with Schanzenbach and Strain (2021), which implied an employment effect of 8.8 percentage points associated with a $1,000 increase in the average EITC. Bastian and Jones (2021) reported baseline employment rates of 77%, so this represented an 11.5% employment response. They included the following in their regression models: fixed effects for state, year, and number of children; four education categories; marital status; an age cubic; race; having children under age 5; the interaction of married and low-education with state, year, and number of children; and controls for state linear time trends and annual state factors (gross domestic product, employment-to-population ratio, welfare generosity for a family with one, two, three, or four children, top marginal tax rates, sales tax rates, and minimum wage). A baseline return to work was calculated over this time period of $17,872 (in 2016 dollars), which generated an elasticity of 2.05 (using a $1,000 increase in average EITC benefits as the change in return to work).
Bastian and Lochner (2022)
Similar to Bastian and Jones (2021), this paper used changes in the maximum EITC over time to model the employment effects of the EITC, this time using the American Time Use Survey (ATUS) from 2003 through 2018. They restricted the sample to 18- to 49-year-old mothers who were not themselves dependents and had at least one dependent under the age of 19 (or 24 if full-time student) but made no further sample restrictions (e.g., education level). Like Bastian and Jones (2021), they estimated separate employment responses for married and unmarried mothers using an interaction term, and from Table 2 of their paper, reported that unmarried mothers were 4.1 percentage points more likely to participate in the labor force following a $1,000 increase in the maximum EITC (in 2018 dollars). Converting this into an estimate of labor force participation responses to an increase in the average EITC (multiplying the estimate by 1.73), they estimated an effect of 7.1 percentage points. They reported a baseline labor force participation rate of 81%, representing an 8.76% increase (note that their outcome was labor force participation, not employment). A baseline return to work was calculated over this time period of $21,167 (in 2018 dollars). Based on this information, an elasticity of 1.854 was calculated. They included the following controls in their regressions: demographic characteristics (i.e., number-of-children indicators; indicator for any children under age 6; four education indicators for schooling—less than 12, 12,
13–15, or at least 16 years; married indicator; Black indicator; Hispanic indicator; age; age squared; age cubed; and birth year); an indicator for being surveyed on a weekend, married; education indicators interacted with state fixed effects, year fixed effects, and number-of-children indicators; married indicator interacted with state fixed effects and year fixed effects; and state fixed effects and year fixed effects.
Pre-ARPA CTC Papers Used to Calculate an Elasticity for Unmarried Mothers
Lippold (2019)
This published study used data from the Survey of Income and Program Participation (SIPP) from 1984 to 2014. The author limited the sample to families with prior-year income below $20,000 between 2001 and 2016. Using a regression discontinuity approach comparing families whose youngest child was on the threshold of turning 17 around the beginning of the calendar year, Lippold (2019) found that labor supply declined by 8.4 percentage points (Table 2, column 3) for parents with a child who just barely disqualified for the CTC because they turned 17 by December 31 of the tax year, compared to individuals whose youngest child turned 17 just after the new year. Lippold (2019) estimated that this discontinuity corresponded to roughly a $1,000 decline in CTC benefits as a result of a child aging out of the CTC. He reported a steady-state Hicksian elasticity of 0.43 for employment, which was used for the synthesis of employment responses. This estimate was based on an estimated return to work of $8,000, which was calculated as the difference in after-tax income between those working and not working.
Kang (2024)
This unpublished study used the CPS ASEC from 1997 through 2020 and a simulated benefit strategy to estimate the labor supply effects of the CTC prior to the ARPA reforms. In some analyses, the author also used variation in the maximum CTC benefit over time to estimate labor supply responses. Limiting the sample to women aged 25 to 54 (regardless of educational attainment), the author found that a $1,000 increase in the average CTC corresponded to a 1.7 percentage point increase in employment among single mothers and 3.7 percentage points (see Table 5, column 1) among single mothers with a high school diploma or less. The author did not find any employment effect among married mothers. Kang (2024) calculated an elasticity of 0.07 for all single mothers and 0.24 for single mothers with a high school diploma or less using the change in
return-to-work framework, so no adjustments were made to the reported elasticities. Kang (2024) calculated elasticities by rescaling the reduced form estimates by first-stage estimates from a regression of the mother’s own CTC (as computed by TAXSIM) on the simulated credit. No further details were given about employment and after-tax income. Kang (2024) hypothesized that smaller elasticities were found in this study than in some of the EITC literature because the CTC reforms they studied were smaller than those in the EITC literature.
Zheng (2023)
This unpublished study used data from the 1991 to 2008 SIPP and a simulated benefit to estimate the labor supply responses to the pre-ARPA CTC. Their estimates primarily came from the introduction of the CTC and the expansion of the refundable portion of the credit in 2001. The sample was restricted to single mothers aged 20 to 64 with at least one child under age 17. The outcome was defined as whether the individual reported working in at least one week in the reference month. The author found that a $1,000 increase in average benefits increased labor force participation by 1.13 percentage points (see Table 3, column 3), largely driven by mothers with children ages 3 to 5. They reported an elasticity of 0.51 in the paper, which was based on pre-tax earnings ($29,170). This elasticity was adjusted by using the estimated return to work from Lippold (2019) of $8,000, which was based on after-tax earnings rather than pre-tax earnings. The adjusted elasticity was 0.14.
ARPA CTC Papers Used to Calculate an Elasticity for Unmarried Mothers
Pac and Berger (2024)
This study used CPS ASEC monthly data from 2018 through December 2021 and a difference-in-differences analysis to study the labor supply responses of the ARPA CTC. They compared the labor supply of individuals with children to those without, before and after the expansion. They found a 2.7 percentage point decline in employment among unmarried mothers with young children (see Table 5 of Pac & Berger, 2024), which corresponded to a 3.9% decline in employment. Using the same methodology as with the main sample (described below), this produced a range of elasticities from 0.39 to 0.55. The midpoint of 0.47 is reported in Table F-1.
Pilkauskas et al. (2024)
This study exploited variation in the generosity of the ARPA CTC by number of children using survey data on SNAP recipients from Propel’s Providers App. Unlike other studies in this literature, this study focused on families with children and relied on variation in the credit amount to study the impact on labor supply. They argued that childless individuals do not serve as a good counterfactual comparison group given the other things changing around the same time that may have disproportionately impacted families with children relative to those without. They found no significant effect of the credit amount on employment, though their point estimates were negative. In the main results, they found a decline in employment (not significant) of 0.4 to 0.9 percentage points, which corresponds to a 2% reduction in employment off of a base of 40%. Using the Corinth et al. (2023) estimates that the return to work declined by 7% to 10% for low-income households as a result of ARPA, this translated into an elasticity ranging from 0.22 to 0.31. The midpoint of this range is reported in Table F-1.
Schanzenbach and Strain (2024)
This study used the monthly CPS and a traditional difference-in-differences analysis to study the impact of the ARPA CTC on employment. Their empirical strategy closely mimics that of the other studies that relied on the monthly CPS. They did not find a significant decline in employment for the sample overall but did find some evidence of a decline in employment among low-educated, unmarried mothers with young children. They estimated a 2.4 percentage point (3.7%) decline in employment among women without a college degree, unmarried, and with a child under the age of 6. The authors used a triple-difference specification to arrive at this estimate, which can be calculated by summing the coefficient interacting post with parent, as well as the interaction of post with parent with an indicator for having a young child. This generated a point estimate of –0.024 (0.021 minus 0.045). Using the percent change in return to work ranging from 7% to 10% as used in the other studies for low-educated single mothers (Corinth et al., 2023), this generated a range of elasticities of 0.37 to 0.53. The midpoint of this range is reported in Table F-1.
Han, Meyer, and Sullivan (2022)
This study tracked the employment of low-educated parents to that of low-educated childless individuals in the months before and after the ARPA CTC. They found a decline in employment among mothers with a high school diploma or less in the months when the ARPA CTC was in place, with no comparable decline among more highly educated parents.
Their estimates reflected a 2 percentage point decline in employment among less-educated parents, which represented a 3% decline. Using the percent change in return to work generated by the ARPA CTC of 7% to 10%, this implied an elasticity ranging between 0.30 and 0.43. The midpoint of this range is reported in Table F-1. Note that this study differs from others in that it looked at employment among all low-educated parents, not just unmarried mothers.
ARPA CTC Papers Used to Calculate an Elasticity for Other Groups
Ananat et al. (2024)
This study used CPS monthly data from January 2021 through December 2022 and a difference-in-differences analysis to study the labor supply responses to the ARPA CTC. In their main specification, they compared the labor supply of parents to those of adult, childless individuals in the months before and after ARPA in July 2021. For the main sample, they found no effect of the ARPA CTC Expansion on parental labor supply, with an estimated elasticity of zero. They did find evidence of a decline in labor supply among families with children under the age of 5, but they did not provide information on employment levels of this group prior to the expansion, so an elasticity was not specifically calculated for this group.
Pac and Berger (2024)
This study used CPS monthly data from 2018 through December 2021 and a difference-in-differences analysis to study the labor supply responses to the ARPA CTC. Like Ananat et al. (2024), they compared the labor supply of individuals with children to those without, before and after the expansion. Their study differed slightly from others in that they focused on caregivers rather than parents per se, adopting a slightly broader definition of parent/guardian than in other studies. They found a statistically insignificant decline in employment among caregivers following ARPA, which they estimated translated to a decline of about 400,000 workers. In one specification, they found a 0.6 percentage point decline in employment of all caregivers while the expansion was in place, using 2018 and 2019 as comparison years (see Table 2 of Pac & Berger, 2024). This translated to a 0.79% decline in employment and, using a percent change in return to work of 5% to 10% (from Corinth et al., 2023), this translated to an overall elasticity of 0.08 to 0.16. The midpoint of this range (0.12) is reported in Table F-1.
Enriquez, Jones, and Tedeschi (2023)
Like other studies of the ARPA CTC reform, this study used the monthly CPS and a difference-in-differences estimation strategy. They took a slightly different strategy than Ananat et al. (2024) and Pac and Berger (2024) in that they quantified the CTC as a share of household income and rank-ordered these estimates. They found no evidence of a decline in employment according to the magnitude of the change in benefits before and after the expansion. They ruled out an elasticity larger than 0.005 for the overall sample, which is included in Table F-1 as an upper-bound estimate.
Lippold and Luczywek (2023)
This unpublished study used a regression discontinuity design and IRS tax data to study the impact of the ARPA CTC. They compared the labor supply of parents with children who turned 6 before and after December 31, 2021. Those with children who turned 6 after December 31, 2021, were eligible for $50 of additional benefits per month compared to households with children who turned 6 by December 31, 2021. The authors focused on annual employment, as they only had earnings information from annual tax returns and information returns. They found a 2% decline in employment among low-income families in 2021 who had a child under the age of 6, compared to those with a child who just turned 6; they found no labor supply response for higher-income families. They also found evidence that the decline in wages and salary employment was offset by an increase in self-employment, which would generate an overall null effect on employment. Based on the 2% decline in employment, the authors calculated an elasticity with respect to the change in return to work of 0.50 for low-income families, and 0.34 for the sample overall. It is worth noting that this study differs from the others in that they measured annual employment, while the others focused on monthly employment. Additionally, since the ARPA CTC Expansion was announced in March 2021 and implemented in July 2021, the decline in employment found here must be generated by individuals who were not already working between January and March 2021.
This page intentionally left blank.


