Effects of Ionizing Radiation: Atomic Bomb Survivors and Their Children (1945-1995) (1998)
Chapter: 7 Tumor Registries and Cancer Incidence Studies
7
Tumor Registries and Cancer Incidence Studies
KIYOHIKO MABUCHI
Summary
It is now widely recognized that the induction of solid cancer, in addition to that of leukemia, is the most important late health consequence in the atomic bomb survivors and other populations exposed to ionizing radiation. The current risk estimates for radiological protection are in fact dictated by the pattern and size of radiation-induced solid cancer risk. Until recently, the assessment of cancer risk carried out at ABCC/RERF had primarily relied on death-certificate-based mortality data. Cancer incidence data provide information needed to assess a broader spectrum of the effects of radiation exposure. However, unlike routinely collected mortality data, the acquisition of cancer incidence data requires a systematic, large-scale effort to ascertain and register all cancer cases occurring in a defined population on an ongoing basis. Recognizing the importance of incidence data, ABCC in the early years collaborated with the local medical community in establishing tumor registries in Hiroshima and Nagasaki (Ishida et al., 1961). As a result, the Hiroshima Tumor Registry was inaugurated in May 1957, and in April of the following year the Nagasaki Tumor Registry was started. These were the first population-based registries established in Japan.
The Early Years
Although the excess number of leukemia cases in the atomic bomb survivors became clear several years after the exposure, it is quite remarkable that the question on the possible effect on solid cancers was still in much debate as late as in the mid-1950s. In 1956, Oho reported increased mortality from various types of malignant
TABLE 7.1 Cancer incidence by distance from hypocenter: Hiroshima, May 1, 1957–December 30, 1958.*
|
Site |
Distance (m) |
Population |
Cases |
Incidence* |
|
All malignancies |
500 - 999 |
973 |
16 |
1,287.1 |
|
1,000 - 1,499 |
8,688 |
71 |
528.6 |
|
|
1,500 - 1,999 |
15,318 |
91 |
392.6 |
|
|
2,000 - 2,499 |
13,915 |
68 |
297.3 |
|
|
Non-irradiated |
202,727 |
464 |
280.5 |
|
|
Malignancies excluding leukemias and lymphomas |
500 - 999 |
973 |
13 |
1,023.1 |
|
1,000 - 1,499 |
8,688 |
66 |
479.0 |
|
|
1,500 - 1,999 |
15,318 |
89 |
380.1 |
|
|
2,000 - 2,499 |
13,915 |
66 |
283.4 |
|
|
Non-irradiated |
202,727 |
447 |
270.1 |
|
|
* Incidence per 100,000, adjusted for age and sex. |
||||
neoplasms in the ''exposed" persons in Hiroshima based on death certificate data for 1951 through 1955 (Oho, 1956). The early LSS mortality data also showed a similar increase for cancers other than leukemia for proximal survivors, but the interpretations were difficult because of the concern about possible biases in reporting based on death certificates (Beebe et al., 1961; Jablon et al., 1963). However, the first tumor registry report by Harada and Ishida demonstrated a clear relationship of solid cancer incidence to distance from the hypocenter (Harada and Ishida, 1960)(Table 7.1).
The report by Harada and Ishida, published in 1960, included cancer incidence data for the first 20 months of the Hiroshima Tumor Registry operation. The analysis of the tumor registry data involved: the general population of Hiroshima; open population, estimated from the 1950 National Census; as well as the fixed Life Span Study sample selected for mortality follow-up conducted by ABCC. The incidence of all malignant neoplasms increased in an exponential or linear fashion with a decreasing distance, on a logarithmic scale, from the hypocenter. The authors also noted that the age-specific rates of cancer (other than leukemia) for proximal survivors were a constant multiple of the corresponding rates for the non-exposed, suggesting the increase in absolute incidence. Subsequent incidence reports included data from both Hiroshima and Nagasaki and added several more years of follow-up (Harada et al., 1963; Ide, et al., 1965); these supported the
earlier incidence results. Therefore, in the early years, the tumor registries were quite active and appeared promising.
The following decades, however, saw a rapid decline in registry activities, especially in Hiroshima. Deterioration in the relationship with the local medical community led to an increasing difficulty in sustaining collaboration from certain major hospitals in Hiroshima. To supplement case reporting, tissue registries were started in Hiroshima and Nagasaki in 1973, with initial financial support provided by the US National Cancer Institute. The tissue registries are pathology-based registries intended to collect and store pathology slides and tumor information for histologically diagnosed tumor cases in the Hiroshima and Nagasaki areas. While these registry features are quite unique and useful for pathological investigations, the lack of a population base has remained a serious shortcoming for epidemiological studies.
From the late 1960s through early 1980s, the tumor registry activities became less visible, but routine data collection work continued in both cities. During this time, the tumor registry data were primarily used as an index source for identifying cancer cases for individual researchers interested in specific sites of cancer. Several important studies of this kind were carried out, including the breast cancer series (Tokunaga et al., 1987) and cancers of the stomach (Matsuura et al., 1983), lung (Kopecky et al., 1986; Yamamoto et al., 1986), ovary (Tokuoka et al., 1987), thyroid (Akiba et al., 1991), and colon and rectum (Nakatsuka et al., 1992).
The tumor registry data were at one time analyzed as a supplement to the periodical analysis of the LSS mortality data (Beebe et al., 1961). But it was not until 1981 that the next comprehensive cancer incidence report was published and this report included only the Nagasaki portion of the LSS sample (Wakabayashi et al., 1981). This report included a total of 1,412 cancer incidence cases occurring in the Nagasaki subcohort during the period 1959–78, as compared with a total of 759 cancer mortality cases for the same period. The number of excess cases attributable to radiation exposure was estimated to be 150.5, or about 11%. The radiation dose estimates were based on T65DR, and the shape of a dose-response curve, for essentially gamma radiations resulting from the Nagasaki bomb, was linear for solid cancers and either linear or linear-quadratic for leukemia.
Recent Developments
Recent developments as described below have completely modernized the Hiroshima and Nagasaki Tumor Registries; these tumor registries, as they now exist, are fully developed population-based registries. In the late 1980s RERF began to devote increased attention and resources to rebuilding and improving the tumor registries to meet research needs, i.e., to providing high quality incidence data for risk assessment. The Hiroshima data collection lagged behind, but by this time the relationship of RERF with the major hospitals in Hiroshima had substantially improved so that retroactive case ascertainment was possible. Data collection was
resumed from several hospitals, which had previously not been visited, and new hospitals were added to the hospital visitation schedule. In order to achieve consistency in data and data handling between Hiroshima and Nagasaki, the registry staff from both cities worked together to develop common procedures and manuals. All tumor and tissue registries were then assembled, together with data from other relevant records such as death certificates, RERF pathology records (autopsy and surgical), clinical records from the Adult Health Study, and, for hematological tumors, the Leukemia Registry records. Some hospitals were re-visited to follow up on cases for which previously abstracted information was incomplete or insufficient. Following the newly established procedures and rules, all records were reviewed, a standardized summary was prepared for each primary tumor, and these data were then coded and entered into a newly developed database with extensive quality control checks.
By the late 1980s, both the Hiroshima and Nagasaki cancer incidence data had a sufficiently good quality, and they were included in a series of monographs on world-wide cancer incidence data, Cancer Incidence in Five Continents, compiled by the International Agency for Research on Cancer (IARC; Muir et al., 1987; Parkin et al., 1992). By the early 1990s, the cancer incidence data for the LSS cohort population were updated through 1987 and were of a sufficient quality and consistency that comprehensive risk analyses were warranted. In 1994, a series of LSS cancer incidence reports were published (Mabuchi et al., 1994; Thompson et al., 1994, Preston et al., 1994, and Ron et al., 1994a).
Current Cancer Incidence Data
Data Quality
Unlike mortality data that are routinely collected by established procedures throughout Japan, incidence data are generated by assembling information from multiple sources with varying degrees of diagnostic confirmation. Therefore, quality of data and consistency in collection and handling of data are the important concerns. The Hiroshima and Nagasaki Tumor Registries both employ an active case ascertainment with abstraction of medical records by hospital visitation as the primary means, augmented by data from the tissue registries. These data are linked with the RERF major samples through the Master File for identification of cancer cases in members of the samples. For members of the LSS, the data are further supplemented by death certificate data as well as data from a number of clinical and pathological programs which have been undertaken over the years at ABCC/RERF.
As measures of data quality IARC uses three numerical indices: (1) the proportion of cases registered with histologically verified diagnosis (histological verification, HV), (2) the proportion of cases registered from death certificates only (DCO), and (3) the mortality/incidence ratio (M/I) (Waterhouse et al., 1982). The DCO rate and M/I ratio provide a gauge of completeness of reporting, whereas the HV rate is considered a measure of accuracy of diagnostic data. Currently,
TABLE 7.2 Indices of quality in Hiroshima and Nagasaki Tumor Registries compared with other selected registries (males).
|
Registry (years) |
DCO(%)a |
M/Ib |
HV(%)c |
|
Hiroshima (1978–80) |
9 |
0.63 |
77 |
|
Nagasaki (1978–82) |
7 |
0.55 |
67 |
|
Osaka, Japan (1978–82) |
25 |
0.70 |
58 |
|
Miyagi, Japan (1978–82) |
15 |
0.67 |
67 |
|
Singapore (Chinese)(1978–82) |
7 |
- |
76 |
|
Israel (All Jews) (1978–81) |
6 |
- |
86 |
|
Ontario, Canada (1978–82) |
1 |
0.54 |
82 |
|
Seattle, USA (1978–82) |
1 |
0.49 |
93 |
|
Denmark (1978–82) |
1 |
- |
91 |
|
Hamberg, Germany (1978–79) |
30 |
0.76 |
54 |
|
a Death certificate only: percent of cases notified from a death certificate only. b Mortality/incidence ratio: ratio of mortality to incidence cases. c Histological verification: percentage of cases whose diagnosis is verified histologically. |
|||
the Hiroshima and Nagasaki Tumor Registry data show DCO rates of 7–9%, M/I ratios of about 0.50, and HV rates of about 70% or higher. As seen in Table 7.2, these are better than any other in Japan and comparable to those for many other established registries. The homogeneity of incidence data as measured by these and other indices of data quality across various substrata such as by age, time, and radiation dose revealed no indication of the presence of potential bias or confounding which may influence cancer risk estimates using the current data set (Mabuchi et al., 1994).
Solid Cancer Risk
Incidence data have several important advantages for risk assessment. Incidence data provide a complete picture of the spectrum of cancer outcomes, including both fatal and less fatal tumors. Even for fatal cancers, the survival time allows for timely identification of tumor occurrences. These advantages result in a substantial increase in the number of cancer cases ascertained, which in turn enhances statistical power for assessing the dose response as it is affected by various modifying factors. Although the collection of cancer incidence data began in 1958
TABLE 7.3 Observed and expected solid cancer incident cases, Life Span Study cohort, 1958–87.
|
Dose (Sv)* |
Subjects |
Observed |
Expected |
Excess |
|
<0.01 |
42,702 |
4,286 |
4,267 |
19 |
|
0.01-0.1 |
21,479 |
2,223 |
2,191 |
32 |
|
0.1-0.2 |
5,307 |
599 |
574 |
25 |
|
0.2-0.5 |
5,858 |
759 |
623 |
136 |
|
0.5-1 |
2,882 |
418 |
289 |
129 |
|
1-2 |
1,444 |
273 |
140 |
133 |
|
2.0+ |
300 |
55 |
23 |
32 |
|
Total |
79,972 |
8,613 |
8,106 |
507 |
|
* Dose (Sv) is the dose to the large intestine (colon). |
||||
and is limited to those residing in the tumor registry's catchment area, the number of incident cancer cases far exceeds that of mortality cases. For the period of 1958–87, the total number of solid cancer incidence cases (first primary cancers) in the Hiroshima and Nagasaki areas was 8,613, 25% more than the 6,887 mortality cases for the period of 1950–87 with no residential restriction (Thompson et al., 1994, and Ron et al., 1994a). Of these, about 500 incident cases are considered an excess due to radiation exposure (Table 7.3); this is 65% more than the 304 excess mortality cases. Because of the ability to capture less fatal cancers and to provide better diagnostic accuracy, the new incidence data have, for the first time in the LSS cohort, demonstrated significant excess risk for liver and non-melanoma skin cancers. The data have also provided updated information on the risk of thyroid, breast, and salivary gland cancers. While an improvement in accuracy and precision results in a refined site-specific risk assessment, it is also important to recognize that the lack of statistical significance for specific cancer sites does not necessarily mean the absence of radiogenic tumor response for those sites. It is remarkable that increased risk, albeit statistically insignificant for some sites, is seen for almost all types, perhaps with the exception of uterine tissues (Table 7.4).
One of the most striking findings from the solid cancer data is the linearity of the dose-response curve (Figure 7.1). The LSS cancer mortality data have also supported the linear dose response, but the linearity shown by the incidence data is remarkably unequivocal. This linearity is contrasted to the non-linear dose response for leukemia (Preston et al., 1994; Vaeth et al., 1992). The difference may reflect different underlying biological mechanisms for carcinogenesis and
TABLE 7.4 Observed and excess incident cancer cases, by site.
|
Cancer site |
Observed |
Excess |
|
Oral cavity and pharynx |
64 |
6 |
|
Esophagus |
84 |
5 |
|
Stomach |
1,305 |
85 |
|
Colon |
223 |
32 |
|
Rectum |
179 |
8 |
|
Liver |
283 |
31 |
|
Gallbladder |
143 |
3 |
|
Pancreas |
122 |
4 |
|
Lung |
449 |
85 |
|
Non-melanoma skin |
91 |
22 |
|
Female breast |
289 |
92 |
|
Uterus |
349 |
-12 |
|
Ovary |
66 |
12 |
|
Prostate |
61 |
4 |
|
Bladder |
115 |
19 |
|
Kidney |
34 |
5 |
|
Nervous system |
69 |
4 |
|
Thyroid |
129 |
33 |
leukemogenesis, the former being a multistage, multifactorial process, while the latter is more closely associated with chromosomal rearrangement.
The temporal patterns of cancer risk are of special importance in risk assessment. Table 7.5 shows the numbers of observed and excess solid cancer cases by age at exposure for four time periods. It is striking that almost half of the excess cases in the entire follow-up period were seen in the last 7 years, 1981–87, of the current follow-up. When examined by age at exposure, it is clear that most of the excess cases in the earlier periods were in those exposed at ages 20 years or older, whereas in the later periods more excess cases have been seen in those exposed at younger ages. Particularly noteworthy is the rapidly increasing number of excess cases for those exposed at very young ages, less than 10 years, emphasizing the importance of incidence-based follow-up for the young survivors as they enter ages where increased background cancer incidence rates are expected.
The risk for solid cancer based on incidence data demonstrates the well-known dependence on sex and age at exposure, as illustrated in the left panel in Figure 7.2 (Preston, 1995). This figure shows that the excess relative risk (ERR) for solid cancer among those exposed as adults has been nearly constant over the current
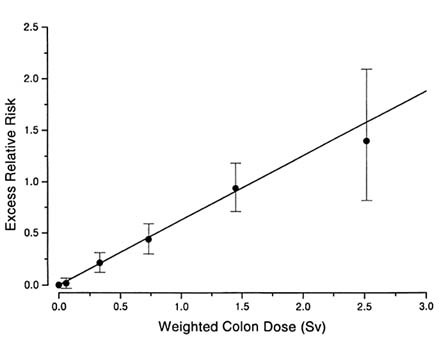
FIGURE 7.1 Dose-response for solid cancers. LSS incidence data, 1958-87.
follow-up period, whereas the ERR for those exposed as children has been decreasing in the recent years following the very high level in the early years. The ERR for women is about twice as high as for men. In terms of excess absolute rate (EAR) per unit dose, the sex difference is less striking for those exposed as adults (right panel in Figure 7.2), as has been shown by the mortality data. However, the sex difference in EAR remains large for those exposed as children; this is different from the mortality results and may reflect the inclusion of a large number of incident cases of thyroid, breast, and skin cancers, the risk of which is especially increased among those exposed at young ages. In general, it is important to note that although the ERR for those exposed as children shows a declining trend, the EAR for these survivors continues to increase with time, as background rates increase with advancing age. These patterns are essentially comparable to those for cancer mortality risk, and emphasize the importance of further follow-up, especially for those exposed during childhood.
Through the tumor registry multiple primary tumors can also be ascertained in a systematic manner. The analysis of the latest cancer incidence data was restricted to first primary tumors. The main reasons for this restriction were (1) that patients who developed tumors may be more likely than others to be followed
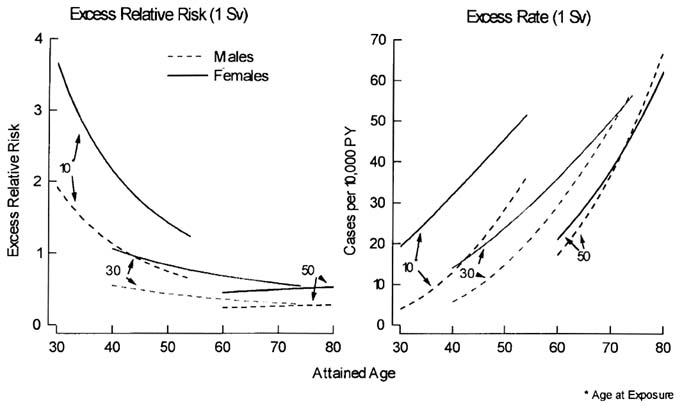
TABLE 7.5 Observed and excess incident solid cancer cases, 1957–87.
|
|
Calendar period |
|
|
|
|
|
|
|
|
|
1957–65 |
|
1966–75 |
|
1976–80 |
|
1981–87 |
|
|
Age ATB* |
Obs. |
Excess |
Obs. |
Excess |
Obs. |
Excess |
Obs. |
Excess |
|
0 - 9 |
19 |
1.7 |
63 |
- 1.4 |
75 |
6.9 |
208 |
40.3 |
|
10 - 19 |
76 |
11.7 |
245 |
54.2 |
203 |
27.7 |
469 |
84.9 |
|
20 - 29 |
137 |
19.0 |
290 |
3.0 |
237 |
10.4 |
462 |
31.1 |
|
30 - 29 |
326 |
42.6 |
575 |
-29.0 |
418 |
-0.7 |
707 |
50.4 |
|
40 - 49 |
573 |
13.7 |
982 |
38.8 |
473 |
15.0 |
489 |
30.4 |
|
50+ |
793 |
31.5 |
611 |
25.6 |
133 |
9.9 |
49 |
-11.2 |
|
Total |
1924 |
120.2 |
2766 |
91.3 |
1539 |
69.2 |
2384 |
225.9 |
|
* ATB denotes age at time of bombing. |
||||||||
closely and thus to have better chances of second tumors being detected, and (2) the possible confounding and/or modifying effect of some cancer treatment modalities. Currently analyses are undertaken to assess the risk of second primary tumors in the LSS sample. There is much evidence of an elevated cancer risk in patients who have received radiation treatment, sometimes in combination with chemotherapy, for various types of cancer. These data have been useful for risk assessment, but a potential bias due to inclusion of susceptible individuals is some concern. The second primary cancer study in the LSS sample should provide much needed population-based data on background second cancer risk and the magnitude of second cancer risk associated with radiation exposure.
The tumor registry data have several limitations, the most important of which concerns migration of the study subjects. Over the years, a considerable number of subjects in the LSS sample (estimated to be more than 20%) have moved out of the catchment areas of the Hiroshima and Nagasaki Tumor Registries. It is therefore necessary to adjust for migration when using the tumor registry data for assessing cancer risk in the LSS. In a previous study of breast cancer incidence (Tokunaga et al., 1987), all cases including those diagnosed outside the Hiroshima and Nagasaki areas were included, but adjustment was made for incomplete reporting of those who migrated out of the area. In the current report, cases were restricted to those residing in the area and person-years were adjusted to allow for the migration effect, as described by Sposto and Preston (1992). An alternative and more direct approach would be to obtain residential data for each LSS subject. Work is in progress to create an address database for the LSS using information from previous mail surveys and other sources available at RERF. Such individual data can be used
in the future to compute the person-years at risk. The address data should also be helpful in finding incident cases in the areas to which individuals are known to have moved and where active population-based registries are available.
Another important limitation arises from that fact that the tumor registry operation began in 1957 in Hiroshima and 1958 in Nagasaki. Currently work is under way, in some of the site-specific studies, to reconstruct cancer incidence data for the pre-registry years using early pathology and hospital documents that are still kept at University and some other hospitals. As there already was a significant excess in solid cancer in the first 20 months of the tumor registry, from May 1957 through December 1958 (Harada and Ishida, 1960), it is likely that there was also some excess solid cancer risk, albeit presumably small, before that time.
Related Cancer Studies
In addition to the role that the tumor registry incidence data play in risk assessment, the functional tumor registries have greatly facilitated the conduct of many epidemiological investigations which have led to further understanding of how cancers are induced by radiation exposure, possibly in combination with other etiologic factors. Several important new studies have been initiated and will be conducted in the future.
Among the most active projects at the present time is a series of site-specific cancer studies. The tumor registry represents the collection of diagnostic data from various sources spanned over many years. Such data reflect diagnoses made by many different physicians using diagnostic standards acceptable at the time of practice. Under the established guidelines (Tokunaga et al., 1988), several important site-specific cancer incidence studies have been undertaken. Case ascertainment has been undertaken through the Hiroshima and Nagasaki Tumor Registries, but histopathological verification of diagnoses is being achieved by a panel of designated pathologists, and tumor types are being classified using internationally accepted tumor classification systems. The pathology panel consists of pathologists who specialize in specific types of cancer in Hiroshima and Nagasaki. The Hiroshima and Nagasaki Tissue Registries facilitate these studies by allowing access to pathology slides needed for pathology review.
The major advantage of site-specific studies is the capability to study specific questions under strictly controlled conditions. A liver cancer study now in progress serves as an example of what can be achieved by site-specific studies. Since diagnostic misclassification is a major concern for liver cancer, the primary objective of the liver cancer study is to assess the relationship between atomic bomb radiation and liver cancer based on data confirmed by a panel of pathologists. Another arm of the liver cancer study is a case-control study nested in the cohort. The possible role of hepatitis B (HB) virus and hepatitis C (HC) virus infection is investigated, while the pathology review is extended to include diagnosis of any accompanying
liver cirrhosis and identification of HBV, and molecular techniques are used to characterize the HB and HC viruses.
Other site-specific studies underway include such sites as breast, salivary glands, skin, thyroid, ovary, central nervous system, breast, lung, and lymphoid tissues. Some of these studies have been initiated because of the well-recognized variability in diagnoses (skin cancer, salivary tumors, thyroid cancer, lymphoid tumors), while other studies focus on specific histologic types (basal cell skin carcinoma, neurolemmoma of the neural tissue), tumor locations (lung cancer), or both benign and malignant tumors (salivary tumors, thyroid tumors, neural tumors, ovary tumors). For some sites—such as lung, skin, breast—molecular studies are also carried out to characterize the nature and spectrum of mutations at oncogenes and tumor-suppresser genes.
Among the studies of increasing importance in the future are those involving characterization of molecular changes using archived tissue samples. A pathology program, which was started at the inception of ABCC, has undergone several major revisions. The autopsy program, a mainstay of the RERF pathology program, had long been quite active but was terminated in 1988; the surgical program, another major program, was also active before it was replaced by the tissue registries starting in 1973. Through these programs, a large number of archived tissues have been collected. These archived tissues have been found to be useful for molecular biological studies which are now beginning to play an important role in addressing biological issues of current interest. Now that these pathology programs are no longer active, it is expected that the tissue registries will become an important source of tissue materials for molecular biological studies.
Conclusions
The long-term follow-up of the Life Span Study cohort has been a major source of epidemiologic data for risk assessment. The evidence based on the latest cancer incidence data and mortality data (Pierce et al., 1996) suggests that the excess solid cancer risk persists many decades after the exposure and will probably remain elevated throughout life. This means that the number of excess cases will continue to increase, possibly more rapidly than before, as the younger cohort members enter older age categories. At the present time, more than half of the LSS cohort members are still alive. Lifetime follow-up has been almost completed for those exposed to the bomb at ages over 50, but more than 90% of those exposed during childhood are alive. Therefore, risk projection based on the incomplete follow-up of the subjects, especially those exposed as children, presents the major uncertainty in risk estimates. A further follow-up, say for another two or three decades, will be critical in obtaining more definitive data on the temporal patterns of solid cancer. For the future follow-up, cancer incidence data will become an increasingly more important addition for risk estimates. Because of the advances in cancer treatment
in recent years, a larger number of cancer patients survive longer. Although mortality data may become less valid as the outcome measure of cancer risk, death will continue to serve as an essential and useful endpoint.
In discussing the purposes and uses of cancer registries, Jensen and Storm stated that ''the cancer registry provides a crucial basis for epidemiology since it holds information on the distribution of cancer, including non-fatal cases." Further, "the collection of records of cancer patients from a defined population facilitates the in-depth study of cancer in individuals minimizing the selection bias" (Jensen and Storm, 1991). For epidemiological studies on cancer, the functional tumor registry is essential, and through well-designed and well-conducted epidemiological studies it will be possible for us to obtain further biological insights. Rapid advances in our understanding of cancer will also demand new types of research. The tumor registries will play a pivotal role in meeting advancing research needs in a timely manner.
| This page in the original is blank. |