Effects of Ionizing Radiation: Atomic Bomb Survivors and Their Children (1945-1995) (1998)
Chapter: 5 Statistical Aspects of RERF Cancer Epidemiology
5
Statistical Aspects of RERF Cancer Epidemiology
DONALD A. PIERCE
Summary
Here I will trace the major steps in the evolution of statistical methods used for the RERF cancer data since about 1960, and then indicate the general nature of our current descriptions of the excess risks for solid cancer as a class. From about 1960 to 1975 "contingency table" methods were the primary basis for analyses. These methods were remarkably modern and sophisticated for their time, and served the needs well. However, these provided mainly for significance tests for the existence of radiation effects, and did not extend well to the developing needs for estimation of these effects. During about 1975 to 1980, rather different methods were employed for estimation of radiation effects, largely in the course of work for the BEIR III report. These methods were well suited for estimation of the risk per unit dose, for making inferences about the shape of the dose-response curve, and for making simple comparisons such as between sexes or broad age-at-exposure groups. However, the methods did not extend well to analysis of temporal patterns in the excess risk: effects of time since exposure and age at risk. Beginning in about 1980 major advances were made in adapting for RERF needs revolutionary recent developments in analysis of survival data—methods that came to be called "relative risk regression." These were highly suitable for investigation of temporal patterns of excess relative risk: age-specific excess risks relative to natural background risks. Since about 1992 it has become increasingly apparent that the focus on relative risks was excessive, and that it is at least equally important to describe temporal patterns of absolute excess risk, and their relation to age at exposure and sex. Today there is much more importance attached to this description, and I suggest that it will become increasingly valuable in understanding the patterns in
the data. In conclusion, some comparison is given of the actual nature of relative risk and absolute risk descriptions for the data on solid cancers as a class.
Introduction
Reviewing the evolution of the statistical methods used may be helpful in understanding current analyses of the RERF data on excess cancer risk.
In the next section I will present my view of this evolution of methods, beginning with an overview. The statistical methods used in each of the time periods discussed—1960–1975, 1975–1980, 1980–1992, and 1992–present—were statistically modern for their times and in each period were well suited to the needs at that time in view of what could be learned from the existing data. The evolution of the methods from one era to the next reflected both new possibilities for fuller understanding of the cancer risks brought about by the increasing accumulation of data, as well as major progress in relevant statistical methods and computer software.
In the final section I will give a brief overview of recent analyses of the data, taken largely from Life Span Study Report 12 (Pierce et al., 1996). It is my hope that these recent results will clarify some of my meanings in the discussion of the evolution of the statistical methods, and that placing these current results in that perspective will make them clearer.
Evolution Of Statistical Methods
From roughly 1960 to 1975 the primary methods were those called "contingency table methods." See, for example, Beebe et al. (1978). These statistical methods, developed by Beebe, Jablon, and Charles Land, were thoroughly modern and sophisticated for their time. However, as attention turned from testing for a dose effect to quantitative estimation of its extent, these methods became inadequate. From about 1975 to 1980 estimation methods were developed and used by Land and Beebe, largely for the NAS BEIR III report (NRC, 1980). However, as the follow-up lengthened, these methods in turn became inadequate due to lack of systematic consideration of age-time patterns of the background and excess cancer risks. At about that time there were remarkable advances in biostatistics relevant to this need, and in the early 1980s further methods were developed at RERF along lines of what is now called relative risk regression. Again RERF was in step with the most modern approaches. Preston developed remarkable computer software for implementation of this (Preston et al., 1993), which is not only the basis now for all cancer analyses at RERF, but is widely used around the world for such work. Since about 1985 this relative risk regression has been used at RERF to obtain far more effective and detailed inferences from the cancer data, especially in regard to temporal patterns of the excess risk. See, for example, Preston and Pierce (1988), Shimizu et al. (1990), and many other RERF reports of that era.
Finally, in recent years there has been another major development—the realization that clearer understanding of the excess cancer risks may come from less emphasis on excess relative risks, and more on the excess absolute risks. This is discussed in the most recent of the periodic reports on these data: Life Span Study Report 12 (Pierce et al., 1996). I will now outline all these developments in a little more detail.
The basic idea of the contingency table approach was to divide the cohort into strata defined by city, sex, and age-at-exposure categories. Within each of these strata the ''expected numbers" of cancer deaths in dose categories were obtained by allocating the total observed number according to the dose-specific person years (PYR) at risk. This corresponds to the expected numbers of cancer deaths in dose categories, under the hypothesis that the radiation exposure had no effect. Then, still within each stratum, one could consider by dose category the differences (Od - Ed) between observed and expected numbers of cancer deaths. If there is a dose effect, these should display an increasing trend with dose, which can be summarized by the trend statistic: ![]() d(Od - Ed). The essence of the contingency table approach is to then sum these stratum-specific trend statistics over all the strata. The theoretical details of this are statistically interesting, and it is a very good way to test for a dose effect. The problem is that it does not extend well to estimation of the effect once it is clear that there is one. The primary reason for this limitation is that the expected numbers Ed as defined above are not what would be expected in the absence of radiation exposure, but rather if the exposure had no effect. Consequently, the (Od -Ed) do not really indicate the excess cancer due to radiation.
d(Od - Ed). The essence of the contingency table approach is to then sum these stratum-specific trend statistics over all the strata. The theoretical details of this are statistically interesting, and it is a very good way to test for a dose effect. The problem is that it does not extend well to estimation of the effect once it is clear that there is one. The primary reason for this limitation is that the expected numbers Ed as defined above are not what would be expected in the absence of radiation exposure, but rather if the exposure had no effect. Consequently, the (Od -Ed) do not really indicate the excess cancer due to radiation.
After some valiant but unsuccessful attempts to work around this limitation within the contingency table approach, a quite different approach for estimation was taken, largely for analyses for the NAS BEIR III report. This was in principle quite simple, based on fitting by weighted least-squares regression-type models of the form
where the left-hand side represents rates within dose categories, α represents the intercept term, β denotes the contribution of doses, d, is the excess risk, and ![]() is the error term. This was done both for the entire cohort, and within strata of sex and age at exposure. To my knowledge no consideration was given to following the contingency table approach of estimating parameters within such strata, and then combining these results over strata. Rather, when within-stratum estimates were made, this was more for the purpose of comparing them than combining them. Models quadratic rather than linear in dose were also used, especially for leukemia. There were two limitations to this approach, one of which was just mentioned regarding strata. The other, also present in the contingency table approach but becoming more important with the lengthening follow-up, has to do with age-time variations in risk. There are two issues involved in this second limitation:
is the error term. This was done both for the entire cohort, and within strata of sex and age at exposure. To my knowledge no consideration was given to following the contingency table approach of estimating parameters within such strata, and then combining these results over strata. Rather, when within-stratum estimates were made, this was more for the purpose of comparing them than combining them. Models quadratic rather than linear in dose were also used, especially for leukemia. There were two limitations to this approach, one of which was just mentioned regarding strata. The other, also present in the contingency table approach but becoming more important with the lengthening follow-up, has to do with age-time variations in risk. There are two issues involved in this second limitation:
- the rapid increase of background cancer rates with age (or follow-up time for this fixed cohort), making it statistically important to estimate the excess risk fundamentally by comparing dose groups among persons of about the same age;
- the specific need to investigate the age-time patterns in the excess cancer risk.
-
I should say that the extent to which (1) is a serious issue in a cohort study where everyone is aging together involves delicate statistical issues which cannot be addressed here, and in particular whether one is estimating the absolute or relative excess risks. However, regardless of the importance of point (1), the method just described did not lend itself well to study of the temporal patterns of excess risk, which was becoming a more important issue as the follow-up lengthened.
As mentioned earlier, there was in the late 1970s a revolutionary advance in biostatistics bearing directly on these considerations. By 1980 RERF statisticians were adapting the new methods for application to the Life Span Study, and what follows is closer to their adaptation than to the original advance. The fundamental idea can be seen by extending the regression approach indicated above to a stratification based on both dose and age. By "age" here is meant attained age, rather than age at exposure. Thus, stratification on this variable involves stratifying the cohort experience rather than its subjects. Then we may consider extended regression models such as

The remarkable thing is that the parameter β can be estimated without considering specifics of the age-specific background rate function B(a). Essentially this is because an estimate of β for each age stratum can be obtained from ratios of the left-hand side at various doses but for that fixed age, and then these estimates can be averaged over the age categories, since β does not depend on age. This is in fact an extension of the stratification principles of the contingency table methods, an extension to stratification on age at risk. A primary reason why the development of relative risk regression was considered so elegant and important by the statistical community is that, as with most important ideas, it extended some well-established principles and formalized methods which had already seen some use by the most insightful workers.
Now what is estimated from the above model is the excess relative risk (ERR), rather than the excess absolute risk (EAR) as in the previous model. That this can be done so elegantly and simply was, and is a primary reason for the subsequent emphasis placed on relative risks, not only at RERF but in all of epidemiology. Extending this approach to models quadratic in dose presents no difficulties. More importantly, extending it to allow the parameter beta to depend on sex and age at exposure does not interfere with the basic idea, since with a suitable mathematical
model or further stratification, inferences may still be based on ratios within fixed age groups, thereby "eliminating" the function B(a).
In fact, although with some loss of elegance and ideal statistical properties, it is possible to allow the parameter β to depend to some extent on age as well. Thus what is actually used at RERF are regression models of the form
where s denotes strata related to city, sex, and age at exposure. ERR (s, a, d) refers to a mathematical model for the ERR which may vary with strata, age, and dose, with the dose dependence often but not always taken as linear. The function B(a) cannot be entirely eliminated when the ERR is modeled as depending on age, but as long as the age effects are modestly formulated this does not cause serious difficulties. Moreover, for solid cancers the models ordinarily used do not require allowing the ERR to vary with age, and the formulation with ERR depending on this serves mainly for testing the age-constancy of the ERR. Various parametric models are used for the excess relative risk function ERR (s, a, d). It has become routine in this way to study the effects of "modifying factors" in relation to dose, namely city, sex, age at exposure, and attained age. These are very powerful statistical methods—perhaps too powerful, in that they increase the chance of overinterpreting the data. Asking the "right questions" becomes the critical issue when analytical methods rather outrun the extent of actual information in the data.
This brings us to developments of the most recent era, about 1992 to present. It has become increasingly clear that there are serious limitations in the focus on the ERR as opposed to the excess absolute risk (EAR). One that has been realized for quite some time pertains to the solid cancer ERR for women being about twice that for men, which is potentially misleading. That is, it should be realized that women have about half the background cancer rate as men, and indeed the EAR is about the same for the sexes. It is clearly wrong, even though common in epidemiology in general, to simply think of the ERR as "the risk." In a more subtle and complex way, this issue arises in interpreting the effect of age at exposure. Generally speaking, those exposed as children have shown a much higher ERR over the follow-up than those exposed as adults. This is commonly interpreted as meaning that children are "more sensitive" to radiation in regard to induction of cancer. But this large ERR for children is actually the result of dividing a quite small EAR by the even smaller background cancer risk for young ages. However, as noted, this issue is far more subtle than that involved in the sex-specific ERRs. Describing the EAR involves fitting regression models of the form
which can be done, but with a substantially different statistical approach that involves formulating parametric models for the background rate B(s, a). A most important point to understand is that the issues do not involve whether one can fit the data better with Equation 5.4 than with Equation 5.3. When the specific models
used for ERR(s, a, d) and EAR(s, a, d) are sufficiently rich and well-selected, the fits to the data will be about the same, and in fact the resulting product B (s, a) ERR(s, a, d) will be similar to the function EAR(s, a, d). What really differs in the choice of models Equation 5.3 or Equation 5.4 is what is being described, rather than how well the data are being fitted.
To say that either approach is better would mean that the description it provides is more useful. An important issue in evaluating this is that there are at least two rather different uses of the cancer data: (1) in making radiation protection decisions, and (2) in providing a more fundamental understanding of the nature of radiation-induced cancer. Of course, the latter understanding is important in radiation protection decisions as well, but it is useful to separate a sort of empirical assessment of radiation risks from actually understanding them. In this sense some issues in (1) involve projection of risks for this cohort beyond current follow-up, estimating lifetime risks for specific ages at exposure and sex, transporting these risk estimates to other cultures where background cancer risks are different, and so forth.
Simplicity is always an important aspect of a model's usefulness. Description of the ERR has a simplicity which is particularly important for use (1) above. Aside from those exposed as children, we can quite adequately describe the ERR for solid cancers as a constant value for all remaining lifetime (after some minimal latent period), depending on age at exposure and sex. This simplicity is very convenient, both for subsequent calculations and simply for summarization purposes. However, we believe that such a description may be very poor indeed for understand what is really going on.
The dominant feature of an EAR description for solid cancer is a very strong increase with age. There is some question whether this increase is really due to age or to time since exposure, and trying to make such a distinction is a large part of what is challenging about the nature of the data. For the moment, let us say that the increase is best thought of in terms of age. The other important feature of the EAR description is that there is relatively little dependence on sex or age at exposure. But even when these two factors are ignored, there is no doubt that for descriptive purposes the EAR model is rather less convenient than the age-constant ERR description. That is, to say for example that for solid cancers the ERR per Sv following exposure is about 38% for males exposed at age 30 is far simpler than to describe how the EAR increases with age.
Some Recent Results
I will finish with a brief presentation and discussion of recent analyses of the excess risk for solid cancer mortality in the RERF cohort, given in more detail in Life Span Study Report 12 (Pierce et al., 1996). There are certainly problems involved in considering together all solid cancers, but as the data are much weaker for specific cancer sites, much of what can be learned about age-time patterns of the excess risk
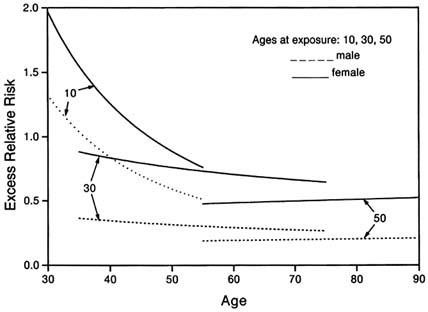
FIGURE 5.1 Solid cancers: excess relative risk per Sv.
must at least begin with such oversimplification. The excess risk for solid cancers is very linear in dose up to about 3 Sv organ dose, and so describing risk per unit dose is adequate.
Figure 5.1 portrays the ERR for solid cancers as a function of age. These risks could be plotted against time since exposure, but the use of age has the advantage of emphasizing that the follow-up for different ages at exposure has been for different stages of lifetime. There are 3 pairs of curves, one each for ages at exposure of 10, 30, and 50 years, and the distinction within pairs being by sex. As noted earlier, the ERR for women is about twice that for men, but this should probably be thought of only as reflecting that the women have about half the background cancer mortality. For ages at exposure 30 and 50, the ERR has been very constant in age and time throughout the follow-up to date, although at somewhat different levels. For those exposed as children the ERR has decreased sharply over the follow-up period. It should be understood, however, that the evidence pertaining to this decrease is rather weaker than Figure 5.1 might imply. The decrease is only marginally statistically significant (p = .06 for a two-sided test). Certainly, it is too soon to draw firm enough conclusions about the nature of the decrease to be able to project what the future may hold.
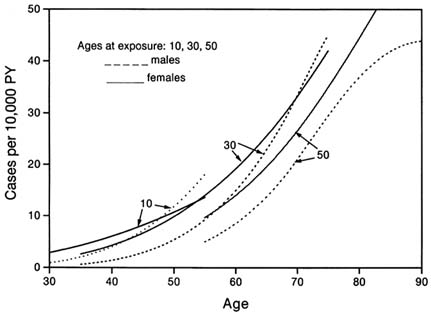
FIGURE 5.2 Solid cancers: excess absolute risk per Sv.
Figure 5.2 portrays the EAR in the same manner. There is at best very weak evidence that the different curves are estimating any differential true effects by sex or age at exposure. The important aspects of this description are that the EAR increases with age for all ages at exposure and both sexes, and that one would not be very seriously misled to consider all the curves in the figure to be estimating a single curve that depends only on age. If one estimated such a single curve for the EAR and then computed from it the corresponding ERR curves, the result would be roughly a pair of decreasing curves for each sex, decreasing in age but with no (or small) age-at-exposure effect. Such a pattern can indeed be seen, at least roughly, in Figure 5.1. This corresponds to an interesting hypothesis raised by Kellerer and Barclay (1992), in a paper that is important for its highly sensible discussion of issues in interpreting the RERF data. Their suggestion is that what is usually considered an age-at-exposure-dependent ERR effect, constant in age (excluding children), could also be considered an ERR decreasing with attained age, with no age-at-exposure effect.
It will almost certainly develop in time, whether it is an issue now or not, that there are statistically significant distinctions between the curves shown in Figure 5.2 However, it may become more important as the study progresses not to let such statistically significant differences interfere inordinately with understanding
the data. Science is not primarily the analysis of complexity, but rather trying to understand phenomena through intentionally simplified hypotheses and descriptions of observational data. This is most important in very large studies involving complicated phenomena, where there will always be statistically significant departures from simple models due simply to the size of the study. Recognition of this seems likely to become increasingly important regarding the RERF data.
Acknowledgments
I would like to thank Gilbert Beebe, Seymour Jablon, Charles Land, and Jack Schull for introducing me to this work, and for their contributions leading to the state of what has been discussed here. I also want to thank Dale Preston and Michael Vaeth for invaluable collaborations with me in this area. Permission to use Figure 5.1 and 5.2 here has been granted by Radiation Research. The Radiation Effects Research Foundation (formerly ABCC) was established in 1975 as a private nonprofit Japanese foundation, supported equally by the government of Japan through the Ministry of Health, and the government of the United States through the National Academy of Sciences, under contract with the Department of Energy.
| This page in the original is blank. |