Effects of Ionizing Radiation: Atomic Bomb Survivors and Their Children (1945-1995) (1998)
Chapter: 17 Evolution of the Glycophorin A Assay for Measuring Biological Effects of Radiation on Humans
17
Evolution of the Glycophorin A Assay for Measuring Biological Effects of Radiation on Humans
RONALD H. JENSEN AND DANIEL H. MOORE II
Summary
The glycophorin A–based somatic cell mutation assay was originally created to measure the amount of damage that occurred in each individual as a result of exposure to mutagenic phenomena. Early in its existence, this assay was applied to blood samples obtained from A-bomb survivors and found to display a correlation with the amount of ionizing radiation exposure. Over the years, the glycophorin A assay has been improved, and the quality of the improvements have been determined by performing analyses of samples from A-bomb survivors to define dose response, variance, and persistence of effects. As it has now developed, the glycophorin A assay is rapid and easy to perform, with variance better than any other biodosimetry assay, and requirement of only very small blood samples. It serves as a lifetime biodosimeter that can be used to monitor large human populations for biological effects of radiation exposure and should be useful for predicting increased cancer risk in high-risk populations.
Introduction
This review begins only ten years ago, since the capability to perform the glycophorin A–based somatic cell mutation assay was first developed in 1986. Nevertheless, even though the time frame is small, the studies of samples from A-bomb survivors have had a large impact on the development of our analytical procedures.
Basis of the Assay
Glycophorin A (GPA) is a human blood type antigen that appears on the surface of red blood cells (erythrocytes) in two common forms, called the N and M allelic forms. Since the gene for this blood type antigen is inherited in a conventional Mendelian mode, 50% of the population expresses the heterozygous blood type NM. Essentially all the erythrocytes in individuals who are NM blood type contain both GPAN and GPAM on their surface. However, if a cell in the bone marrow is impacted with ionizing radiation at the glycophorin A gene (Figure 17.1), one of the two allelic forms of the GPA gene could be inactivated. As a result, all progeny of this cell would express only one of the two forms. In the example shown, the GPAM allele has been inactivated, and, since the sister chromosome has not been affected by the ionizing radiation, GPAN is expressed normally on all the progeny of this mutant cell. When these progeny cells mature and are secreted into the peripheral blood, they appear as variant erythrocytes, called NØ or N-null cells. In order to detect the presence of such cells, a fluorescence immunolabeling technique was developed. The ideal form of this technique is to isolate two different monoclonal antibodies, each of which is specific for one of the two allelic forms of GPA. Then these antibodies are labeled with fluorescent conjugates so that immunostaining of erythrocytes from a heterozygous (GPANM) individual would yield primarily double-stained cells. Those cells which are variants (NØ in the figure) would be single-stained, and the somatic cell mutation assay would be performed by carefully enumerating the frequency of single-stained erythrocytes in each individual. This requirement for expression of one of the two allelic forms of GPA provides an internal control which prevents mis-identification of degraded erythrocytes, which may have damaged membranes or cell surfaces, as being progeny of mutant bone marrow cells.
Evolution Of The Assay
1W1: The First Glycophorin A Assay
Description
The original version of the glycophorin A assay suffered from precision difficulties in enumerating variant erythrocytes, since they are very rare events. During the early period of developing this assay, the techniques for isolating specific antibodies for particular antigens were only beginning to be devised. Since the two allelic forms of GPA differ only by two amino acids in a sialoglycoprotein of molecular weight 36,000 daltons, we were unable to isolate an antibody that would label cells which contain GPAN only. Thus, the first assay utilized one monoclonal antibody that was specific for GPAM (this antibody was named 6A7), but the second antibody (named 10F7) recognized both allelic forms of glycophoria A. Thus, the assay could determine the loss of GPAM but not GPAN. For this reason
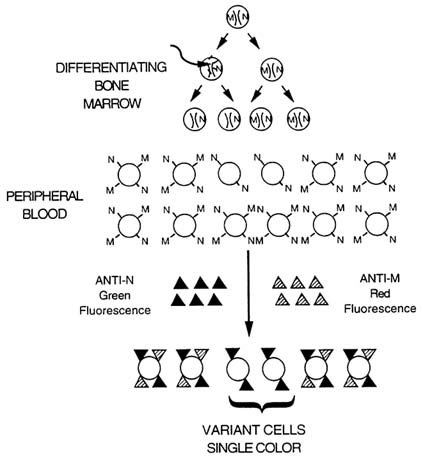
FIGURE 17.1 Schematic of the basis for the glycophorin A somatic cell mutation assay.
it was named the one-way-one (1W1) assay (Langlois et al., 1986). This was not a major defect, in that one would expect to obtain an equal frequency of both variant cell types, and enumeration of only one type should reflect the frequency of bone marrow mutant events.
A second technical problem of the times was a more difficult defect in the analysis procedure. At the time there existed only a small cadre of well-characterized fluorescent labels for immunofluorescence, so that the only two labels which were
available for this application were fluorescein and Texas red. These gave well-resolved color separation of the signals, but required very different excitation wavelengths to obtain bright signals. Since the assay needed to enumerate hundreds of thousands of erythrocytes, the technique of choice was to perform high-speed flow analysis. In order to perform such analysis with two very different excitation sources, we used dual-laser-beam cell sorting, a very sophisticated and technically difficult analytical procedure. To obtain reproducible results, the single-labeled variant cells were sorted onto microscope slides and enumerated visually under a fluorescence microscope. The primary reason for this manual counting was that fluorescent artifacts were detectable in the stained erythrocyte suspension at a high enough frequency to introduce significant errors in the variant cell frequency if the flow sorter was used as a counting device. Using fluorescence microscopy, one could eliminate these false positive signals by enumerating morphologically identifiable erythrocytes.
Application to A-bomb Survivors
In collaboration with scientists from the Radiation Effects Research Foundation (RERF) in Hiroshima, we were able to demonstrate at Lawrence Livermore National Laboratory (LLNL) the first somatic cell mutation dose response of radiation exposure to humans on a population of Hiroshima A-bomb survivors (Langlois et al., 1987). This population was composed of 43 proximally exposed individuals and 20 survivors who were outside the exposure zone at the time of the A-bomb. The dose response appeared to be a linear function but with large variance among the data points, such that any of several response functions (including logarithmic or linear-quadratic) could fit the data equally well. At the time (1986–1987) the estimated dose was based on T65DR, but shortly thereafter DS86 was calculated for the individuals in our study. The resultant dose response was determined to be:
SBS Assay
Description
Shortly after this study was completed, our collaborators at RERF developed a new glycophorin A flow analysis so as to perform the assay on a large number of A-bomb survivors in Hiroshima (Kyoizumi et al., 1989). The major change in this second of the GPA assays was the use of a newly available fluorophor, phycoerythrin. This fluorophor can be excited at the same wavelength as can fluorescein (488 nm) and emits fluorescence at a long enough wavelength (580–590 nm) to be separated from fluorescein emission (520–530 mm) using dichroic mirrors, band pass filters, and electronic signal compensation. As a result a single-beam laser sorter could be used for the analysis. As in original assay, the SBS assay
used 6A7, which was conjugated with biotin, and a secondary avidin reaction for attaching the fluorophor, but this time with avidin-phycoerthrin.
Application to A-bomb Survivors
At RERF our colleagues used this single-beam sorter (SBS) assay to perform analysis on 62 exposed Hiroshima A-bomb survivors to obtain a dose response of
This is very similar to what was obtained for the 1W1 assay in our original analysis, and was further substantiated by running the 1W1 assay in parallel on 39 of these exposed donors plus 15 unexposed controls, with a correlation between the two assays of R2 equaling 0.91.
BR6 Assay
Description
The next step in the evolution of the GPA assay was an improvement in eliminating false positive events by using a new monoclonal antibody which specifically recognized GPAN. This antibody (named BRIC 157) was isolated and characterized by Anstee et al. (1988). At LLNL we conjugated this antibody with fluorescein and used it in combination with the GPAM-specific antibody, 6A7, to perform an analysis on a FACScan flow cytometer (Langlois et al., 1990). The new assay was termed BR6 as an acronym for the two antibodies (BRIC 157 & 6A7). Parallel measurements were performed using this assay and the 1W1, dual-beam flow sorter assay on blood samples from unexposed donors to show that the assays gave comparable variant cell frequencies, and that the new assay showed improved measurement precision. For Nϕ variant cells, the group coefficient of variation for the 1W1 assay was 64%, while for BR6 the CV was 30%, a significant improvement. Another advantage of the new assay was the fact that it could be performed without cell sorting. This resulted in two improvements: (1) the new assay was less labor-intensive, since sorting is a long and tedious procedure, and microscopic enumeration is very labor-intensive; and (2) a higher precision in counting statistics could be obtained. The FACScan can perform analysis at 4,000 cells per second, while the cell sorter can be operated at a maximum of 1,000 cells per second. Using the BR6 assay, we analyzed 5 × 10⁶ cells per sample, whereas the 1W1 and SBS assay could analyze only 5 × 10⁵ cells per sample.
Application to A-bomb Survivors
To confirm that the BR6 and SBS assays were in agreement, a collaborative study between RERF and LLNL was again performed on identical blood samples from Hiroshima A-bomb survivors (Langlois et al., 1993). In this study, samples were
obtained from 33 proximally exposed subjects (estimated DS86 doses ranged from 0.53 to 4.95 Gray). The SBS assay was performed at RERF and the BR6 assay at LLNL. With this population study, the dose responses were:

As can be seen by comparing these equations, the assays again agreed nicely within their variance limits.
Comparison to Cytogenetics
At the same time that the glycophorin A assay was being improved, cytogenetic analysis was evolving in a collaborative fashion between RERF and LLNL. Historically, scientists at RERF had been performing chromosomal aberration analysis on metaphase chromosomes of lymphocytes obtained from A-bomb survivors and had acquired a large dataset indicating a significant dose response for this biological endpoint (Stram et al., 1993). At LLNL the human genome project had been developing a chromosome-specific human DNA library carried by a bacterial vector (Collins et al., 1991). Using this library, cytogeneticists were able to apply fluorescence in situ hybridization (FISH) of chromosome-specific DNA to human metaphase chromosomes and perform chromosomal aberration analysis in a rapid and quantitative fashion with fluorescence microscopy (Lucas et al., 1989). In a collaborative effort to compare this new technique with the already established cytogenetic analysis, the scientists at RERF performed conventional translocation frequency measurements, and those at LLNL performed FISH translocation frequency measurements on the same samples. The results of this comparison showed that the two cytogenetic analyses agreed with each other, with R2 equalling 0.92, indicating that they are indeed measuring similar phenomena (Lucas et al., 1992).
Since the collaborative cytogenetic study was occurring at the same time as was the collaborative glycophorin A comparisons, the same blood samples were used for all four assays. Thus, the results for somatic mutation assays can be compared in precision with those obtained with aberration assays. Here we perform a comparison between the results from FISH translocation analysis and those of the BR6 assay. In order to compare these results, a best-fit function for the two datasets was derived and found to be a logarithmic translocation of the response data. After performing a log-linear regression analysis on each of the datasets, we performed inverse regression (Draper and Smith, 1981) to determine how well each assay could be used to predict dose. The results (Table 17.1) show that the two assays displayed very similar precision.
All the data that have been gathered on GPA analysis of blood samples from A-bomb survivors indicate that this assay shows effects from radiation long periods of time after exposure. The time since exposure for these blood donors has ranged
TABLE 17.1 Comparison of 95% confidence intervals (CI) for dose estimated by inverse regression of log-response on dose.
|
|
|
|
95% CI (Gy) |
|
|
Dose (Gy) |
TLa |
N/Ob |
TL-based |
NØ-based |
|
0.00 |
0.007 |
4.8 |
9.62 |
12.19 |
|
0.00 |
0.014 |
6.6 |
9.07 |
10.74 |
|
0.64 |
0.062 |
12.0 |
8.22 |
8.56 |
|
0.78 |
0.099 |
19.9 |
7.72 |
8.26 |
|
0.86 |
0.075 |
27.4 |
7.53 |
8.41 |
|
1.13 |
0.109 |
23.1 |
7.61 |
8.22 |
|
1.15 |
0.189 |
25.3 |
7.56 |
8.23 |
|
1.28 |
0.140 |
192.0 |
8.63 |
8.18 |
|
1.30 |
0.431 |
39.7 |
7.44 |
8.83 |
|
1.41 |
0.121 |
29.1 |
7.50 |
8.20 |
|
1.53 |
0.168 |
26.1 |
7.55 |
8.20 |
|
1.62 |
0.247 |
103.6 |
7.79 |
8.35 |
|
2.01 |
0.179 |
89.0 |
7.75 |
8.21 |
|
2.02 |
0.061 |
58.7 |
7.51 |
8.57 |
|
2.07 |
0.756 |
98.8 |
7.84 |
9.59 |
|
2.28 |
0.248 |
8.9 |
7.45 |
8.35 |
|
2.51 |
0.413 |
173.8 |
8.49 |
8.78 |
|
2.79 |
0.582 |
132.5 |
8.15 |
9.20 |
|
3.15 |
0.302 |
36.5 |
7.44 |
8.49 |
|
4.95 |
0.301 |
121.5 |
8.05 |
8.48 |
|
|
|
Avg. |
7.95 |
8.80 |
|
a Frequency of translocations per cell (Lucas et al., 1992). bNØ variant cell frequency per million cells (Langlois et al., 1993). |
||||
from 40 to 50 years. An important question which remains is the effect on frequency of GPA variant cells at short times after exposure.
Chernobyl
The Chernobyl accident occurred in 1986 and has allowed us to study the GPA response under rather different conditions from our previous studies. We have performed a study on individuals who were on site during the emergency conditions, and other individuals who were sent to that site to assist in the cleanup of
the radioactive contamination (Jensen et al., 1995). The exposure of these individuals was rather different from that experienced by the A-bomb survivors. First, the levels of exposure of a majority of the individuals involved in the Chernobyl cleanup was lower than 1 Gy. Only those who were on site during the emergency or shortly afterwards were exposed to greater than this level. In addition, the majority also were exposed over longer periods of time than the very rapid A-bomb blast. Of the 102 exposed Chernobyl accident victims who were analyzed by the GPA assay, only 10 were on site at the time of the explosion and received exposure that was rapid and extreme enough to suffer acute radiation sickness. The other 92 were cleanup workers who received their radiation dose over a period of minutes to hours. Those who received the lowest doses were exposed very slowly during the cleanup operation, at which some worked for several months. In addition, the time since exposure was much shorter for this population. The GPA assay was performed on all these individuals during the first decade after their exposure.
The results from the Chernobyl study show that the overall dose response was very similar to that seen for the A-bomb survivors:
At first this seems very surprising in that the extent and rate of exposure seem very different from those at Hiroshima, and Russell and Kelly (1982) have shown that rate of exposure greatly affects the specific-locus mutation frequencies in mice. However, a more careful analysis of the Chernobyl victims' data gives a plausible explanation for this result. If we calculate the dose-response for individuals who received less that 1 Gy, then only 1 of the 80 victims showed symptoms of acute radiation sickness, and the dose response was:
This shows a much lower dose response, which is not significantly different from zero. Thus, the low dose rate appears to induce mutation effects that are much lower than in people exposed at high dose rate.
Another important observation from the GPA analysis on Chernobyl accident victims is that during the first decade after exposure, the frequency of variant erythrocytes appears to be unchanged. A group of 10 individuals donated more than one blood sample over a period of seven years, with a mean interval of 16 months between donations. The NØ variant cell frequency for these individuals did not change systematically over time. This is very similar to the results we obtained when we performed a similar study on A-bomb survivors between 45 and 50 years since exposure (Langlois et al., 1993). Thus, it appears that the GPA assay provides lifetime biodosimetry for ionizing radiation exposure. An individual's NØ variant cell frequency will register at about 6 × 10⁻⁶ at age 10 and increase slowly to about 16 × 10-6 by age 65 (Grant et al., 1991) unless that person is exposed to a significant level of ionizing radiation. At that time, his NØ variant cell frequency will increase proportional to his exposure and remain near that level with a slow
TABLE 17.2 Overview of the changes in the glycophorin A assay and the dose response measured for A-bomb survivors.
|
Date |
Assay |
Instrument |
Antibodies |
N/Ø dose response (per 106 cells) |
|
1987 |
1W1 |
Sorter |
6A7 + 10F7 |
11 + 40 Dose(Gy) |
|
1989 |
SBS |
Sorter |
6A7 + 10F7 |
18 + 21 Dose(Gy) |
|
1990 |
BR6 |
Cytometer |
6A7 + BRIC 157F |
16 + 27 Dose(Gy) |
|
1995 |
BR6-Chernobyl |
Cytometer |
6A7 + BRIC 157F |
6.2 + 21 Dose(Gy) |
|
1996 |
DB6 |
Cytometer |
6A7-PE + BRIC 157F |
Not Done |
increase continuing with aging unless another radiation exposure is experienced. Exactly how sensitive the assay is to low levels of exposure has been difficult to define. Monitoring a large population of individuals who are at high risk of exposure would be the best approach to determining the assay's feasibility.
DB6 Assay
Evolution of the GPA assay is continuing. Recently we found that the previous fluorescent labeling approach for antibody Direct BRIC 157 6A7 (''6A7") would occasionally give high frequencies of variant cells in samples for which such frequencies might not be expected. Careful monitoring of such events indicated that blood samples shipped or stored under inappropriate conditions gave these variable results.
In a study just completed, we showed that 6A7 labeled with the secondary avidin fluorescent labeling procedure was not binding to slightly damaged cells in a way that put their fluorescence intensities in the NØ variant cell window of the bivariatee histogram obtained by FACScan analysis (Jensen and Bigbee, 1996). If the same antibody was directly conjugated with phycoerythrin, the fluorophor of choice for this assay, these same samples gave cleaner histograms and lower variant cell frequencies for a number of such samples. A parallel cell sorting, fluorescence microscopic, and re-immunolabeling procedure showed that cells that would not bind the secondary complex would successfully bind the direct conjugate. We now have adopted this assay as a standard protocol for the GPA assay and recommend that others do the same.
Conclusions
Evolution of the GPA assay as a biodosimeter for ionizing radiation is tabulated in Table 17.2. The assay has undergone four significant changes in design that have improved the ease of analysis and the precision of measurement. Nevertheless, it can be seen from column 5 in Table 17.2 that the dose response has changed only a modest amount. It is clear that results from the earliest of assays can be compared reasonably with results of the most recently adopted method.
The progression of this analytical procedure over the last decade has been strongly dependent on the cooperation between US scientists at Lawrence Liver-more National Laboratory, and Japanese scientists at the Radiation Effects Research Foundation, Hiroshima. The fact that the final entry in column 5 of Table 17.2 is not completed indicates that cooperation and collaboration between these groups will continue to aid GPA evolutionary advancement.