Effects of Ionizing Radiation: Atomic Bomb Survivors and Their Children (1945-1995) (1998)
Chapter: 4 Biodosimetry of Atomic Bomb Survivors by Karyotyping, Chromosome Painting, and Electron Spin Resonance
4
Biodosimetry of Atomic Bomb Survivors by Karyotyping, Chromosome Painting, and Electron Spin Resonance
NORI NAKAMURA, DAVID J. PAWEL, YOSHIAKI KODAMA, MIMAKO NAKANO, KAZUO OHTAKI, CHYUZO MIYAZAWA, AND AKIO A. AWA
Summary
Radiation dose estimation is one of the important tasks for radiation epidemiology. Frequency of chromosome aberrations in lymphocytes has long been recognized as a useful biomarker. Whereas unstable-type aberrations are clearly detectable, they disappear with time, and were not useful in dose estimation for atomic bomb survivors because more than 20 years had passed when the cytogenetic study was initiated. Consequently, stable-type aberrations, known to persist for decades but requiring greater skill to detect, were the only choice.
Recent results for over 2,300 survivors show a dose-related increase of chromosome aberration frequency with DS86 estimated dose, whereas variations among those with similar DS86 doses were common, as have been recognized. In addition, Hiroshima survivors showed a dose response about twice as steep as in Nagasaki survivors. The intercity difference greatly diminished when survivors exposed in Japanese houses were compared. The results suggest a systematic bias in dose estimation according to the shielding categories.
Chromosome painting (FISH) technique, currently the most objective way to detect reciprocal translocations, now confirms that the frequency of aberrant cells
by the conventional method is 70 to 80% compared with the genomic translocation frequency deduced from FISH method.
Preliminary data of electron spin resonance (ESR) measurements on tooth enamel show a close correlation with donors' chromosome aberration data.
Introduction
Except for medical purposes, radiation exposure is mostly accidental, and hence precise reconstruction of the exposure dose is usually difficult to achieve. Estimation of the dose based on some biological materials from the exposed individuals is helpful in this regard to substantiate the physical dose estimation. Such a biodosimetric technique first became feasible with the discovery of mitogens, which stimulate blood lymphocytes to proliferate in culture and provide a means to examine a large number of metaphases with minimal discomfort to subjects. This was a fantastic breakthrough not only in biodosimetry but also in immunology, because blood lymphocytes had been considered to be terminally differentiated and incapable of undergoing further cell cycle progression.
At the Atomic Bomb Casualty Commission (ABCC)/Radiation Effects Research Foundation (RERF), cytogenetic examination has been conducted since the late 1960s. Unfortunately, however, more than 20 years had already passed since the bombings. Consequently, most of the easily detectable unstable-type aberrations, represented by dicentrics, rings, and acentric fragments, had disappeared, and stable-type aberrations such as translocations and inversions were the only choice of analysis.
The term "unstable-type aberration" means that cells undergoing mitosis with the aberration meet a problem, mechanically and genetically (Figure 4.1). A dicentric chromosome is defined as a chromosome carrying two centromeres instead of the usual one; one acentric fragment accompanies such a chromosome. During late metaphase, in 50% of the cases, each of the two centromeres of the dicentric chromosome are pulled toward opposite daughter nuclei, and nuclear division cannot be accomplished because of the chromosome bridge formation between the two nuclei, which later results in fusion of the two daughter nuclei to give rise to a tetraploid cell. In the other 50% of the cases, both centromeres segregate into one of the two daughter nuclei, which does not cause any mechanical problem for cell division unless they are tangled. However, the acentric fragment is distributed randomly between the daughter cells because of the lack of a centromere, thus giving rise to partial duplication of the genome in one daughter cell and partial deletion in the other. The latter causes various adverse effects on cell viability. At each mitosis of subsequent cell divisions, the dicentric chromosome continues to cause the mechanical problem in 50% of the cases as described above, even though they bear partial duplication, which is much less adverse than the counterpart, partial deletion.

FIGURE 4.1 Schematic presentation of the fate of unstable-type aberrations.
The stable-type counterpart of the dicentric chromosome is reciprocal translocation. Such a chromosome bears a single centromere in each chromosome and hence meets no mechanical problem at mitosis. Further, there is usually no gross gain or loss of chromosome materials. Thus, such cells should have no growth disadvantage and persist in the population.
Detection of stable-type aberration requires precise knowledge of human karyotype. Because of the difficulty in standardizing the aberration detectability for each observer, it had not been recommended for biodosimetric purposes until the advent of the chromosome painting method that detects stable-type aberrations unequivocally.
The present report summarizes the cytogenetic studies conducted at ABCC/RERF for more than 20 years and the recent results from the more physical dosimetric measurements on tooth enamel.
Conventional Staining Method
General Information
A simple Giemsa staining method is commonly used for detecting unstable-type aberrations such as dicentrics and rings. Unstable-type aberrations can be identified by the abnormal structure of a chromosome bearing two centromeres in the case of a dicentric chromosome or by the lack of a centromere in the case of a fragment. In contrast, most of the chromosomes bearing a stable aberration (i.e., reciprocal translocation or inversion) appear normal by themselves because each chromosome carries a single centromere, and the abnormality shows up only when the 46 chromosomes are carefully ordered according to their length and arm ratio. Thus, detection of stable aberration requires precise knowledge of human karyotype. Although beginners require taking photographs of every metaphase for subsequent analysis, skilled people can exclude normal metaphases under the microscope and take photographs of only metaphases suspected to be abnormal. Then, the final decision can be made following the agreement of multiple observers. To avoid false negative scoring, observers are encouraged to take photographs of any suspected metaphases. The most difficult task is to standardize the aberration detectability among the observers. For this purpose, the same slides are periodically cross-checked by different observers.
Dose-Response Relationship
Results for 1,703 survivors were published by Stram et al. (1993) and Figure 4.2 shows the dose-response relationships. Two features are evident. First, the Hiroshima dose-response curve is close to linear, whereas the Nagasaki curve is more curvilinear. Second, the Hiroshima curve is about a factor of two higher at middle- to low-dose ranges. These two characteristics have been known since the 1970s (Awa, 1975), when the T65D was used to assign individual estimated doses.
Major differences between the previous T65D and current DS86 doses are twofold: the absorbed doses decreased to nearly one-half in DS86, and the neutron contribution was much reduced in Hiroshima, giving rise to only a small difference between Hiroshima and Nagasaki. (Neutron dose may be revised in the future, however.) Consequently, it is difficult to attribute the more linear dose response in Hiroshima to a larger neutron contribution.
Recently, we conducted a validation study of the dose-response relationship for a group of 2,500 survivors. The two characteristics mentioned above remain unchanged. However, a new insight was obtained after examining the average dose-response relationships according to shielding categories of each survivor. In Hiroshima, the dose responses are very similar among three groups, i.e., those who were in Japanese houses, tenement houses, and other buildings at the time of the bombings. In Nagasaki, however, the average dose response is distinctively steeper for the Japanese-house group compared with the other two groups. The
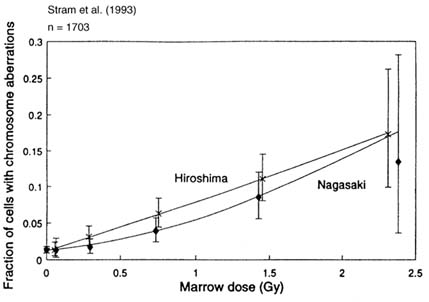
FIGURE 4.2 DS86 dose-response relationships for the frequency of lymphocytes bearing stable-type aberrations (Stram et al., 1993).
results suggest that the the dose for tenement and miscellaneous groups of the Nagasaki survivors was considerably overestimated.
Recent cancer mortality data (LSS Report 12) showed an increased city difference compared with the previous report. The increase comes rather equally from two sources: i.e., five more years of follow-up period, and extension to include a new group of survivors, mainly factory workers whose shielding conditions have been difficult to assess (Pierce et al., 1996). The cytogenetic data need to be confirmed by the new FISH technique and, if true, it would be necessary to find a way to incorporate the cytogenetic information in the epidemiologic data.
Clonal Aberrations
Clonal chromosome aberrations are defined as the same karyotypic change found in three or more metaphases in one blood sample. An identical aberration in two cells in one blood sample is not considered as clonal because a fraction of the cell population enters second mitosis in vitro in the currently used 48-hr culture protocol.
Such clonal cases have long been recognized (Awa, 1974). To date, 23 clonal cases are registered. Most of these survivors have assigned DS86 doses above 1 Gy. Such clonal expansion of lymphocytes can be derived either from a mature T cell in the periphery as a result of antigen stimulation, or from a bone marrow stem cell that proliferated extensively to produce an extremely large number of progenies. In the former case, the clonal aberration must be restricted to T lymphocytes. In addition, the patterns of T-cell-receptor gene rearrangement, which takes place during T-cell maturation in thymus and determines antigen specificity, are identical among the clonal derivatives. In the latter case, the aberration is expected to be present in different lineages of blood cells, i.e., T, B, erythroid and granulocytic lineages.
We have recently examined one survivor in detail to determine the origin of a clonal aberration (Kusunoki et al., 1995). The examinee was exposed to the bomb at the age of 20 years and is assigned a DS86 dose of 1.95 Gy. Results of repeated cytogenetic examinations showed that, in addition to nearly 30 independent aberrations among 100 cells, 3 to 8 cells bearing clonal double translocation [i.e., t(4;6),t(5;13)] have been consistently observed. Further, among 71 T-cell colonies established in vitro, 6 carried the double translocation. Similarly, among B-cell colonies established after Epstein-Barr virus transformation, 7 out of 58 carried the same double translocation. The rearrangement patterns of the T-cell-receptor gene and immunoglobulin gene were all different among the T-cell and B-cell colonies carrying the double translocation, respectively. Finally, stem cell cultures using methylcellulose medium for mainly BFU-E erythroid colonies also revealed that the same aberration was found in about 10% of the cells grown in mass culture. These results clearly demonstrate that the origin of this double translocation is in a multipotent stem cell in bone marrow, and a single stem cell in an adult could proliferate extensively to constitute as much as nearly 10% of total blood cells.
One might argue that the examinee was mosaic with regard to the aberration. Although the possibility cannot be totally excluded due to lack of pre-radiation-exposure information, it seems more likely that the two translocations were induced by radiation exposure. That most of the clonal cases are found among high-dose exposed people supports the notion.
Random Errors Associated With DS86
Calculation of DS86 dose uses parameters from interview records taken more than five years after the bombings. Thus, inaccurate memory regarding the distance from the hypocenter, or the type of structure of shielding results in random errors in estimating the dose.
Sposto et al. (1991) examined the chromosome aberration data in relation to the presence or absence of severe epilation, one of the acute radiation symptoms, defined as loss of more than two-thirds of scalp hair within 60 days after the irradiation. The authors found that the slope of dose response is roughly twice as steep in the severe epilation group as in the remainder, as shown in Figure 4.3.

FIGURE 4.3 Dose-response relationships for the frequency of lymphocytes bearing stable-type aberrations among those who reported severe epilation (loss of two-thirds of scalp hair) and those who did not (Sposto et al., 1991).
Assuming that the random dose errors are the only source for the different slopes, they reached a conclusion that "dosimetry errors in the range of 45% to 50% of true dose are necessary to explain completely the difference in dose response between the two epilation groups."
Interestingly, the severe epilation group also showed 2.5 and 2.3 times higher risks for leukemia mortality (Neriishi et al., 1991) and incidence of cataract (i.e., lens opacity) (Neriishi et al., 1995), respectively. Although it is possible that the severe epilator group contains a larger fraction of radiosensitive individuals who show very similar elevated risks for induction of chromosome aberration, leukemia, and cataract, it seems more likely that the severe epilator group simply consists of individuals whose true doses are, on the average, nearly twice as high when compared with non-epilators at each DS86 dose level. As far as the in vitro dose-survival study using lymphocyte colony assay is concerned, no evidence for the presence of a large heterogeneity in individual radiosensitivity could be obtained (Nakamura et al., 1991, 1993). Recent electron spin resonance data on tooth
enamel are also in favor of the latter hypothesis and we will come back to this issue later.
G-Banding Method
General information
Precise localization of breakpoints involved in any chromosome aberration requires a banding method that gives chromosome-specific bar-code-type patterns. Among several techniques to produce the band patterns, the G-banding method is the most commonly used.
The banding method is very useful for detailed characterization of abnormalities, but its critical disadvantage is the extensive labor required for the analyses.
Comparison Between the Conventional and G-Banding Results
The conventional staining method has long been used for biodosimetric purposes with the A-bomb survivors. To determine the limitation of the assay—i.e., whether and how correctly the aberrations were detected—two studies have been performed (Ohtaki et al., 1982; Ohtaki, 1992).
In the first study, the same metaphases were examined by the two methods. Metaphases were photographed first after the conventional staining, the x-y location of each metaphase on the microscopic stage was recorded, and the slides were processed further for G-banding.
From 23 proximally exposed survivors, 896 cells were examined, and 342 had aberrations by the G-banding method (i.e., aberrant cell frequency was 38%). The conventional staining method, on the other hand, could detect 83% of the translocations (194 of 234), 59% of the inversions (32/54), 62% of the deletions (23/37) and 94% of complex aberrations (34/36), although the classifications were not always correct. The overall detection rate was 78%.
In the second study, G-band analyses were performed for 62 survivors of various doses who had been examined previously by conventional method. Linear regression analysis of conventional data (i.e., frequency of cells bearing stable aberration) plotted against G-banded data revealed a slope of 0.70, slightly smaller than the results from the first study. Thus, the conventional assay can detect 70 to 80% of the aberrations detected by the G-banding method. The results are similar to the observations by Buckton et al. (1978).
Clonal Aberrations
Previously, we presented results for clonal chromosome aberrations observed by the conventional method. Because the conventional method cannot definitively identify the chromosomes involved in an aberration in many instances, the same
aberrations may be recorded as different, or different aberrations as the same. However, with the G-band method, each translocation can be characterized in detail, and hence even one identical aberration each in two separate blood samples can be regarded as clonal derivatives. In other words, G-band analysis has a potential to detect clones of much smaller sizes than those detectable by the conventional method.
Our recent data after four repeated G-band tests of 16 proximally exposed survivors did show numerous such small clones (173 different aberrations) among 11 survivors whose aberrant cell frequency exceeded 20% (Ohtaki, unpublished observation).
In addition to the cells bearing identical aberration(s), a new class of clonal derivatives was observed. These cells share one common aberration and some of these cells have an additional aberration. Two explanations, although not mutually exclusive, are possible. One is that genetic instability was induced by radiation exposure in a progenitor cell and, during subsequent cell division, a fraction of the progeny cell population acquired an additional aberration. Another explanation is that one chromosome-type aberration and one chromatid-type aberration were induced simultaneously in a progenitor cell at S phase. In this case, a bone marrow stem cell is the most likely target, because mature T cells in the periphery are mostly in G0 phase, and chromatid-type aberrations are not usually induced in those cells. Subsequent cell divisions produced two populations sharing one aberration common to 100% and another common to 50% of the progenies. Detailed karyotype analyses are currently in progress to distinguish the two hypotheses.
These results suggest that the current lymphocyte pool of the survivors consists of clonal derivatives of various sizes. Determining the origin of these small clones, either from a bone marrow stem cell or from a mature T cell in the periphery, would provide valuable information in understanding lymphocyte kinetics in humans.
5q- Clones
Distribution of deletions among the chromosomes was recently summarized for 114 proximally exposed and 24 control groups. The frequencies of both apparent terminal deletions and interstitial deletions were about 10 times higher than the frequency of cells bearing exchange-type aberrations in the exposed group. Therefore, the deletions were most likely related to radiation exposure.
Because simple terminal deletions cause loss of the telomere structure of a chromosome, cells bearing such a deletion are unlikely to survive for nearly 50 years unless either telomerase activity was induced in those cells to add telomere structure to the broken ends, or they are in fact interstitial deletions, but one break occurred so close to the end of a chromosome that the remaining portion is too small to detect.
Whereas the apparent terminal deletions distributed widely to different chromosomes, nearly one-third of interstitial deletions (115 of 336) clustered on the long arm of chromosome 5 (i.e., 5q). Deletion of chromosome 5q has been well
known among patients suffering from myelodysplastic syndrome (MDS) or acute myelogenous leukemia (AML), both in de novo and therapy-related cases (LeBeau et al., 1993). Interestingly, average deletion size is considerably smaller in the A-bomb survivors compared with that of MDS or AML patients, where it covers 5q14 to 5q33 in most cases (LeBeau et al., 1993). Further, scrutiny of deletions among cells from each survivor showed that the deletions tend to be identical for each survivor, suggesting that they are clonal derivatives, although the deletions distribute to wider regions, from 5q11 to 5q31, among different survivors. Thus, it seems likely that different 5q- cells were positively selected in vivo among different survivors to form clones. It is suggested that chromosome 5q bears multiple tumor-suppressor genes, which favors the hypothesis of positive selection. Hematologic data of six survivors, all of the high dose group, bearing 5q- cells at a frequency of 2% or more, did not show any consistent abnormalities, however. Thus, there is no association between appearance of 5qcells and any clinical indices. Careful follow-up of the frequency of 5q- cells for the six survivors will be performed to provide information on the nature of cells bearing 5q deletion.
Fluorescence In Situ Hybridization (Fish) Method
General Information
The conventional method may detect as much as 70 to 80% of aberrations detected by G-banding, but extensive training of observers is indispensable, and only a few laboratories can accomplish it. On the other hand, the G-banding method is labor-intensive and is not suited for routine examinations. Flowcytometric sorting of human chromosomes and subsequent establishment of chromosome-specific DNA libraries opened a new era in overcoming these problems in detecting reciprocal translocations.
With the development of the FISH assay, reciprocal translocations can now be easily detected as a bicolored chromosome (usually in a pair) when several target chromosomes are ''painted" yellow after in situ hybridization using fluorescein-tagged DNA probes, while the rest of the DNA is "painted" red by propidium iodide.
Obviously, any exchanges among the painted or unpainted chromosomes are not readily detectable. Thus, the observed exchange frequency needs to be corrected to a genome equivalent value.
For such a correction to be valid, any chromosome should have an equal chance in proportion to the length of undergoing exchange after irradiation. Breakpoint distribution of translocations in lymphocytes from A-bomb survivors by G-banding analysis showed that the frequency of breaks is linearly proportional to DNA content of each chromosome, except for chromosome 1, which was significantly more susceptible per unit DNA content (Lucas et al., 1992).
Currently, we paint chromosomes 1, 2, and 4, which cover 22% of the total genome and the observed translocation frequency is multiplied by a factor of 2.84

FIGURE 4.4 Correlation between FISH and G-banding data. The slope of the linear regression is 0.75, but is not significantly different from 1 (Lucas et al., 1992).
to estimate the genome equivalent value (for the details, see Lucas et al., 1992). In vitro irradiation experiments using FISH with probes for chromosomes 1, 2, and 4 showed that the deduced genomic translocation frequency agreed closely with dicentric data, an unstable-type counterpart of a two-break aberration (Lucas et al., 1992).
FISH Versus G-Banding or Conventional Method
Blood samples from 20 A-bomb survivors were examined concurrently by both the FISH and G-banding methods. The slope of the linear regression between the G-banding and FISH measurements was 0.75, although not significantly different from 1 as shown in Figure 4.4 (Lucas et al., 1992). Thus, FISH is as effective as G-banding in detecting translocations.
As for FISH versus conventional staining, we already noticed that the aberration frequency by the conventional method is 20 to 30% lower than that by G-banding. Thus, we would expect that the frequency of translocation is 20 to 30% lower in the conventional method than in FISH, assuming FISH and G-banding are equally effective. In fact, results for 97 survivors examined on different occasions by the
two methods showed that the aberration frequency by the conventional method was about 80% on the average, compared with the genomic translocation frequency by FISH.
Detection Limit of a Translocated Segment by FISH
Reciprocal translocation between painted and unpainted chromosomes usually results in a pair of bicolored chromosomes, yellow (painted) chromosome with a red (unpainted) tip and red chromosome with a yellow tip. However, occasionally one of the two counterparts is undetected in a metaphase. Such an abnormality may be derived from incomplete rejoining of two breaks and subsequent loss of the acentric unrejoined fragment. Alternatively, one of the two breaks may have been so close to the end of a chromosome arm that the translocated segment was too small to detect. As far as A-bomb survivors are concerned, however, it is very unlikely that the cells bearing an unrejoined chromosome break survived several decades, because we no longer see any dose effect for the unstable-type aberrations. Therefore, the second hypothesis is more likely. Then, assuming that the translocation breakpoints distribute randomly in the genome, we could calculate the most likely minimum size of a translocated segment detectable by FISH. It turns out to be about 11 Mb for the painted chromosomes and 14 Mb for unpainted chromosomes (Kodama et al., 1997). These values are close to that estimated from G-banding data, and correspond to an average size of one band at a 400-band level.
Electron Spin Resonance Method
General Information
Electron spin resonance (ESR) is a phenomenon wherein radicals (i.e., atoms or molecules bearing an unpaired electron) absorb microwaves at a magnetic field strength characteristic of the radical species. Whereas radicals disappear very quickly in aqueous solution, they remain for years in solid materials. Calcified materials such as teeth, bones, or cave deposits are used for archeological dating by ESR method. Compared with the thermoluminescence method, ESR is non-destructive and hence repeated measurements are possible (Ikeya, 1993).
Enamel covers the crown of a tooth and can be thought of as an inorganic component of the human body. The major constituent of enamel is hydroxyapatite [Ca10(PO4)6(OH)2], which forms a crystalline structure. About 2.5% (w/w) of the enamel consists of CO32-, which is believed to be incorporated in place of PO42- to terminate crystal elongation during dental enamel development. Radiation exposure to dental enamel produces carbon radicals. Originally, the carbon radicals were thought to be CO33, but recent work now suggests that the radicals are CO2-, which are detected by ESR. Among human tissues, tooth enamel is by
far the most sensitive for biodosimetric purposes compared with tooth dentin or bones.
We have been collecting teeth extracted for medical reasons from Hiroshima A-bomb survivors participating in the RERF Adult Health Study, and preliminary results are presented here. The ESR signal on tooth enamel consists of two components, a broad background signal most likely derived from organic materials in enamel, and a sharp radiation-related signal. The background signal saturates at low microwave strength, whereas the radiation-related signal continues to increase along with the microwave power. Thus, in order to isolate the radiation-related signal from the background signal, we used two different microwave powers, 16 mW and 0.4 mW, for subtraction analysis. It should be mentioned that even at the lower microwave power, the radiation-related signal still remains, and hence the current subtraction does not isolate 100% of the radiation-related signal. Nonetheless, we believe that this is the most objective and easiest method for estimating radiation effects. Preliminary results for 11 teeth have been described elsewhere (Nakamura et al., 1994).
Results for 100 Teeth
One hundred enamel samples were measured at 16 mW and 0.4 mW for the subtraction. Among these, one failed to provide the results because of its unusually wavy pattern at 16 mW. The subtracted signal intensity was corrected first by the signal intensity of manganese located in the cavity (internal control), followed by the total amount of enamel examined to estimate the radiation signal per milligram of enamel.
The results for the relationship between ESR signal intensity thus obtained and chromosome aberration frequency of blood lymphocytes from the tooth donor showed a good correlation, with a correlation coefficient of R=0.87. Different teeth from the same donors gave reasonably close results among themselves. The frequency of chromosome aberration is usually determined after examination of 100 metaphases by the conventional Giemsa staining method. Thus, the frequency includes sampling errors. Among the 70 donors, we did not receive blood from 9 survivors, so the results are for 61 survivors.
One exception was found, however, for a man who was exposed at 1.1 km from the hypocenter and who carries stable chromosome aberrations as high as 35% of his lymphocytes, but whose tooth enamel failed to show any sign of radiation exposure. He was exposed at 15 years of age and reported various acute radiation symptoms. It turned out that the sample was a wisdom tooth that is known to develop much later than other permanent teeth, and we tentatively concluded that the enamel was most likely underdeveloped at the time of bombing.
The results of chromosome aberration frequency plotted against the physically estimated DS86 dose gave a correlation coefficient of R=0.73. As has been known for many other survivors, a good correlation predominates, but some outliers can be seen and will be discussed below.
In the present study, we did not attempt to calculate the dose from the ESR signal intensity. For this calculation, we need to irradiate the enamel with graded doses of gamma rays. If the radiosensitivity of tooth enamel in producing the ESR signal varies both among teeth and among individuals, such an in vitro irradiation procedure is critical in estimating individual dose. However, a recent study by Iwasaki et al. (1995) demonstrated that the variation is rather small. They showed that after 5 Gy of irradiation of teeth from cadavers, the coefficient of variation for the mean of the ESR signal was less than 4% for 10 repeated measurements of 4 samples, and 5.3% to 11.4% (average 6.1%) for a single measurement of 7 to 26 teeth from each donor. (Iwasaki et al. did encounter one exceptional tooth out of 72 examined that was hyposensitive for the ESR signal production, however.)
Issues Related to Cytogenetic Outliers and Severe Epilation
In the dose-response analysis of chromosome aberration frequency, two survivors were found to be outliers whose aberration frequencies were close to the background level although their estimated DS86 doses were 1.6 and 3.3 Gy, respectively. The interview records showed that they were exposed outdoors without apparent shielding. Importantly, their ESR data for tooth enamel failed to suggest any high-dose exposures, in agreement with the aberration data. Therefore, for these two survivors, it seems most likely that their memory regarding location at the time of the bombing was inaccurate. We feel it reasonable to say that lymphocyte aberration frequency and tooth enamel measurements are both manifestations of physical exposure, and are more accurate reflections of true dose than individual memory of precise location at the time of the bombings.
As mentioned earlier, the slope of the chromosome aberration dose response is about twice as steep in the severe epilation group when compared with nonepilators. Are the survivors who reported severe epilations more radiosensitive? Present ESR versus chromosome aberration data were reanalyzed according to the presence or absence of severe epilation. It was found that severe epilators were found only among middle- to high-dose exposed people (i.e., from the standpoint of ESR signal intensity), and there was no sign of their hyper-radiosensitivity for induction of chromosome aberration. Because tooth enamel ESR is a physical measurement, it is very unlikely that cellular radiosensitivity is coupled with radiosensitivity for radical induction in tooth enamel. Consequently, it could be concluded that the severe epilators' issue is merely a reflection of biased dose estimation and not of individual radiosensitivity.
Future Prospects
Usefulness of the Conventional Method
Recently developed FISH is excellent in detecting stable aberrations, but the necessary laboratory reagents and equipment such as fluorescence microscopes are
expensive. In contrast, the conventional staining method is not perfect in detecting stable aberrations but is less expensive. Further, it has the potential to detect as much as 70 to 80% of the aberrations detectable by FISH or G-banding, provided that the observers are well trained in karyotyping. Concurrent use of FISH would be helpful in estimating the aberration detectability by the conventional method.
City Difference
Current results for the city difference between Hiroshima and Nagasaki require caution to interpret. Because most of the blood samples were processed and examined in the Hiroshima and Nagasaki laboratories separately, the difference might be a result of laboratory artifact. We plan to examine survivors from both cities in the Hiroshima laboratory using FISH to resolve the issue.
Shielding Categories
As for the difference in the slope of dose-response relationships among different shielding categories in Nagasaki, the possibility of laboratory artifact is very unlikely. Nonetheless, it would be worth examining Nagasaki survivors systematically by FISH. If the difference were confirmed, we would need to incorporate the information into epidemiologic studies.
ESR Versus Chromosome Aberrations
We plan to compare ESR results with chromosome aberration frequency of lymphocytes for 100 Hiroshima survivors (donors) to provide a definite answer to the feasibility of ESR dose estimation. We need to find a way to exclude contribution of dental x-ray exposure.
Clonal Aberrations
For several decades after the irradiation, lymphocytes or the progenitor cells bearing certain chromosome aberrations might have undergone positive selection. Currently, our knowledge of the origin of such clonal derivatives is very limited. Theoretically, clonal expansion may occur in both progenitor cells in bone marrow and mature lymphocytes in the periphery. Characterizing such clonal cells would provide unique information regarding not only long-term lymphocyte kinetics in humans, but also possible bias in biodosimetry.
Cytogenetic Epidemiology
Because FISH is suitable for automated image analysis, several laboratories are developing the programs. If such a system may become available in the future, we wish to conduct a large-scale FISH study on all the AHS participants exposed
within 2.5 km from the hypocenter so that a chromosome-aberration-based epidemiologic survey may be performed. Until the introduction of an automated system, the current FISH study will continue by examining about 200 survivors a year manually.
Biodosimetry of the Exposed Parent(s) for Genetic Study
Currently, effort has been made to establish permanent B-cell lines from both parents and children as one of the tasks of the molecular genetic study. Five hundred families each for the exposed (one or both parents are exposed) and control (neither of the parents are exposed) groups are to be included. Because DS86 is biased by error to some degree, evaluation of genetic risk requires accuracy of the dose. In this regard, it is of interest to test chromosome aberration frequency in the exposed parent(s).
Acknowledgments
The authors are grateful to Dr. Keisuke S. Iwamoto for his careful reading of the manuscript, and to Ms. Mayami Utaka for manuscript preparation.