Effects of Ionizing Radiation: Atomic Bomb Survivors and Their Children (1945-1995) (1998)
Chapter: 2 The Origin of DS86
2
The Origin of DS86
DEAN C. KAUL
Summary
After 15 years of existence, the first integrated system of dose estimates for Japanese A-bomb survivors, called T65D, was challenged. The challenge was based on the potential impact of epidemiological findings based on T65D, an almost wholly empirical system, and the advent of new capabilities to calculate dose values. Ultimately, this led to the creation of Dosimetry System 1986 (DS86). The primary effect of DS86 was an increase in total dose at Hiroshima, relative to that at Nagasaki, and a decrease in Hiroshima neutron dose to a level similar to that at Nagasaki. Comparisons with measurements have confirmed DS86 gamma-ray dose values but have suggested neutron dose values at Hiroshima should be increased, possibly by as much as a factor of five. In addition, testing of DS86 shielding treatment suggests the existence of large random scatter and bias, possibly due to limitations in the means of shielding categorization inherited by DS86 from T65D. Studies of survivors asked to characterize their location at time of burst twice over an eight year period show a very low dose uncertainty due to variations in survivor recall. This suggests that dosimetry improvements would substantially reduce random scatter in the dose data with a potential for more precise epidemiological assessments. Further, the availability of biological observables, such as chromosome aberrations, in the 51% of survivors still living provides a means of assessing dose accuracy for individual survivors and a possible alternative to dose as a basis for high-precision epidemiological study.
Reassessing A-Bomb Survivor Dosimetry
The Dosimetry System 1986 (DS86) (Roesch, 1987) is a computer program for assigning radiation doses to individual survivors of the atomic bombing of Hiroshima and Nagasaki, Japan. It succeeds the previous system, T65D (Auxier et al., 1966), which has been used since 1965 for the same purpose. The need for a successor to T65D grew out of a combination of circumstance and technological advancement, the circumstance being that conclusions based on epidemiological data caused T65D to be questioned, and the technological advance being a new means of assessing survivor dose.
T65D was almost entirely empirical in nature, based on measurements made at atmospheric tests of atomic weapons and at tests involving the deployment of a fast reactor and cobalt sources on a tower at the Nevada Test Site (NTS) to simulate weapons radiation. Therefore, it was a rather straightforward system of data and multiplicative factors, given as
where Dosefree filed refers to the free-field unshielded tissue kerma above a flat plain, Shielding factorstructure, terrain is the shielding factor due to structure and terrain, and Organ Dose Factorman is the transmission factor relating air kerma and organ dose. While the form of T65D was straightforward, its means of obtaining values for its shielding factors were not, but involved sophisticated correlations between reported survivor locations and those for which experimental data had been obtained at NTS. The organ dose factors were not part of the original T65D, but were added in the mid-1970s (Kerr, 1979). Calculations of weapons radiation propagation played little role in T65D development because of limitations in radiation transport code development, nuclear data availability, and computer power.
In 1976, Los Alamos National Laboratory (LANL) reported a new calculation of the neutron and gamma-ray leakage from the Hiroshima and Nagasaki weapons (Preeg, 1976). Such calculations were made possible by significant advancements in areas of technology that had been so limited at the time T65D was developed. Subsequently, Rossi and Mays (1978) cited evidence for a substantial increase in the supposed effectiveness of neutron radiation in causing leukemia, based on epidemiological data from the A-bomb survivors. This circumstance caused great consternation at Lawrence Livermore National Laboratory (LLNL), which saw this as an unbearable constraint on its development of nuclear weaponry. Therefore, LLNL proceeded to investigate the validity of that evidence, particularly the dosimetry from which it was derived. In 1980, using the LANL weapon leakage data and modern codes and cross sections, LLNL publicly challenged the accuracy of the free-field component of T65D (Loewe and Mendelsohn, 1980).
In the meantime, the Defense Nuclear Agency (DNA) had sponsored a comprehensive program of transport code development and the measurement and evaluation of a complete set of cross-section data for air, ground and shielding which was completed in time for release in the ENDF/B-4 evaluated cross-section library in 1974 (Garber et al., 1975). At the same time, the US Army sponsored the development of a sophisticated shielding calculation system called the Vehicle Code System (VCS) (Rhoades, 1974). With DNA support, Science Applications International Corporation (SAIC) used the Army code and DNA cross-sections to calculate radiation transmission into houses and human organs which differed markedly from that predicted by T65D (Kaul and Jarka, 1977).
In 1981, in the midst of the controversy which ensued from the LLNL and SAIC findings, the US Department of Energy (DoE) sponsored the conference ''Reevaluations of Dosimetric Factors, Hiroshima and Nagasaki" to air all differences (Bond and Thiessen, 1982). This conference gave rise to an effort, sponsored by the DoE, to replace T65D.
The Creation Of DS86
The effort to create a revised dosimetry system began in earnest with a conference of all participating organizations in Nagasaki, Japan, in February 1983 (Thompson, 1983a), which was immediately followed by another Hiroshima conference in November of that same year (Thompson, 1983b). Participating organizations and their contributions are summarized in Table 2.1. It should be clear from this table that the re-creation of the A-bomb survivor dosimetry had a very broad technical base.
The creation of the new dosimetry system was characterized from its outset by a calculational approach rather than the empirical approach taken by T65D. The intent was to take advantage of the wealth of detail made possible by modern radiation transport technology, while firmly anchoring the results by comparison with measurements, including the very measurements used as the basis of T65D.
Along with its technical duties, SAIC was responsible for creating the framework of the new dosimetry system independently of other agencies. After considerable discussion it was decided not to create a system of scalar multipliers in the vein of T65D. Instead, SAIC proposed a more ambitious system in which each component—free-field, shielding, and organ dosimetry—would be determined independently and would not be affected by a change in any other component. This level of sophistication was deemed necessary because calculations had shown that the energy and angular characteristics of the radiation fluence changed with distance from the hypocenter. This could not be taken into account on a continuous basis with a multiplicative system. Further, the suggested approach allowed a single set of shielding and organ dosimetry data to serve both cities, since they were determined independently of the free-field data.
TABLE 2.1 Participants in the development of DS86.
|
Subject |
Responsible organization |
|
Weapon radiation leakage and yield |
Los Alamos National Laboratory |
|
Radiation transport in the atmosphere |
Oak Ridge National Laboratory Science Applications International Corporation |
|
Structure and terrain shielding |
Science Applications International Corporation |
|
Organ dosimetry |
Science Applications International Corporation Oak Ridge National Laboratory |
|
Overall dosimetry system design |
Science Applications International Corporation |
|
Survivor data (location, shielding) |
Radiation Effects Research Foundation |
|
Shielding material characteristics |
National Institute of Radiological Sciences (Japan) |
|
Gamma-ray TLD measurements |
National Institute of Radiological Sciences (Japan) Nara University, Hiroshima University (Japan) Oxford University (UK), University of Utah |
|
Neutron activation measurements |
National Institute of Radiological Sciences (Japan) Kanazawa University, Hiroshima University (Japan) Oak Ridge National Laboratory |
|
Hiroshima weapon replica measurements |
Los Alamos National Laboratory Oak Ridge National Laboratory Science Applications International Corporation Defence Research Establishment Ottawa (Canada) |

FIGURE 2.1 DS86 dosimetry component schematic.
In principle, the new approach was simply an extension of VCS shielding technology. However, it took that technology a step further by calculating a shield within a shield. Thus, the calculation of structure and terrain shielding was required to retain the full energy and angle differential detail of the fluence in order that the organ dosimetry be calculated in a succeeding step. This process is described by the following integrals describing use of the three independent components of the system, given by

where Φfree field describes the energy (E") and angle (Ω) differential fluence calculated over the surface, S", as depicted in Figure 2.1. The adjoint fluence Φ*shield defines the importance of the fluence over S" for producing a fluence Φshield distributed over the surface S' when multiplied by Φfree field and integrated over all energy, angle and locations on the surface S". This process is repeated to obtain Φman, integrating the product of Φshield and Φ*man in the form
where Φman is the mean fluence in a specific human organ. Finally, dose is obtained by use of the form
which integrates the product of the appropriate fluence-to-dose conversion factor, K, and the fluence Φman over all energy E. In actual operation these integrals

FIGURE 2.2 The DS86 dosimetry system.
are accomplished numerically, using matrix multiplication to combine fluence values with adjoint fluences samples using three-dimensional Monte Carlo radiation transport.
Figure 2.2 shows the sequence in which DS86 retrieves information from the RERF survivor database, performs the calculation to obtain dose values, and estimates uncertainties for risk estimates. Within the box marked DS86, the small boxes in the upper row represent the three types of information obtained from the survivor data, including city and location, shielding, and personal characteristics. Each type of information determines which database within DS86 will be accessed to perform the dosimetry calculation. Table 2.2 shows values from both the T65D and DS86 dosimetry systems for a hypothetical survivor at approximately 1,500 m from the Hiroshima hypocenter (the location on the ground, directly below the explosion). The changes from T65D to DS86 for such a survivor include an increase by nearly a factor of two in total dose but a decrease by a factor of ten in neutron dose. These changes are almost entirely due to changes in the radiation free-field, since changes in the house and body shielding nearly offset each other.
In 1986, at the conclusion of the DS86 dose reconstruction effort, participants could point to success in creating a system that identified significant changes in survivor dosimetry and provided a superior level of detail to T65D as well. The new system had also been thoroughly compared to measured data, including data taken after 1965. For the most part these comparisons were favorable to DS86. For example, as shown in Figure 2.3, the DS86 gamma-ray component, which dominates the free-field radiation, matches TLD measurements in quartz crystals from locations at Hiroshima and Nagasaki better than does T65D, particularly at Hiroshima. It should be noted that nearly all the measured data beyond 1 km have been obtained since 1965.
TABLE 2.2 T65D and DS86 dose values (cGy) at 1,485 m from the Hiroshima hypocenter.
|
|
Dosimetry component |
|||||
|
|
Total neutron |
Total gamma-ray |
Total |
|||
|
Location |
T65D |
DS86 |
T65D |
DS86 |
T65D |
DS86 |
|
Free-field |
12.0 |
0.93 |
24.0 |
51.7 |
36.0 |
52.6 |
|
House-shielded |
3.4 |
0.37 |
21.0 |
30.8 |
14.0 |
31.2 |
|
Organ (marrow) |
0.95 |
0.11 |
13.0 |
24.4 |
24.4 |
24.5 |
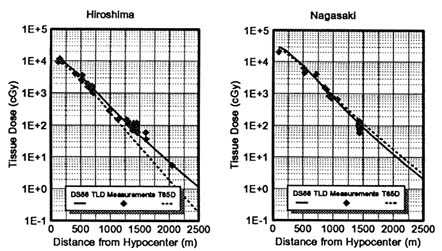
FIGURE 2.3 T65D and DS86 gamma-ray dose calculations and TLD measurements.
The relatively good agreement between T65D, DS86 and the measurements should be expected, given the empirical origins of T65D. There were several tests of weapons similar to the Nagasaki weapon, at both the Nevada and Pacific test sites. However, in the case of the Hiroshima weapon, no basis for such empiricisms existed, and the perturbation to known gamma fields used by T65D to allow for
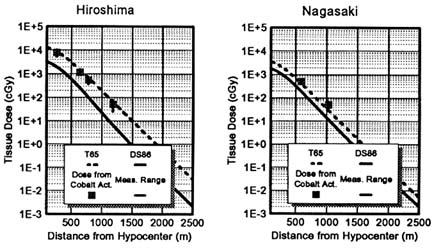
FIGURE 2.4 T65D and DS86 neutron dose calculations and doses inferred from thermal neutron activation measurements at Hiroshima and Nagasaki.
expected differences caused by the unusual design of that weapon clearly caused a loss of too many high energy gamma rays.
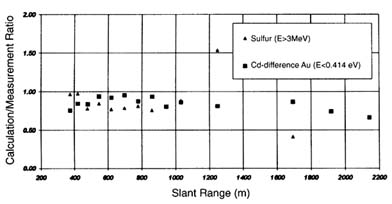
No measurements of neutron kerma akin to the TLD gamma-ray dose measurements exist at the two Japanese cities. However, measurements of thermal neutron activation of cobalt do exist for both cities. These measurements were also available at the time of inception of T65D. Figure 2.4 shows T65D, DS86, and neutron dose deduced from thermal neutron activation measurements, assuming a degraded fission spectrum similar to that emitted from a bare fast reactor, like the one used to support T65D development. Given the fast reactor spectrum assumption, the basis for the T65D neutron dose estimates is clear. However, DS86 is considerably at odds with the T65D values and those inferred from the measurements. This situation is worse at Hiroshima than it is at Nagasaki, where there are only two measurements. However, there is an additional set of measurement data available at Hiroshima. These are sulfur activation measurements, which measure neutrons having energies above approximately 3 MeV. The DS86 calculation-to-measurement ratio for sulfur activation at Hiroshima is shown in Figure 2.5. The solid stars in Figure 2.5 show the ratio as it exists with the current DS86 weapon yield of 15 kT. The best agreement is obtained with a yield of 12.7 kT, which implies a decrease in fast neutrons required to produce neutron dose, rather than the increase inferred from the thermal neutrons.
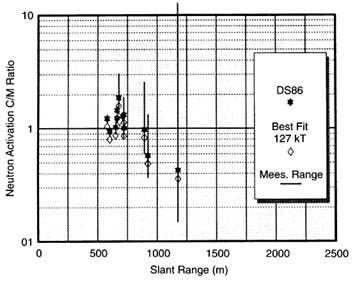
FIGURE 2.5 Neutron sulfur activation at Hiroshima, 1986 comparison with calculations.
Given the contradicting indicators, the thermal activation discrepancy did not cause approval of DS86 to be withheld. Thus, at the time of approval and installation of DS86 at RERF in the spring of 1987, the new dosimetry system could claim improved gamma-ray dose, shielding treatment, and organ dosimetry over its predecessor. However, some problems remained. These included the unresolved neutron activation and lack of coverage of approximately 15% of the Life Span Study members, due to special shielding circumstances, such as occupancy of small factory buildings not treated by DS86, or persons recorded to have been unshielded but without flash burns.
From 1986 To 1995
Since the creation of DS86, small programs in the United States and Japan have continued to assess the adequacy of information embodied in the code system. In the US, ORNL and SAIC have used the new ENDF/B-6 cross section and nuclear data library (Rose and Dunford, 1991) and more powerful computers to recalculate the prompt and delayed radiation free fields at Hiroshima and Nagasaki. In addition, new measurements of thermal neutron activation have been performed and made available by scientists in both the US and Japan (Straume et al., 1992; Straume et
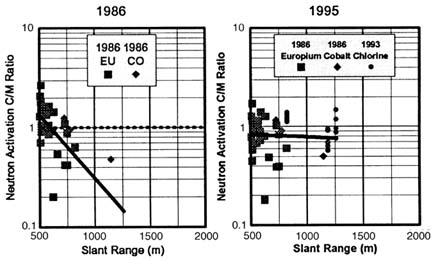
al., 1994). The result of this new work has led to reconciliation of calculations and measurements at Nagasaki, as shown in Figure 2.6. The 1986 portion of this figure shows the large discrepancy between the actual calculation/measurement ratio, a linear fit which is represented by the solid line, and the ideal ratio, represented by the dotted line at unity. As shown in the 1995 portion of Figure 2.6, calculations are now within approximately 20% of the measured values, out to over 1,250 m slant range. Improvements in the calculations removed the discrepancy near the burst point, where DS86 calculates too high a level of activation, and new measured data were obtained which were consistent with calculations and large distances.
To show that such an improvement at Nagasaki was no fluke, equivalent calculations were performed to compare with measurements made on Nagasaki-like weapons deployed at NTS. Figure 2.7 shows the good agreement obtained for both the cadmium-difference gold measurements of thermal neutrons and fast (E>3 MeV) neutron measurements made with sulfur. Fortunately, while the calculation of observables has been improved, this has done very little to the dose at Nagasaki, as shown in Figure 2.8, which depicts the ratio of 1995 free-field dose to DS86 free-field dose as a function of distance from the hypocenter.
In the case of Hiroshima, new nuclear data and computer power had little effect on the agreement between calculation and measurement of either neutron thermal activation or gamma-ray TLD measurements. However, these factors significantly changed the agreement with the sulfur data from suggesting a yield of 12.7 kT to suggesting a yield of nearly 17 kT as shown in Figure 2.9. This evidence, taken with that from thermal radiation and blast observations, indicates that it is highly likely that the Hiroshima weapon yield was higher than the 15 kT used in DS86. The effects on free-field dose of such a yield change, together with the change provided by new cross sections and computer power are shown in Figure 2.10. The yield change causes an increase of approximately 20% in the gamma-ray dose, while the cross section changes cause an increase of as much as 50% in the neutron dose. Thus, as we near the end of 1995, it seems clear that any future changes to DS86 are likely to leave Nagasaki free-field doses relatively unchanged, whereas it is very likely that free-field doses at Hiroshima will be increased, perhaps substantially.
A Glimpse Of The Future
Investigations have been carried out to determine whether a change in the Hiroshima weapon neutron leakage could provide a solution to the outstanding disagreement between calculations and measurements of thermal neutron activation. Figure 2.11 shows that it is indeed possible to improve the agreement by changing the source, though there remain some measurements which cannot be reconciled with the calculations using source neutrons of any energy. The change in source results in a considerable increase in the neutron free-field dose, as shown in Figure 2.12. As shown previously in Figure 2.10, the yield increase results in an
increase of approximately 20% over DS86. However, the neutron free-field dose increases by nearly a factor of 5.
Unfortunately, at present the only way to obtain simultaneous agreement with all three sets of observations at Hiroshima, gamma-TLD, sulfur neutron and thermal neutron activation measurements, is to invent a source which has no possibility of existing under any circumstances. As shown in Figure 2.13, compared to the existing Hiroshima neutron leakage, the revised source must have ten times as many neutrons in a narrow band from 2.3 MeV to approximately 3 MeV. A substantial reduction in leaking neutrons is required in the range from 0.5-2 MeV. While this source is capable of reconciling all existing observations at Hiroshima to an acceptable degree, it is not considered to be a reliable predictor of dose. Hence, investigations along these lines merely indicate the expected direction of dose changes, i.e., upward, but cannot definitively determine their amount.
The fact that only a physically impossible source can reconcile calculations with measurements at Hiroshima suggests that it is the transport cross sections rather than the source which is in error. Of course, any changes to the cross sections would have to leave calculations of fluence from Nagasaki-like weapons unchanged.
TABLE 2.3 Potential change in Hiroshima dose resulting from reconciliation with measurements.
|
Component |
Absorbed Dose (cGy) |
Dose equivalent (cSv) |
|
DS86 |
||
|
Neutron |
0.85 |
8.50 |
|
Gamma-ray |
48.80 |
48.80 |
|
Total |
49.65 |
57.30 |
|
% Neutron |
1.74 |
17.42 |
|
Revision 1995? |
||
|
Neutron |
3.83 |
38.25 |
|
Gamma-ray |
58.56 |
58.56 |
|
Total |
62.39 |
96.81 |
|
% Neutron |
6.53 |
65.32 |
|
% Change in total: |
25.65 |
68.95 |
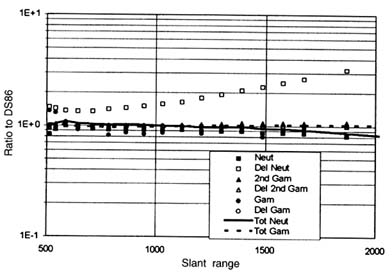
FIGURE 2.8 Ratios of 1995 to DS86 free-field dose components for Nagasaki.
The solution to the neutron discrepancy at Hiroshima will not be easy or inexpensive to obtain. This raises an inevitable question: Is it worthwhile to pursue a solution to this and any other outstanding problems with the dosimetry? The answer to this question can only be guessed at based on the evidence at hand. If the dose values resulting from the optimized source may be trusted sufficiently to suggest the order of a likely increase in neutron dose resulting from the reconciliation of calculations and measurements at Hiroshima, then the overall dosimetry changes would likely be similar to those shown in Table 2.3. At 1,500 m the absorbed dose would increase by approximately 25%, and the dose equivalent (assuming a quality factor of 10) would increase by nearly 70%. While it is claimed that with the advent of DS86 there is no statistically significant difference between risks for various cancers at the two cities, nevertheless it is clear that an increase in dose at Hiroshima would improve intercity agreement as represented for DS86 leukemia mortality (Shimizu et al., 1989), as shown in Figure 2.14.
Random error in assigning doses to survivors is a very important factor in differentiating between the two cities or establishing the shape of the risk curves, particularly at low dose. Of course no dosimetry system, no matter how precise, is any better than the data taken from the survivors themselves. An attempt was made to quantify the error associated with survivor recall of location and shielding by having 88 survivors give a second survivor history after an eight-year interval (Kaul and Egbert, 1989).
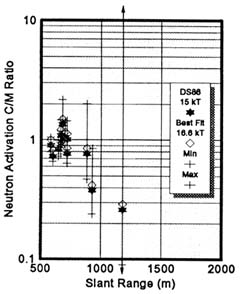
FIGURE 2.9 Sulfur activation measurements at Hiroshima, 1995 comparison with calculations.
When the data from the first and second histories for each survivor are compared in the context of DS86, it is found that over 60% of this group showed no change in dose due to variations in either location relative to the hypocenter or with respect to shielding. Overall, it is found that the coefficient of variation in dose associated with location with respect to the hypocenter is approximately 14% for both cities and that associated with shielding is approximately 11%. Thus, the minimum random uncertainty that may be expected to be associated with survivor total doses is approximately 20%.
It has already been shown that changes due to any reconciliation with neutron activation measurements at Hiroshima will likely be greater than the minimum uncertainty expected based on the quality of data taken from survivors themselves, but what of other aspects of DS86, like shielding? There is reason to believe that some important sources of error exist in DS86, which affect its use in epidemiological studies. One important potential error is that associated with Nagasaki. In Figure 2.14 it can be seen that the risk of leukemia death goes to zero at approximately 40 cGy. The cohort in this dose regime at Nagasaki is dominated by a large group of survivors in the Mitsubishi Heavy Industries Shipyard factory, approximately 1,700 m from the hypocenter. Shielding analysis performed as part
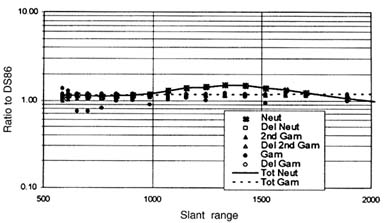
FIGURE 2.10 Ratios of 1995 to DS86 free-field dose components for Hiroshima.
of DS86 determined that these persons were very lightly shielded. A possible explanation for the discrepancy between the risks at the two cities is that the actual shielding of the factory workers may be much greater than currently estimated.
Benchmark studies have been performed, comparing DS86 shielding assessment to rigorous calculations for survivors based on their individual shielding histories. These studies suggest that the random error in terms of coefficient of variation caused by limitations in DS86 is as great as 31%. This is considerably greater than the baseline error estimate of 20% due to survivor recall variations. Most of DS86 random shielding error has been identified as arising from the use of shielding descriptions inherited from T65D. One of the ground rules for the creation of DS86 was that it rely on data coded for use in T65D, because to revisit the survivor shielding histories was assumed to be impractical with existing RERF staff and probably unnecessary. The results of the benchmark studies posed a significant challenge to the reliance on T65D data. For example, there is the matter of how T65D determined whether a survivor was or was not shielded by an adjacent house. According to T65D, if the house was more than two house heights away from the survivor, that house was not counted as providing shielding. This criterion was based on experiments performed at NTS with a fast reactor located on a high tower to simulate the bomb. Fast neutrons from that reactor created gamma-rays in a large volume, limiting the value of shielding in the shadow of test structures.
In fact, at Hiroshima and Nagasaki, there were few fast neutrons and the gamma-rays could be characterized as coming from a point. Thus, any structure in the line

FIGURE 2.11 Measured thermal neutron activation at Hiroshima and that calculated in 1995 with new nuclear data and yield (left) and with an optimized source (right).
of sight between the survivor and the bomb, no matter how far away, would provide some shielding. Thus, the T65D category with no adjacent house shielding should be broken up into two categories, one in which there is actually a house in the line of sight, providing approximately 50% more shielding than currently accounted for, and another in which there is truly no house in the line of sight, providing half as much shielding.
The presumed impracticality of returning to the shielding histories to obtain more accurate data for use in DS86 is debatable. In fact, RERF staff returned to those histories to obtain some data, such as survivor orientation and terrain shielding information, for use in DS86. Thus, given the proper instructions and the use of templates for assessing physical information from shielding drawings, it does not

FIGURE 2.12 Ratios of DS86 values to free-field dose components calculated using an optimized source, at Hiroshima.
seem unreasonable to believe that a more precise job of shielding classification could be performed.
Finally, given that uncertainties in the assigned dose will always exist to some extent, is there any alternative to current dosimetry methods or any better way of assessing their accuracy? The answer to both these questions is yes. Straume (1995) has demonstrated that very high quality epidemiologic regressions may be obtained for excess relative risk of total solid tumors based on the incidence of some observed quantal response, such as chromosome aberrations, as illustrated in Figure 2.15. Because such incidence can also be produced in vitro, the relationship to radiation intensity and quality may be obtained independently.
Of course, this approach has significant limitations. Assessment of chromosome aberrations or of any other observable would be a very expensive undertaking and would be limited to living survivors or those for whom blood or tissue samples have been retained. Some of the benefits of this approach can be realized, such as the independence from radiation quality considerations, by using DS86 fluence spectra to calculate the biological quantal response, based on relationships established in

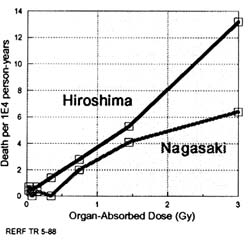
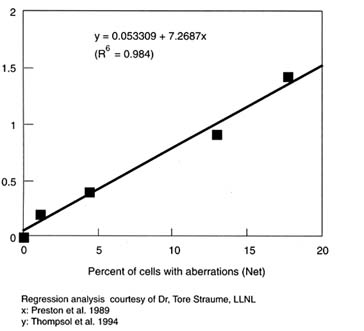
FIGURE 2.15 Relative risk of total solid tumors versus chromosome aberration incidence.
vitro between a biological observable and hit size as defined by microdosimetric theory. This approach has the further advantage that it can be compared directly to observations in individual survivors, thereby providing a basis for direct assessment of the accuracy of DS86 and newer systems to come.
Acknowledgments
The author would like to acknowledge the technical contributions made to work reported in this paper by S.D. Egbert and W.A. Woolson, SAIC. Portions of this work were supported under Defense Nuclear Agency contract DNA001-94-C-0135.