Effects of Ionizing Radiation: Atomic Bomb Survivors and Their Children (1945-1995) (1998)
Chapter: 12 Interaction Between Radiation Dose and Other Cancer Risk Factors
12
Interaction Between Radiation Dose and Other Cancer Risk Factors
CHARLES E. LAND
Summary
Ionizing radiation exposure is a well-established, probabilistic risk factor for cancer of various organs, based in large part on studies of the Hiroshima and Nagasaki A-bomb survivors. For many of these organ sites, other risk factors have also been identified and their associated risks quantified. Knowledge about the joint effects of radiation and other risk factors is central to understanding the role each plays in the causation of cancer, and to transferring risk coefficients to populations other than those from which they were derived. Such knowledge has been surprisingly difficult to obtain, largely because results must be fairly precise to be of much use. Investigations have been most successful for female breast cancer among A-bomb survivors in relation to reproductive history, and for lung cancer among uranium miners in relation to smoking history. In the first case, a level of synergy that is at least multiplicative has been estimated between radiation dose and age at first full-term pregnancy, whereas in the second, the relationship between radon exposure and smoking history appears to be non-additive but probably less than multiplicative. The steps by which these inferences were reached are outlined in some detail.
Introduction
Site-specific studies of radiation dose and cancer risk, in the Life Span Study (LSS) sample of the Radiation Effects Research Foundation (RERF) and in other exposed populations continually followed up over time, proceed in a series of
steps beginning with the evaluation of evidence that a dose-related excess risk actually exists. Once a dose-response relationship has been strongly established, it becomes possible to study modifiers of radiation-related risk with some hope of success. Usually, the first modifiers to be considered are sex, age at exposure, age at observation (attained age), and time following exposure, since information about them is usually obtained at the same time as information on radiation exposure and disease occurrence. Modification of dose-response by factors other than those just mentioned is a more difficult problem, because it usually requires special data-gathering efforts. The discussion that follows covers interactions between radiation and smoking as causes of lung cancer and, at somewhat greater length, interactions between radiation and reproductive history as risk factors for female breast cancer.
Main Effects: Radiation
Radiation dose from the atomic bombings of Hiroshima and Nagasaki is a strong risk factor for female breast cancer (Tokunaga et al., 1994) and for lung cancer (Thompson et al., 1994). For breast cancer, the dose-response function is steep and linear (Figure 12.1). Excess relative risk at 1 Sv (ERR1Sv) declined markedly with age at exposure, a phenomenon that can be described adequately as either a negative exponential in age ATB, or as a step function with breaks at ages 20 and 40 (Table 12.1). Within age-ATB cohorts, ERR1Sv depended hardly at all on attained age (Table 12.2) except for an anomalously high value before attained age 35 among women exposed before age 20. The latter finding may reflect the existence of a highly susceptible genetic subgroup, a possibility that can be investigated in the light of recent discoveries in molecular genetics beginning with the identification of genes possibly involved in familial aggregations of breast cancer (Wooster et al., 1994), the cloning of two of them (Miki et al., 1994; Savitsky et al., 1995), and the identification of specific heritable mutations (Shattuck-Eidens et al., 1995; Struewing et al., 1995a, 1995b). With this exception, however, there is no evidence that ERR1Sv depends markedly upon attained age or time following exposure. Based on individual dose estimates and a fitted dose-response model allowing for variation by age ATB, about 17% of the 591 breast cancers observed during 1950–1985, among female survivors with DS86 estimates, were caused by their exposure. By age ATB, this percentage is estimated to be 27% for women under 20 ATB, 15% for those 20–39 ATB, and 7.5% for those exposed at 40 years of age or older.
For lung cancer, the dose-response is also linear, or at least not significantly different from linearity [Figure 12.2; computed from LSS Tumor Registry data for 1958–1987 (Thompson et al., 1994) and obtained by special arrangement from the Radiation Effects Research Foundation in Hiroshima and Nagasaki]. The most remarkable finding is a substantial and highly significant (p=0.0002) difference in slope between males (ERR1Sv = 0.439, 95% confidence interval 0.14–0.81) and
TABLE 12.1 Female breast cancer incidence, LSS sample, 1950–1985: estimated excess relative risk at 1 Sv (ERR1Sv), by age ATB (E). Comparison of a fitted negative exponential model, ERR1Sv = 3.60 exp(-0.0373 E), and stepwise models corresponding to various intervals of age ATB.
|
Age ATB |
Exponential model |
5-year intervals |
10-year intervals |
20-year intervals |
Combined ages ATB |
|
0–4 |
3.32 |
4.64 |
3.21 |
2.41 |
1.36 |
|
5–9 |
2.79 |
2.08 |
|
|
|
|
10–14 |
2.27 |
1.82 |
2.19 |
|
|
|
15–19 |
1.92 |
2.49 |
|
|
|
|
20–24 |
1.59 |
1.18 |
1.27 |
1.25 |
|
|
25–29 |
1.32 |
1.45 |
|
|
|
|
30–34 |
1.09 |
0.96 |
1.23 |
|
|
|
35–40 |
0.91 |
1.60 |
|
|
|
|
40–44 |
0.75 |
0.02 |
0.54 |
0.48 |
|
|
45–49 |
0.63 |
1.78 |
|
|
|
|
50–54 |
0.52 |
0.51 |
0.31 |
|
|
|
≥55 |
0.38 |
0.12 |
|
|
|
|
Deviance (d.f.)* |
7.32(1) |
13.64(11) |
8.99(5) |
8.36(2) |
0.00(0) |
|
* Difference in deviance cf. the single interval model in the right-most column. |
|||||
TABLE 12.2 Female breast cancer incidence, LSS sample, 1950–1985: Estimated excess relative risk at 1 Sv (ERR1Sv), by age ATB and attained age.
|
|
0–19 ATB |
|
20–39 ATB |
|
≥40 |
|
|
Attained age (years) |
ERR1sv |
(95% CI) |
ERR1sv |
(95% CI) |
ERR1sv |
(95% CI) |
|
<35 |
14.40 |
3.85–125.00 |
– |
– |
– |
– |
|
35–44 |
1.45 |
0.51–3.03 |
0.96 |
0.05–2.86 |
– |
– |
|
45–54 |
2.64 |
1.29–4.81 |
1.49 |
0.59–2.96 |
< 0 |
– |
|
55–64 |
1.80 |
-0.02–8.33 |
1.13 |
0.32–2.51 |
< 0 |
– |
|
65–74 |
– |
– |
0.81 |
Unk–3.12 |
0.62 |
Unk–2.42 |
|
≥75 |
– |
– |
– |
– |
0.76 |
Unk–3.11 |
|
p-value for trend |
0.087 |
|
0.63 |
|
0.22 |
|
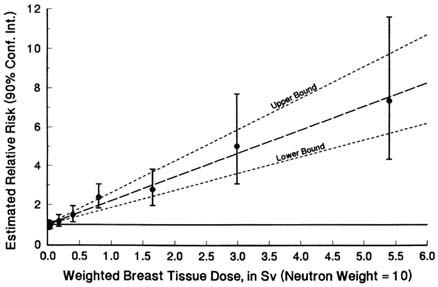
FIGURE 12.1 Breast cancer incidence among female atomic bomb survivors, Life Span Study sample, 1950–1985 (Tokunaga et al., 1994). Excess relative risk, indirectly standardized by city of exposure, age at the time of the bombings, age at observation for risk, and calendar year, by weighted radiation dose to breast tissue (neutron RBE = 10 relative to gamma rays).
females (ERR1Sv = 1.85, 1.24–2.60). There is no evidence that age at exposure, attained age, or time following exposure are important modifiers of dose-response (Table 12.3). Based on individual dose estimates, a linear dose-response model, and the estimated, sex-specific values of ERR1Sv, about 5.4% of the 511 lung cancers observed among exposed, known-dose LSS males during 1958–1987 and 17.7% of the 366 observed among females would not have occurred in the absence of radiation exposure.
The overall level of radiation-related lung cancer associated with exposure to inhaled radon and its decay products among various cohorts of underground miners of uranium and other minerals is considerably higher than that among A-bomb survivors. In a combined analysis of data from 11 different studies, Lubin et al. (1995) estimated a linear dose-response coefficient of 0.0049 per working level month (WLM) for excess relative risk over the range 0–400 WLM, with a less steep increase from 400 to about 2,500 WLM.

FIGURE 12.2 Lung cancer incidence among atomic bomb survivors with under 4 Gy kerma, Life Span Study sample, 1958–1987 (Thompson et al., 1994). Fitted linear dose-response curves, with 95% confidence limits and indirectly standardized by city, age ATB, and attained age, for male and female survivors: weighted radiation dose to lung tissue (neutron weight of 10 relative to gamma rays).
Main Effects: Smoking
Cigarette smoking is a far stronger lung cancer risk factor than the gamma rays and neutrons received from the Hiroshima and Nagasaki atomic bombs. Habitual two-pack-per-day smokers have about 24 times the lung cancer mortality of lifelong nonsmokers (Rogot and Murray, 1980) whereas, even at the near-lethal level of 5 Sv, the estimated relative risks from A-bomb survivor data, unadjusted for smoking, are only about 3 for males and 10 for females. Only very high levels of alpha radiation from inhaled radon decay products yield estimates of radiation-related lung cancer risk that approach or exceed those associated with heavy smoking habits (National Research Council, 1988).
TABLE 12.3 Lung cancer incidence, 1958–1987, LSS tumor registry data (Thompson et al., 1994). Estimated excess relative risk at 1 Sv, adjusted for sex and standardized to males, by age ATB, attained age, and calendar time.
|
Factor |
ERR1Sv |
95% CI |
p-value for trend |
|
Age ATB: |
|||
|
0–19 |
0.59 |
0.49–1.64 |
|
|
20–39 |
0.41 |
-0.04–0.96 |
|
|
≥40 |
0.46 |
-0.04–0.96 |
0.63 |
|
Attained age(y): |
|||
|
<55 |
0.50 |
0.37–1.44 |
|
|
55–74 |
0.44 |
-0.09–0.91 |
|
|
≥75 |
0.50 |
0.11–1.12 |
0.90 |
|
Age ATB: |
|||
|
1958–65 |
0.70 |
0.47–1.60 |
|
|
1966–75 |
0.49 |
0.11–1.12 |
|
|
1976–85 |
0.38 |
-0.19–0.83 |
|
|
1986–87 |
0.47 |
0.36–1.43 |
0.50 |
The high rates of lung cancer among cigarette smokers, and the historically high prevalence of smoking in many populations with histories of substantial radiation exposure, make it difficult to study radiation as a risk factor without taking smoking history into account. This is especially true if the radiation effect is relatively small. Smoking information, available for 50% of the total LSS cohort (Shimizu et al., 1989), indicates that the proportions of smokers are 84% for males and 16% for females. An analysis restricted to mortality among the subcohort with smoking information obtained estimated excess relative risks of 0.1 and 1.2 for men and women, respectively, exposed to 1 Gy tissue kerma at age 30. The estimated relative risk (RR) of lung cancer for a person with a 40 pack-year smoking history (e.g., 20 cigarettes a day for 40 years) was about 16 compared to a nonsmoker, after adjustment for radiation dose, sex, and age ATB (Shimizu et al., 1989 Table 13). Adjustment of the mortality data for smoking increased the estimated ERR 1Gy for males from 0.1 to 0.5 while reducing that for females from 1.2 to 1.0.
Interaction: Smoking And Radiation Dose
A case-control interview study was conducted of 485 LSS lung cancer cases and 1,089 controls matched on sample status (AHS or non-AHS), city, sex, date of birth, and survival status (Blot et al., 1984); subjects (or, more often, next of kin) were interviewed about smoking histories. Analyses of these data, as reported by the BEIR IV committee (NRC, 1988), found relative risks for the highest radiation dose group (1+Gy) of 1.6 for men and 4.0 for women; for smoking, the RR was 17.2 for men who smoked more than 20 cigarettes per day, and 3.7 for women who smoked more than 10 per day (the highest level tabulated). Separate interaction analyses by sex, for radiation dose versus cigarettes per day (Table 12.4) and for dose versus years smoked (not shown), did not discriminate between an additive interaction model and a multiplicative model, neither of which could be rejected. The lack of information in this study probably stems from (1) the rather low radiation dose-response among men, (2) the high proportion of male smokers and the low proportion of female smokers, and (3) the relatively small number of high-dose A-bomb survivors.
The BEIR IV committee also reported an interaction analysis of data from a case-control study of New Mexico uranium miners (52 cases and 218 controls), categorized by years of mining and number of cigarettes per day. This study also was inconclusive, perhaps because years of mining is an inadequate surrogate for cumulative WLM. The committee also reported a cohort analysis of Colorado Plateau miners, based on 151 cases and 65,365 PY with exposures under 2,000 WLM, categorized by age at diagnosis, cigarette consumption, and cumulative WLM (Table 12.5). Their analysis (Table 12.6), which represented multiplicative and additive interaction models as special cases of a more general mixture model, did not reject the mixture model (P¦x235 > 37.8 = 0.34), the multiplicative model (P¦x236 > 38.6 = 0.35), or the additive model (P¦x36 > 44.6 = 0.15). However, in the more limited context of the mixture model and the mixture parameter ![]() the estimated value
the estimated value ![]() = 0.4 was significantly different from the value
= 0.4 was significantly different from the value ![]() = 0 corresponding to the additive model, but consistent with the value
= 0 corresponding to the additive model, but consistent with the value ![]() = 1.0 corresponding to the multiplicative model. In their report, the committee emphasized that the deviance (versus the marginally saturated model estimates tabulated in Table 12.5) was virtually the same for the multiplicative model and the best-fitting mixture model, even though 1.0 and 0.4 are quite different numbers, and that
= 1.0 corresponding to the multiplicative model. In their report, the committee emphasized that the deviance (versus the marginally saturated model estimates tabulated in Table 12.5) was virtually the same for the multiplicative model and the best-fitting mixture model, even though 1.0 and 0.4 are quite different numbers, and that ![]() = 0.4 was in no sense a ''halfway point" between the additive and multiplicative models. Based on their analysis, the committee concluded that the multiplicative interaction model was an adequate representation of the interaction between smoking and radon exposure, and that the additive model was not.
= 0.4 was in no sense a ''halfway point" between the additive and multiplicative models. Based on their analysis, the committee concluded that the multiplicative interaction model was an adequate representation of the interaction between smoking and radon exposure, and that the additive model was not.
More recently, Lubin and Steindorf (1995) modeled joint relative risks for smoking history (ever versus never) and exposure to inhaled radon decay products among six cohorts of US uranium miners for which such information was available. They concluded that, at that level of smoking history detail, the best-fitting interaction
TABLE 12.4 Analysis of case-control data on smoking rate and radiation exposure from a case-control study of lung cancer among A-bomb survivors: relative risks by sex, number of cigarettes per day, and radiation dose. (Adapted from BEIR IV Tables VII-5 and VII-8, National Research Council, 1988; based on data from Blot et al., 1984).
|
|
Observed |
Fitted additive models |
Fitted multiplicative models |
||||||
|
Cigarettes/day |
<0.01Gy |
0.01–0.99 Gy |
≥ 1 Gy |
<0.01 Gy |
0.01–0.99 Gy |
≥ 1 Gy |
<0.01 Gy |
0.01–0.99 Gy |
≥ 1 Gy |
|
Males |
|||||||||
|
0 |
1.0 |
1.3 |
3.3 |
1.0 |
0.9 |
3.5 |
1.0 |
0.8 |
1.6 |
|
1–10 |
3.7 |
2.4 |
7.2 |
3.0 |
2.9 |
5.5 |
2.7 |
2.2 |
4.3 |
|
11–20 |
6.9 |
6.6 |
10.6 |
6.0 |
5.9 |
8.5 |
5.5 |
4.4 |
8.8 |
|
≥20 |
26.5 |
13.2 |
24.8 |
19.4 |
19.3 |
21.9 |
17.2 |
13.8 |
27.5 |
|
|
X2 (d.f.) goodness-of-fit |
X2(5)=2.2 p = 0.90 |
X2(5)=2.3 p = 0.89 |
||||||
|
Females |
|||||||||
|
0 |
1.0 |
0.7 |
5.2 |
1.0 |
0.6 |
4.9 |
1.0 |
0.6 |
4.0 |
|
1–10 |
2.3 |
2.5 |
5.2 |
2.4 |
2.0 |
6.1 |
2.2 |
1.3 |
8.8 |
|
≥11 |
4.2 |
2.1 |
— |
3.3 |
2.9 |
(7.2) |
3.3 |
2.0 |
(14.8) |
|
|
X2 (d.f.) goodness-of-fit |
X2(4)=0.7 p = 0.95 |
X2(4)=1.7 p = 0.79 |
||||||
TABLE 12.5 Relative risks for lung cancer among Colorado Plateau uranium miner cohort: risks relative to rate in the entire cohort, by age, number of cigarettes per day, and cumulative working level months (WLM). (Adapted from BEIR IV, Table VII-10).
|
|
Cumulative exposure in working level months |
|||||
|
Cigarettes/day |
0–59 |
60–119 |
120–239 |
240–479 |
480–959 |
960+ |
|
Age <65 |
||||||
|
0–4 |
0.00 |
0.00 |
0.00 |
0.18 |
0.48 |
0.80 |
|
5–19 |
0.12 |
0.00 |
0.17 |
0.13 |
0.34 |
1.00 |
|
20–29 |
0.10 |
0.20 |
0.36 |
0.41 |
0.64 |
2.20 |
|
≥40 |
0.12 |
0.58 |
0.18 |
0.81 |
1.04 |
2.87 |
|
Αge ≥65 |
||||||
|
0–4 |
0.00 |
0.00 |
0.50 |
0.60 |
1.00 |
0.55 |
|
5–19 |
0.00 |
0.00 |
0.98 |
0.00 |
0.78 |
0.63 |
|
20–29 |
1.65 |
0.00 |
1.16 |
0.77 |
3.08 |
0.00 |
|
≥40 |
0.00 |
3.41 |
0.99 |
0.74 |
1.17 |
2.48 |
model was intermediate between the additive and multiplicative interaction models; according to a mixture model like that described in Table 12.7, the best fit was obtained for λ = 0.12, with 95% confidence interval 0.1–0.6. The multiplicative model (λ = 1) was statistically rejected but fit the data somewhat better than the additive model (λ = 0), which was rejected at a more extreme level of significance. Thus, the ratio of radon-related to non-radon-related cancers was estimated to be higher among nonsmokers than among smokers, although for a given radon exposure level more radiation-related lung cancers were estimated to occur among smokers.
Main Effects: Reproductive History
In all populations in which it has been studied, breast cancer risk has a strong dependence upon reproductive history (Kelsey et al., 1993). Within populations,
nulliparous women have risks comparable to those of parous women whose first full-term pregnancies occurred at about age 30, while a first full-term pregnancy before age 18 is associated with a risk that is only one third as high. Studies differ on whether number of children and length of lactation history are independently related to risk or are merely strong negative correlates of age at first full-term pregnancy. Late age at menarche and early age at natural menopause are protective in many studies, and a bilateral oophorectomy prior to menopause is strongly protective.
A case-control interview study was conducted at RERF, first, to confirm that various aspects of reproductive history identified in other populations are also determinants of breast cancer risk in the LSS population (Land et al., 1994a) and, second, to investigate the interaction of such factors with radiation dose (Land et al., 1994b). At the time of case selection, 473 cases had been identified, of whom 233 were still alive and living in or near Hiroshima or Nagasaki. Six of the latter number were later determined not to be cases and were dropped from the analysis. Refusals, usually because of ill health, reduced the final number to 196. Controls (n=566), individually matched to the cases by city, age ATB, exposure status and radiation dose if exposed, were selected using a variable matching ratio. Four controls were selected if the case had a tissue dose greater than 0.5 Gy or was from Nagasaki; otherwise, 2 controls were selected. Losses of potential controls due to refusal (9 percent) or residence outside the contacting area (6 percent) were approximately the same as for the cases. Subjects were interviewed in their homes or at RERF.
Matching of cases and controls by radiation dose was the major design innovation. The rationale for this was that all the information that could be obtained about radiation dose-response would be available from past, concurrent, and future studies of breast cancer incidence in the entire LSS cohort, and that information about dose-response from the case-control study therefore would be superfluous. Furthermore, matching on radiation dose, and incidentally ensuring that the case-control study could provide no useful information about dose-response, would minimize any need to adjust for radiation dose when investigating other variables as main effect factors. The most important consideration, however, was that the design change would improve statistical power for investigating interactions with radiation dose (Land, 1990).
A number of reproductive history factors, many of them highly correlated, were strongly related to breast cancer risk. Among them were age at first full-term pregnancy, number of births, and cumulative lactation history. Age at first full-term pregnancy was at least marginally significantly related to risk even after adjustment for number of births and/or cumulative lactation, whereas the latter two variables were more highly correlated with each other (Table 12.7). All three of these variables were somewhat more strongly associated with risk for premenopausal than for postmenopausal cancer, a difference that was marginally significant for cumulative lactation (Land, 1994a).
TABLE 12.6 Results of BEIR IV interaction analysis of smoking and radiation exposure among Colorado Plateau uranium miners (adapted from National Research Council, 1988, Table VII-11).
|
Model |
Deviance |
d.f. |
Deviance difference (1 d.f.) |
Prob. |
|
Radd = 1 + α(WLM) + β(smoking) |
44.6 |
36 |
6.8 |
0.014 |
|
Rmult = (1 + α(WLM))(1 + β(smoking)) |
38.6 |
36 |
0.8 |
0.370 |
|
Rmix = (Rmult)λ(Radd)1 - λ* |
37.8 |
35 |
— |
— |
|
* Fitted value λ = 0.4. |
||||
TABLE 12.7 Main-effect analyses for breast cancer risk in relation to reproductive history (Land et al., 1994a). Age at first full-term pregnancy, number of births, and cumulative lactation history, in years. Estimated relative risks by factor level.
|
Main effect |
Relative risk |
|
Age at first full pregnancy |
|
|
Nullip. |
1.00 |
|
30–39 |
0.95 |
|
27–29 |
0.85 |
|
24–26 |
0.61 |
|
21–23 |
0.50 |
|
17–20 |
0.39 |
|
p-value for trend |
|
|
Unadjusted |
<0.0001 |
|
Adjusteda |
— |
|
Adjustedb |
0.066 |
|
Adjustedc |
0.070 |
|
Number of births |
|
|
0 |
1.00 |
|
1 |
0.76 |
|
2 |
0.73 |
|
3–4 |
0.39 |
|
5–6 |
0.34 |
|
≥7 |
0.14 |
|
p-value for trend |
|
|
Unadjusted |
<0.0001 |
|
Adjusteda |
0.030 |
|
Adjustedb |
— |
|
Adjustedc |
0.16 |
|
Cumulative lactation (years) |
|
|
0 |
1.00 |
|
0.1–0.5 |
0.61 |
|
0.6–1.0 |
0.78 |
|
1.1–2.0 |
0.56 |
|
2.1–4.0 |
0.36 |
|
4.1–9.8 |
0.31 |
|
p-value for trend |
|
|
Unadjusted |
<0.0001 |
|
Adjusteda |
0.041 |
|
Adjustedb |
0.40 |
|
Adjustedc |
— |
|
a Adjusted for age at first full-term pregnancy. b Adjusted for number of births. c Adjusted for cumulative lactation period. |
|
Age at menarche and age at menopause, somewhat surprisingly, were not related to risk. Another surprise was that the data provided no useful information on family history of breast cancer, apparently because subjects often or usually lacked information about cancer diagnoses among their close relatives.
Interaction: Radiation and Reproductive History
The question of interaction between radiation dose and other breast cancer risk factors is important for a number of reasons. One is that women deemed for various reasons to be at unusually high risk of breast cancer conceivably might be especially sensitive to the carcinogenic effects of x-rays used in monitoring for early cancer detection. More generally, we might hope through investigations of interaction to refine our estimates of radiation-related risk by taking proper account of ancillary information about populations and individuals at risk. Perhaps even more important from a long-term perspective is the possibility of gaining insights into why certain personal characteristics (e.g., age at first full-term pregnancy) are associated with increased or decreased breast cancer risk, by observing their modifying influences on the effects of an independent exposure to a known carcinogen, ionizing radiation.
Like the analyses of radiation, smoking, and lung cancer among A-bomb survivors and uranium miners mentioned above, the analysis concentrated on two simple interaction models, the additive and the multiplicative, and a parametric mixture model containing the two simple models as special cases. Relative risk was assumed to be linear in radiation dose, with age-ATB-specific coefficients as estimated from the 1950–1985 LSS cohort breast cancer incidence data (Tokunaga et al., 1994), and linear in each of the reproductive history factors tested:
Here, αE = 3.6 exp(-0.03735 E) as estimated by Tokunaga et al. from the 1950–1985 LSS cohort data, where E denotes age ATB. The parametric mixture model,
was chosen for computational convenience. It was somewhat different from the geometric mixture model used by the BEIR IV committee but fulfilled the same function, i.e., the analysis essentially depended on a single parameter, θ , for discriminating between the additive (θ = 1) and multiplicative (θ = 0) interaction models.
In all analyses involving interaction models, the reproductive history variables were translated to have zero mean in the case-control set. This was done because the radiation dose-response coefficients had been estimated from the entire cohort, without reference to reproductive history. Thus they are defined with respect to a reference set with zero dose, and reproductive history covariates equal to their
TABLE 12.8 Supplementary interaction analysis of breast cancer case-control study data (Land et al., 1994b), using the approach of Table 12.6. In the analysis, as in that of Figure 12.3, αE = 3.6 exp(-0.03735 E) as estimated by Tokunaga et al. (1994) from the 1950–1985 LSS cohort data, where E denotes age ATB, D denotes weighted breast tissue dose (DS86) in Sv (neutron RBE = 10). X denotes age at first full-term pregnancy, with nulliparous women assigned default value 30, minus the sample mean for that variable.
|
Model |
Deviance |
Chi-square (1 d.f.)a |
p-value |
|
Additive: Radd(D,X;β) = 1 + αED + βX |
393.88 |
10.08 |
0.0015 |
|
Multiplicative: Rmult(D,X;β) = (1 + αED)(1 + βX) |
387.27 |
3.586 |
0.0580 |
|
Mixture:b Rmix(D,X;β,λ) = (Rmult)λ(Radd)1-λ |
383.69 |
— |
— |
|
a Difference in deviance between the designated model and the mixture model. b Fitted value λ = 3.55, with 95% confidence interval 0.94–47.7. |
|||
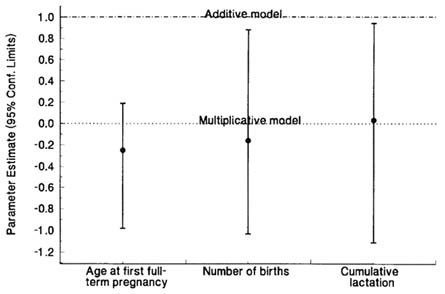
FIGURE 12.3 Summary of interaction analyses for each of three reproductive history variables as joint breast cancer risk factors with radiation dose (Land et al., 1994b). Point estimates and 95% confidence intervals for the parameter in the model, Rmix(D,X;β ,θ ) = (1 + αED)(1 + β X/1 + αE)θ ), where αe = 3.6 exp(-0.03735 E) as estimated by Tokunaga et al. (1994) from the 1950–1985 LSS cohort breast cancer incidence data, and where E denotes age ATB, D denotes weighted breast tissue dose (DS86) in Sv (neutron RBE = 10), and X denotes age at first full-term pregnancy with a default age of 30 years for nulliparous women, number of births, or cumulative lactation history in years. In this model, θ = 0 corresponds to the multiplicative model, Rmult(D,X;β ) = (1 + αED) (1 + β β X), and θ = 1 to the additive model, Radd(D,X;β ) = 1 + αED + β X.
respective population means. It follows, then, that these covariates should have the same reference set, which is accomplished, approximately, by translating each covariate by its sample mean in the case-control set.
The results are as shown in Figure 12.3. The estimated value of the parameter θ was significantly less than one for all three reproductive history variables, but consistent with zero. Thus, for all three variables, the additive model was rejected, whereas the multiplicative model was consistent with the data. Thus, in this population, early age at first full-term pregnancy, multiple births, and lengthy lactation history were all protective against breast cancer risk generally, and also protective against radiation-related breast cancer risk.
When separate analyses were done by age ATB, the discrimination between models appeared to be somewhat stronger for women under 20 ATB, perhaps because the radiation dose response was stronger. There were six cases with diagnoses at ages under 35 for whom the radiation-related risk may have been substantially higher than at older attained ages (Table 12.2); however, deleting those six case-control sets did not change the results appreciably.
None of the women under age 17 ATB reported experiencing a pregnancy before age 17. It is interesting that the interaction analysis for age at first full-term pregnancy, restricted to that age cohort, yielded the same multiplicative (or super-multiplicative) relationship as that for all women under 20 ATB (estimated value of θ,-0.26 with upper confidence limit 0.31). Thus, excess risk among women exposed as young girls was reduced by a subsequent full-term pregnancy at a young age, and increased by nulliparity or a late first pregnancy. The finding suggests that terminal differentiation of cells for milk secretion, induced by a full-term pregnancy, may reduce the proliferative potential even of cells already initiated by radiation.
The above interpretation is consistent with experimental results obtained by Clifton et al. (1975, 1978). In their study, female rats were irradiated and injected with prolactin-secreting, transplantable pituitary tumors. One group received no further treatment; another received adrenalectomy, which precluded the production of adrenal corticoids necessary for cell differentiation for milk secretion, and another received both adrenalectomy and glucocortisol replacement therapy. High levels of radiation-induced mammary cancer were experienced by the adrenalectomy-only group compared to rats with intact adrenals or adrenalectomized rats given glucocortisol replacement therapy.
Supplementary Analyses
The following analyses may provide additional insight into the underlying interactive relationship between radiation dose and one of the reproductive history variables, age at first full-term pregnancy, as breast cancer risk factors. Figure 12.4 shows logistic model estimates of the relative risk multiplier per additional year of age at first full-term pregnancy, separately for matched case-control sets grouped according to whether the radiation-related ERR estimated from the cohort data was zero, between zero and 0.5, between 0.5 and 1.0, or over 1.0. According to the multiplicative model, the ERR associated with age at first full-term pregnancy does not depend upon the common radiation doses of the matched case-control sets (the dose terms should cancel out, as in the ratio AD / BD, where D represents the common term for dose-related risk), whereas the additive model says that the ERR should approach unity with increasing dose, as in the ratio (D + A)/(D + B). If anything, the estimates diverge from one or remain constant with increasing dose; they do not approach one as predicted by the additive interaction model.

FIGURE 12.4 Logistic model estimates of the relative risk multiplier per additional year of age at first full-term pregnancy (default age 30 for nulliparous women), by radiation dose (estimated dose-related relative risk), compared to predicted values according to the multiplicative and additive interaction models.
Table 12.8 contains the results of an analysis according to the geometric mixture model of Table 12.6, in which the radiation dose component for each subject was fixed at the function of dose and age ATB estimated from the LSS cohort data (Tokunaga et al., 1994). The deviances corresponding to the additive (λ = 0) and multiplicative (λ = 1) models were identical to those obtained in the analysis summarized in Figure 12.3. The best-fitting estimate of λ was 3.55, with 95% confidence limits 0.94–47.7. Thus, as in the analysis of Figure 12.3, the best-fitting model might be described as ''super-multiplicative" in the sense that the effects on ERR of changes in reproductive history appear to increase with increasing radiation dose. Also, as in Figure 12.3, the data were consistent, in the context of a particular general model, with the multiplicative model but not with the additive model.
Figure 12.5 summarizes the results of an exploration of the sensitivity of the interaction analysis of Figure 12.3 for radiation dose and age at first full-term pregnancy, to variations in the dose-response estimated from the cohort data. There was little difference in the analysis if the age-specific dose-response coefficients were replaced by their upper or lower 90% confidence limits. On the right is a stem and leaf plot of the distribution of the point estimate based on 100 simulation

FIGURE 12.5 Sensitivity analysis of the interaction analysis of Figure 12.3 with respect to radiation dose and age at first full-term pregnancy. On the left is the analysis of Figure 12.3, but with 90% confidence limits for the estimate of θ. Next are point estimates and confidence limits for θ when αE was replaced by its lower or upper 90% confidence limit as estimated by Tokunaga et al. (1994). On the right is a stem and leaf plot of the sample distribution of 100 point estimates of θ obtained from 100 simulation runs, in each of which individual dose estimates were allowed to vary randomly and independently according to a simulated lognormal distribution with median equal to the DS86 value and a 30% geometric standard deviation. The maximum point estimate was -0.13, the minimum -0.52.
runs, in each of which individual doses for all of the subjects in the case-control study were allowed to vary randomly and independently according to a lognormal error distribution, with median equal to the respective DS86 estimate and a 30% geometric standard deviation. Thus, both consistent and random changes in the estimated radiation-related excess relative risk estimates, within reasonable ranges of uncertainty, had only minor effects on the results of the interaction analysis.
Conclusions
The contrast between the rather clear interaction results obtained for breast cancer with respect to radiation and reproductive history, and the rather murky findings
for lung cancer with respect to radiation and smoking in the LSS sample mainly reflects the relatively low level of the lung cancer dose-response, particularly among males. This conclusion is reinforced by the more conclusive results obtained for the uranium miner cohort. General uncertainty about smoking information may be another factor. There is more to be learned about radiation-reproductive history interactions in the LSS sample for cancers of other sites, like ovary, as well as breast cancer. Age at first full-term pregnancy is highly correlated with age at first delivery, and information about that variable, like number of children, is relatively accessible and free of uncertainty. At this time there are over 1,000 confirmed cases of female breast cancer among LSS sample members that could be included in a replication of the study described above. Such a study is planned for the near future, and may result in more detailed findings and, possibly, new insights into underlying relationships.