Eclipse: The Celestial Phenomenon That Changed the Course of History (2001)
Chapter: 5. The Turbulent Sun
5
The Turbulent Sun
A few seconds before the Sun was all hid, there discovered itself round the Moon a luminous ring about a digit, or perhaps a tenth part of the Moon’s diameter, in breadth. It was of a pale whiteness, or rather pearl-colour, seeming to me a little tinged with the colors of the iris, and to be concentric with the Moon.
Edmond Halley (1715), describing his observation of the corona, which he took to be of lunar rather than solar origin
The Sun is of huge importance to life on Earth, making it very special. Nevertheless, leaving aside our natural bias one has to say that it is not special at all when compared with other stars.
There are reckoned to be about 400 billion stars in our galaxy, the Milky Way. There are blue-white supergiants, brown dwarfs, pulsars or neutron stars, white dwarfs, red giants, black holes, binary stars we know to be double only from their spectra, X-ray emitting binaries, and too many other distinct categories of stellar creature to mention, let alone describe their properties.
Most stars are rather nondescript, spending most of their lives on what is termed the main sequence, an evolutionary track along which stars with different masses, ages, and chemical compositions are burning hydrogen within their cores. (“Burning” here does not mean simple combustion, which is a chemical reaction with
oxygen, but rather nuclear burning, in that hydrogen nuclei join together to produce helium.) As they do so, they generate far more energy than any trivial chemical reaction, just as nuclear bombs liberate rather more energy than dynamite.
Thankfully our Sun is one of these nondescript stars. Our neighborhood nuclear generator behaves in a regular way, not burping out vast quantities of its star stuff and incinerating any nearby planets, nor shrinking to leave its rocky companions to a frigid existence. At least, the Sun will not do so yet. It has been merrily emitting energy generated by those nuclear reactions in its core for about 4.5 billion years. It is expected to do the same for another 5 to 10 billion before swelling up into a red giant, enveloping the planets and asteroids out as far as Jupiter, and then collapsing into a white dwarf, having exhausted its nuclear fuel. As it shrinks it may cast off a nebula of gas and dust, which would eventually be recycled to help produce yet more stars and planets.
Some other stars are massive enough such that their cores attain pressures and temperatures sufficient to burn heavier elements, like carbon and nitrogen, producing elements with ever more particles in their nuclei, and so extending the stellar lifetimes. But our Sun cannot do so. Its lifetime is limited. Let us not weep, though: if the Sun were not just as it is, we would not be here to appreciate it and grieve for its eventual expiration.
INSIDE THE SUN
The Sun contains 99.8 percent of the Solar System’s mass (most of the rest of it is in Jupiter), about 330,000 times the bulk of the Earth. Around 73 percent of the Sun is hydrogen, 25 percent is
helium, and all the other elements added together comprise less than 2 percent of the solar mass.
The Sun agglomerated from a huge cloud of gas and dust, which was largely the debris left from previous expired stars and supernova explosions. In its core the temperature is over 10 million degrees Celsius (20 million degrees Fahrenheit), and the pressure is in excess of 200 billion times our atmospheric pressure. We say that the material within the Sun is a gas, and yet its density is 150 times that of water, 20-fold that of iron.
Under such conditions the repulsive forces between hydrogen nuclei may be overcome. (Hydrogen nuclei are simply bare protons—positively charged subatomic particles, the number of which within any nucleus controls the type of element it is.) Helium is produced as they coalesce. That is, the Sun is a natural fusion reactor. If we could do the same thing on Earth we would have a practically unlimited supply of energy, although one could not say that it would be free because many, many billions of dollars have already been spent in the as yet unsuccessful quest to produce controllable fusion. (Uncontrolled fusion is easy: it’s called a hydrogen bomb.)
Since the time this fusion process began in the center of the Sun just over four and a half billion years ago, about half of the usable hydrogen fuel has been transmuted into helium. The word “usable” is significant here because, as the hydrogen at the middle is consumed, the shell where fusion is occurring moves outwards. But away from the center the temperatures and pressures eventually become too low to support hydrogen burning, and so fusion halts. This means that much of the hydrogen in the Sun will never be burnt. If the interior of the Sun were better mixed then it
might have a longer lifetime, but things are as they are, and stellar interiors are heavily stratified.
Figure 5–1 shows a schematic cross section of the Sun. Energy generation through fusion occurs only in the core, which occupies about 25 percent of the overall radius. That energy is transported outwards through the radiative zone, the next 50 percent or more of the radius. The energy is carried through that zone by photons of light, rather than by conduction or convection. (Conduction is the process of hot atoms colliding with cooler ones and transporting heat away, in the same way as the handle of a long iron rod gets warm if the other end is left in a fire. Convection is
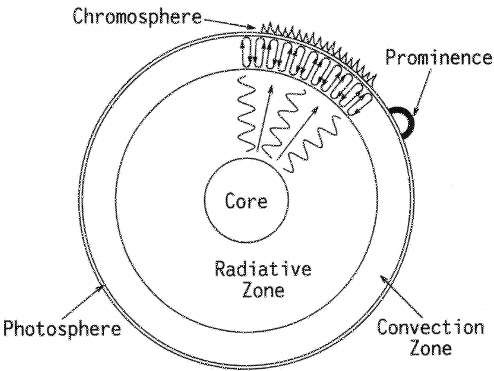
FIGURE 5–1. A cross section through the Sun showing its basic features at different levels.
the wholesale upward movement of hot atoms, like heated air rising above a stove.) Those photons deep within the Sun are not at the wavelengths of visible light; the temperatures there are so high that the photons are mainly in the gamma- and X-ray region of the spectrum.
The final 20 percent of the solar radius is known as the convection zone. In this layer the temperature gradient is sufficient for bubbles of hot sun-stuff to rise until close to the surface, giving the Sun its characteristic mottled appearance. (The effect is similar to making gravy or jam: the heating at the base of the pan makes the liquid want to rise, but not all of the liquid can rise at once, so it churns over in globules moving together.) After cooling, that material sinks again to the base of the convection zone, where it is heated again before beginning another round trip to the surface, as part of another cell. This convection results in the Sun’s surface not being smooth, but covered with thousands of these globules, which are called granules. They are each the size of a continent, but short-lived, persisting for but a few minutes before dissipating and being replaced by some new rising globule.
What is usually referred to as the “surface” of the Sun is correctly termed the photosphere (that is, the region from which our eyes detect photons). This is not a solid surface, but a layer of ionized gas at a temperature of about 5,700 degrees Celsius (10,300 degrees Fahrenheit). The temperature of the photosphere determines the color we perceive: that’s why the Sun appears yellow to us, whereas hotter stars appear blue or white, and cooler ones orange or red.
In Figure 1–1 we saw photographs of the Sun’s surface, including some sunspots. These are cooler regions of the photosphere, typically at around 4,000 degrees Celsius (7,200 degrees
Fahrenheit). Their origin is not yet completely understood, although they are certainly related to convolutions of the intense solar magnetic field. In a sunspot the magnetic field is several thousand times as intense as elsewhere on the solar surface. One should not underestimate their size: many are 25,000 miles across, several times the diameter of the Earth.
OUTSIDE THE SUN
Above the photosphere is an almost translucent region known as the chromosphere due to its scarlet coloration. This color results from its hydrogen content, which emits visible radiation largely at a specific red wavelength. The chromosphere is quite thin: a few thousand miles wide, which is large on the scale of a planet, but less than 1 percent of the solar diameter.
Penetrating the chromosphere are spikes of gas that rapidly jet upwards and then fall back again; these are termed spicules. Larger ejections of mass are called prominences, as seen in Figures 1–3 to 1–5. Such prominences provide one of the highlights of a total eclipse.
Another vivid feature seen in an eclipse is the corona (or aureola). This is a rarified region of extremely hot gas, stretching millions of miles out into space, consisting of ionized atoms speeding away from the Sun. Like the chromosphere, the corona can only be seen by eye during a total eclipse, although there are other technical ways to observe it between times. One of the great puzzles of solar physics is how the corona is heated to such a high temperature—over a million degrees Celsius (2 million degrees Fahrenheit)—given that the underlying regions are much cooler.
Flowing outwards from the Sun is a continuous stream of
particles known as the solar wind. These particles zip by the Earth at a speed of about 300 miles per second. The Sun has an intense but dynamically changing magnetic field that is carried outwards by the solar wind. By dint of their own magnetic fields, the planets interact with this solar wind, producing effects both beautiful, like the auroras, and disruptive, such as interference with radio communications, navigation systems, TV and cell phone services, and manned space walks. The density and other characteristics of the solar wind are quite variable. For example, there are gradual ebbs and flows with the 11-year solar cycle, but also spasmodic solar flares may be seen, associated with ejections of large amounts of matter into the solar wind, intersecting the Earth a day or two later.
The photographs in Figure 5–2, which were obtained using an instrument known as a coronagraph (see below), show the corona and solar wind, both of which are highly uneven. Coronal streamers are the most obvious features in those images, their shapes varying over the several hours of the data collection.
ARTIFICIAL ECLIPSES
There are many aspects of the Sun and interplanetary space that may only be studied during a solar eclipse, and yet such a natural event occurs only every year and a half or so, and often then in inhospitable places from the perspective of astronomical observations. It is therefore natural to wonder whether it is feasible to create an artificial eclipse, by using a circular baffle to imitate the action of the Moon when it passes in front of our nearby star.
A telescope designed to do this is called a coronagraph; that is, it is used to study the corona. It is equipped with an obscuration to
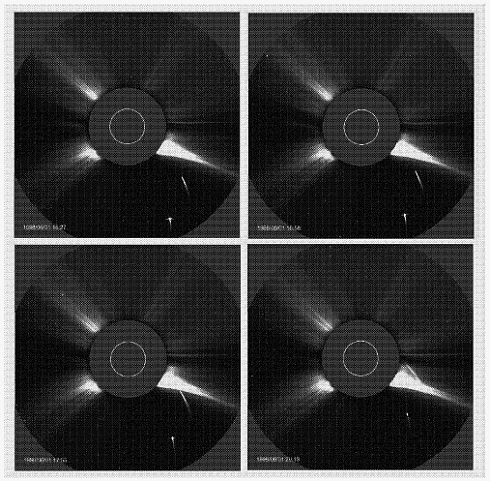
FIGURE 5–2. This four-hour sequence of images obtained with the coronagraph on the SOHO satellite (see page 133) shows two comets falling into the Sun in June 1998. Several distinct coronal streamers are obvious in these images, their forms altering over these several hours. A coronagraph produces an artificial eclipse, allowing the solar atmosphere to be studied continually, rather than only during the few minutes of a natural eclipse. (There are many other advantages of data collection from space, such as access to wavelengths that are absorbed by the terrestrial atmosphere. An example is the ultraviolet image shown in Figure 1–5.)
fit over the image of the luminous solar disk. Astronomers have been using coronagraphs for some time, but they are of limited utility down here on Earth because the atmosphere scatters so much sunlight. The innermost corona is about one-millionth the brightness of the photosphere. Stepping out by a distance equivalent to the solar radius, the coronal brightness drops by about a factor of a thousand, to be about a billionth that of the solar disk. The light of the sky is greater than this value, meaning that the studies that may be tackled using ground-based coronagraphs are limited. By launching a coronagraph on a satellite, however, astronomers can get their instrument above the atmosphere and avoid such drawbacks. It just costs a lot more. Far above the Earth, a coronagraph can be guided so as to keep its baffle over the Sun, allowing perpetual monitoring of the corona, prominences, and other solar phenomena. Over the past couple of decades several such telescopes have been launched, returning invaluable data.
The most advanced satellite of the type is the Solar and Heliospheric Observatory (or SOHO), a joint project of NASA and the European Space Agency. On board are 11 separate instruments, one of which is called LASCO (Large Angle Spectroscopic Coronagraph). This has allowed the experimenters to study the corona out to 30 times the radius of the Sun, watching how vast bodies of hot plasma (bubbles of highly ionized, or charged, gases) are thrown out into space. Such spasmodic events, termed coronal mass ejections, sometimes result in a hundred billion tons of sun-stuff being launched outwards. These disperse somewhat as they move away from the Sun, but they can affect us on the Earth in various ways, because our ionosphere (the layer of the upper atmosphere consisting of gases ionized largely by the solar ultraviolet radiation) is disturbed as we run through streams of this plasma.
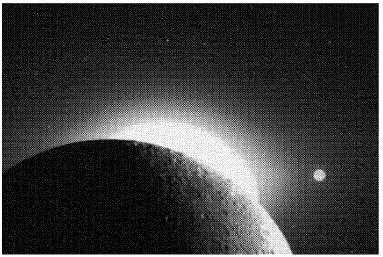
FIGURE 5–3. This image obtained by the Clementine satellite in 1994 shows the solar corona shining above the limb of the Moon. The bright disk is Venus. The part of the Moon towards the spacecraft obviously cannot be illuminated directly by the Sun, as that is on the far side of the Moon. In fact the lunar surface can be seen clearly here owing to Earthshine: sunlight that has been reflected by the Earth, which is off the field of this image to the right.
These types of solar gas ejection can be seen in Figure 5–2. The frames shown there also display a quite distinct phenomenon: comets falling into the Sun.
Another way to achieve a type of artificial eclipse is to use the Moon as the baffle and fly a satellite into its shadow. An example of this is shown in Figure 5–3, which is an image obtained by the Clementine spacecraft in 1994 while it was in orbit around the Moon.
THE HEYDAY OF SOLAR ECLIPSE CHASING
It is easy to give a verbal sketch of the basic features of the Sun, as above, and forget that our understanding has been gradually de-
veloped over many years. That development has certainly accelerated during the Space Age by a huge factor, but we should not decry the forward steps taken in earlier times. Indeed the lines of thinking in different epochs provide instructive examples of the science of the day. Let us begin by noting that the effort and expenditure that go into solar eclipse watching has diminished over the last several decades and examine why that is so.
Although many enthusiasts venture around the globe for each total eclipse, and still there is much useful professional research that can be done, the heyday of eclipse watching was between the 1840s and the 1930s. An eclipse sweeping over southern Europe in 1842 was witnessed by many. Francis Baily observed it from Italy, confirming his impression of the eponymous “bright beads” that he sketched in 1836 (refer back to Figure 1–7). Those transient baubles of brightness are produced by sunlight propagating to one’s eye betwixt and between the craggy mountains and crater rims at the edge of the Moon.
Many important discoveries concerning the Sun’s properties were made in those days, and we will meet them below, but for the present we should just recognize the extraordinary fervor with which eclipses were chased through that era. In 1870, for example, French astronomer Jules Janssen was so desperate to get to Algeria to observe an eclipse that he escaped from Paris in a balloon, drifting over the heads of the Prussian troops who had the city under siege.
Moving forward a few decades, governments were prepared to provide expeditions to eclipses with financial support orders of magnitude higher than would be conceivable nowadays (see Figures 5–4 and 5–5). Today astronomers might be pushed to raise the necessary capital to cover economy-class airfares for themselves
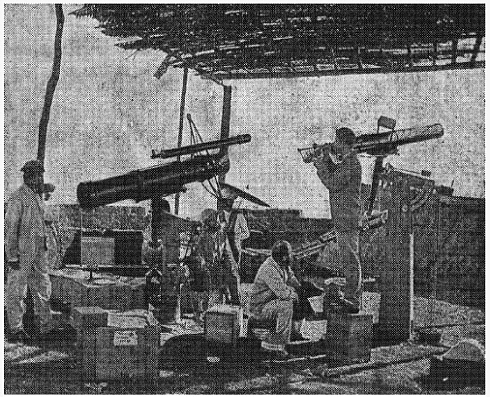
FIGURE 5–4. The epic days of eclipse expeditions: this is the British team in Imperial India, at Baikal on the southwest coast of the sub-continent, waiting for the eclipse in December 1871.
and a couple of assistants to take their instruments to some eclipse track. Contrast that with the cost to the British government of staging the 1919 eclipse expeditions, large teams spending several months in both Principe and Brazil.
Those days are over. Radio astronomy began as a science after the Second World War, following the first stuttering observations in the 1930s. Similarly the start of the Space Age in the late 1950s, with its blossoming since, has opened up new areas of research

FIGURE 5–5. An eclipse team at drill before the big event, located near the northern tip of Scandinavia in 1896.
capability, and these have lessened the scientific significance of natural eclipses. With satellite instruments we are now able to produce artificial eclipses at will. One should, however, pay proper regard to the pioneering eclipse observations made over the past centuries, and how they enabled many of the properties of the Sun to be elucidated.
UNDERSTANDING THE CORONA
Nineteenth-century astrophysicists were much confused about the source of the Sun’s power. They did not understand this until nuclear reactions were discovered, as discussed in Chapter 4. This had major ramifications for other areas of science because the origin of solar energy affected estimates of the age of the Earth, and hence studies of geological and biological evolution. In this earlier
state of ignorance they thought of the Sun as burning in the same way as does wood or coal, combustion through a chemical reaction with oxygen. Thinking in that manner they were bound to interpret certain phenomena in erroneous ways.
Take the prominences, for example. If you look up a nineteenth-century book describing the Sun, these will often be called simply the “red flames,” and flames are what they were commonly thought to be, licking upwards from the solar surface like a huge spherical bonfire. One could then imagine that the inside of the Sun would be cool, because the burning had not yet penetrated there, just as a charred piece of wood is neither hot nor burnt in its middle. Some thought that sunspots were holes through this supposed layer of burning. Sir William Herschel, who discovered the planet Uranus from the city of Bath in England in 1781, opined that there might be alien beings living inside the Sun, down below the burning layer, where the conditions were wrongly imagined to be pleasant.
Similarly the nature of the corona was only gradually understood. Its existence was well known to the ancients. Plutarch wrote, apparently in reference to an eclipse he had witnessed from Greece in A.D. 70, that “Even if the Moon, however, does sometimes cover the Sun entirely…a kind of light is visible about the rim which keeps the shadow from being profound and absolute.” The first description of the corona in modern astronomy was by Johann Kepler, who described its appearance during an eclipse over Prague in 1605. Giovanni Cassini, of the Paris Observatory, made a more complete identification in 1706.
These early observers were not sure whether the corona was a solar or a lunar phenomenon: was it perhaps a lunar atmosphere which could only be seen when the Sun was behind the Moon,
suitably illuminating it? This is what Edmond Halley believed, as exemplified in the quotation that heads this chapter. In 1715 he suggested that the apparent asymmetry of the corona was due to the Sun heating only one face of the Moon at any time, building up a gaseous cloud above that hemisphere that would condense as the Moon turned, like the diurnal cycle of dew.
The fact that the corona is the extended solar atmosphere was not settled until 1890. Much later other components of the detected light were identified, such as the F-corona: sunlight scattered by a sphere of dust grains stretching out to tens of solar radii. This is similar to a tenuous dust cloud on Earth, visible only from the light it scatters or absorbs.
How can the gaseous corona be investigated? One of the fundamental techniques used in astronomy is spectroscopy: the study of the spectra produced by different sources of light. The first step along this path was taken in 1664 when Isaac Newton used a prism to split sunlight into its constituent colors, the familiar rainbow. In the early nineteenth century the great German physicist Joseph von Fraunhofer, using sophisticated optical devices to disperse the light more widely showed that sunlight is not an unbroken spectrum: at certain wavelengths there are dark bands. With excellent resolution, thousands of these may be identified. Their origin is as follows.
The photosphere, at a temperature of several thousand degrees, emits a continuous spectrum (that is, all wavelengths), just as an electric light globe does. The tenuous upper layers of the Sun are cooler and tend to absorb light. They do not do so over the whole spectrum, but only at distinct wavelengths, the precise character of which depends on the chemical elements present. That is, iron will absorb at one set of wavelengths, chromium at another,
carbon at another, and so on. Therefore each element produces its own characteristic absorption spectrum: the continuous spectrum emitted by the hot gas below will be modified such that there are many dark spectral lines crossing it, where cooler gas higher up has absorbed certain wavelengths. This is of great practical importance because by studying these absorption lines astronomers can gauge the quantities, temperatures, and ionization states of not only the constituents of the Sun, but also other stars or the atmospheres of planets. To do this they use a device known as a spectrometer or a spectroscope (see Figure 5–6). Similar the ozone layer in the terrestrial atmosphere, and other components of it, can be remotely sensed by spectroscopic means.
If the atoms are hot then an element’s spectrum will consist of bright (or emission) lines. For example, street lamps emit only particular wavelengths of light: yellow lamps employ sodium, blue-white ones use mercury, and red-strip lamps contain neon.
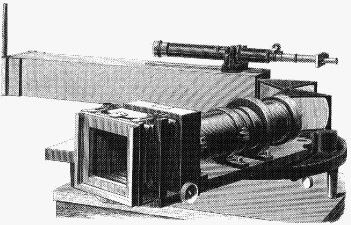
FIGURE 5–6. A spectroscope of the type used by nineteenth-century astronomers to identify the chemical elements in the Sun, including the discovery of the existence of helium.
The spectrum that is detected, whether emission or absorption, allows the astronomer to ascertain the chemical composition of distant light sources without needing to grab samples and bring them back for laboratory analysis. In the laboratory they can electrically excite, say, calcium atoms in a vacuum tube and measure the wavelengths emitted. Detecting the same wavelength pattern from some astronomical object, they will know that the source also contains calcium. This means that we can identify elements previously known on Earth in the composition of distant stars. But what if the astronomer detects spectral lines that are unknown to science?
THE DISCOVERY OF HELIUM
To the Romans the god of the Sun was Sol. To the Greeks, he was Helios. The ancient Greeks were more proficient in science and mathematics than the Romans, which is why Greek words are often employed in scientific matters (a term like “heliocentric,” for example, or “telescope” from the Greek “tele” meaning “distant”).
The element helium gets its name in the same way. This is the second member of the periodic table of elements (the sequence of naturally occurring atoms). It is always found as a monatomic gas—that is, a molecule containing just one atom—because it is inert, meaning that it does not undergo any chemical reactions with other atoms. As a consequence, although it occurs on the Earth its existence had escaped the notice of science until being identified as a major constituent of the Sun—using an eclipse, of course.
The story is quite peculiar. We discussed the so-called Fraunhofer spectrum of the Sun earlier. This consists of the continuum from the lower photosphere, superimposed on which are
the many dark lines produced by the cooler atoms in its upper-most layer absorbing at their specific wavelengths. This absorption spectrum can be detected at any time; its intensity swamps any other solar light except in a total solar eclipse. During such an eclipse we see the corona and other structures that are normally drowned by the photosphere. (Similarly, as you look out the window of a railway carriage on a clear day you see the countryside whizzing past. When making the same trip at night, though, or when passing through a tunnel, you see mainly your own reflection and the interior of the carriage from the inside of the glass window. That reflection is always there, but it is not easy to see in broad daylight.)
Turning a spectroscope upon the corona, nineteenth-century astronomers found that the spectrum they recorded was quite unlike the familiar Fraunhofer spectrum. There was no sign of the dark lines, but the exact opposite: all they detected was a series of bright lines. An example of this emission spectrum is shown in Figure 5–7. This is a spectrum of the chromosphere and corona, displaying a series of bright lines produced by the hot gases just above the photosphere. Many of these lines could be identified with known elements, and in particular the red coloration of the chromosphere was recognized to be due to the strong “Ha” line (seen at far right in Figure 5–7). This allowed hydrogen to be identified as the major constituent of the solar atmosphere. (H is the chemical symbol for hydrogen; the Greek letters applied here are simply used by convention to label the specific spectral lines.) But two other distinct lines in Figure 5–7 had an unknown origin.
In 1868 eclipse observations allowed the wavelength of the line immediately to the left of the Ha line (labeled “5875”) to be
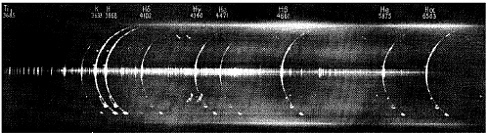
FIGURE 5–7. A spectrum of the chromosphere photographed by nineteenth-century astronomers, showing some of the features that perplexed them. The spectrum was obtained by dispersing the light received during a total solar eclipse using a large prism. The shape of the chromosphere, around the limb of the Sun, is obvious, as are several prominences. At the top various spectral lines are labeled. Five hydrogen lines are labeled (Hα, β, γ, δ, plus another denoted simply by an H at wavelength 3968 angstroms), two of helium (He), one of potassium (K), and one of titanium (TI). Many other fainter lines are left unlabeled, but are identifiable.
measured accurately. It was realized that this could not possibly be due to sodium (the yellow of sodium street lamps is due to two very close lines at a shade longer wavelength than this). Two astronomers realized concurrently that this was evidence of a previously unknown element: the aforementioned Jules Janssen and British scientist Sir Norman Lockyer. It was Lockyer, who later made a name for himself with his astronomical theories about megalithic monuments and the Egyptian pyramids, who suggested the name helium for the new element, and hence the symbol “He” used in Figure 5–7. Because it is chemically inert, helium was not identified on Earth until some time later, in 1895.
CORONIUM AND NEBULIUM
This is not the end of the story of the coronal spectrum. As seen in Figure 5–7, there are myriad spectral lines, each of which may have its wavelength measured, and its elemental parentage perhaps allotted. Inspired by the discovery of Janssen and Lockyer in the previous year, astronomers flocked to observe the 1869 total eclipse in North America using their spectrometers, and the new methods of photography to record the spectra for later analysis.
When the dust settled and all the “easy” spectral lines had been accounted for, still there were many that could not be ascribed to any known element. A novel species was invented to explain these, and it was called “coronium” because it was found only in the solar corona. Astronomers also turned their telescopes towards the distant nebulas of the cosmos, and found evidence, they thought, for yet another element. This was christened “nebulium.”
Coronium and nebulium were both, in the event, figments of the astronomers’ imaginations. The lines they detected were real, but their interpretation was wrong. It is possible to get known elements to produce those spectral lines if their atoms are subjected to extreme physical conditions, such as the huge temperatures of the solar corona. Physicists could not produce a temperature of a million degrees in their laboratories, and so these lines had not been seen previously.
When one supplies an atom with some energy, by heating it or by illuminating it with light of a wavelength below some threshold, an electron (a negatively charged particle) can be ejected, leaving an ion: a positively charged atom. It is possible to strip off another electron, making the ion doubly charged, and maybe an-
other, but it gets progressively more difficult to remove extra electrons. That limits what can be done on Earth (at least in a controlled way: a nuclear explosion is another matter).
In the solar corona, however, the phenomenal temperatures mean that the ions are multiply charged. As each successive electron is removed, the resulting ion produces a new, distinctive set of spectral lines. For example, greatly ionized iron atoms may have lost ten electrons and emit a series of wavelengths that one could not hope to duplicate in a laboratory. No wonder the astronomers were confused.
How then can we identify the atom responsible? The answer comes from theoretical calculations, although again there is a twist to the tale. There are simple selection rules that usually work in spectroscopy, corresponding to the known properties of atoms. According to these rules, many of the lines detected appeared to correspond to “prohibited” transitions. Such “forbidden lines” were not fully understood until after the developments in quantum theory that took place in the 1930s. From the correct identification of the “coronium lines” it was eventually inferred that the corona is exceedingly hot: over a million degrees, as we saw earlier.
Before leaving coronal spectroscopy, consider an interesting coincidence. In Figure 5–7 the numbers give the wavelengths of various lines in angstroms (one angstrom, which is given the symbol Å, equals one ten-billionth, or 10-10, of a meter). The spectrum we see with our eyes extends from about 4,000 Å (the violet/blue end) through to 7,000 Å (the red end). (Some physicists like to use angstroms for wavelengths, while others use the strict metric system, so you will also find wavelengths given in nanometers. One nanometer [1 nm] is a billionth, or 10-9, of a meter, and so equals ten angstroms.) The angstrom unit gets its
name from Anders Ångström (pronounced ong-struh-m), a Swedish astronomer who lived from 1814 to 1874. The coincidence is that it was he who first identified the hydrogen lines in the solar spectrum, showing us why the chromosphere is red.
OBSERVING THE CORONA WITHOUT AN ECLIPSE
Once astronomers had understood the basics of the solar spectrum, through the forward leaps in knowledge in the 1860s, it became possible to observe the corona at times other than during a total solar eclipse, by using a suitable filter.
We have already seen how the photosphere produces a continuous spectrum, which is modified by absorption from cooler overlying gases. Consider the red Ha line at 6,563 Å. At that specific wavelength the cool hydrogen at the top of the photosphere absorbs much of the light flux. But the hotter hydrogen in the chromosphere and corona above it is madly emitting at the same wavelength. If one observed the Sun using a filter that lets through only light within a narrow band about 6,563 Å, then much of the photospheric spectrum would be cut out; what comes through would be the emission from these higher reaches of the solar atmosphere. The solar disk is therefore being blocked not by the opaque Moon, as in an eclipse, but by the clever use of a spectral filter. (It is called an “Ha” filter because it blocks all light except the wavelength corresponding to the Ha hydrogen spectral line.)
Astronomers soon seized upon this, and from the 1870s onwards it has been a fundamental technique allowing the changing form of the chromosphere to be followed. If you are ever in the presence of a group of astronomers, among the jargon bandied about the term “aitch-alpha filter” will often be heard.