Human Factors Guidelines for Road Systems: Third Edition (2025)
Chapter: 7 Grades (Vertical Alignment)

DESIGN CONSIDERATIONS FOR TURNOUTS ON GRADES
Introduction
Turnouts are widened, unobstructed shoulder areas that allow slow-moving vehicles to pull out of the through lane to give passing opportunities to following vehicles (1). Turnouts are not emergency escape lanes. This guideline provides design recommendations that support the safe and appropriate use of turnouts on grades. Turnouts are also beneficial for two-lane highways in mountainous terrain. To promote effective use, turnouts should be designed with elements that inform drivers of the presence of the turnout, encourage drivers to enter at appropriate speeds, encourage users to allow all trailing vehicles in the platoon to pass, and provide adequate sight distance of the lane (behind the vehicle) to safely merge back onto the roadway.

Discussion
Turnouts may be utilized more by recreational vehicles and slower passenger cars, while heavy truck drivers are not likely to use them at all (2). Turnouts are most frequently used on lower volume roadways where long platoons are rare and in difficult terrain with steep grades where placement of additional lanes is not cost-effective. Over 80% of all following vehicles in platoons immediately behind a turnout user are generally able to pass the turnout user.
A pass completed because of a turnout maneuver may not provide as much operational benefit as a pass completed in a passing lane (4). In a passing lane, the passing vehicles are self-selected, with higher desired speeds than their immediate platoon leader. By contrast, turnout users (rather than the passing vehicles) are self-selected, and the passing drivers may or may not have higher desired speeds. The passing vehicles at a turnout may simply continue downstream as a new platoon leader. Therefore, it is expected that a turnout may not provide as much reduction in platooning per passing maneuver as a passing lane.
Design Considerations
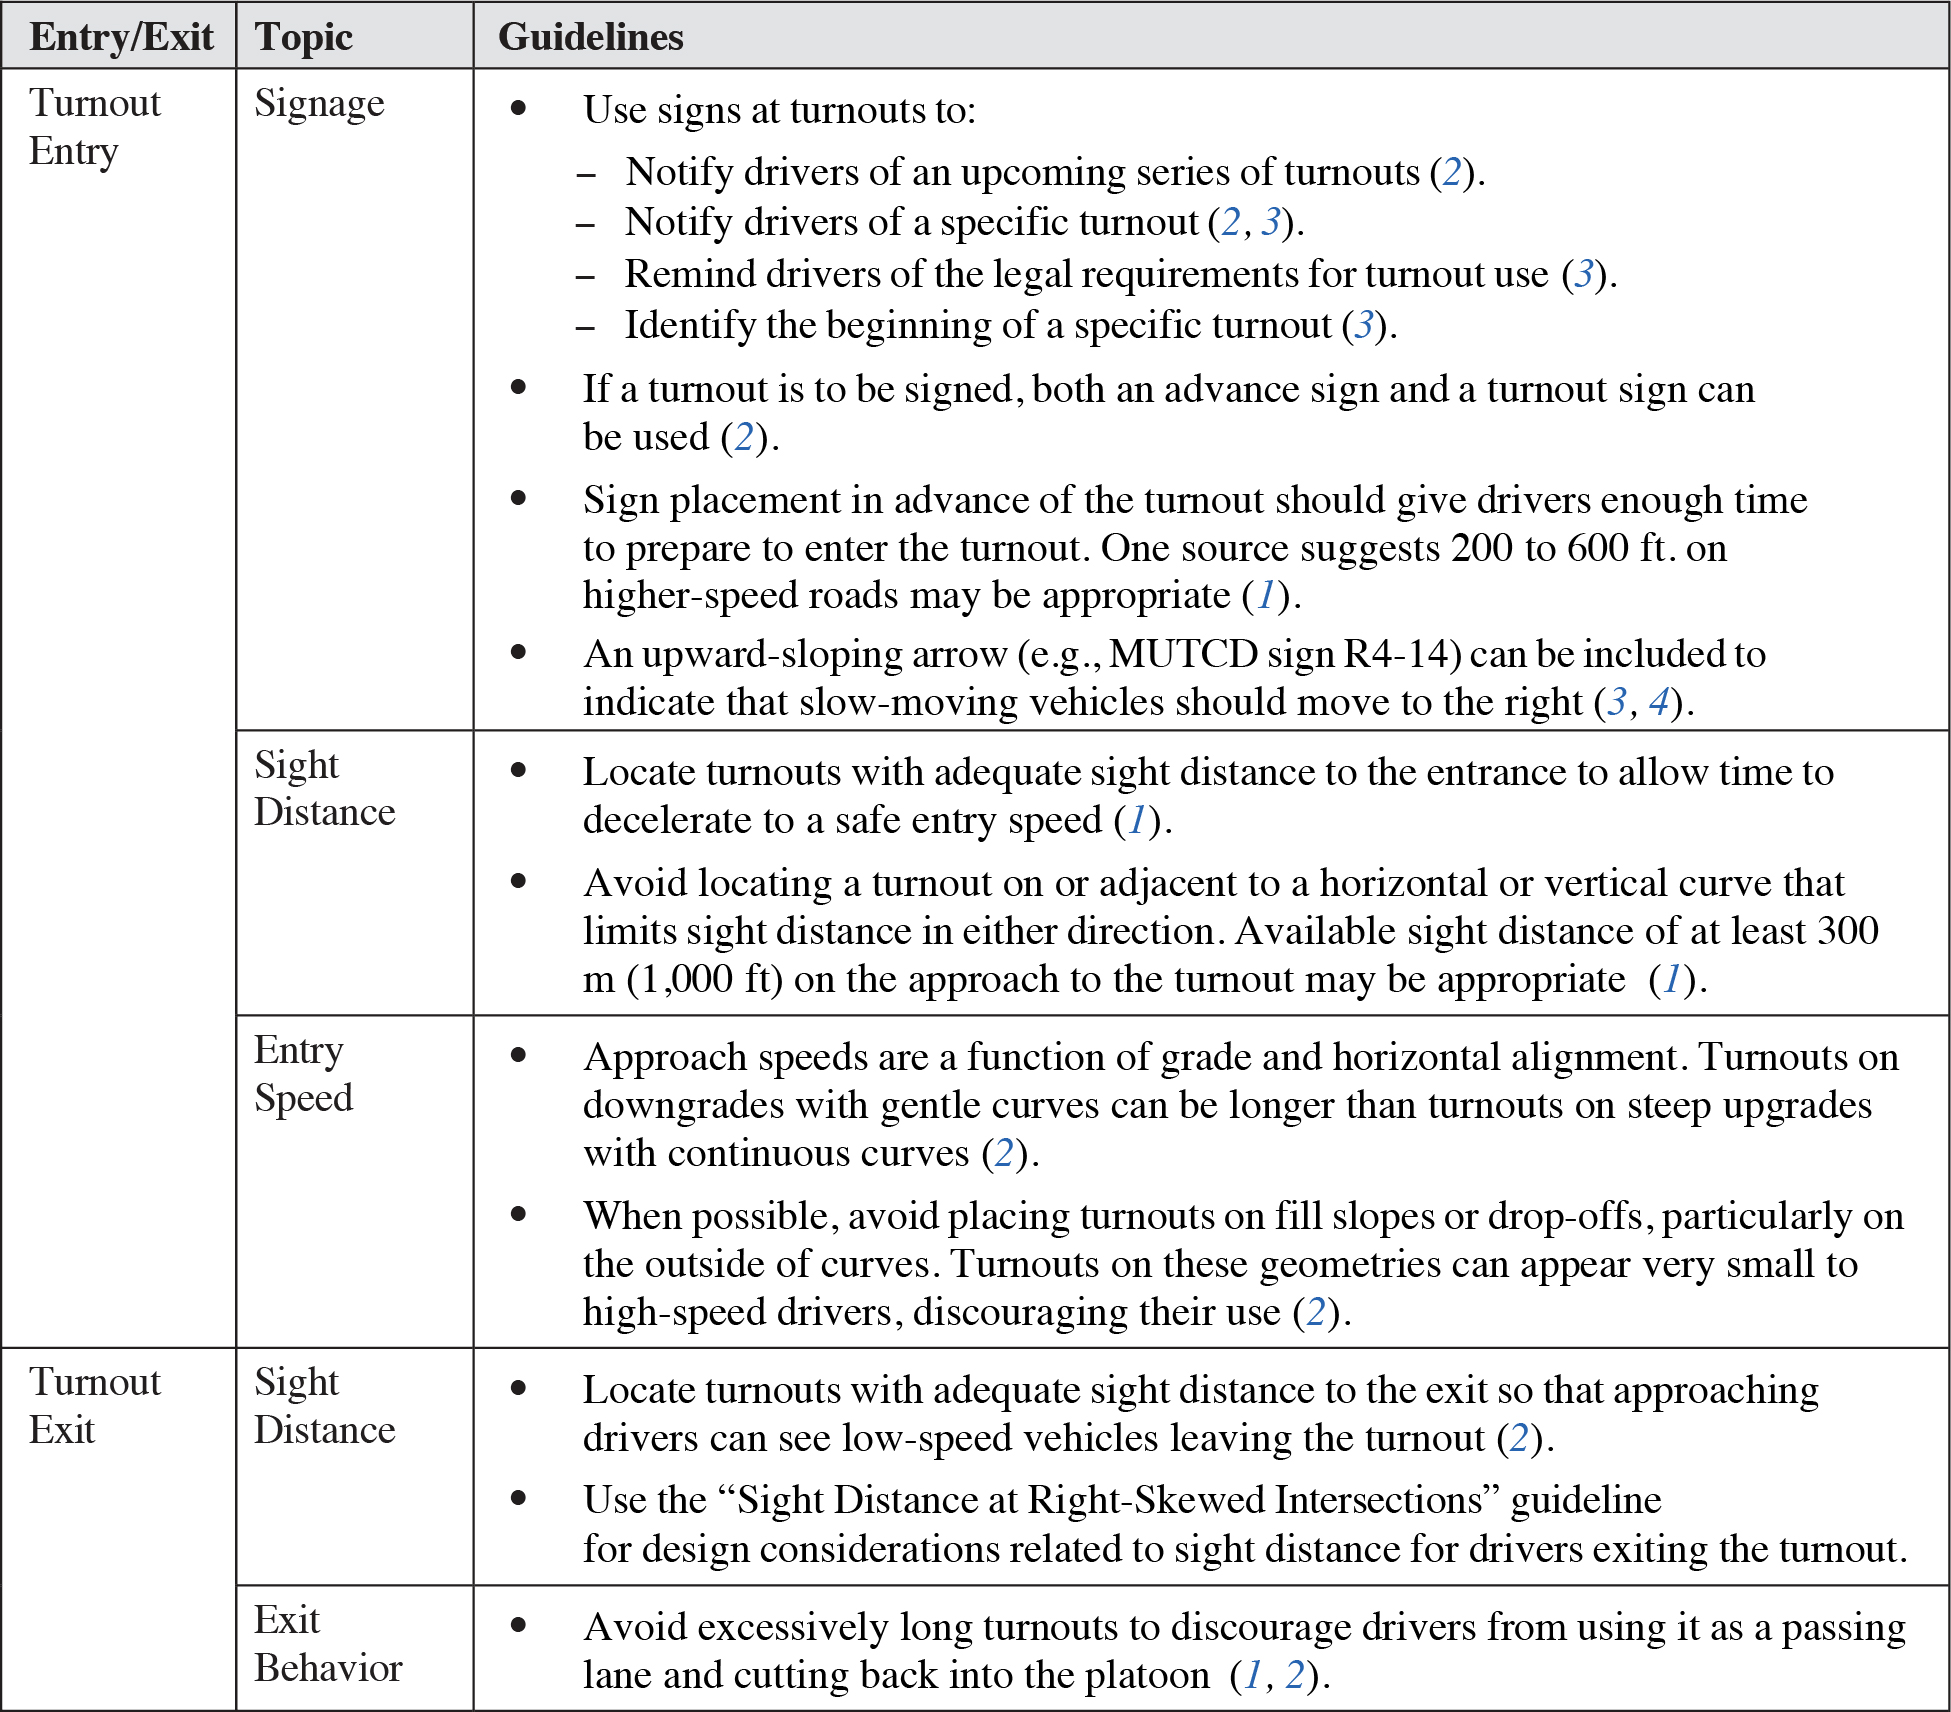
Turnouts are most effective if their purpose is clearly conveyed to roadway users by appropriate signing and turnout placement. In one study (4), the signage that provided the greatest degree of positive guidance included an upward-sloping arrow indicating that slow-moving vehicles are to move to the right. Signage may also be effective for deterring drivers from utilizing turnouts as rest areas or scenic stopping points.
When warning drivers of an upcoming turnout, two signs can be placed: an advance warning sign and a location sign. In one study (2), some vehicles stopped at areas other than the turnout when the advance sign was one-quarter mile from the turnout.
Vehicle drivers who lead long platoons drive more slowly into the turnout when compared to those leading short platoons (4). In contrast, short-platoon leaders who utilize turnouts enter with higher speeds that can be dangerous to any vehicle that is occupying the turnout. Designers should realize that vehicles could enter the turnout at speeds up to 50 mi/h and design the length of the turnout accordingly, accounting for grade and curvature. Turnouts on fill slopes or drop-offs can appear very small to high-speed drivers (particularly when located on the outside of a curve), which may discourage their use.
Turnouts of inadequate length may be used only infrequently. In one study, turnouts with low safe-entry speed due to their short length of 200 ft were never used (4). However, if the turnout is too long, it may be used as a passing lane rather than a turnout. Average speeds of 26 to 31 mi/h have been observed within some longer turnouts (2). In that study, turnout lengths of 200 to 250 ft appeared to be suitable for low-speed roads (30 mi/h or less), while lengths of about 400 to 450 ft appeared suitable for high-speed roads (e.g., 50 mi/h). These lengths are generally consistent with those found in the Green Book (1).
It is customary to find turnouts in mountainous regions, but their effectiveness may be reduced if they are located where horizontal or vertical curves limit sight distance. Turnouts can be added to rural roadways to increase passing opportunities where available sight distance is at least 300 m (approximately 985 ft) on the approach to the turnout. In any case, it is important to design the turnout with sufficient sight distance for approaching drivers to see and react to vehicles leaving the turnout at slow speeds.
Exiting from a turnout is similar to navigating a right-skewed intersection. The guideline “Sight Distance at Right-Skewed Intersections” (page 10-10) can be used to determine the available sight distance for drivers who are leaving the turnout. However, any horizontal curvature in the roadway approaching the turnout should be considered when determining the skew angle.
Cross References
Sight Distance at Right-Skewed Intersections
Key References
1. AASHTO. (2018). A Policy on Geometric Design of Highways and Streets (7th ed.). Washington, DC.
2. Rooney, F. (1976). Turnouts, Traffic Operational Report Number 2. Sacramento: California Department of Transportation.
3. FHWA. (2009). Manual on Uniform Traffic Control Devices for Streets and Highways. Washington, DC.
4. Harwood, D., and St. John, A. (1985). Passing Lanes and Other Operational Improvements on Two-Lane Highways (FHWA-RD-85-028). McLean, VA: FHWA.
GEOMETRIC AND SIGNING CONSIDERATIONS TO SUPPORT EFFECTIVE USE OF TRUCK ESCAPE RAMPS
Introduction
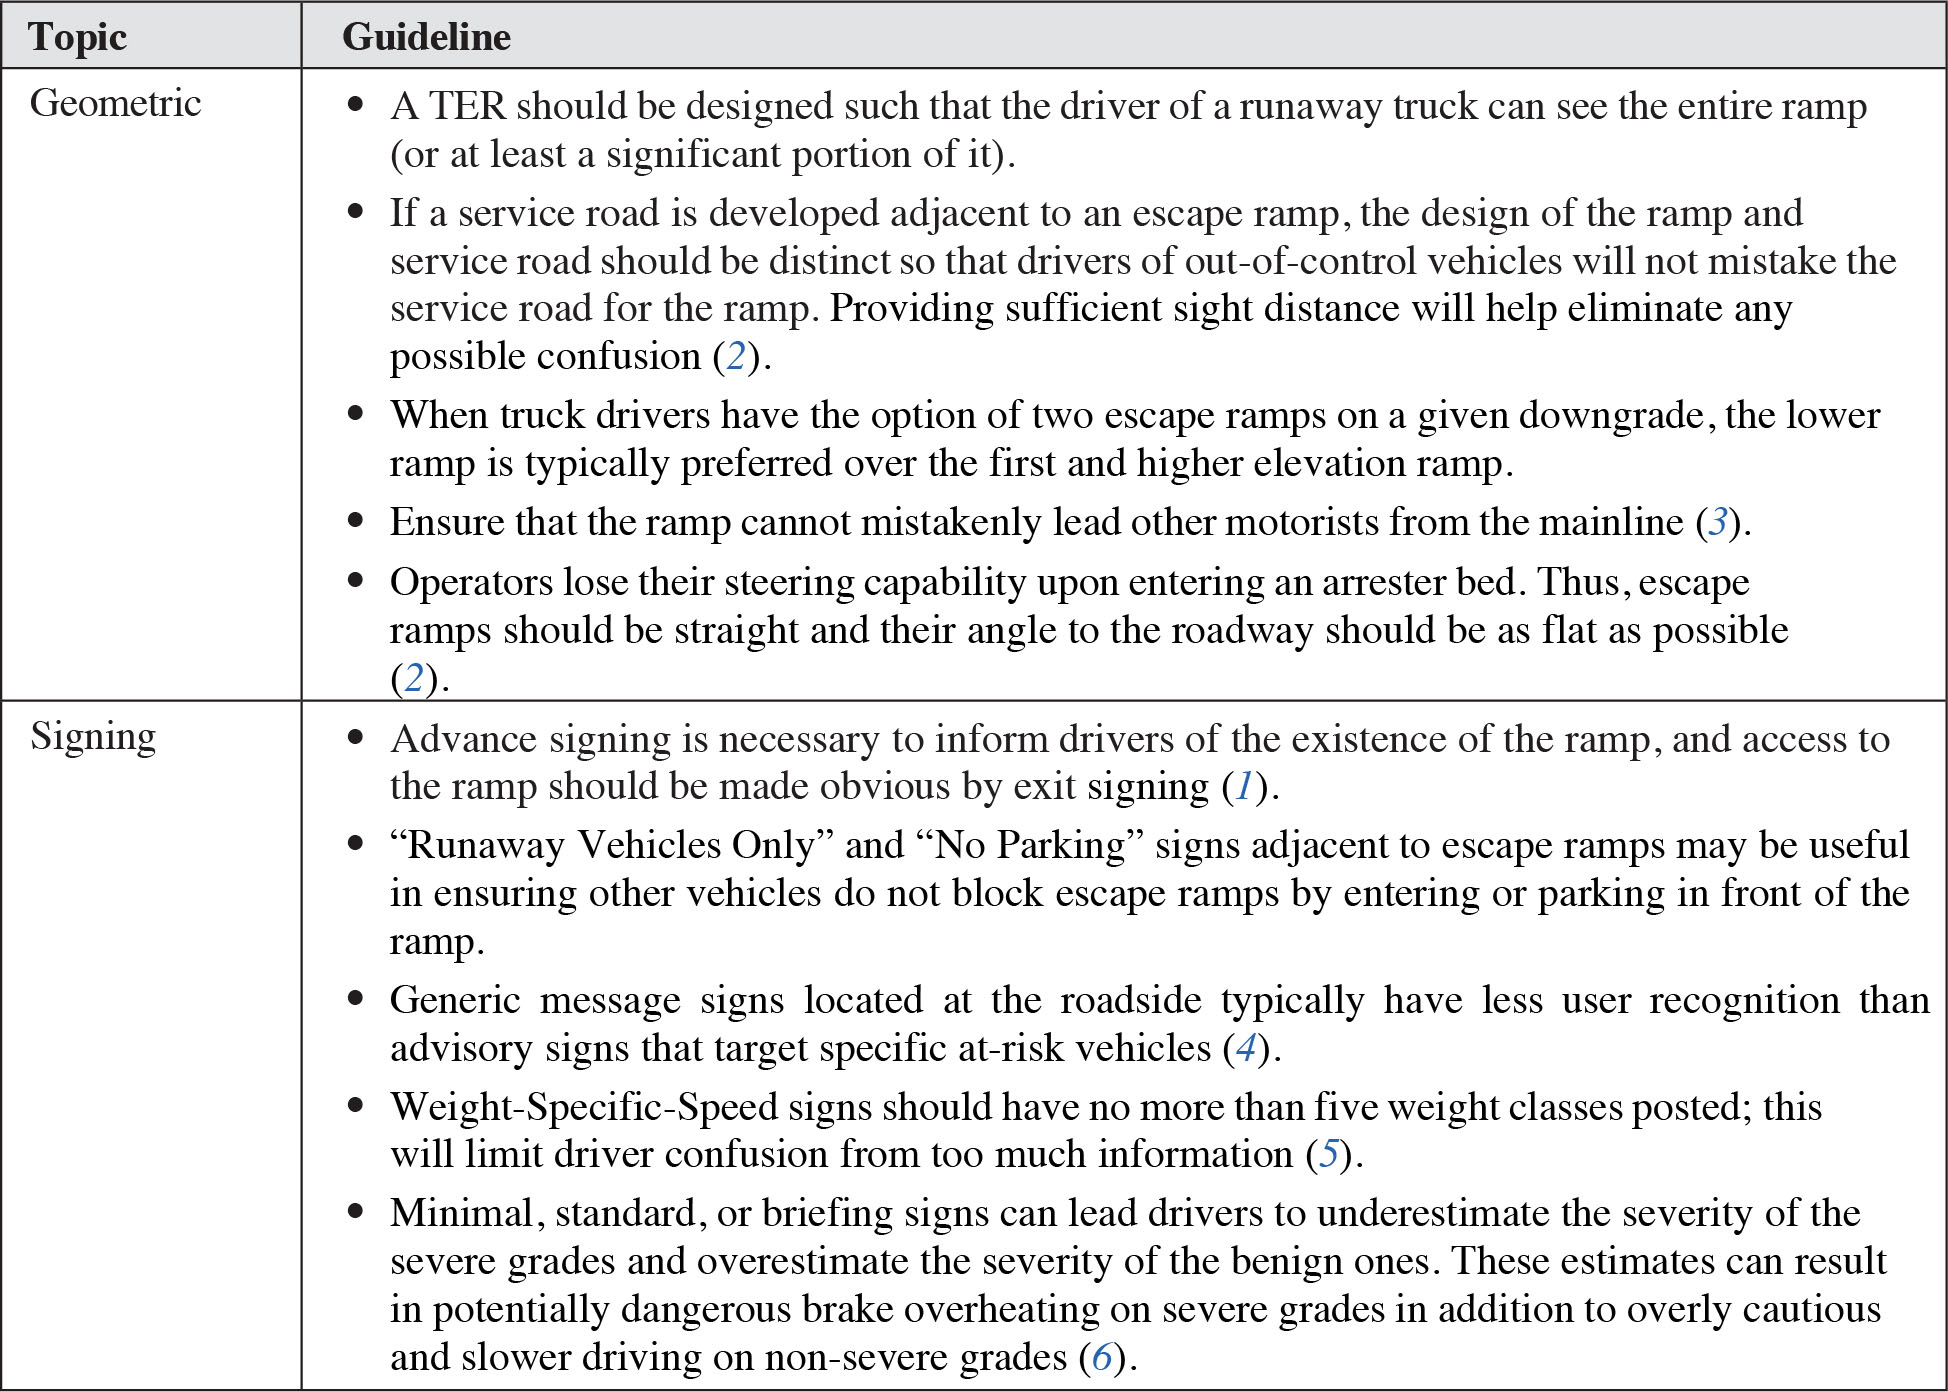
A truck escape ramp (TER) is a facility designed and constructed to provide a location for out-of-control trucks (though other vehicles can use them as well), to slow and stop away from the main traffic stream. Out-of-control vehicles are generally caused by a driver losing the ability to brake, either through overheating of the brakes due to mechanical failure or failure to downshift at the appropriate time. Multiple terms can be used to describe this family of ramps, including truck escape ramps, emergency escape ramps, safety ramps, runaway lanes, arrester beds, or gravity lanes. TERs typically slow out-of-control vehicles by dissipating their energy through gravitational deceleration, rolling resistance, or both. AASHTO provides comprehensive guidance regarding the design and location of emergency escape ramps; this guidance is provided in the “Elements of Design” chapter of the Green Book (1).

Discussion
As noted on the previous page, AASHTO provides comprehensive guidance regarding the design and location of emergency escape ramps in the “Elements of Design” chapter of the Green Book (1). This guideline merely emphasizes key aspects of that guidance and adds guidance from additional sources.
Design Considerations
On existing roadways, a field review, crash experience, and/or documentation from law enforcement agencies can be used to assess the need for a TER. Another tool that can be used to assess the need for TERs on new and existing roadways is the Grade Severity Rating System, which is a simulation model that establishes a safe descent speed for the grade based upon a predetermined brake temperature limit. Where brake temperatures exceed the predetermined limit, the potential for brake loss exists, indicating that a TER may be necessary. The Arizona Department of Transportation (7) provides the following graph in their Roadway Design Guidelines that can be used to determine if a TER is needed.
CONSIDERATION OF TER VS. LENGTH AND PERCENTAGE OF DOWNGRADE
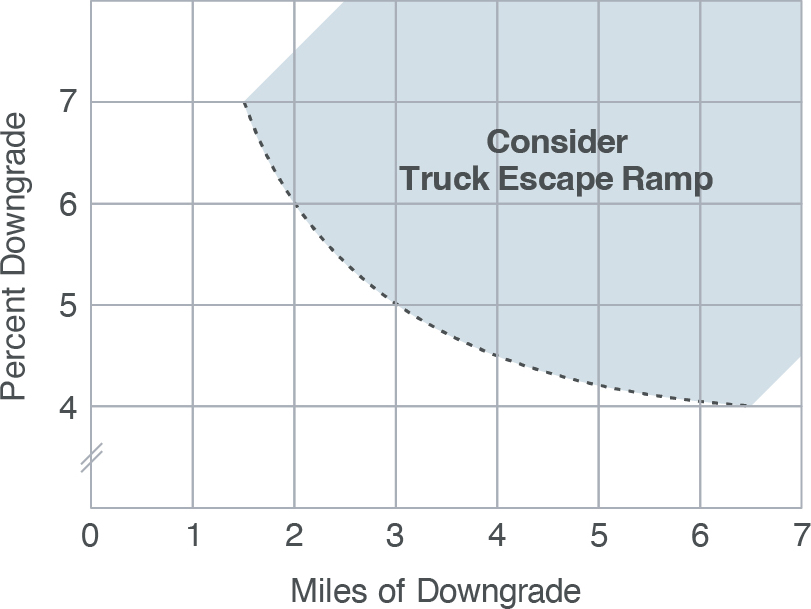
Source: Adapted from Arizona Department of Transportation (7).
Long Description.
The considered escape ramp area is approximately from 1.8 to 7 miles of downgrade and from 4 to 8 percent downgrade, on the top right of the graph.
Cross References
Speed Perception, Speed Choice, and Speed Control, Chapter 14
Special Considerations for Rural Environments, Chapter 17
Key References
1. AASHTO. (2018). A Policy on Geometric Design of Highways and Streets (7th ed.). Washington, DC.
2. Witheford, D. K. (1992). NCHRP Synthesis 178: Truck Escape Ramps. TRB, National Research Council, Washington, DC.
3. Ballard, A. J. (1983). Current state of truck escape-ramp technology. Transportation Research Record: Journal of the Transportation Research Board, 923, 35–42.
4. Bushman, R., and Lindsay, C. (2002). Improving safety with dynamic warning systems. In Proceedings: International Truck and Bus Safety Research and Policy Symposium (Z. G. Zacharia, ed.), pp. 451–459.
5. Firestine, M., McGee, H., and Cunningham, D. (1989). Reducing Runaway Truck Accidents through Weight-Based Advisory Speeds (FHWA-IP-89-023). McLean, VA: FHWA.
6. Stein, A. C., and Johnson, W. A. (1984). Effective signing to reduce truck downgrade runaways. Proceedings of the 28th Annual Conference of the American Association for Automotive Medicine, 77–89.
7. Arizona Department of Transportation. (2021). Roadway Design Guidelines. Retrieved November 8, 2023, from https://azdot.gov/sites/default/files/media/2022/02/2021-roadway-design-guidelines-feb-2022-revised.pdf.
PREVIEW SIGHT DISTANCE AND GRADE PERCEPTION AT VERTICAL CURVES
Introduction
The preview sight distance (PVSD) is a measure of driver sight distance based on the assumption that “the driver views or previews the roadway surface and other cues that lie ahead to obtain the information needed for vehicular control and guidance” (1). It is based on the assumption that a driver requires a minimum PVSD to perceive and respond to upcoming alignment cues. The PVSD applies directly to horizontal curves near the top of crest vertical curves (or at the bottom of sag vertical curves), in which the horizontal curve is initially out of the driverʼs line of sight. The AASHTO Green Book (2) recommends avoiding these situations but provides no specific design values.
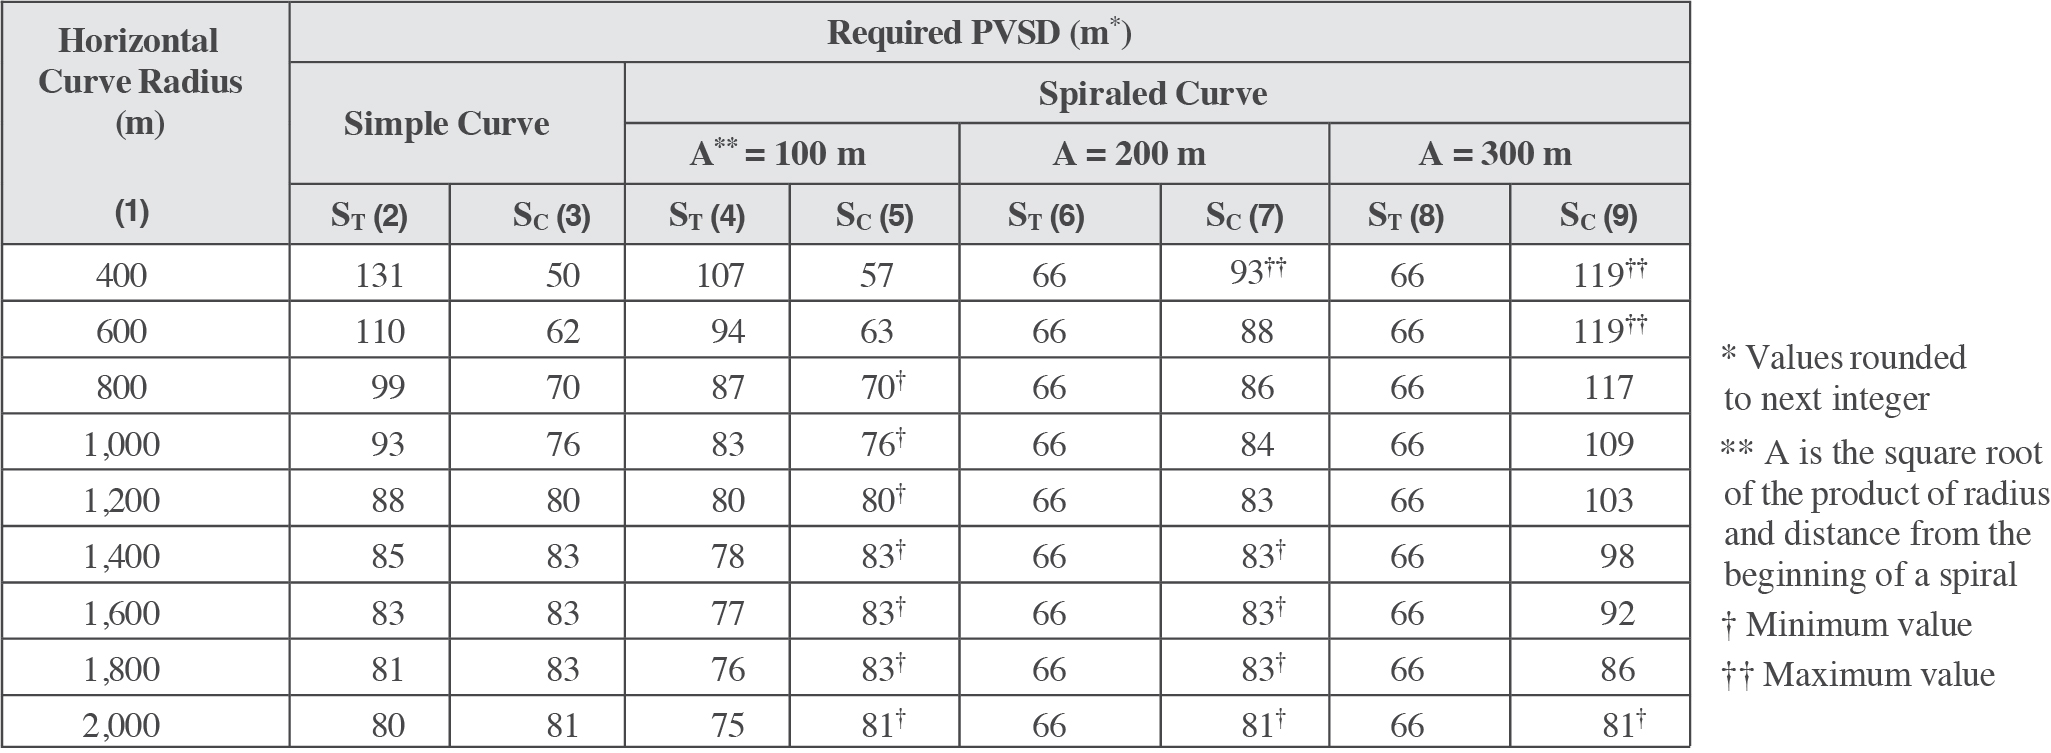

Illustration of PVSD on a crest vertical curve (left). ST is the driverʼs reaction distance (PRT) that falls on the roadway section prior to the point of curvature (PC) of the horizontal curve, and SC is the amount of horizontal curvature required to make the curve detectable to the driver. Calculated minimum values of SC are shown on the right.
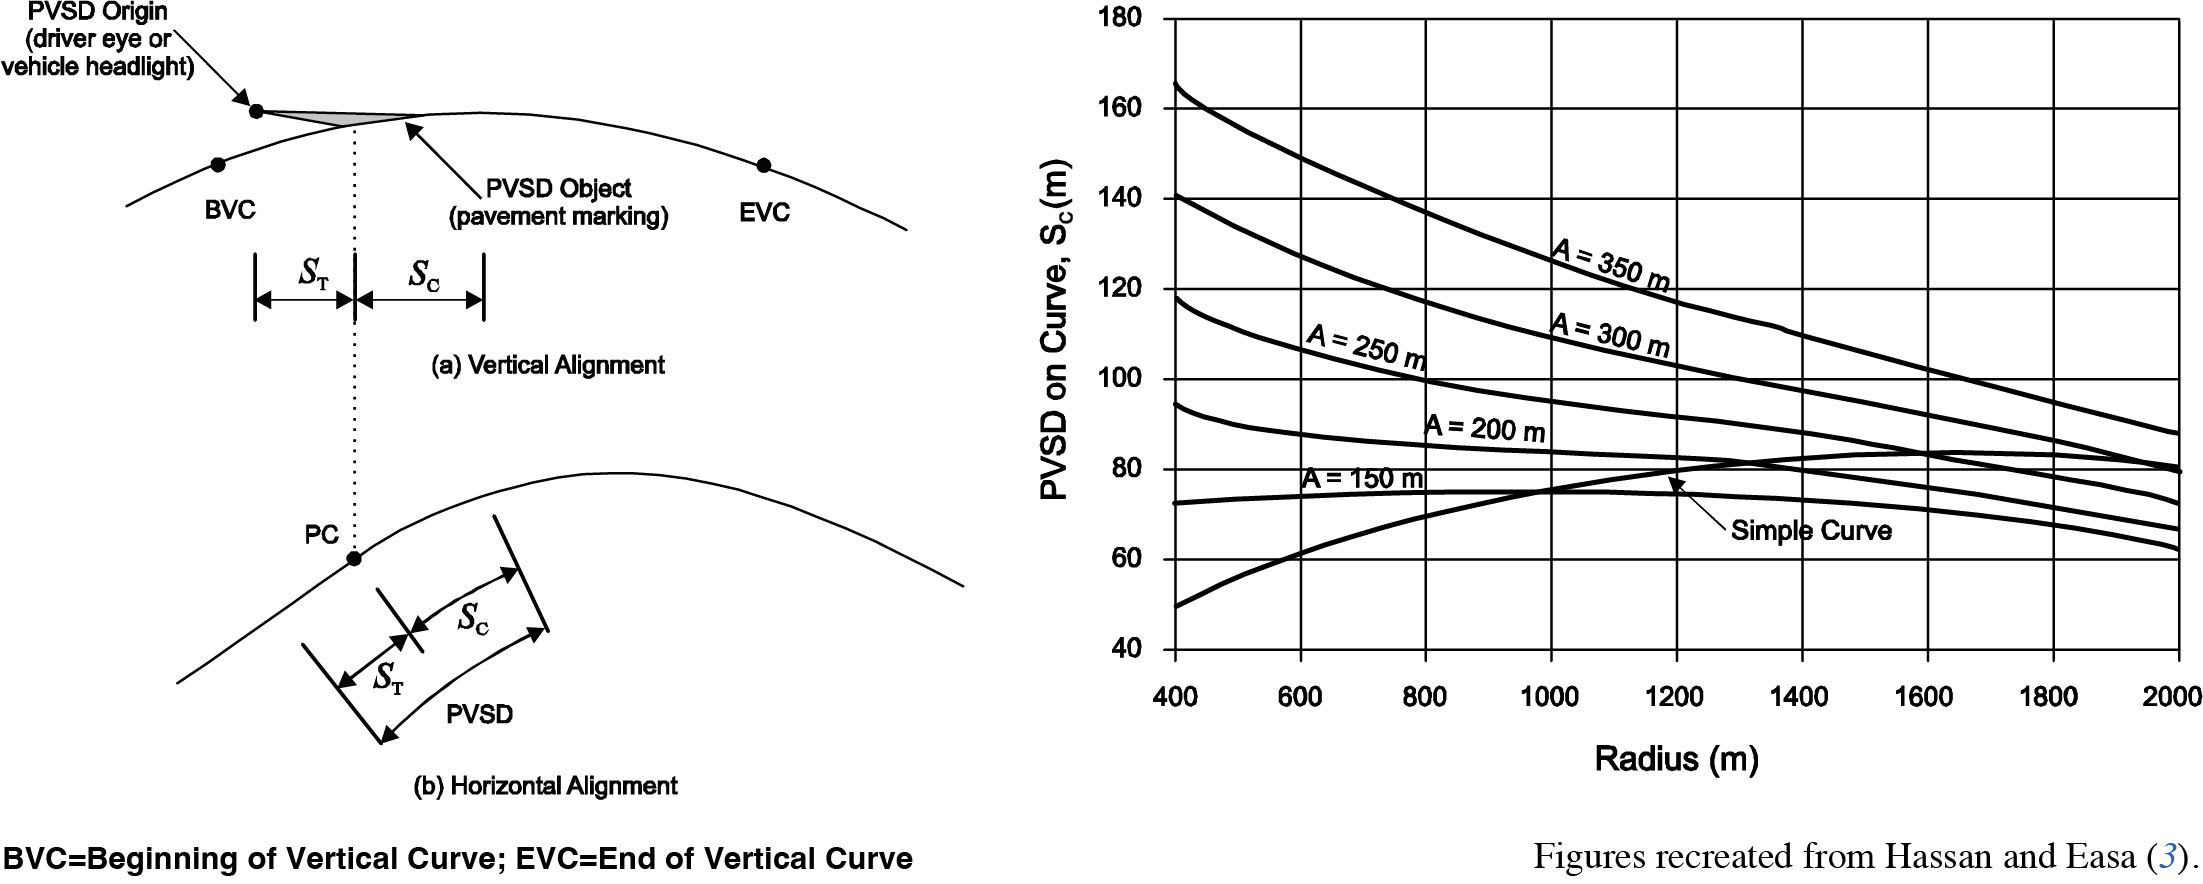
Long Description.
Illustration a shows vertical alignment. The PVSD origin (driver eye or vehicle headlight), PVSD object (permanent marking), and EVC are marked. Illustration b shows horizontal alignment. A point PC is marked. A line graph plots PVSD on a curve, S (meters) on the vertical axis, and radius in meters on the horizontal axis. The graph has a simple curve, and curves for A equal 150 meters, 200 meters, 250 meters, 300 meters, and 350 meters.
Discussion
The PVSD reflects sight distance needs apart from the typical sight distance requirements, such as stopping sight distance, decision sight distance, passing sight distance, and intersection sight distance. In particular, it addresses the adequate view of the roadway alignment, pavement surface, and other features that provide the vehicle control and guidance cues that drivers need to have a relaxed, comfortable, and safe ride (1). The PVSD can be considered a special case of the decision sight distance (3). In addition to horizontal curves following vertical curves, the PVSD can also apply to horizontal curves that are obscured by the surrounding topography, such as rock cuts, and to road segments directly preceding elevated freeway exit ramps.
Conceptually, PVSD is the length of roadway traveled while the driver perceives and reacts to upcoming roadway guidance cues. It has practical importance with regard to horizontal curves that follow vertical curves because tangents usually have higher operating speeds than horizontal curves, and drivers may have to decelerate before entering the horizontal curve. The PVSD helps ensure that drivers have sufficient time to perceive the horizontal curve and to lower their speed by accounting for the sight distance restrictions caused by the vertical curvature.
The PVSD has two components. The first is the distance associated with driversʼ perception-reaction time that falls on the tangent section of the roadway prior to the point of curvature of the horizontal curve (ST), and the second is the amount of the curve that must be visible for drivers to detect the horizontal curve (SC). If the tangent section transitions directly before the curve without a spiral, then the PRT distance should be accommodated fully within the tangent section and end before the curve. If the curve is preceded by a spiral transition, then the PRT distance can lie on the spiral and extend to the tangent if necessary. This leads to a tradeoff. In particular, sharp curves (i.e., simple curves) require that a shorter segment be visible for the curvature to be detectable (smaller SC); however, more deceleration distance may be necessary to accommodate a larger speed change (longer ST). In contrast, since spiral curves are more gradual, they require more of the curve to be visible for detection (a longer SC), but the deceleration distance can be included in the spiral length, leading to a shorter ST distance.
Under daylight conditions, the PVSD is calculated as the line of sight from the driverʼs eye to a point that intercepts and is tangent to the curvature of the pavement surface. The guideline information is based on analytical modeling of the PVSD (3, 4), and the guideline table shows PVSD calculations for ST and SC for various values of curvature radius and spiral parameter A (a measure of the flatness of the spiral). At low values of A and high radius values (R), the analytical modeling yielded non-applicable results since spiral curves should always be flatter than simple curves and consequently have PVSD values that are at least as long as for a simple curve (i.e., the curvature of a spiral curve should be more difficult to detect; see figure on the previous page). Accordingly, the required SC for spiral curves (bottom entries in columns 5, 7, and 9) are assigned the value of SC for the corresponding simple curves in these cases (i.e., column 3). Speed was modeled assuming a tangent speed of approximately 60 mi/h, with curve operating speed calculated based on the indicated curve radius (R). The deceleration level was assumed to be 0.85 m/s2. Note that the analytical work conducted to develop the guideline table was limited to separate horizontal curves on level grades.
Also, the authors caution that the design values for the table are only applicable to the range of horizontal radii investigated in their experiment (i.e., those shown in the table).
Design Considerations
Time of day is an important consideration. In particular, daytime driving should use the line of sight from the driverʼs eye to the pavement marking. However, at night, sight distance is limited by headlamp illumination of the pavement markings, which means that the line of sight should be from the reference vehiclesʼ headlamp height.
Cross References
Curves (Horizontal Alignment), Chapter 6
Key References
1. Gattis, J. L., and Duncan, J. (1995). Geometric design for adequate operational preview of road ahead. Transportation Research Record: Journal of the Transportation Research Board, 1500, 139–145.
2. AASHTO. (2018). A Policy on Geometric Design of Highways and Streets (7th ed.). Washington, DC.
3. Hassan, Y., and Easa, S. M. (2000). Modeling of required preview sight distance. Journal of Transportation Engineering, 126(1), 13–20.
4. Hassan, Y., and Easa, S. M. (1998). Design considerations of sight distance red zones on crest curves. Journal of Transportation Engineering, 124(4), 343–352.
This page intentionally left blank.


