Human Factors Guidelines for Road Systems: Third Edition (2025)
Chapter: 19 Rail-Highway Grade Crossings

CHAPTER 19
Rail-Highway Grade Crossings
Task Analysis of Rail-Highway Grade Crossings
Driver Information Needs at Passive Rail-Highway Grade Crossings
Timing of Active Traffic Control Devices at Rail-Highway Grade Crossings
Four-Quadrant Gate Timing at Rail-Highway Grade Crossings
Countermeasures to Reduce Gate-Rushing at Crossings with Two-Quadrant Gates
Human Factors Considerations in Traffic Control Device Selection at Rail-Highway Grade Crossings
TASK ANALYSIS OF RAIL-HIGHWAY GRADE CROSSINGS
Introduction
This guideline addresses the key factors found to affect driver decisions regarding whether to obey traffic control devices at rail-highway grade crossings. Most crossings have traffic control devices (TCDs) installed and yet vehicle-train crashes still occur. From 1998 to 2007, 24,609 crashes occurred at public crossings that had warning devices installed (1). One reason that crashes occur is that individual factors cause drivers to disregard TCDs and put themselves into situations where there is a conflict risk. Although these factors are unique to each driver, the information provided by the crossing warnings can support safe decision-making.


TASK ANALYSIS FOR RAIL-HIGHWAY GRADE CROSSINGS
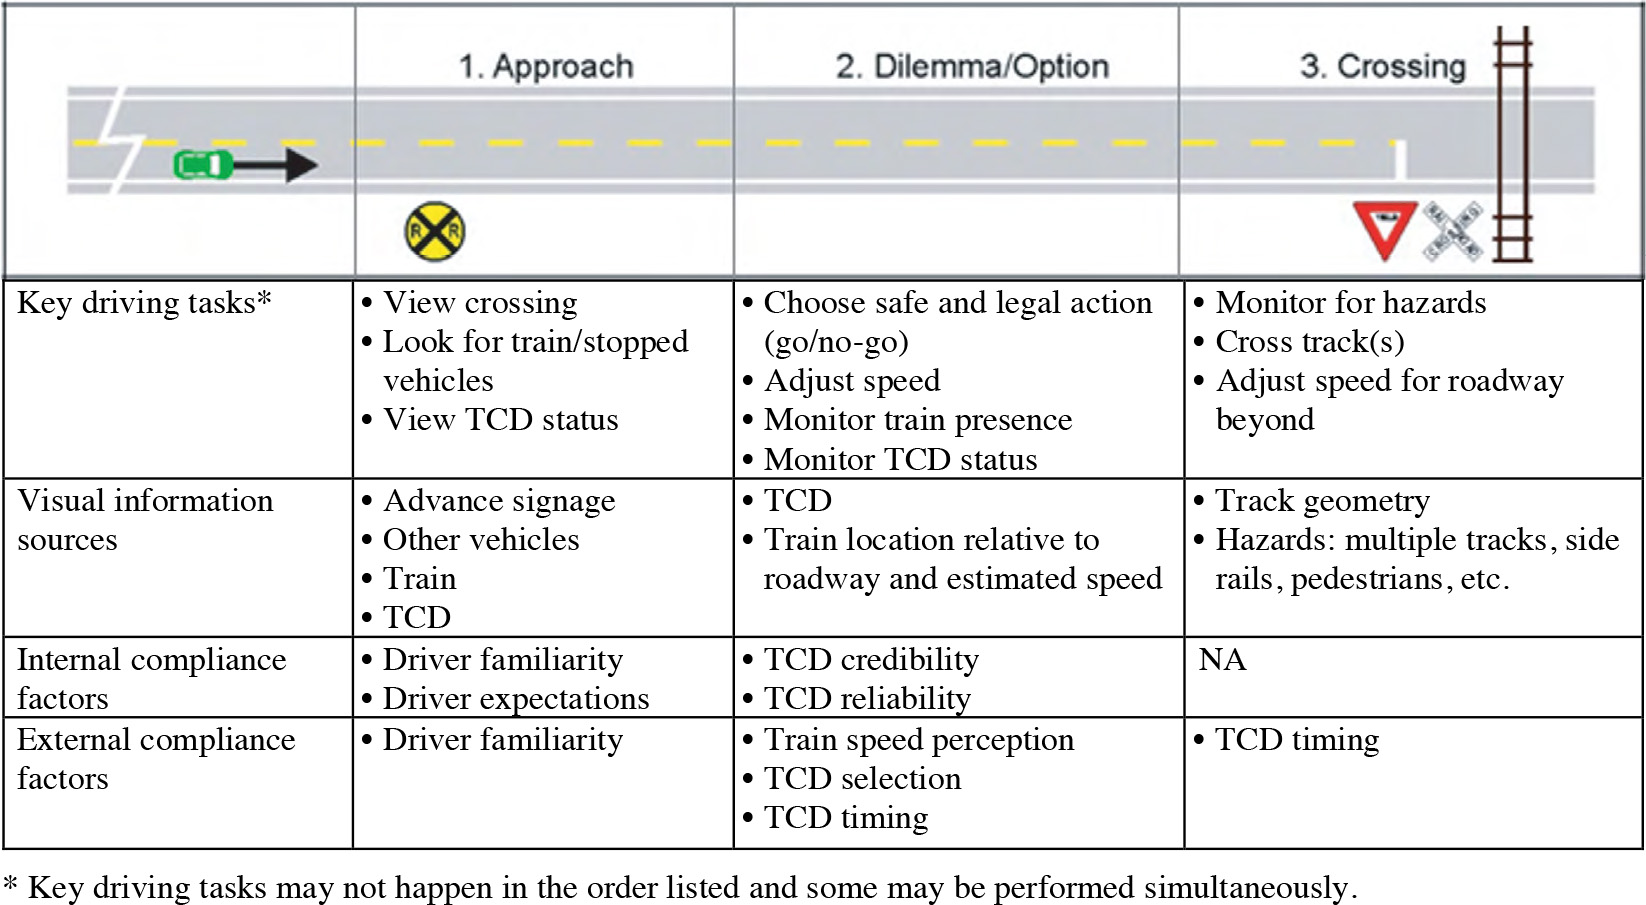
Long Description.
The first column header has an illustration of a vehicle traveling in a forward direction. The remaining column headers are 1. Approach, 2. Dilemma or option, and 3. Crossing. The column labeled Crossing has an illustration of road signs and a rail crossing. These column headers apply to the table below.
Discussion
Many of the driver factors that are incorporated into this guideline are covered in more detail in subsequent guidelines. It is important to consider these factors when planning a crossing because ultimately drivers decide whether they will comply with a warning device.
Familiarity. Abraham, Datta, and Datta (2) observed vehicles at train crossings and mailed surveys to the violators. They found that, of the drivers who violated the warning device, 68% traversed the specific crossing at least four times per week and 19% crossed two to four times per week.
Expectations. Raslear (3) performed an analysis of train detection at rail crossings using signal detection theory and compared the results to those found using crash data. Both analyses confirmed that if drivers expected to see a train at the crossing (and/or trains passed through more frequently), they were less likely to get in an accident.
Credibility. The level of trust that a driver has in the timing of the warning device is affected by the length of time that the driver has to wait, and the consistency of this time. Generally, as the warning time increases, the number of violations increases (4). Drivers expect a train to arrive within a certain amount of time after the activation of the warning devices. Additionally, constant warning time systems (rather than fixed-distance systems) have been shown to decrease mean warning times and increase compliance (4).
Reliability. Reliability is characterized by the accuracy with which an active warning device indicates that a train is approaching every time a train is coming and only when a train is coming. Gil, Multer, and Yeh (5) used a simulator to test participant responses at a crossing with a single-quadrant automatic gate, after participants were primed on the reliability of the traffic control device. They found that as the probability that a warning device actually indicated the presence of a train decreased, the frequency of gate violations increased (5). Although in the simulator, participants were biased towards proceeding regardless of the warning reliability (perhaps due to time-based completion incentives), indicating the possibility of the influence of other motivational factors.
Design Considerations
Gate-rushing is a specific type of violation that has been observed where drivers drive around gates that are closed or gates that are in the process of closing when trains are near the rail-highway grade crossing (6). There is no indication as to why drivers choose such a risky maneuver; they may be in a hurry, think they have enough time to pass, or have found the gate to be unreliable in the past. This behavior may be explained by some of the driver factors described in this guideline, or it may be related to other additional factors. Countermeasures regarding gate-rushing are discussed in “Countermeasures to Reduce Gate-Rushing at Crossings with Two-Quadrant Gates” on page 19-10.
The degree to which the driver holds the train operator accountable for the driverʼs crossing safety also affects crossing compliance (7). Drivers tend to think that train operators share some of the responsibility for crossing safety, i.e., if a driver and the train reach the crossing at the same time, the driver assumes that there is a shared responsibility for collision avoidance.
Advisory speed signs can be confusing to drivers if they are unaware of the reason for the reduced speed.
Cross References
None.
Key References
1. Raub, R. A. (2009). Examination of highway-rail grade crossing collisions nationally from 1998 to 2007. Transportation Research Record: Journal of the Transportation Research Board, 2122, 63–71.
2. Abraham, J., Datta, T. K., and Datta, S. (1998). Driver behavior at rail-highway crossings. Transportation Research Record: Journal of the Transportation Research Board, 1648, 28–34.
3. Raslear, T. G. (1995). Driver behavior at rail-highway grade crossings: A signal detection theory analysis. In A. A. Carroll & J. L. Helser (Eds.). Safety of Highway-Railroad Grade Crossing. Research Needs Workshop. Volume II—Appendices (DOT/FRA/ORD-95/14.2p. 46 p.). Washington, DC: USDOT.
4. Yeh, M., and Multer, J. (2007). Traffic control devices and barrier systems at grade crossings: Literature review. Transportation Research Record: Journal of the Transportation Research Board, 2030, 69–75.
5. Gil, M., Multer, J., and Yeh, M. (2007). Effects of Active Warning Reliability on Motorist Compliance at Highway-Railroad Grade Crossings (DOT-VNTSC-FRA-09-04. DOT/FRA/ORD-09-06). Washington, DC: Federal Railroad Administration.
6. Khattak, A. J., and McKnight, G. A. (2008). Gate rushing at highway-railroad grade crossings: Driversʼ response to centerline barrier. Transportation Research Record: Journal of the Transportation Research Board, 2056, 104–109.
7. Richards, S. H., and Heathington, K. W. (1988). Motorist understanding of railroad-highway grade crossing traffic control devices and associated traffic laws. Transportation Research Record: Journal of the Transportation Research Board, 1160, 52–59.
DRIVER INFORMATION NEEDS AT PASSIVE RAIL-HIGHWAY GRADE CROSSINGS
Introduction
This guideline refers to the information that drivers need to behave safely at rail-highway grade crossings that are protected by passive devices. This is especially relevant for crossings with only passive protection since drivers carry the full responsibility of determining if a train is approaching. In the past, crossings have been marked by crossbucks alone; however, the crossbuck is generally accompanied by a Yield or Stop sign (1). Yield and Stop signs address many of the deficiencies of crossbucks by more directly and effectively fulfilling driver information needs.
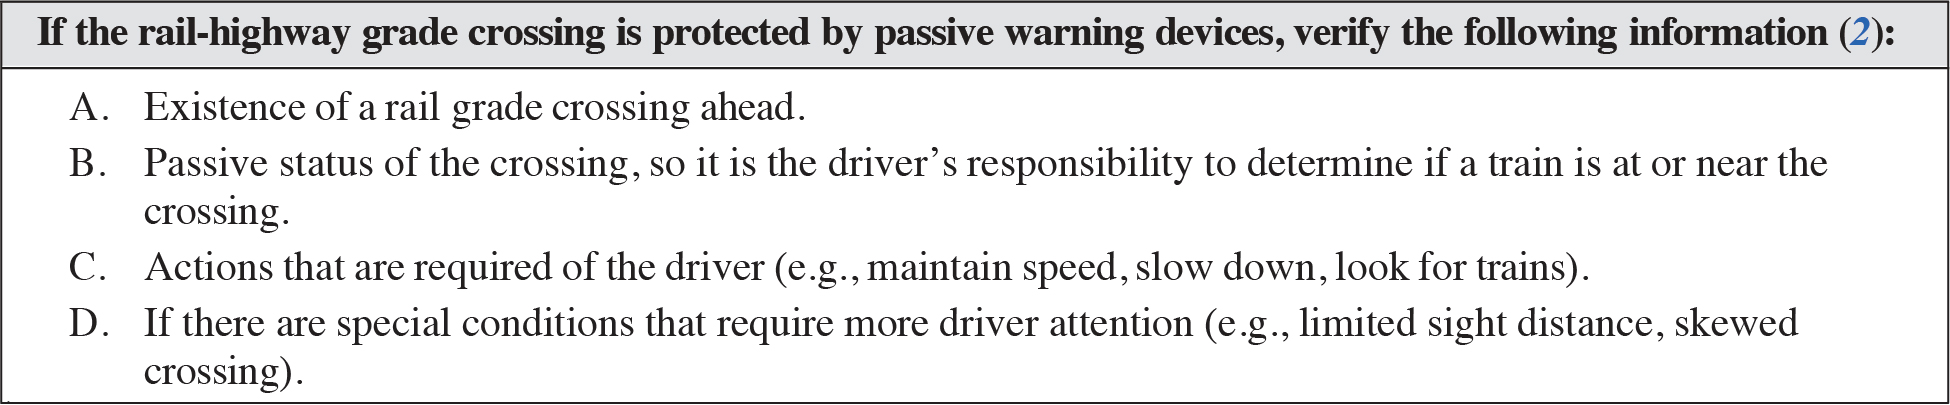

The following signs and plaques provide information to help meet some of the driver information needs listed above. These signs and plaques are presented in addition to traditional Stop and Yield signs, as discussed on the following page. The signs are labeled as they are in the 2023 MUTCD and include the information need(s) that they satisfy in parentheses.
EXAMPLES OF PASSIVE SIGNING TO FULFILL DRIVER INFORMATION NEEDS (NOT TO SCALE)
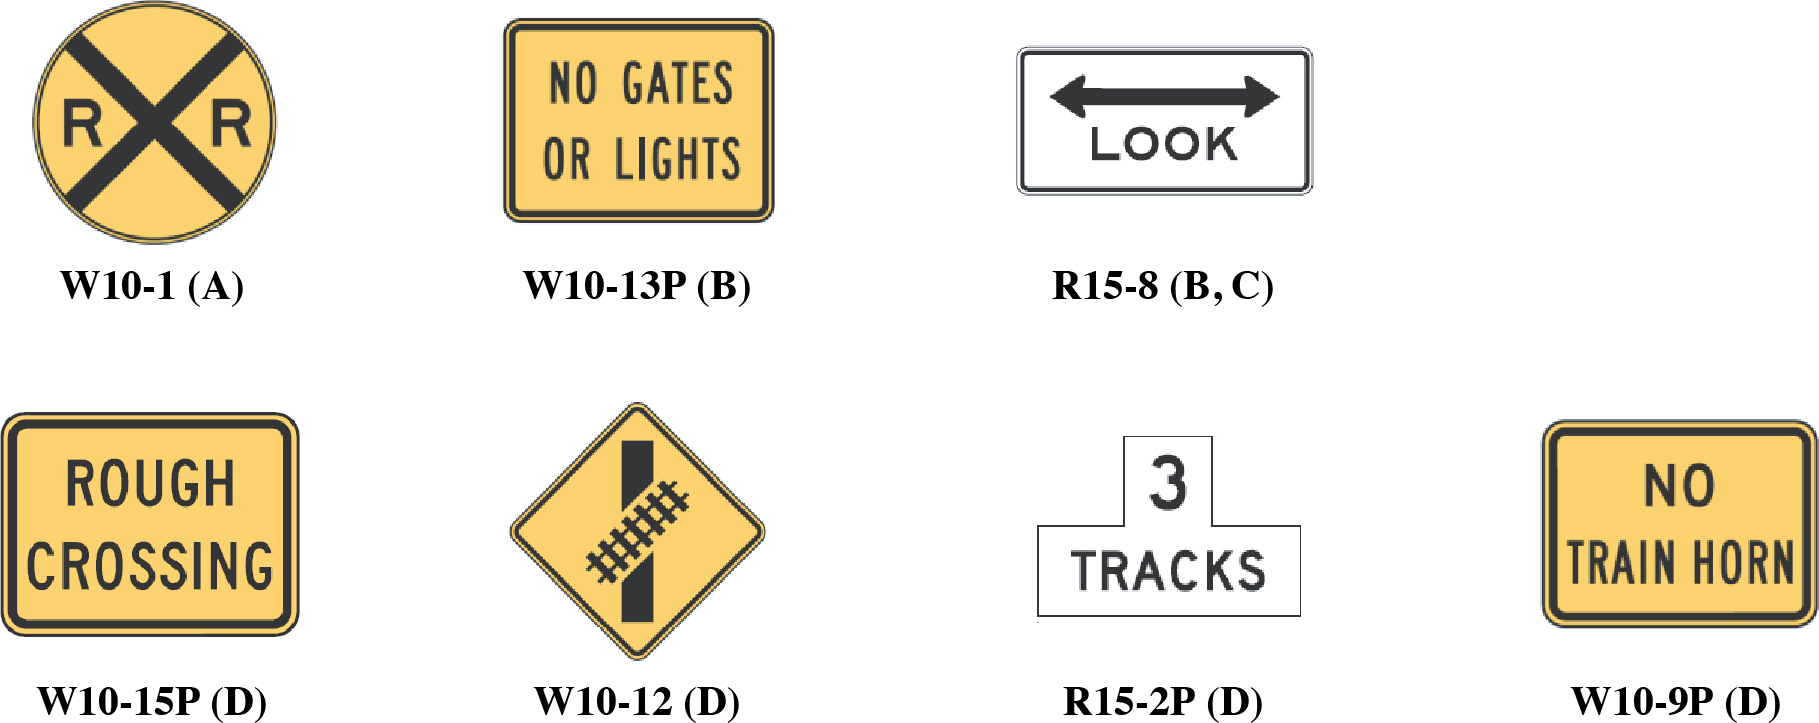
Source: FHWA (1)
Long Description.
The first sign for W 10–1 (A) shows a cross and two Rs. The second sign for W 10–13 P (B) reads No Gates or Lights. The third sign for R 15–8 (B, C) shows a double-headed arrow and text LOOK. The fourth sign for W 10–15P (D) shows a sign for Rough Crossing. The fifth sign for W 10–12 (D) shows a railway crossing over a road. The sixth sign for R 15–2 P (D) shows 3 tracks. The seventh sign for W 10–9 P (D) shows No Train Horn.
Discussion
The information needs described in the guideline on the previous page are not adequately addressed by crossbuck warning devices alone. The signs and plaques provided are examples of countermeasures that can be used to fill some of these needs. However, the effectiveness of the various signs in improving driver safety is unknown. An additional required sign element at passive crossings is the Yield or Stop sign. The following table shows ways in which Yield and Stop signs address the deficiencies of crossbucks in providing information needs [adapted from Lerner et al. (2)]. The information needs are labeled as listed in the table on the previous page.
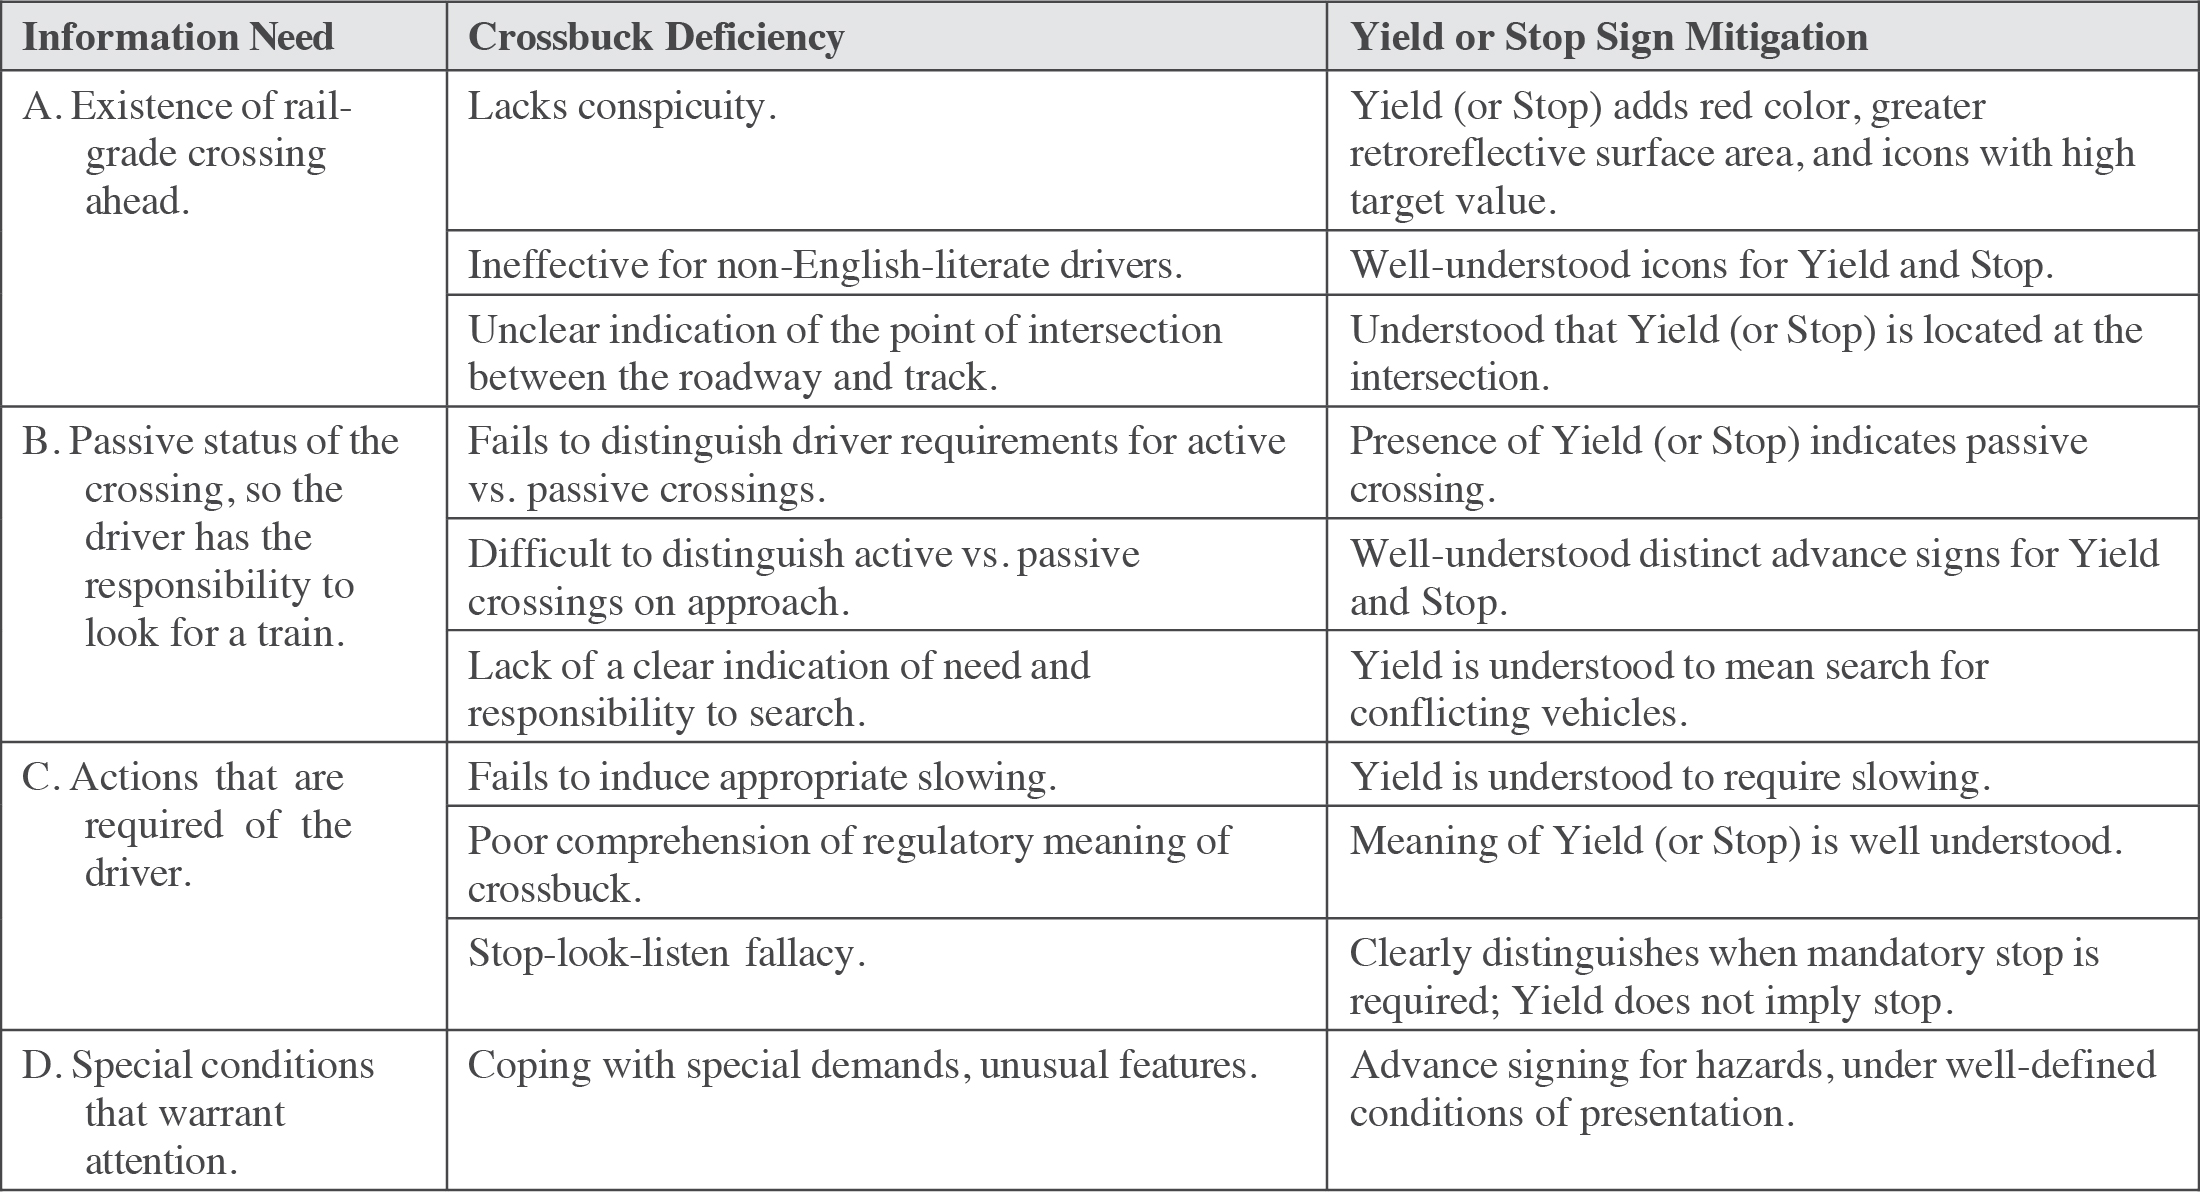
Long Description.
The table has 2 columns: Column 1: Crossbuck Deficiency. Column 2: Yield or Stop Sign Mitigation. Rows 1 to 3 are grouped in a section labeled Information Need: A. Existence of rail-grade crossing ahead. Row 1, Column 1: Lacks conspicuity. Column 2: Yield (or Stop) adds red color, greater retroreflective surface area, and icons with high target value. Row 2, Column 1: Ineffective for non-English-literate drivers. Column 2: Well-understood icons for Yield and Stop. Row 3, Column 1: Unclear indication of the point of intersection between the roadway and track. Column 2: Understood that Yield (or Stop) is located at the intersection. Rows 4 to 6 are grouped in a section labeled Information Need: B. Passive status of the crossing, so the driver has the responsibility to look for a train. Row 4, Column 1: Fails to distinguish driver requirements for active vs. passive crossings. Column 2: Presence of Yield (or Stop) indicates passive crossing. Row 5, Column 1: Difficult to distinguish active vs. passive crossings on approach. Column 2: Well-understood distinct advance signs for Yield and Stop. Row 6, Column 1: Lack of a clear indication of need and responsibility to search. Column 2: Yield is understood to mean search for conflicting vehicles. Rows 7 to 9 are in a section labeled Information Need: C. Actions that are required of the driver. Row 7, Column 1: Fails to induce appropriate slowing. Column 2: Yield is understood to require slowing. Row 8, Column 1: Poor comprehension of regulatory meaning of crossbuck. Column 2: Meaning of Yield (or Stop) is well understood. Row 9, Column 1: Stop-look-listen fallacy. Column 2: Clearly distinguishes when mandatory stop is required; Yield does not imply stop. Row 10 is in a section labeled Information Need: D. Special considerations that warrant attention. Row 10, Column 1: Coping with special demands, unusual features. Column 2: Advance signing for hazards, under well-defined conditions of presentation.
It is evident that Yield and Stop signs address the driverʼs information needs more thoroughly than crossbucks alone. Lerner et al. (2) suggests the use of a Yield sign unless a Stop sign is warranted to reduce the likelihood of train-vehicle conflicts. To fulfill the objective of providing clear guidance to drivers, Lerner et al. (2) supports the use of two additional plaques to be displayed below the existing Grade Crossing Advance Warning Signs. These plaques would convey the status of the upcoming warning devices, either active or passive. The passive plaque reads “No Signals or Gates,” while the active plaque shows an icon of a flashing-light signal with the words “Signal Ahead.” The addition of the new plaques would provide information to drivers regarding the status of the upcoming traffic control devices on the approach to the crossing. The current MUTCD has a similar passive warning plaque (W10-13P), which is optional, but does not support the active plaque.
Design Considerations
Olson et al. (3) include another list of driver information needs: (1) something is there, (2) the item that the driver sees is a train, (3) the train will cross the road that the driver is on, (4) the distance to the train, and (5) the trainʼs speed and direction. These needs would likely be difficult to meet using passive signage. However, they highlight the significance of environmental contextual cues as an addition to engineering countermeasures to help the driver interpret their surroundings. These driver information needs also highlight the limitations of Yield signs, especially under ambiguous circumstances.
Cross References
Human Factors Considerations in Traffic Control Device Selection at Rail-Highway Grade Crossings
Key References
1. FHWA. (2023). Manual on Uniform Traffic Control Devices for Streets and Highways (11th ed.). Washington, DC.
2. Lerner, N. D., Llaneras, R. E., McGee, H. W., and Stephens, D. E. (2002). NCHRP Report 470: Traffic-Control Devices for Passive Railroad-Highway Grade Crossings. Transportation Research Board of the National Academies, Washington, DC.
3. Olson, P. L., Dewar, R., and Farber, E. (2009). Forensic Aspects of Driver Perception and Response. Tucson, AZ: Lawyers and Judges.
TIMING OF ACTIVE TRAFFIC CONTROL DEVICES AT RAIL-HIGHWAY GRADE CROSSINGS
Introduction
This guideline refers to the warning time, or the time between the initiation of the flashing-light traffic control devices and the arrival of the train. If the total warning time or portions of the timing are too short, drivers are at a risk of not being able either to stop in time for the gates to descend or to pass over the crossing from the dilemma zone. On the other hand, if the warning time is too long, drivers are less likely to comply with the warning devices (1).
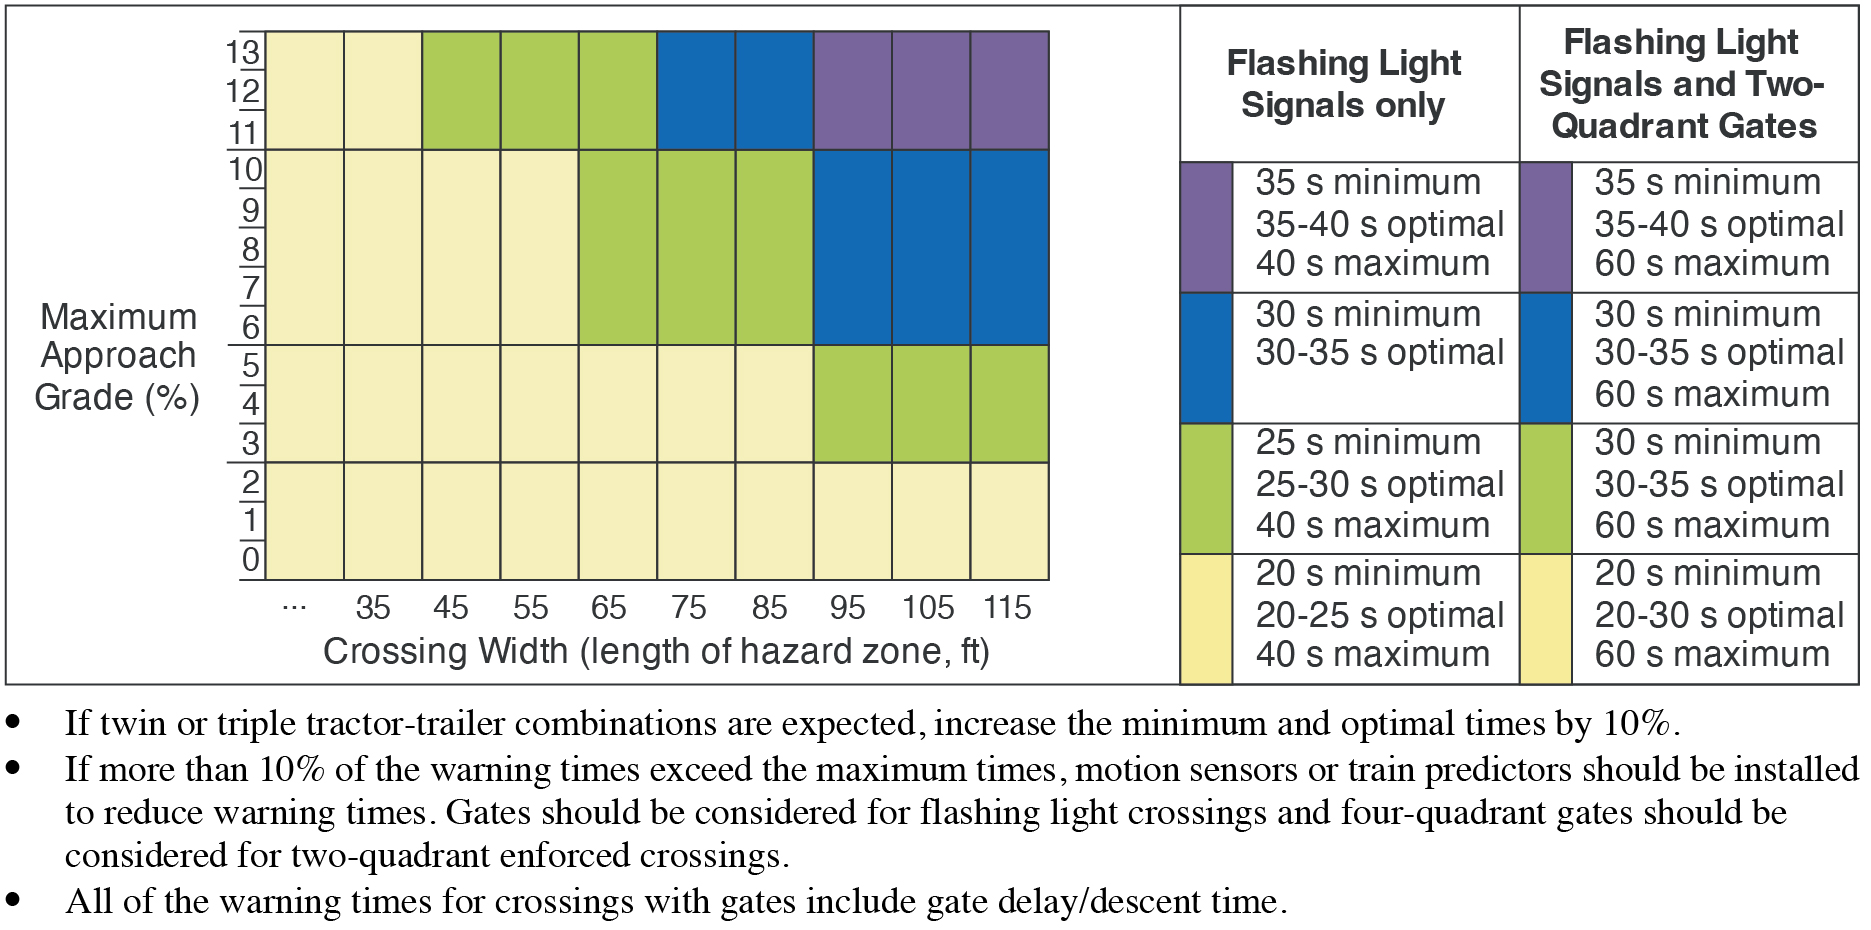

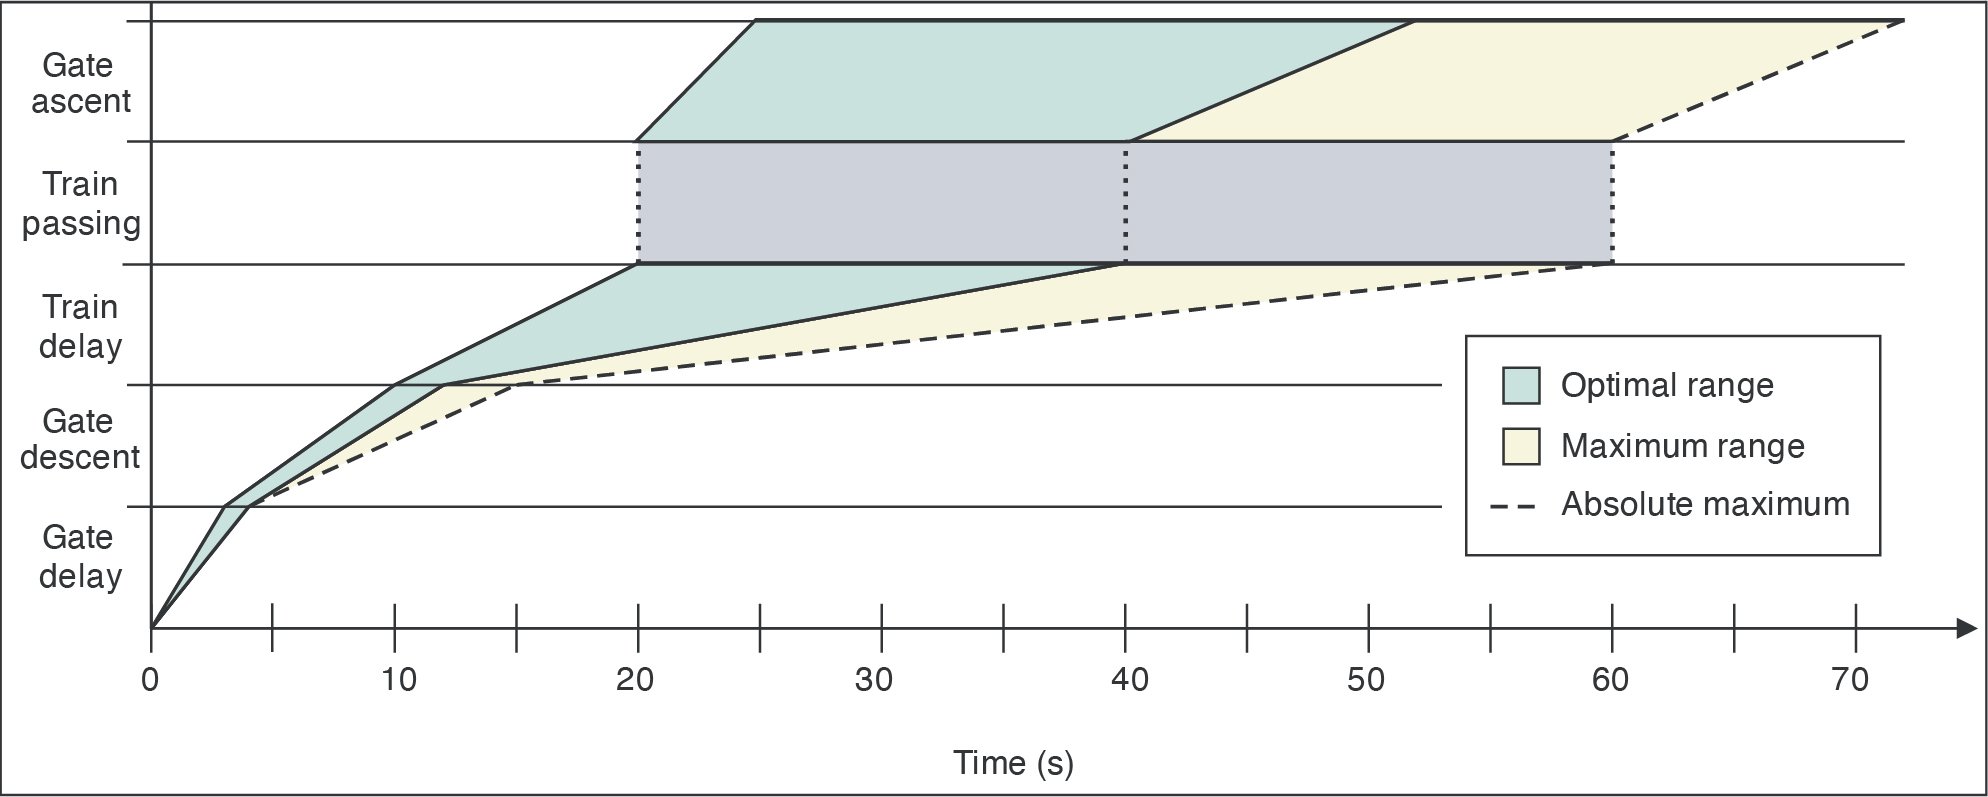
The graphic below shows in more detail the recommended signal and gate timing for two-quadrant gates.
SIGNAL AND GATE TIMING FOR TWO-QUADRANT GATES
Source: Richards and Heathington (1), see also FHWA (2).
Long Description.
The vertical axis shows gate delay, gate descent, train delay, train passing, and gate acsent from bottom to top. The horizontal axis shows time in seconds from 0 to 70 in increments of 10. The graph shows the optimal range, maximum range, and absolute values of the signal and gate timing for each of the values listed on the vertical axis.
Discussion
Warning times. Richards and Heathington (1) conducted field observations and a laboratory study to determine the expectations of drivers for warning times at rail-highway grade crossings. Driver observations were made using video tape at three crossings that had relatively high volumes of train and vehicle traffic as well as some past accidents. The crossings had flashing-light signals or flashing-light signals and standard gates. At the crossings with only flashing-light signals, most drivers crossed without stopping if they arrived within 1 s of the warning period beginning. This proportion steadily decreased and leveled off around 4 s, when most drivers stopped. However, at the crossings with both gates and flashing-light signals, most drivers did not react to the light activation and tried to beat the gate. More than 60% of the drivers crossed without stopping 9 s into the warning period. The percentage of drivers who stopped only leveled off when they could no longer beat the gates. The total warning time is composed of the gate delay, gate descent, and train delay times (for crossings with gates).
Gate delay and gate descent. The gate delay is defined as the length of time between the start of the flashing lights and the initiation of the descent of the entry gate (3). The percentage of drivers who cross without stopping increases with increasing gate delay/descent time (1). As the combined time increased from 10-14 s, the percentage of drivers who did not stop increased dramatically to level off at around 50% at a 15 s combined time. Thus, the authors recommend that the combined gate delay and descent period should optimally be between 10 s and 12 s, with an absolute maximum of 15 s. The MUTCD (2) requires that the gate arm start its descent at least 3 s after the start of the flashing lights. Richards and Heathington (1) give an upper limit of 4 s to this value, except when vehicle approach speeds exceed 60 mi/h.
Train delay. The train delay is the amount of time between the gate descent and the train arrival. At the crossings with only flashing-light signals, 98% of drivers stopped and remained stopped for warning times of 20–25 s, 73% for times of 25–30 s, and 90% for times of 30–35 s. Beyond 35 s, driver stopping behavior declined rapidly and when warning times exceeded 80 s, less than 20% of drivers stopped. At the gated crossing, 90% of drivers stopped and remained stopped for warning times of 20–25 s, 70% for times of 25–30 s, and 60% for times of 30–35 s. Beyond 35 s, the percentage stopped and remained constant around 60%, with a sharp drop after 80 s. At the crossing with only flashing-light signals but no predictors, long warning times generally led to compliance percentages below 30% for all warning times. Even when the warning times matched those at signalized crossings with predictors, compliance was much lower, perhaps due to a holdover effect that long and variable warning times have on general driver behavior at specific crossings.
Within this warning time, the MUTCD (2) requires that the gate arm reach a horizontal position at least 5 s before the train arrives at the crossing and remain down for the duration of the time that the train is at the crossing. Additionally, the MUTCD provides the standard that flashing-light signals should operate for at least 20 s before the arrival of a train under most circumstances. In a follow-up laboratory study (1), drivers viewed videos of train crossings and noted when they expected the train to arrive and when the elapsed time without a train arrival had become too long. When comparing flashing-light-only crossings to those with gates, the expected train arrival times are approximately the same (14.5 s to 13.2 s) when gate delay and descent are not included. The mean train delay to be considered excessive was 66.2 s for the gated crossing (including gate delay and descent) and 48.8 s without gate delay and descent times. This time was significantly longer than that for the flashing-light-only crossing, at which a 39.7-s delay was considered excessive.
Gate ascent. The MUTCD (2) provides the guidance that the gate arm should ascend to the vertical position in 12 s or less after the train clears the crossing (if no other train traffic is detected). After the gate arm ascends, the flashing-light signals and lights on the gate arms should cease operation.
Design Considerations
A caveat of this research is that few observations occurred when large vehicles were present. The times presented are based upon driver behavior rather than stopping distance calculations, which vary based on vehicle size. Also, only one gated crossing was included in the study done by Richards and Heathington (1).
Cross References
Task Analysis of Rail-Highway Grade Crossings
Human Factors Considerations in Traffic Control Device Selection at Rail-Highway Grade Crossings
Key References
1. Richards, S. H. and Heathington, K. W. (1990). Assessment of warning time needs at railroad-highway grade crossings with active traffic control. Transportation Research Record: Journal of the Transportation Research Board, 1254, 78–84.
2. FHWA. (2023). Manual on Uniform Traffic Control Devices for Streets and Highways. (11th ed.) Washington, DC.
3. Coleman, F., III., and Moon, Y. J. (1996). Design of gate delay and gate interval time for four-quadrant gate system at railroad-highway grade crossings. Transportation Research Record: Journal of the Transportation Research Board, 1553, 124–131.
FOUR-QUADRANT GATE TIMING AT RAIL-HIGHWAY GRADE CROSSINGS
Introduction
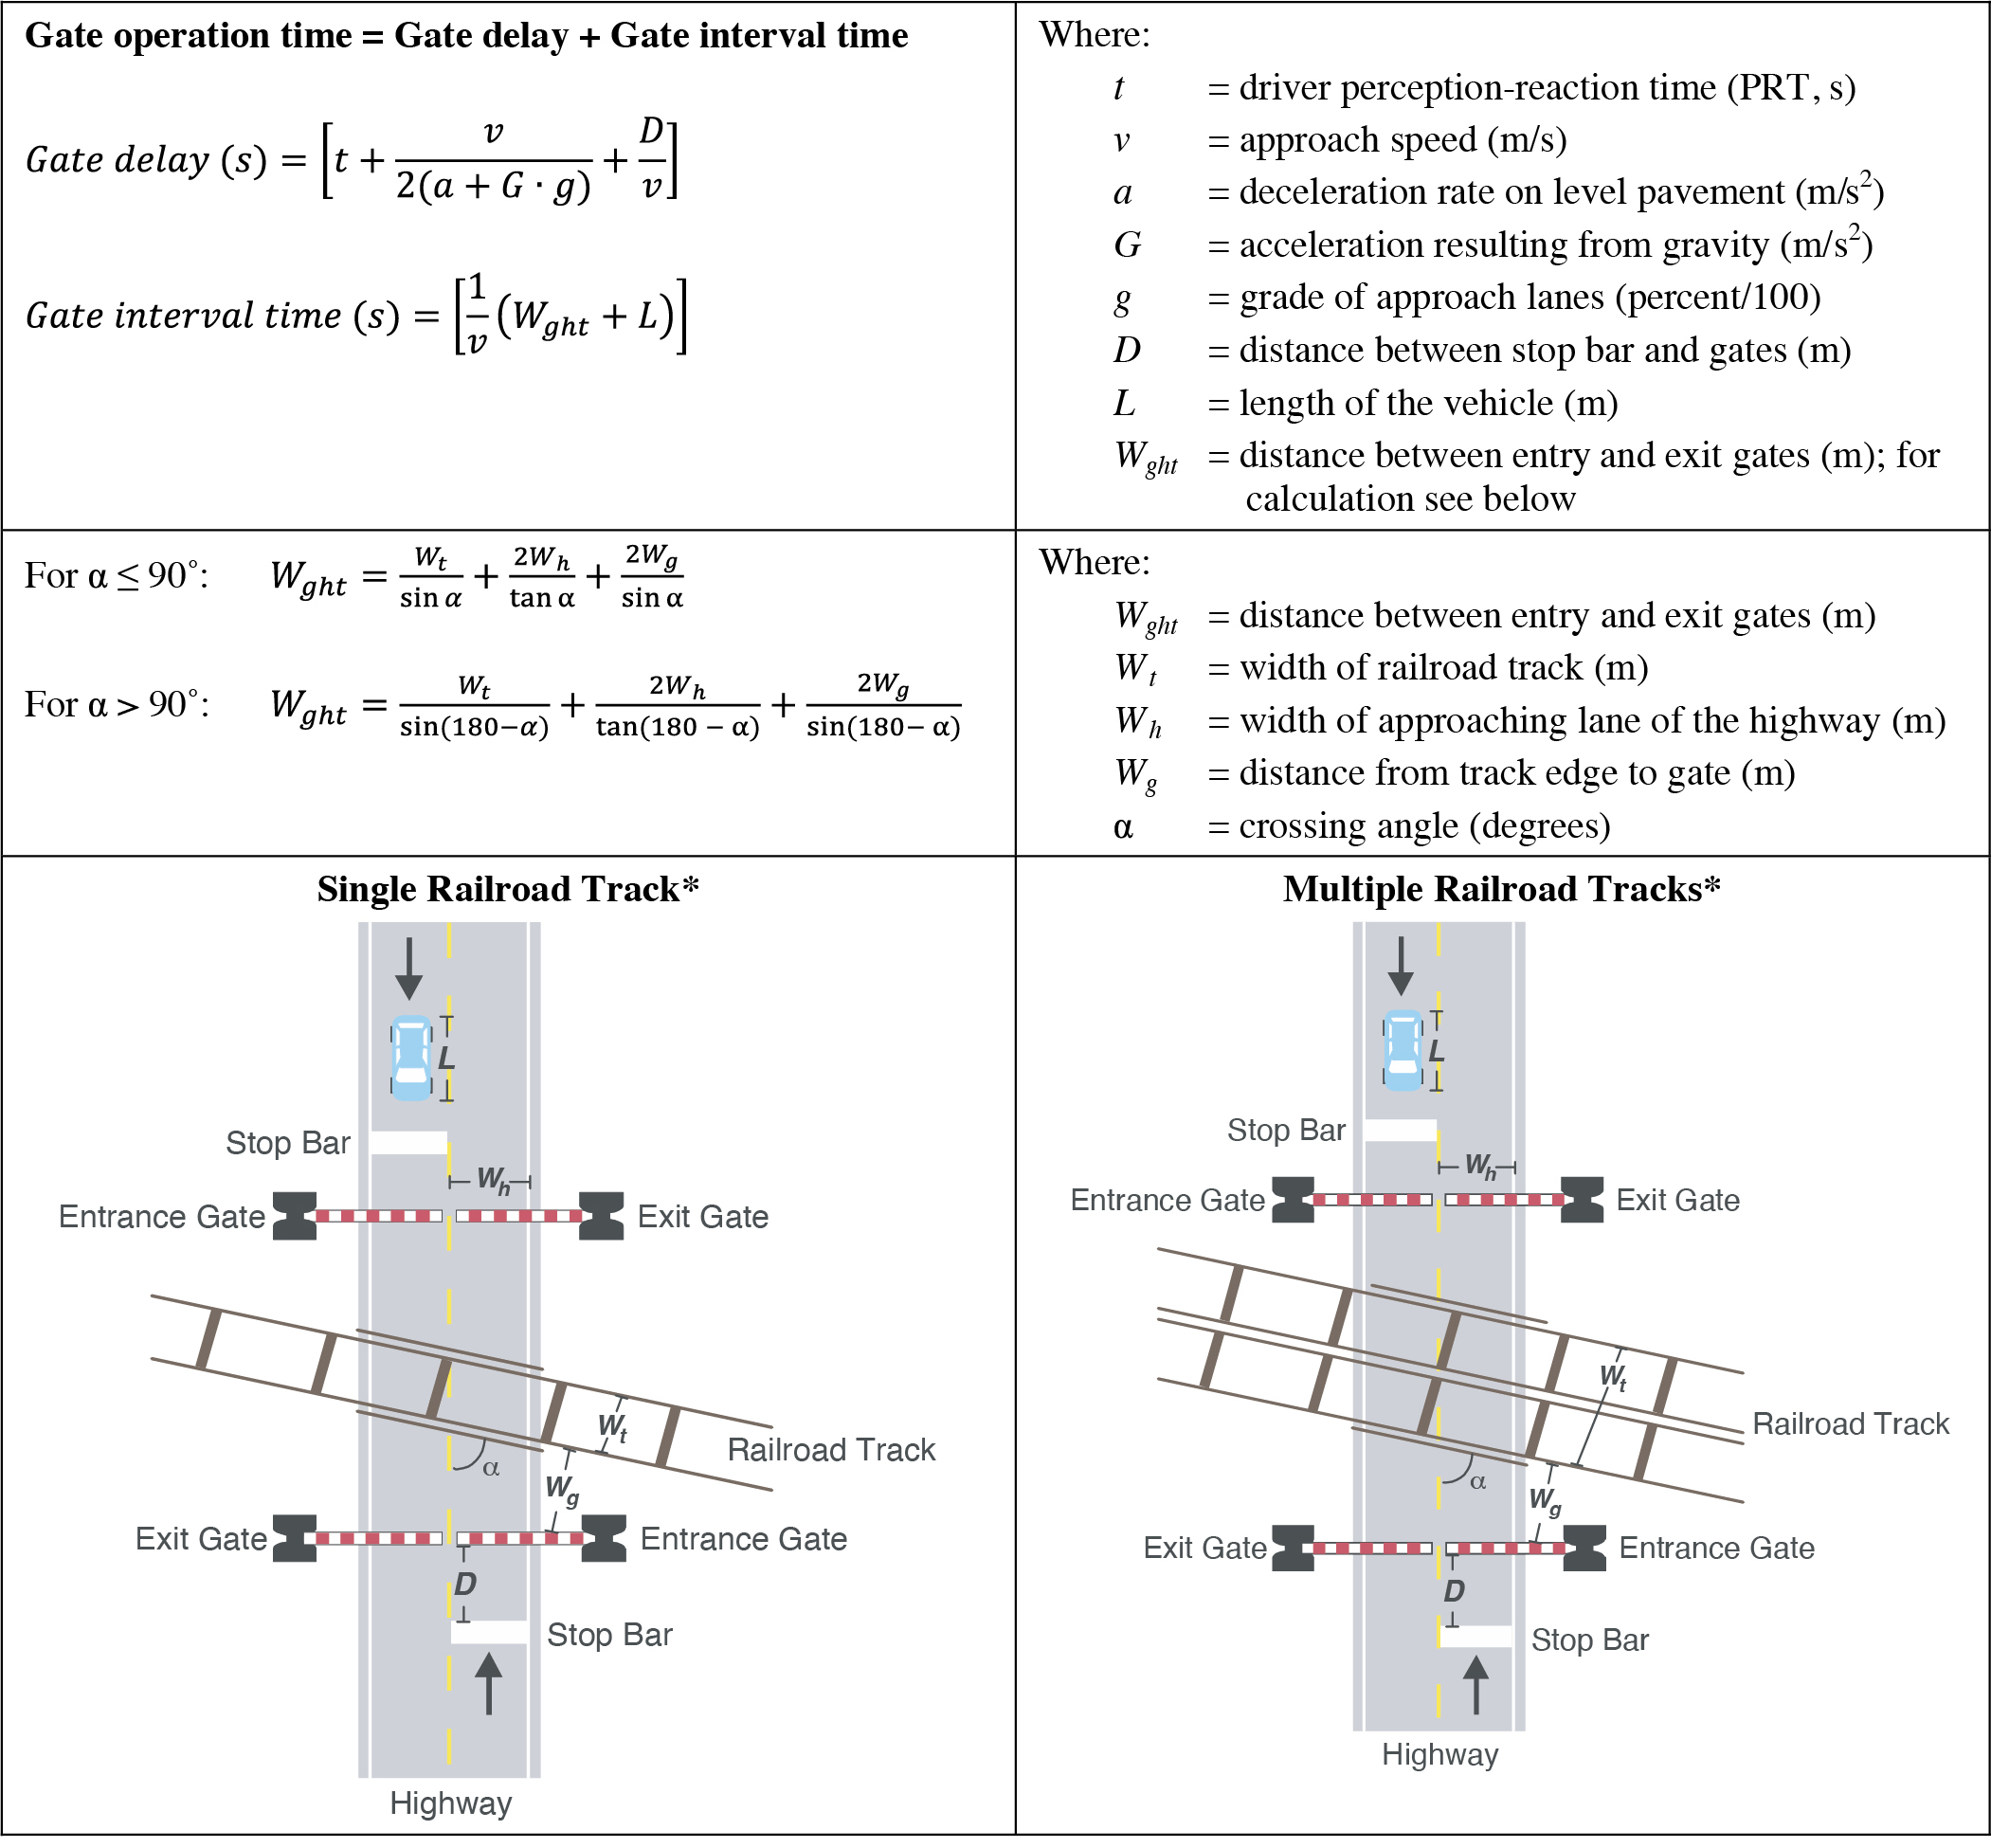
This guideline refers to the gate interval time, which is the length of time between the initiation of the descent of the entry gate and the initiation of the descent of the exit gate at a crossing with a four-quadrant gate device (1). The gate interval needs to be long enough to allow even large vehicles to finish passing over the crossing before the second gate closes, but not so long that vehicles will try to bypass the first gate to beat the train through the crossing.

Discussion
Four-quadrant gates are desirable for their ability to restrict through traffic at grade crossings. Four-quadrant gates are more effective at controlling gate-rushing, that is passing around gate arms that are already descended on two-quadrant gates (see “Countermeasures to Reduce Gate-Rushing at Crossings with Two-Quadrant Gates” on page 19-10). The MUTCD (2) guidance suggests that four-quadrant gate systems should only be used at crossings that are equipped with constant warning time detection. A critical operational element of such systems is the operation of the exit gate arm. The exit gate arm must be timed in such a way that it is still effective against drivers attempting to drive in the opposing direction around the entry gate, yet it does not trap vehicles trying to clear the crossing in the proper lane between the two gate arms. The MUTCD (2) defines the exit gate clearance time as “the amount of time provided to delay the descent of the exit gate arm(s) after entrance gate arm(s) begin to descend,” equivalent to the gate interval time in this guideline. The MUTCD (2) also describes two operating modes for the exit gate arms. The Timed Exit Gate Operating Mode has a predetermined gate interval time, while the Dynamic Exit Gate Operating Mode bases the gate operation on the presence of vehicles within the minimum track clearance area. For either operating mode, the exit gate clearance time, or gate interval time, should be considered when determining the warning time. The timing guidance provided by the MUTCD (2) states that the gate arms blocking the entrance lanes should begin their descent no less than 3 s after the flashing lights begin flashing and reach the down position no less than 5 s before the train arrives.
The design of this timing concept is based on the concept of the dilemma zone, similar to that at signalized intersections (1). When the flashing signal lights begin flashing at a grade crossing, the driver must decide if he/she needs to stop or can proceed through the crossing before the gates descend. There are three relevant distances involved in the decision: the distance between the driver and the crossing, the distance that the vehicle travels prior to the descent of the entry gates (continuation distance), and the stopping distance before the crossing. If the stopping distance and continuation distance are equal, the driver is at a “safe decision location” where he/she may either stop or clear the crossing safely. This location is used to simplify the model. Although this model is based upon a single study, the methodology was validated using six crossings under consideration for four-quadrant gates.
Coleman and Moon (1) use perception-reaction times (t) of 1.0 s and 2.5 s in the model. Additionally, they cite a deceleration level (a) of 3.04 m/s2 as found in intersection studies with approach speeds of 35 mi/h. The MUTCD guide states that, where possible, a safety zone able to accommodate at least one design vehicle should exist between the exit gate and the nearest rail (distance Wg in this guideline).
Design Considerations
A dynamic dilemma zone has been defined in reference to intersections as “a road segment on approach to an intersection which varies in length based on fluctuations in vehicle speeds and the number of vehicles within a road segment” (3). The model is highly similar to the static dilemma zone model discussed in this guideline, but can account for vehicle accelerations/decelerations near the crossing and vehicle platoon behavior.
Cross References
Task Analysis of Rail-Highway Grade Crossings
Timing of Active Traffic Control Devices at Rail-Highway Grade Crossings
Countermeasures to Reduce Gate-Rushing at Crossings with Two-Quadrant Gates
Key References
1. Coleman, F., III., and Moon, Y. J. (1996). Design of gate delay and gate interval time for four-quadrant gate system at railroad-highway grade crossings. Transportation Research Record: Journal of the Transportation Research Board, 1553, 124–131.
2. FHWA. (2023). Manual on Uniform Traffic Control Devices for Streets and Highways. (11th ed.) Washington, DC.
3. Moon, Y. J., and Coleman, F., III. (2003). Dynamic dilemma zone based on driver behavior and car-following model at highway-rail intersections. Transportation Research Part B: Methodological, 37(4), 323–344.
COUNTERMEASURES TO REDUCE GATE-RUSHING AT CROSSINGS WITH TWO-QUADRANT GATES
Introduction
Gate-rushing is a type of violation that occurs when drivers drive under gate arms as they are descending or around gate arms that are already in the lowered position. Although gates are some of the most restrictive crossing control devices, 9.1 crashes per 1 million trains are still occurring at crossings with two-quadrant gates (1). Additionally, vehicle crashes at gated crossings were significantly more likely to occur when a train struck a vehicle than when a vehicle struck a train (1). This is likely occurring because a driver has misjudged the speed of the train and rushed the gate(s) in an attempt to beat the train through the crossing.

Discussion
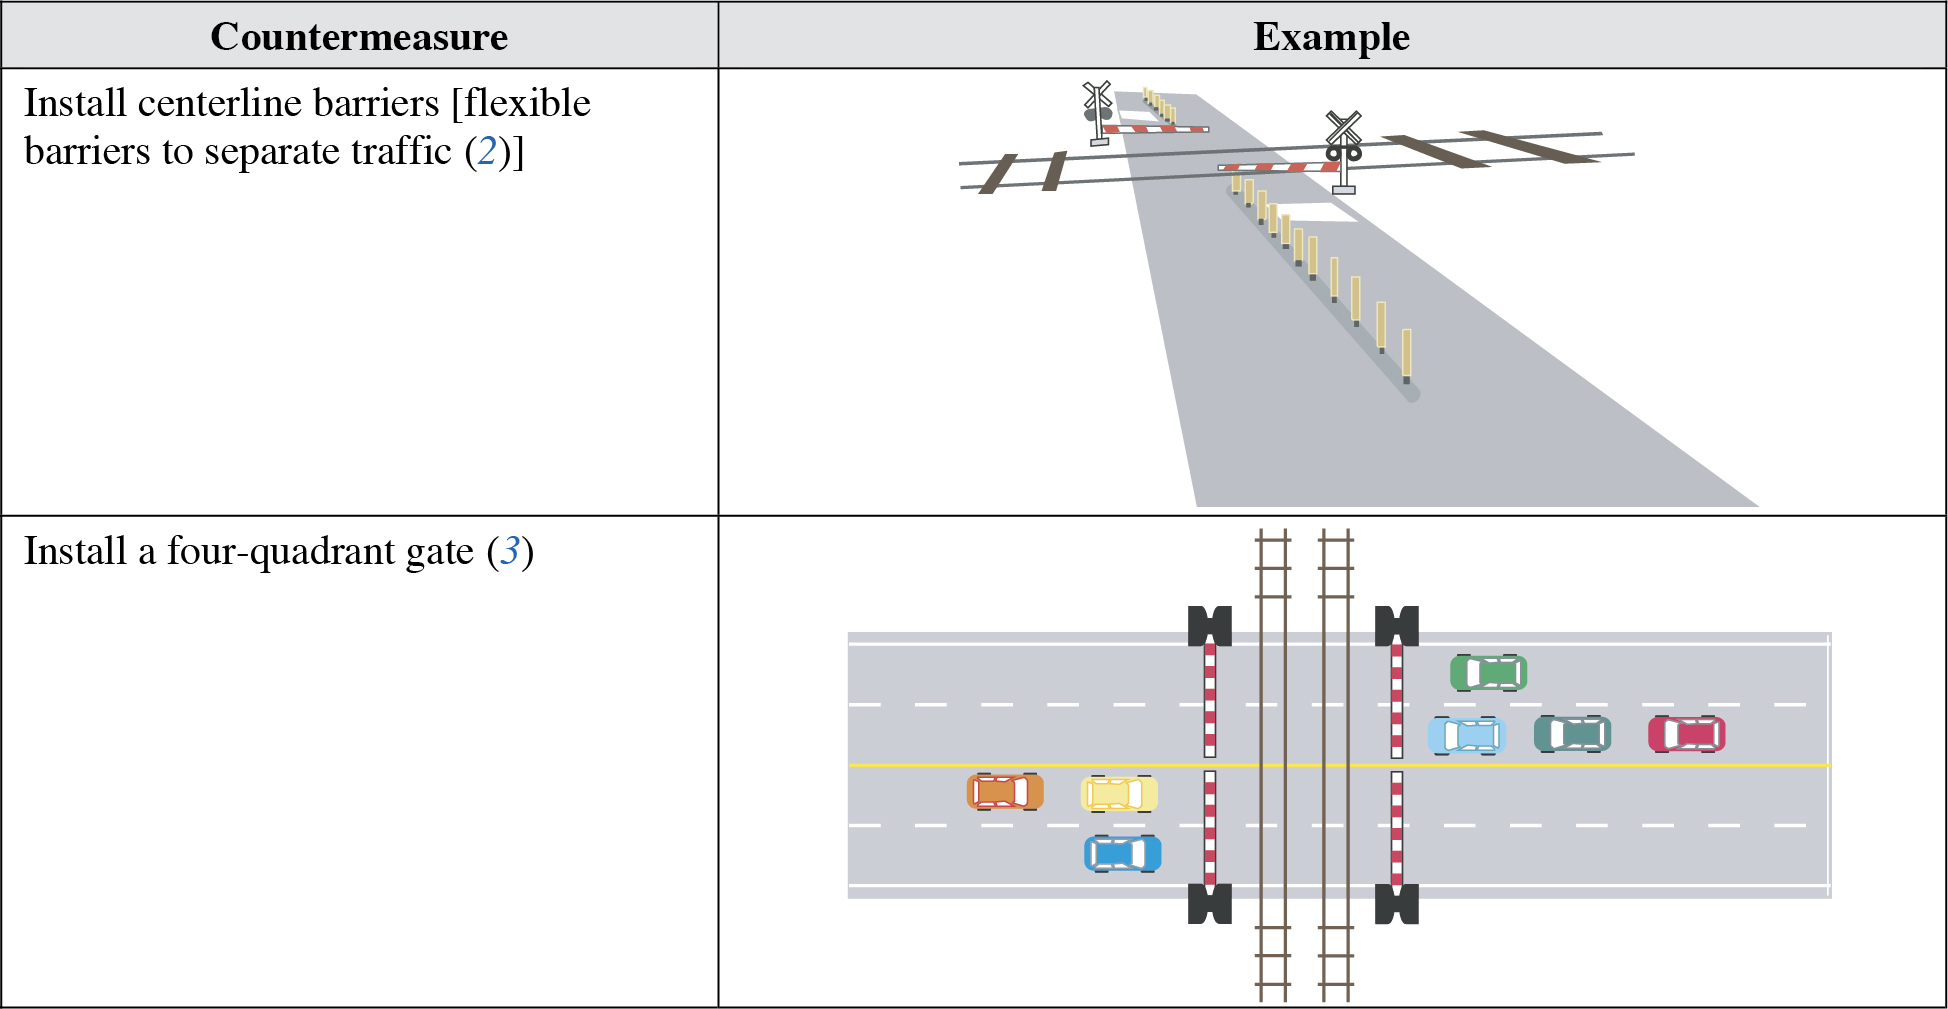
Centerline barriers. The two unsafe behaviors that were examined with centerline barriers were gate-rushing and driver U-turns while waiting for trains to pass through the crossing. When tested at two sites, centerline barriers reduced gate-rushing by 35% on average and U-turns at gates by 82% on average (2). The results showed that drivers were more likely to rush the gates in clear weather and when the gate malfunctioned (i.e., activated without a train present). Drivers were also more likely to bypass the gate when more than one train was crossing with little delay between them as many drivers used the gap between successive trains to go around the gate and cross. Drivers were also more likely to make U-turns with longer gate closures, gate malfunctions, in clear weather, on weekends, and when trains stopped on the tracks. The median treatment was only tested at two crossings; however, although the frequency of unsafe behaviors varied between the crossings (likely due to site-specific characteristics), driversʼ responses to the barrier countermeasure were similar in magnitude between the two different crossings.
Four-quadrant gates. Four-quadrant gates reduce gate-rushing by physically restricting drivers from driving around lowered gate arms. In a before-and-after study performed with a transition from two-quadrant to four-quadrant gates with skirts, the average number of drivers per train arrival who drove around the gate arms dropped from 2.6 to 0.0 (3). Driver approach speed was found to be about 10 mi/h faster with the installation of four-quadrant gates. This was likely due, however, to drivers not having to slow to follow a queue of vehicles that were bypassing the lowered gate arms. The authors recommend that four-quadrant gates be considered for crossings with one or more of the following characteristics: (1) crossings on four-lane undivided roads, (2) multitrack crossings at which the distance between tracks is greater than the vehicle length, (3) crossings without train predictors that have long and variable warning times, (4) crossings that are frequently crossed by trucks carrying hazardous materials, school buses, or high-speed passenger trains, and (5) crossings with consistent gate-rushing or crashes.
Design Considerations
Engineering changes. There are engineering changes that can be made to reduce gate-rushing without the installation of additional physical roadway countermeasures. Constant warning time train predictors have been shown to reduce violations of flashing-light signals and reduce the occurrence of very short clearance times at crossings with flashing lights only (4). Also, decreased warning times have been shown to reduce violations in general (5). For exact guidance, see the guideline on Timing of Active Traffic Control Devices at Rail-Highway Grade Crossings. These constant and decreased warning times improve the credibility of warning devices, thereby increasing driver trust in the system and compliance with warning devices.
Wayside horns. In a study at three crossings in a residential suburb, Raub and Lucke (6) found that after the transition from train horns to automated wayside horns, gate violations decreased by 68%. Additionally, residential sound levels decreased by over 10 dB in most locations within the vicinity of the crossings. Although these are both great advantages for the wayside horn systems, the horns can have false activations (i.e., activated when a commuter train stopped at a station within the warning zone) and are often sounded for longer periods of time than train horns (from the time that the gate activates to the train arrival). There is the possibility that the horns may startle drivers as evidenced by 12 drivers that stopped on the tracks. Overall, the main purpose of this countermeasure is not to reduce gate-rushing, but rather to replace locomotive horns with an auditory notification that pollutes surrounding areas to a lesser degree.
Cross References
Task Analysis of Rail-Highway Grade Crossings
Timing of Active Traffic Control Devices at Rail-Highway Grade Crossings
Four-Quadrant Gate Timing at Rail-Highway Grade Crossings
Key References
1. Raub, R. A. (2009). Examination of highway-rail grade crossing collisions nationally from 1998 to 2007. Transportation Research Record: Journal of the Transportation Research Board, 2122, 63–71.
2. Khattak, A. J., and McKnight, G. A. (2008). Gate rushing at highway-railroad grade crossings: Driversʼ response to centerline barrier. Transportation Research Record: Journal of the Transportation Research Board, 2056, 104–109.
3. Heathington, K. W., Fambro, D. B., and Richards, S. H. (1989). Field evaluation of a four-quadrant gate system for use at railroad-highway grade crossings. Transportation Research Record: Journal of the Transportation Research Board, 1244, 39–51.
4. Richards, S. H., Heathington, K. W., and Fambro, D. B. (1990). Evaluation of constant warning times using train predictors at a grade crossing with flashing-light signals. Transportation Research Record: Journal of the Transportation Research Board, 1254, 60–71.
5. Richards, S. H. and Heathington, K. W. (1990). Assessment of warning time needs at railroad-highway grade crossings with active traffic control. Transportation Research Record: Journal of the Transportation Research Board, 1254, 78–84.
6. Raub, R. A., and Lucke, R. E. (2004). Use of automated wayside horns for improving highway-rail grade crossing safety. ITE 2004 Annual Meeting and Exhibit.
HUMAN FACTORS CONSIDERATIONS IN TRAFFIC CONTROL DEVICE SELECTION AT RAIL-HIGHWAY GRADE CROSSINGS
Introduction
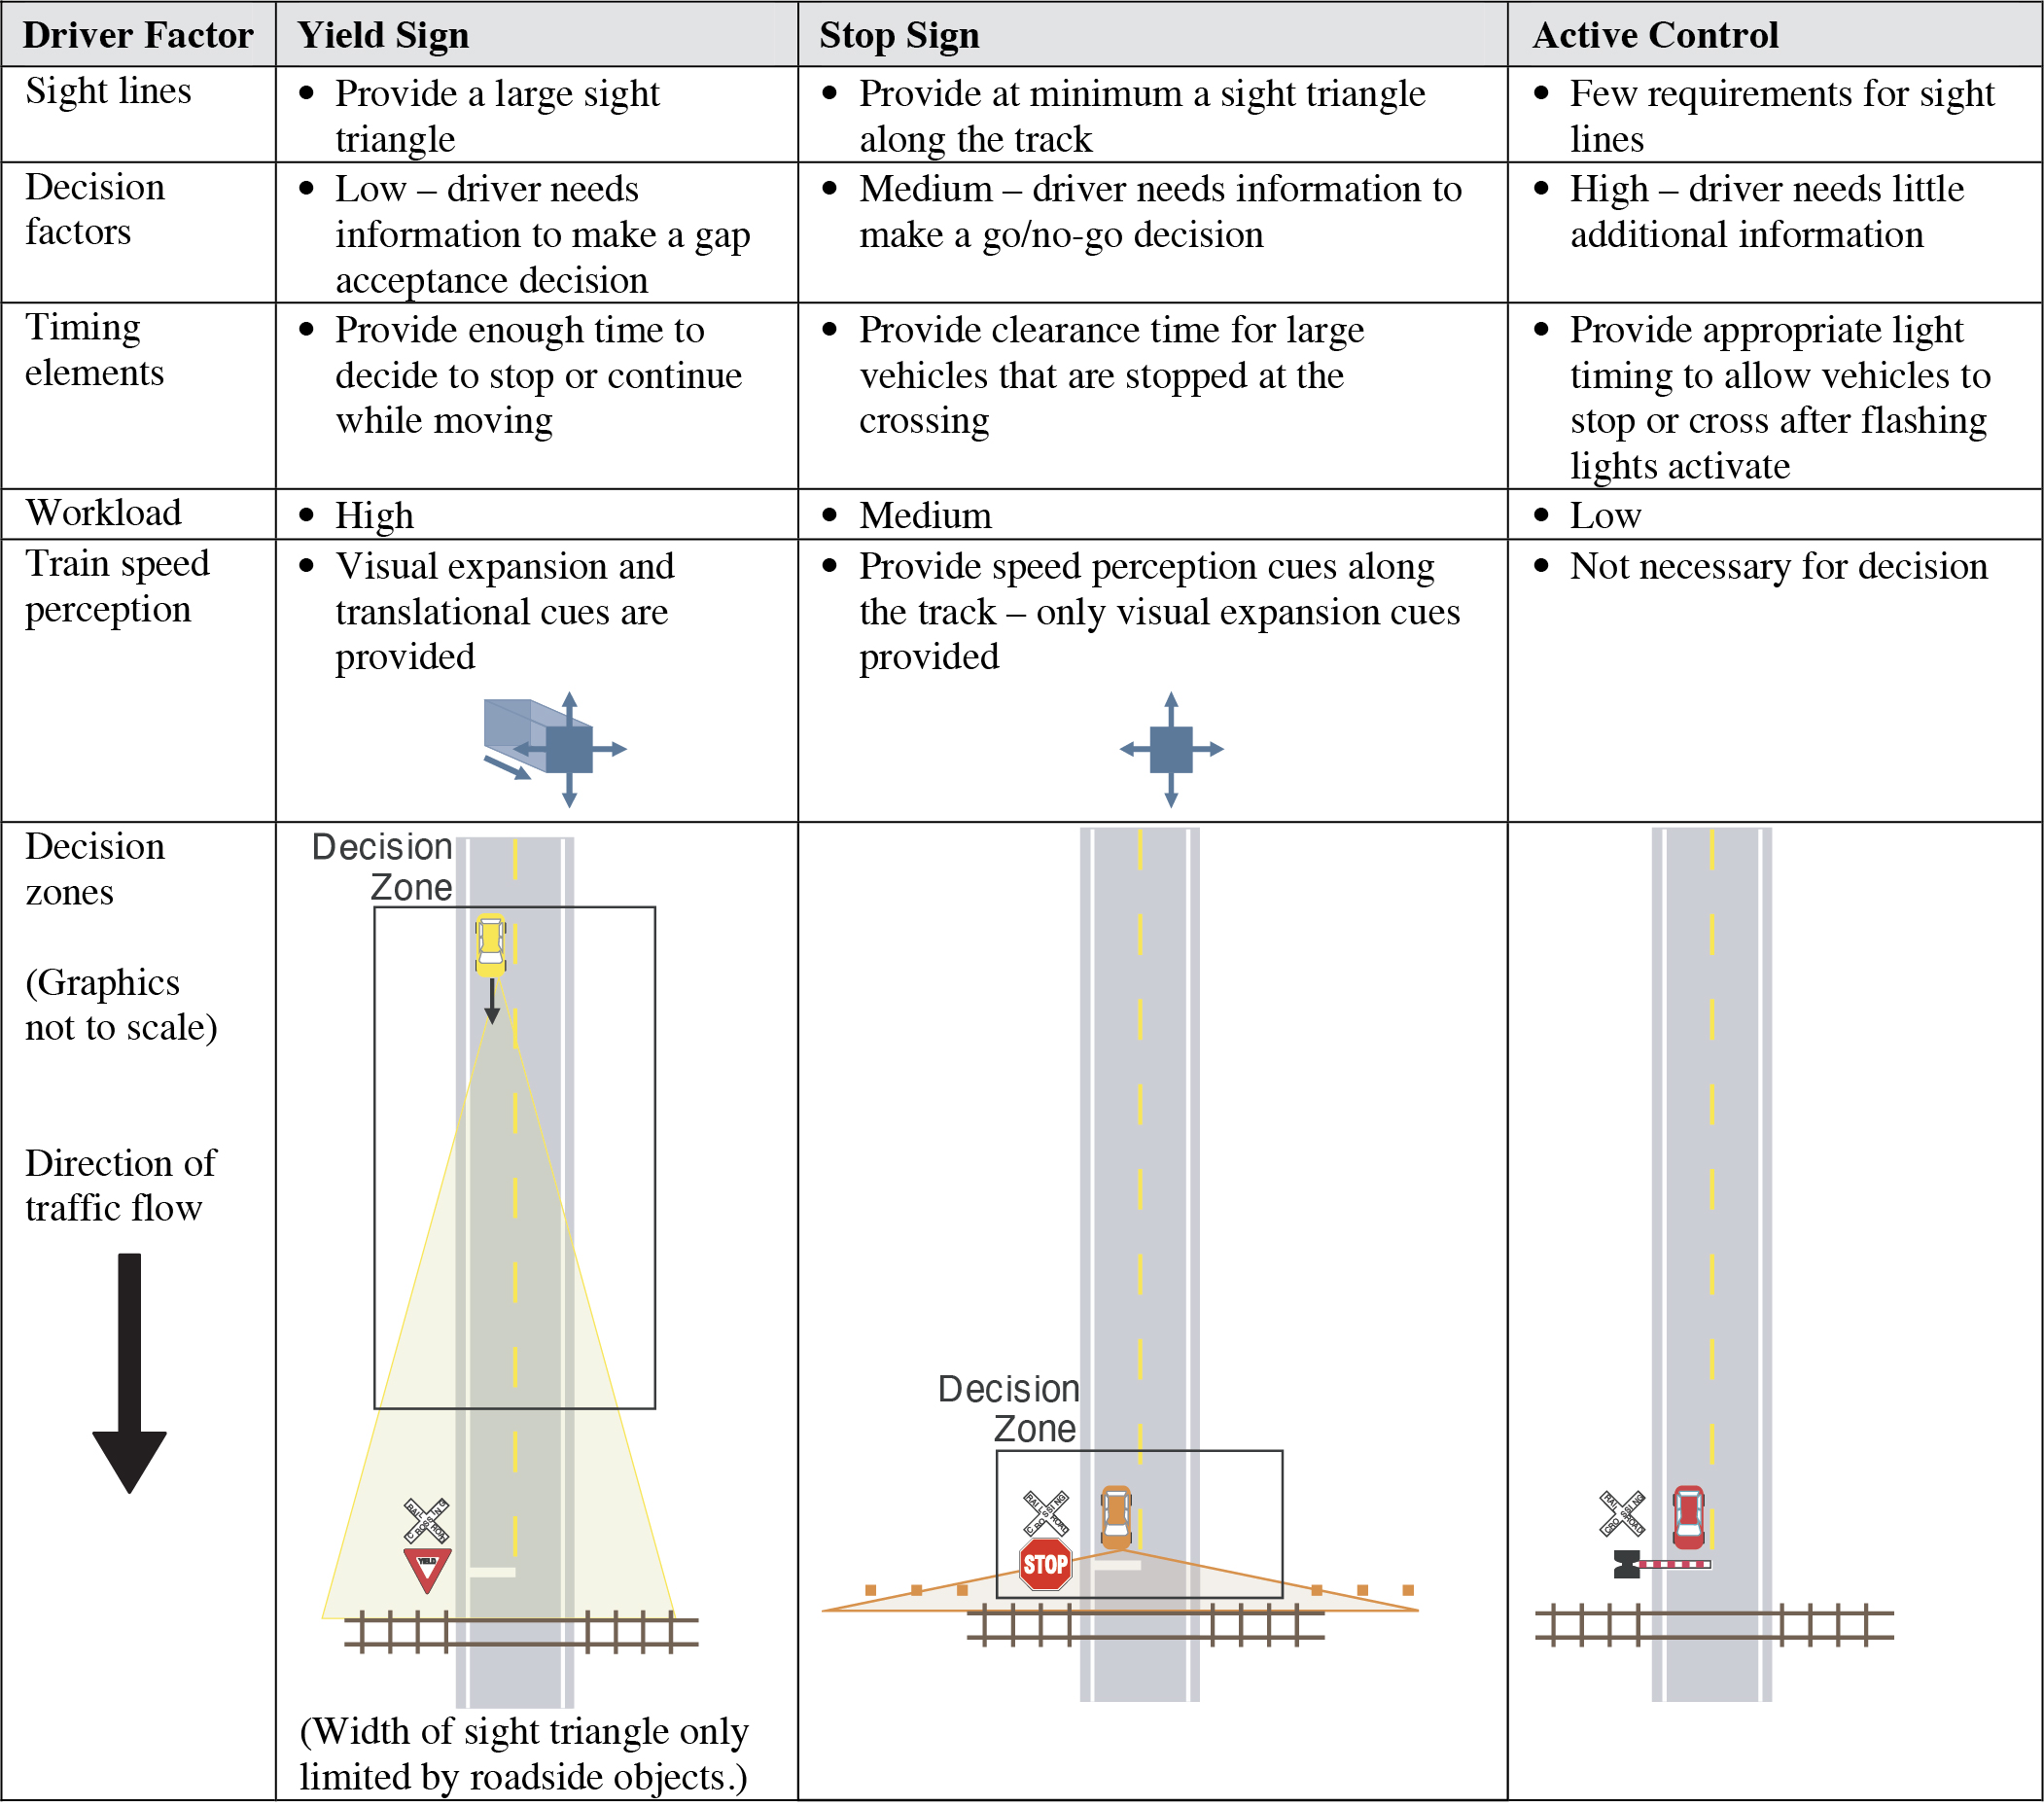
This guideline discusses the human factors that apply to three different levels of control at rail-highway grade crossings: Yield signs, Stop signs, and automatic gates. The MUTCD (1) states that a Yield or Stop sign should be part of the crossbuck assembly. The Yield sign is the default choice (1). Interest in the use of Yield signs at passive crossings is increasing. Also, under certain conditions, the use of active control devices may be the most suitable solution. The following factors can be used when determining the appropriate level of control.

Discussion
Compliance issues are not addressed in this discussion since they are covered in “Task Analysis of Rail-Highway Grade Crossings” on page 19-2 as well as the design considerations section below. Exact guidance regarding when to install each control device can be found in the Highway/Rail Grade Crossing Technical Working Group document (2) and the MUTCD (1).
Yield sign. The Yield sign provides the lowest level of control discussed in this guideline. The MUTCD standard states that a Yield sign should be the minimum additional level of control at passive grade crossings with crossbucks. The amount of information provided by a Yield sign is minimal since the location of the train (if present) and the appropriate driver action are not provided. As drivers are approaching the crossing, the decision they need to make is similar to a gap acceptance decision; they need to judge the gap between their vehicle and the train (if present) to determine if yielding is required. To make this judgment, a large clear zone is necessary in the approach area to enable drivers to see the train from a distance that allows them to stop or proceed. However, this means that drivers will have better speed perception cues than they do at Stop signs, since they observe the train from a greater distance from the crossing. They receive not only the visual expansion cues, but also translational cues from the trainsʼ forward motion. Because a stop is not required at Yield signs, all of the decision-making occurs farther before the crossing than it does for the Stop sign. Additionally, drivers have greater latitude in their decision-making than they do at crossings with a greater level of control. This puts a demand on drivers to judge their speed relative to a moving train and decide the safe action.
Stop sign. The Stop sign provides an intermediate level of control between the Yield sign and active gates. The sign requires drivers to stop and then to make a go/no-go decision based upon the presence of a train. Since drivers are making the go/no-go decision while stopped at the tracks (at a later point than they do for the Yield sign), the demands for sight lines are less significant and occur along the track. However, while looking almost straight down the tracks, drivers have poor speed perception of the oncoming train. Additionally, from the stopped position, larger vehicles take longer to accelerate over the tracks, and so they require more time to do so before the train arrives. This puts a demand on the sight distance of the train to give drivers time to make a go decision and then cross the tracks.
Active gates. Active traffic control devices with gates provide a high level of control, thus removing most of the decision-making demands from drivers. Drivers have few requirements in the way of sight lines because they know if a train is approaching by the status of the device. Train speed perception cues are not necessary since the active device warns that a train is approaching. In terms of vehicle kinematics, the timing of the gate should give drivers enough time to stop or proceed as appropriate before the gate descends. A related device is flashing lights without gates. This device also removes most of the decision-making demands from the driver but does not provide a physical barrier between the vehicle and the crossing.
Design Considerations
Compliance and other internal factors can largely affect driver decision-making at traffic control devices in various ways. At Yield signs, low train expectancy and/or high familiarity with the crossing can lessen the degree of visual search performed on the approach. At Stop signs, low train expectancy and/or high familiarity can push for a “go” decision or decrease stopping occurrences. Additionally, Sanders et al. (3) state that the driver should be able to perceive that a stop is necessary, and enforcement should equal that of a Stop sign at a highway intersection. If a Stop sign is present, the driver should not be able to detect a train without stopping at the sign. For active control devices, low credibility or reliability, as discussed in “Task Analysis of Rail-Highway Grade Crossings” on page 19-2, can contribute to gate-rushing.
Cross References
Task Analysis of Rail-Highway Grade Crossings
Timing of Active Traffic Control Devices at Rail-Highway Grade Crossings
Four-Quadrant Gate Timing at Rail-Highway Grade Crossings
Key References
1. FHWA. (2023). Manual on Uniform Traffic Control Devices for Streets and Highways. (11th ed.) Washington, DC.
2. Highway/Rail Grade Crossing Technical Working Group (TWG). (2002). Guidance on Traffic Control Devices at Highway-Rail Grade Crossings. FHWA. Retrieved July 2011 from http://safety.fhwa.dot.gov/xings/collision/.
3. Sanders, J. H., McGee, H. W., and Yoo, C. S. (1978). Safety Features of Stop Signs at Rail-Highway Grade Crossings. Volume II. Technical Report (FHWA-RD-78-41). Washington, DC: FHWA.
This page intentionally left blank.


