Human Factors Guidelines for Road Systems: Third Edition (2025)
Chapter: 13 Interchanges

CHAPTER 13
Interchanges
Task Analysis of Driver Merging Behavior at Freeway Entrance Ramps
Reducing Wrong-Way Entries onto Freeway Exit Ramps
Driver Expectations at Freeway Lane Drops and Lane Reductions
Driver Information Needs at Complex Interchanges
TASK ANALYSIS OF DRIVER MERGING BEHAVIOR AT FREEWAY ENTRANCE RAMPS
Introduction
Merging from an entrance ramp onto the freeway mainline can be a challenging task for drivers. For example, 36% of all ramp accidents on urban interstates in Northern Virginia occurred when drivers were entering the freeway (1). In addition, simulator data showed that, when merging, drivers move their hands to positions in which they can exert more vehicle control (2). Although this driving task can be broken up into a series of subtasks, the process is more dynamic than mechanistic: both mainline and merging drivers can detect the gaps available and decide to change their speed accordingly.
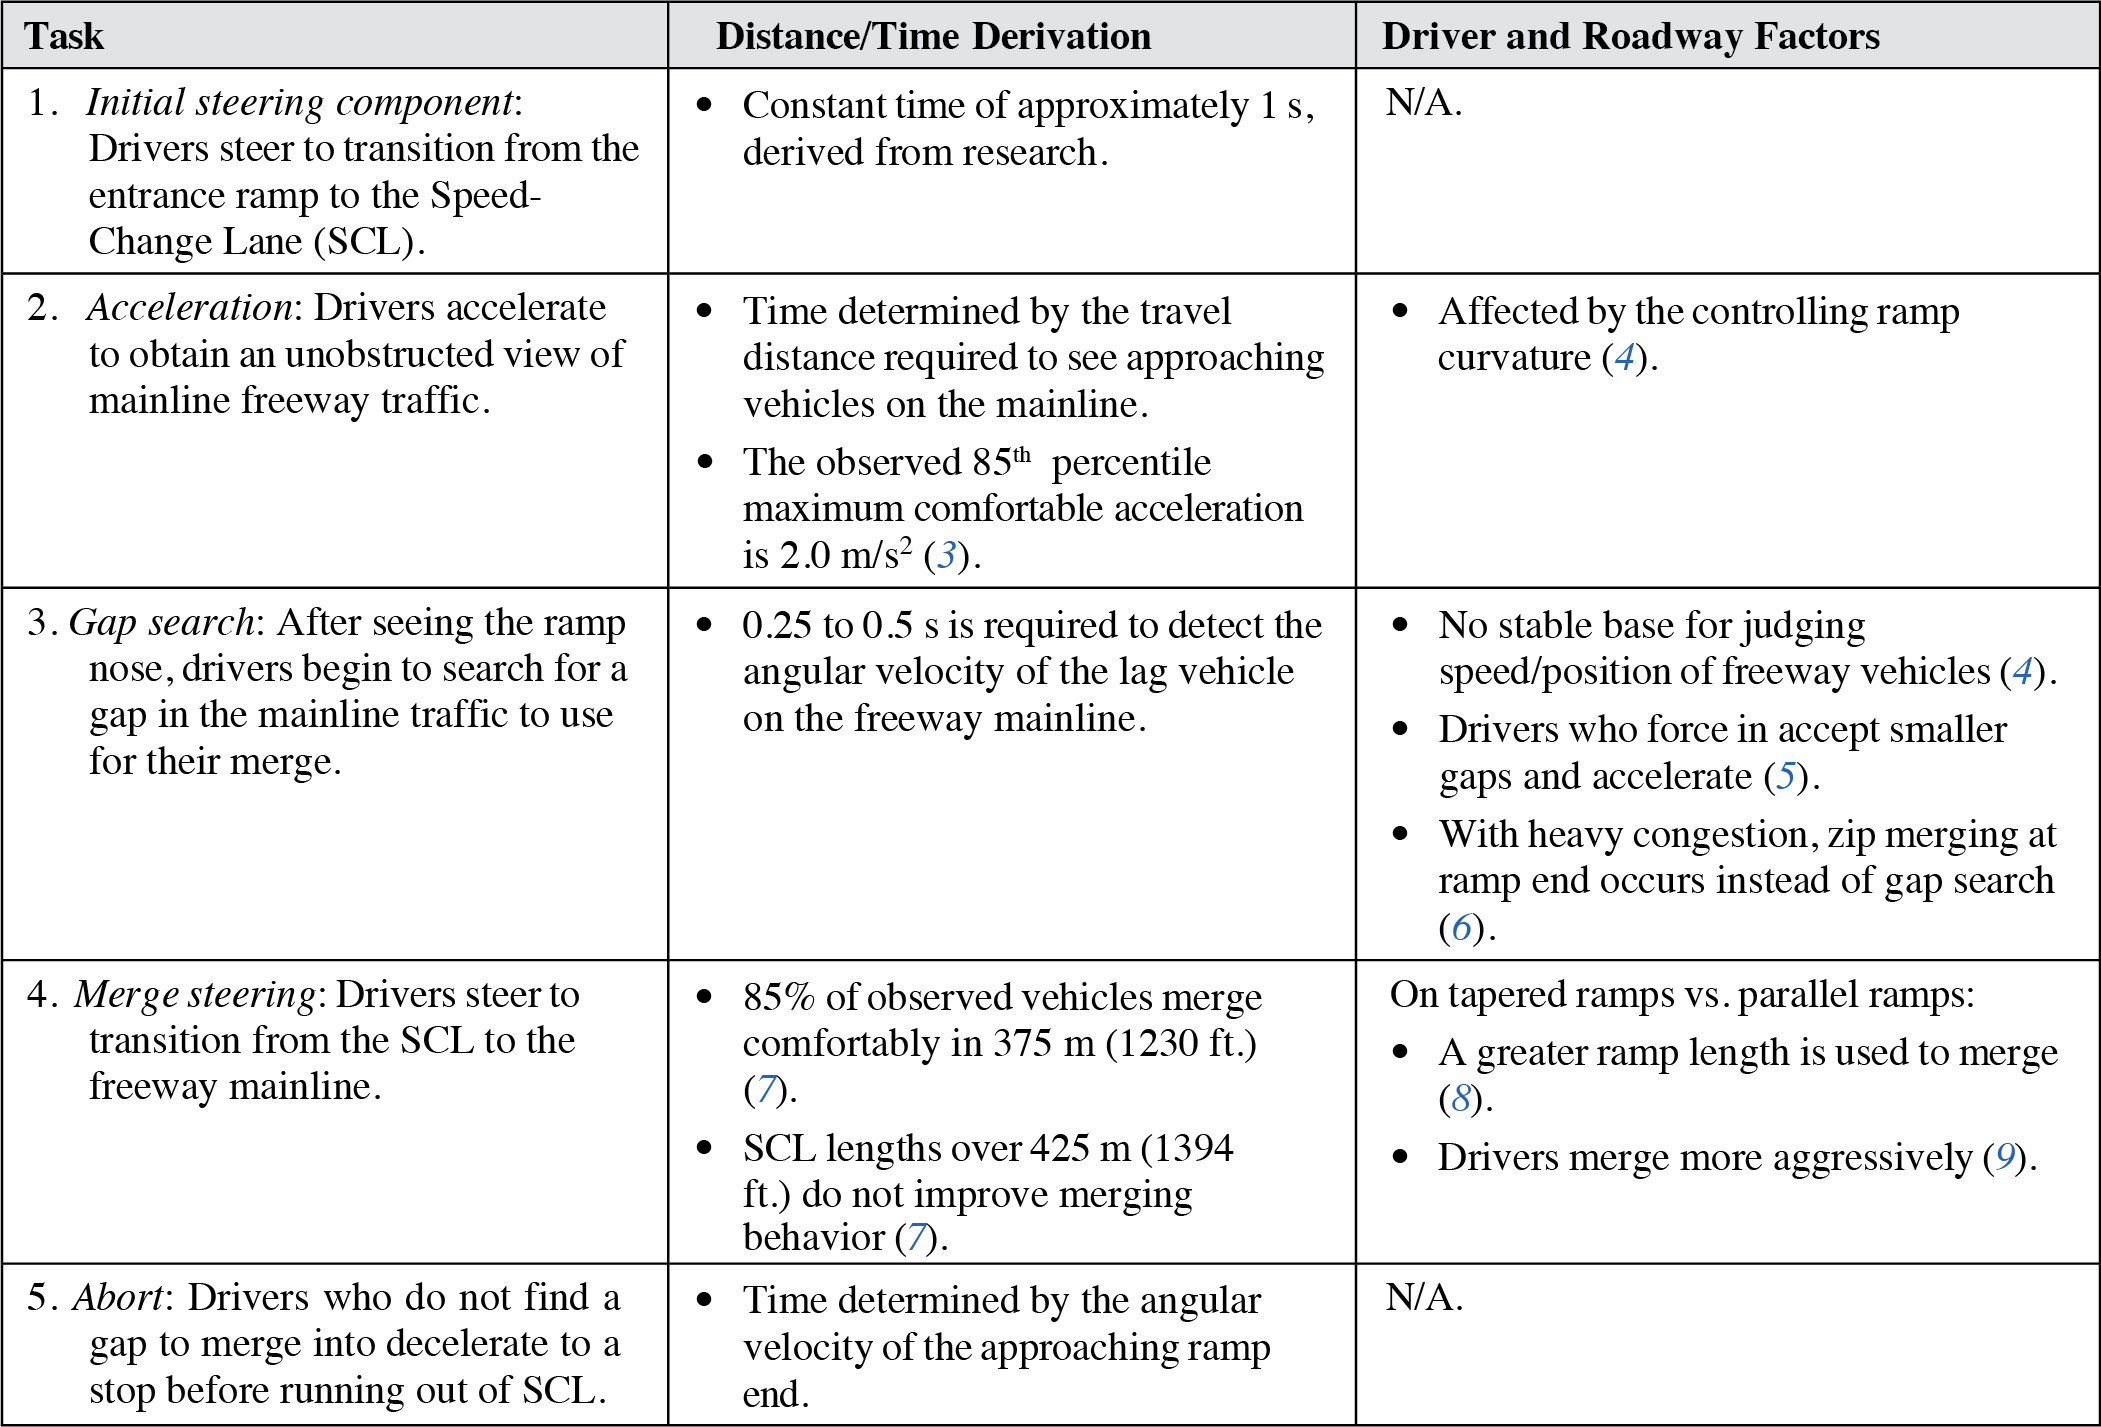

SUBTASK LOCATIONS
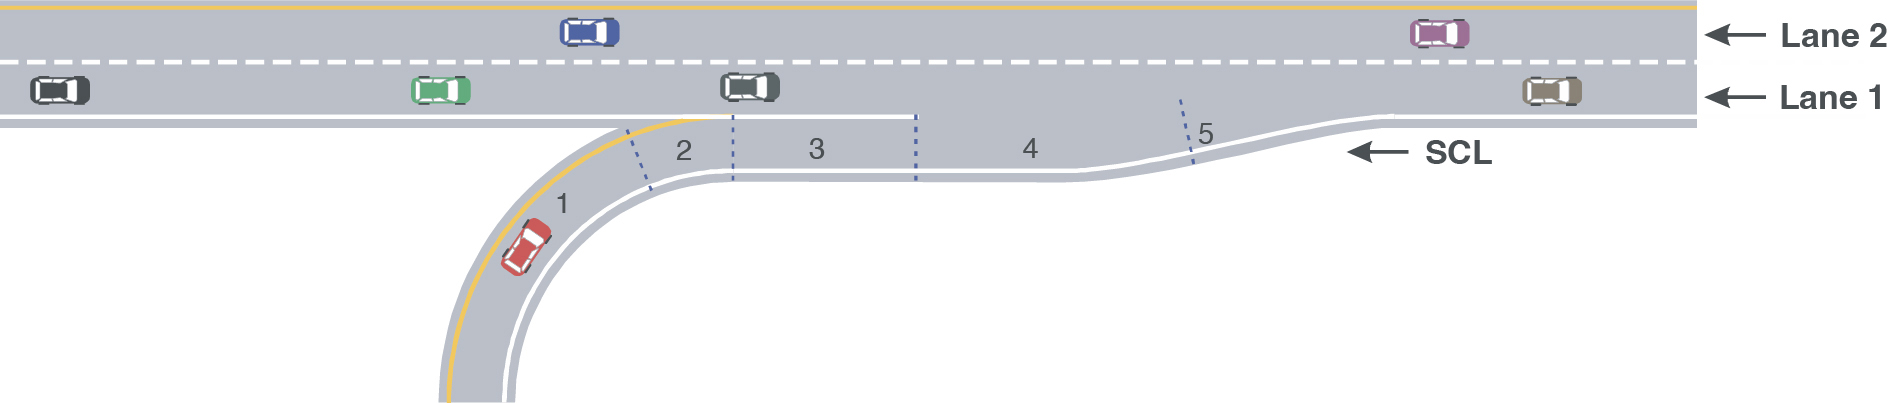
Source: Adapted from Ahammed et al. (3).
Discussion
Initial steering component. The initial steering component occurs when drivers transition from the entrance ramp onto the SCL. This steering time is approximately 1 s in length, derived from empirical research on steering (4).
Acceleration component. During the acceleration component, drivers accelerate to obtain a view of the mainline traffic on the freeway. This acceleration is controlled by the ramp curvature (4). Additionally, drivers cannot begin the next component, gap search, until they have an unobstructed view of the mainline traffic. Hunter and Machemehl (7) found that ramps with adequate sight distance and SCL lengths led to small acceleration levels, while ramps without adequate sight distance and SCL lengths caused larger positive and negative acceleration levels.
Gap search component. In general, drivers do not begin searching for a gap in the mainline traffic until they can see the nose of the entrance ramp (10). On cloverleaf ramps, drivers focus on navigating the curves until they are on a transition spiral to the straight portion of the lane (10).
Merge steering component. Two types of merges have been described in the literature. The first, a short merge, occurs when the driver merges before or near the end of the entrance ramp nose. This type of merge is likely to occur on ramps with poor geometry where drivers merge aggressively to avoid being trapped at the end of the lane (11). The second type, the long merge, occurs when the driver uses almost the entire length of the acceleration lane. This type of merge occurs when the geometry is good and traffic volumes are high (11). Sarvi et al. (6) suggest that when there is heavy congestion, gap search does not actually occur; instead, zip merging happens at the end of the ramp (i.e., where ramp and freeway vehicles merge one by one in an alternating pattern). There is some disagreement as to which geometric component has the greatest effect on gap acceptance: right lane volumes (11), ramp design (6), or gap distribution (4). Overall, Hunter and Machemehl (7) found that 85% of entering vehicles merged comfortably in 375 m (1230 ft.) as measured from the point where the ramp and mainline pavement edges are 1.25 m apart to the end of the taper. Limited-length SCLs over 425 m (1394 ft.) are not necessary to improve merging behavior.
Abort component. The abort maneuver only occurs if drivers do not find a suitable gap within the length of the SCL. Their focus changes from gap search to an avoidance maneuver and they decelerate to stop before the end of the SCL (4).
Design Considerations
Merging speeds of elderly drivers are lower than those of younger drivers when there are no cars in the mainline right lane. These speeds decreased further when there were cars on the through lane. Merge point distributions were similar for young and old drivers (12).
Cross References
Key Components of Sight Distance
Key References
1. McCartt, A. T., Northrup, V. S., and Retting, R. A. (2004). Types and characteristics of ramp-related motor vehicle crashes on urban interstate roadways in Northern Virginia. Journal of Safety Research, 35(1), 107–114.
2. De Waard, D., Dijksterhuis, C., and Brookhuis, K. A. (2009). Merging into heavy motorway traffic by young and elderly drivers. Accident Analysis and Prevention, 41(3), 588–597.
3. Ahammed, A. M., Hassan, Y., and Sayed, T. A. (2006). Effect of geometry of entrance terminals on freeway merging behavior. 85th Annual Meeting of the Transportation Research Board.
4. Michaels, R. M., and Fazio, J. (1989). Driver behavior model of merging. Transportation Research Record: Journal of the Transportation Research Board, 1213, 4–10.
5. Choudhury, C. F., Ramanujam, V., and Ben-Akiva, M. E. (2009). Modeling acceleration decisions for freeway merges. 88th Annual Meeting of the Transportation Research Board.
6. Sarvi, M., Ceder, A., and Kuwahara, M. (2002). Modeling of freeway ramp merging process observed during traffic congestion. Proceedings of the 15th International Symposium on Transportation and Traffic Theory, pp. 483–502.
7. Hunter, M., and Machemehl, R. (1999). Reevaluation of Ramp Design Speed Criteria: Review of Practice and Data Collection Plan (FHWA/TX-98/17321-1). Austin, TX: Center for Transportation Research.
8. Fukutome, I., and Moskowitz, K. (1960). Highway Research Board Bulletin 235: Traffic Behavior and On-Ramp Design, HRB, National Research Council, Washington, DC.
9. Kondyli, A., and Elefteriadou, L. (2009). Driver behavior at freeway-ramp merging areas: Focus group findings. 88th Annual Meeting of the Transportation Research Board.
10. Bhise, V. D. (1973). Visual search by drivers in freeway merging: Implications for vehicle design. Proceedings of the Human Factors Society Annual Meeting, 17(1), 152–161.
11. Hunter, M., Machemehl, R., and Tsyganov, A. (2001). Operational evaluation of freeway ramp design. Transportation Research Record: Journal of the Transportation Research Board, 1751, 90–100.
12. Kimura, K., and Shimizu, K. (1998). Driving behavior of the elderly at merging sections. Proceedings of the 8th International Conference on Transport and Mobility for Elderly and Disabled People, 109–117.
REDUCING WRONG-WAY ENTRIES ONTO FREEWAY EXIT RAMPS
Introduction
Reducing wrong-way entries onto freeway exit ramps refers to treatments that can be used to reduce the frequency of drivers entering freeways by using the exit ramps. An average of 350 fatalities occur each year in the United States as a result of wrong-way crashes on freeways (1). Furthermore, exit ramps were found to be the most frequent origin of wrong-way incidents. In the sample of wrong-way drivers, elderly drivers are overrepresented by experiencing twice the wrong-way crashes than would be expected. Crashes often occur in the early morning hours, although this may be linked with the high frequency of impaired drivers.

GEOMETRIES TO DISCOURAGE WRONG-WAY ENTRY
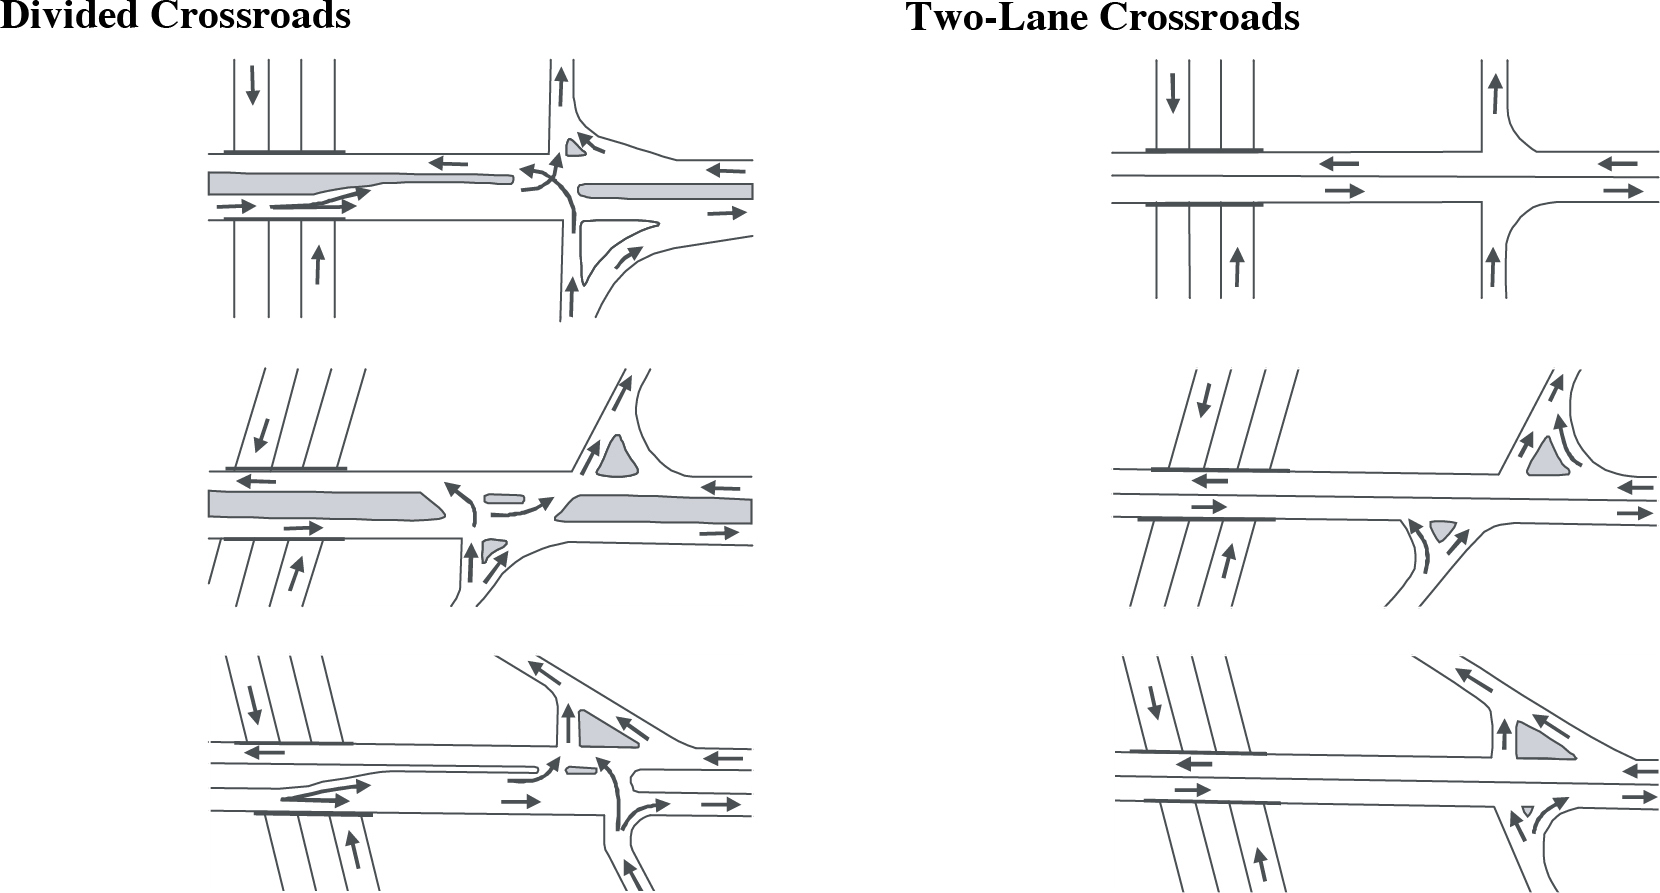
Source: AASHTO (5).
Long Description.
The illustrations show a road with two exits on opposite sides. The first three illustrations show divided crossroads and the remaining three illustrations show two-lane crossroads. Arrows indicate the direction of movement of the vehicles.
Discussion
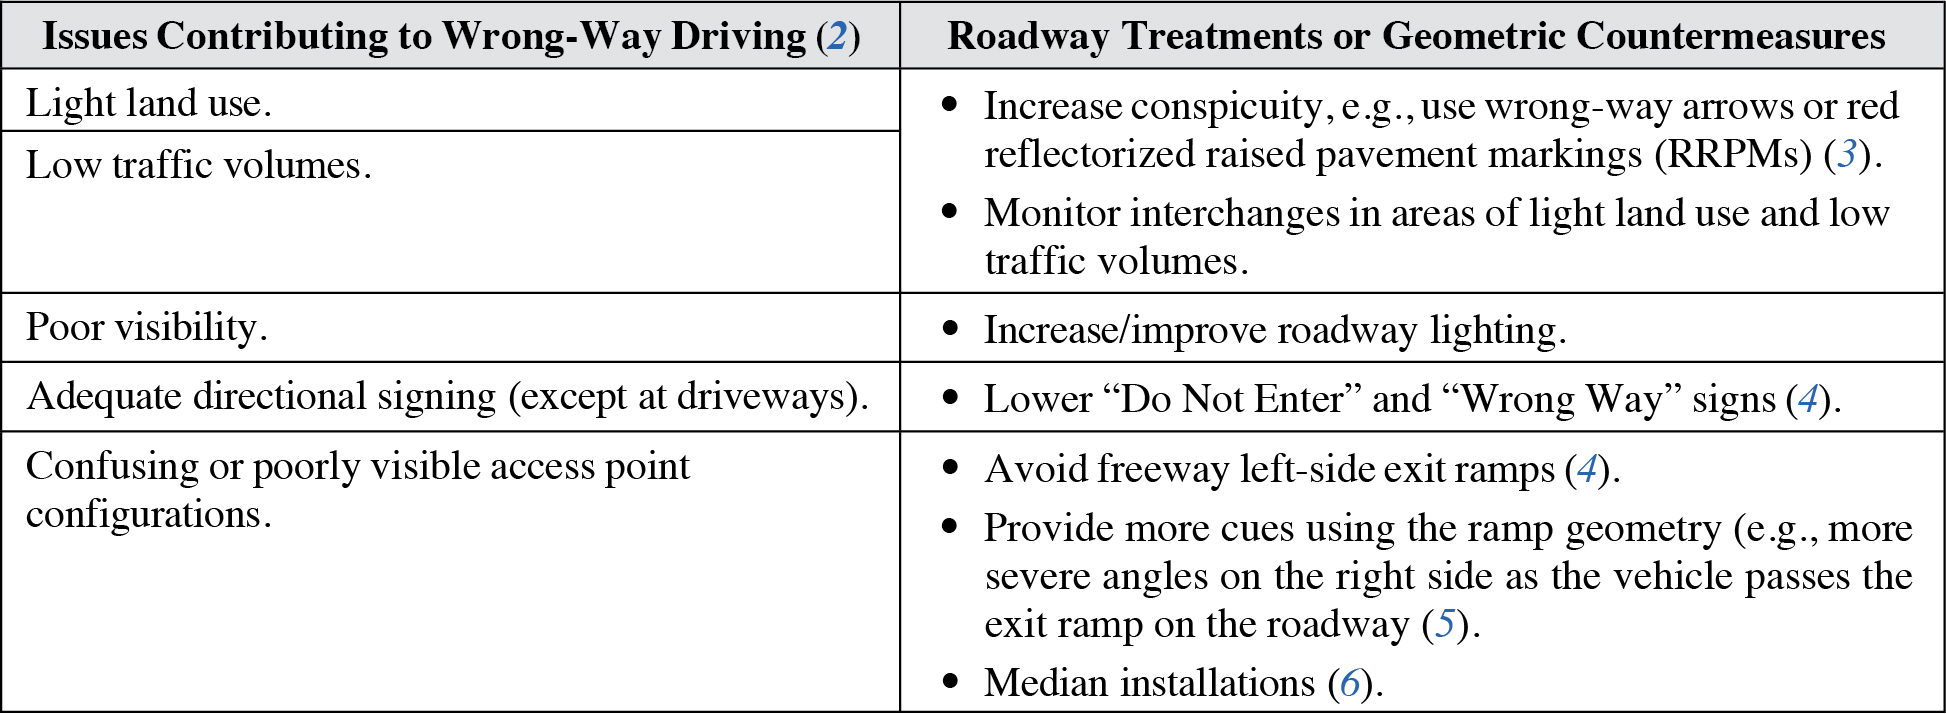
All the characteristics listed in the guideline on the previous page correspond to missing cues that can help drivers determine that they have started down the roadway, particularly an exit ramp, in the wrong direction.
Light land use and low traffic volumes. Wrong-way driving crashes tend to occur in areas with light land use and low levels of traffic. Both situations likely indicate occasions when few cars would be traveling in the opposing direction to signal to drivers that they are going to be traveling the wrong way. In these cases, drivers need another indication that they have started traveling in the wrong direction. In a laboratory study of straight multilane roads, Miles et al. (3) found that the addition of directional arrows or red RRPMs led to more correct identifications of the proper travel direction on a roadway, though the effects were moderate.
Poor visibility. Wrong-way movements tend to occur when visibility is poor (2). In a study of wrong-way crashes, 74% were found to occur during the dark hours of the day. An obvious potential solution is to increase the level of artificial lighting at the access points. An increase in lighting levels would make some of the cues that are available to drivers more apparent at nighttime.
Directional signing. Scifres and Loutzenheiser (2) found that in most cases, the signing at most of the origins was consistent with driversʼ needs (except for driveways). However, signing improvements have been suggested by Cooner, Cothron, and Ranft (4). Notably, they refer to a lower mounting of “Do Not Enter” and “Wrong Way” signs, shown to be effective in the state of California. The lower height avoids sight restrictions, is in the range of low-beam headlights for night driving, and is potentially more visible to impaired drivers who drive with their eyes on the pavement. The bottom of the sign package is installed 2 ft above the edge of the pavement (though this is inconsistent with the MUTCD).
Confusing or poorly visible access point configurations. Wrong-way movements were increased when the design of the access point was difficult to see or understand (2). The simplicity of the access points can be improved in multiple ways. The first is to avoid the construction of left-side exit ramps and install reflectorized wrong-way pavement arrows on existing left-side ramps (4). During a crash analysis, left-side exits experienced multiple crashes due to wrong-way entries. Drivers are familiar with turning right to enter a freeway and may end up traveling the wrong way up a left exit ramp by using this maneuver. Additionally, AASHTO (5) recommends sharp or angular intersections between the crossroad and the ramp, making the incorrect maneuver less natural to execute. Median islands can also make incorrect turning movements more difficult. The diagrams on the previous page provide sample road geometrics that discourage wrong-way entry.
Design Considerations
Drivers who are under the influence of alcohol and/or other drugs compose a considerable portion of wrong-way drivers. Although these drivers cannot specifically be designed for, countermeasures that reduce the affordance of driving the wrong way (such as geometric alterations) may be more effective than those that require the drivers to function at a certain level (such as signage or pavement markings). These trade-offs can be considered in areas near bars or other locations where drunk drivers may be more prevalent.
Short sight distance along the exit ramp has been found to be a contributor to wrong-way crashes (7). Improving sight distance may decrease the number of drivers driving the wrong way by increasing the odds that they will see an approaching right-way driverʼs headlamps. However, improving sight distance is more of a crash avoidance measure for right-way drivers who will see wrong-way drivers approaching from a greater distance.
Cross References
Key References
1. Cooner, S. A., and Ranft, S. E. (2008). Wrong-way driving on freeways: Problems, issues, and countermeasures. 87th Annual Meeting of the Transportation Research Board.
2. Scifres, P. N., and Loutzenheiser, R. C. (1975). Wrong-Way Movements on Divided Highways. (JHRP-13-75). West Lafayette, IN: Purdue University.
3. Miles, J. D., Carlson, P. J., Ullman, B. R., and Trout, N. D. (2008). Red retroreflective raised pavement markings: Driver understanding of their purpose. Transportation Research Record: Journal of the Transportation Research Board, 2056, 34–42.
4. Cooner, S. A., Cothron, A. S., and Ranft, S. E. (2004). Countermeasures for Wrong-Way Movement on Freeways: Guidelines and Recommended Practices. (FHWA/TX-04/4128-2). College Station: Texas Transportation Institute.
5. AASHTO. (2018). A Policy on Geometric Design of Highways and Streets (7th ed.). Washington, DC.
6. Moler, S. (2002). Stop. Youʼre going the wrong way! Public Roads, 66(2), 24–29.
7. Rinde, E. A. (1978). Off-Ramp Surveillance. (FHWA-RD-79-T0334; 623124). Sacramento: California Department of Transportation.
DRIVER EXPECTATIONS AT FREEWAY LANE DROPS AND LANE REDUCTIONS
Introduction
Matching driver expectations at freeway lane drops is important because lane drops represent a situation that may violate driver expectations and cause confusion when the driver expects the lane to continue on the freeway mainline. This confusion can result in high-speed variability, erratic maneuvers, and driver frustration (1). Additionally, a left lane drop situation violates multiple driver expectations and can cause more problems. All of these results have negative safety implications; thus, the more accurately that lane drops conform to driver expectations, the safer the situation will be. This guideline refers specifically to lane drops on freeway sections that do not include exit ramps.

Discussion
It should be noted that the lane drop guidance provided by Goodwin (2) is not specific to exit-lane drops as they are commonly referred to today. This guidance was also formulated based on the study of lane reductions on freeways.
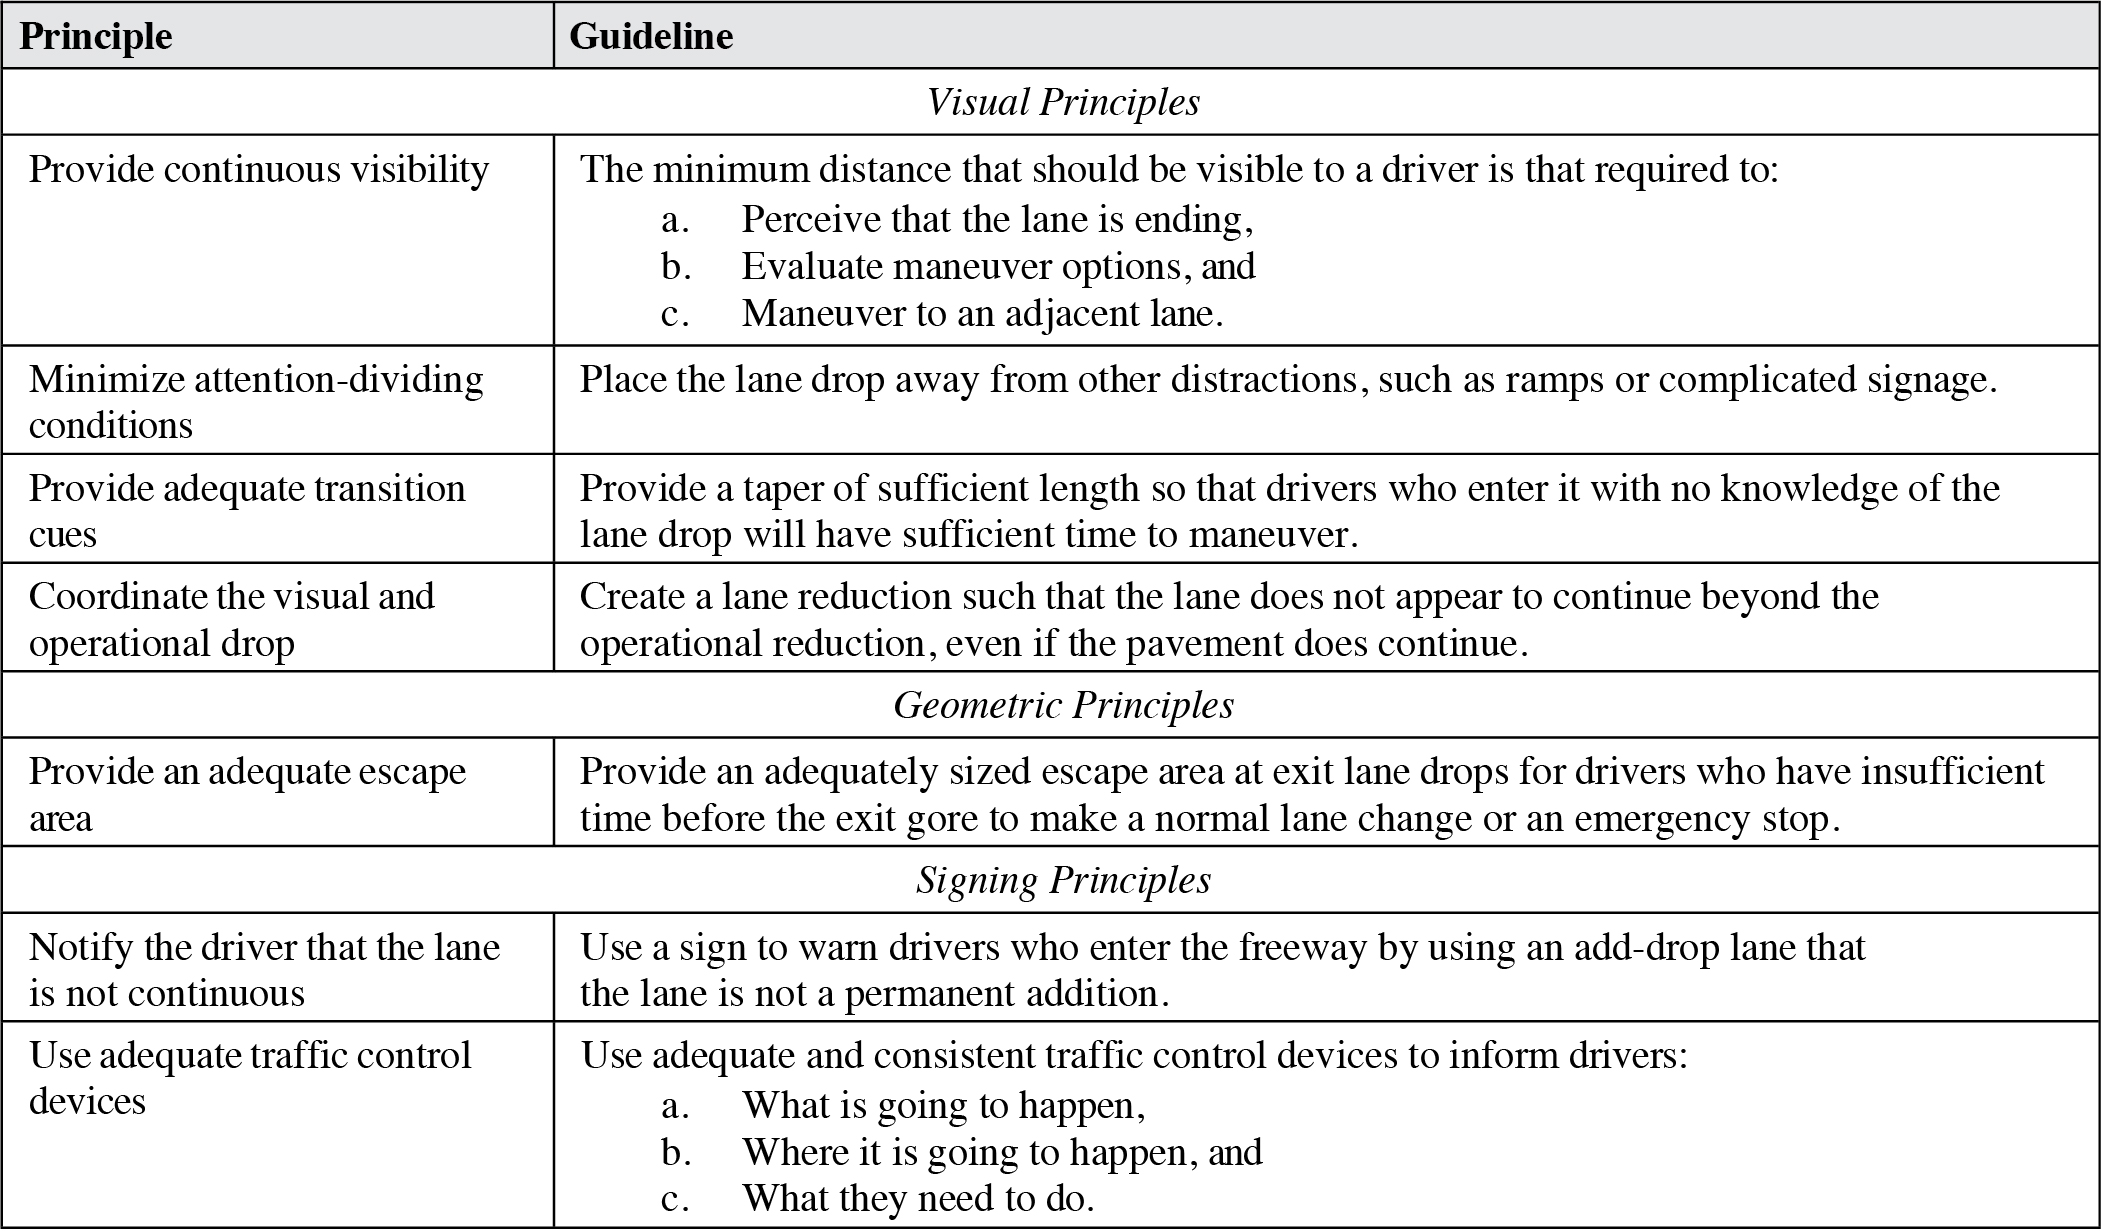
Visual principles. Lane drops should be located where drivers can see them continuously for a long enough period of time to perceive that the lane is about to end, decide on a maneuver, and execute that maneuver. Thus, lane drops should not be located just over the crest of a vertical curve or around a horizontal curve (2). Lane drops should be located away from other conditions that require the driverʼs attention, as these locations increase the probability of drivers missing lane drop cues while looking at other roadway features. A major visual cue for navigating lane drops is the lane drop taper. An inappropriately short taper may cause drastic lane changes, while an overly long taper does not provide cues that the lane is ending. From the driverʼs viewpoint, operational and physical lane reductions should be coordinated. So, if the pavement continues beyond the operational lane drop, it should be apparent that the lane does not continue onto that pavement.
Geometric principles. Cornette (4) found that lane drops, lane splits, and lane reductions at sites with poor geometrics (e.g., high rates of curvature, sight distance restrictions) had higher conflict rates than those at sites with better geometric features. Drivers who do not expect the lane drop should have a reasonable opportunity to recover and stay on their route. An adequate escape area should be provided at/after an exit-lane drop to provide drivers who do not want to exit a chance to recover and remain on the mainline (2).
Signing principles. A subset of the drivers who encounter a lane drop may have just entered the freeway. If drivers are able to enter using an add-drop lane, they should be warned that their lane is not continuous for through travel (2). For all drivers, adequate and consistent information should be provided by the traffic control devices. It is important for drivers to know if they are required to take an action or if other drivers are required to act. Additionally, excess information not related to the lane drop segment should be minimized (2).
Lane drop exits with option lanes provide particularly difficult circumstances for unfamiliar drivers. It is often unclear to drivers that the option lane serves both the mainline and the exit destinations. The underutilization of the option lane can lead to a loss of service volume for the roadway as well as a number of unnecessary merge maneuvers.
Design Considerations
On roadways near the U.S.–Mexico border that are used by a large percentage of Spanish-speaking drivers, additional signage with Spanish legends may be appropriate. To convey the message “Right Lane Ends,” the sign that had the highest overall comprehension level among Spanish-speaking drivers was “Carril Derecho Termina” (5). This sign also had the highest comprehension levels among English-speaking drivers among the three Spanish-legend signs that were tested.
Dynamic late-merge systems have been developed for use in work zone lane closure situations. These systems utilize a series of changeable message signs and static work zone signs to provide merge information to the driver based upon the current traffic volume through the work zone. The basic principle supports early merging when the traffic flow is light and late merging (closer to the gore point) when the traffic volume is heavier.
Cross References
Effectiveness of Symbolic Markings
Key References
1. Chrysler, S. T., Williams, A. A., Funkhouser, D. S., Holick, A. J., and Brewer, M. A. (2007). Driver Comprehension of Diagrammatic Freeway Guide Signs. College Station: Texas Transportation Institute.
2. Goodwin, D. N. (1975). Operational effects of geometric design at freeway lane drops (abridgment). Transportation Research Record: Journal of the Transportation Research Board, 541, 26–30.
3. Upchurch, J., Fisher, D. L., and Waraich, B. (2005). Guide signing for two-lane exits with an option lane. Transportation Research Record: Journal of the Transportation Research Board, 1918, 35–45.
4. Cornette, D. L. (1972). Operational Characteristics of Lane Drops. (KYHPR-70-63, HPR-1(18), Part II). Lexington: Kentucky Bureau of Highways.
5. Hawkins, H. G., Jr., Picha, D. L., Kreis, D. C., and Knodler, M. A. (1999). Evaluation of Alternative Traffic Signs for Use in Texas Border Areas. (FHWA/TX-99/1274-3). College Station: Texas Transportation Institute.
DRIVER INFORMATION NEEDS AT COMPLEX INTERCHANGES
Introduction
Accommodating driver expectations at interchanges is paramount to navigational success. Expectations refer to “a driverʼs readiness to respond to situations, events, and information in predictable and successful ways” (1). Complex interchanges should be designed to give the drivers what they expect to see (2). Information that reinforces expectancies helps drivers respond faster, whereas information that violates expectancies leads to longer task times and/or errors (3). Thus, more predictable design and operation leads to fewer errors (4).

MAJOR WEAVE WITH LANE BALANCE AT EXIT GORE
Source: Transportation Research Board (7).
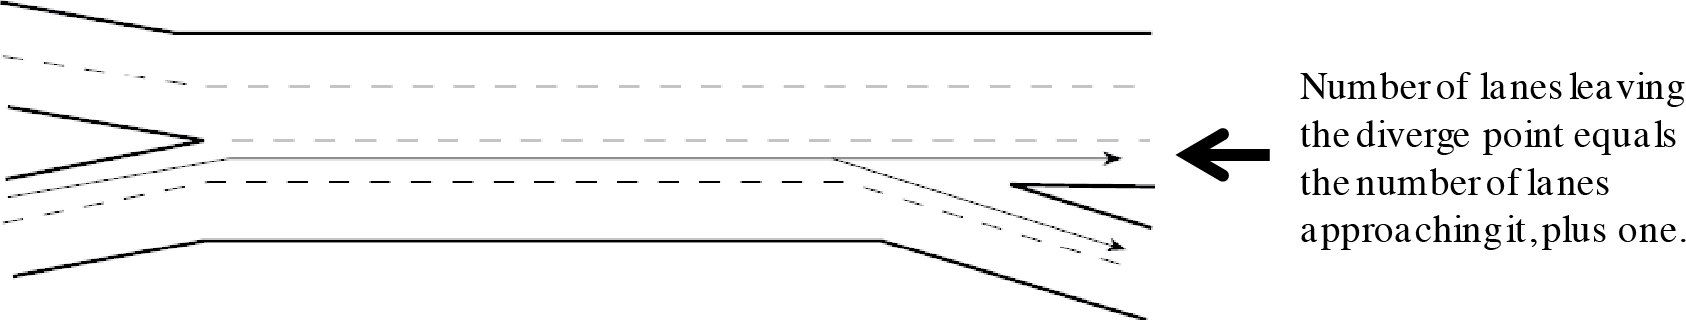
Long Description.
The text reads, 'The number of lanes leaving the diverging point equals the number of lanes approaching it plus one.'
Discussion
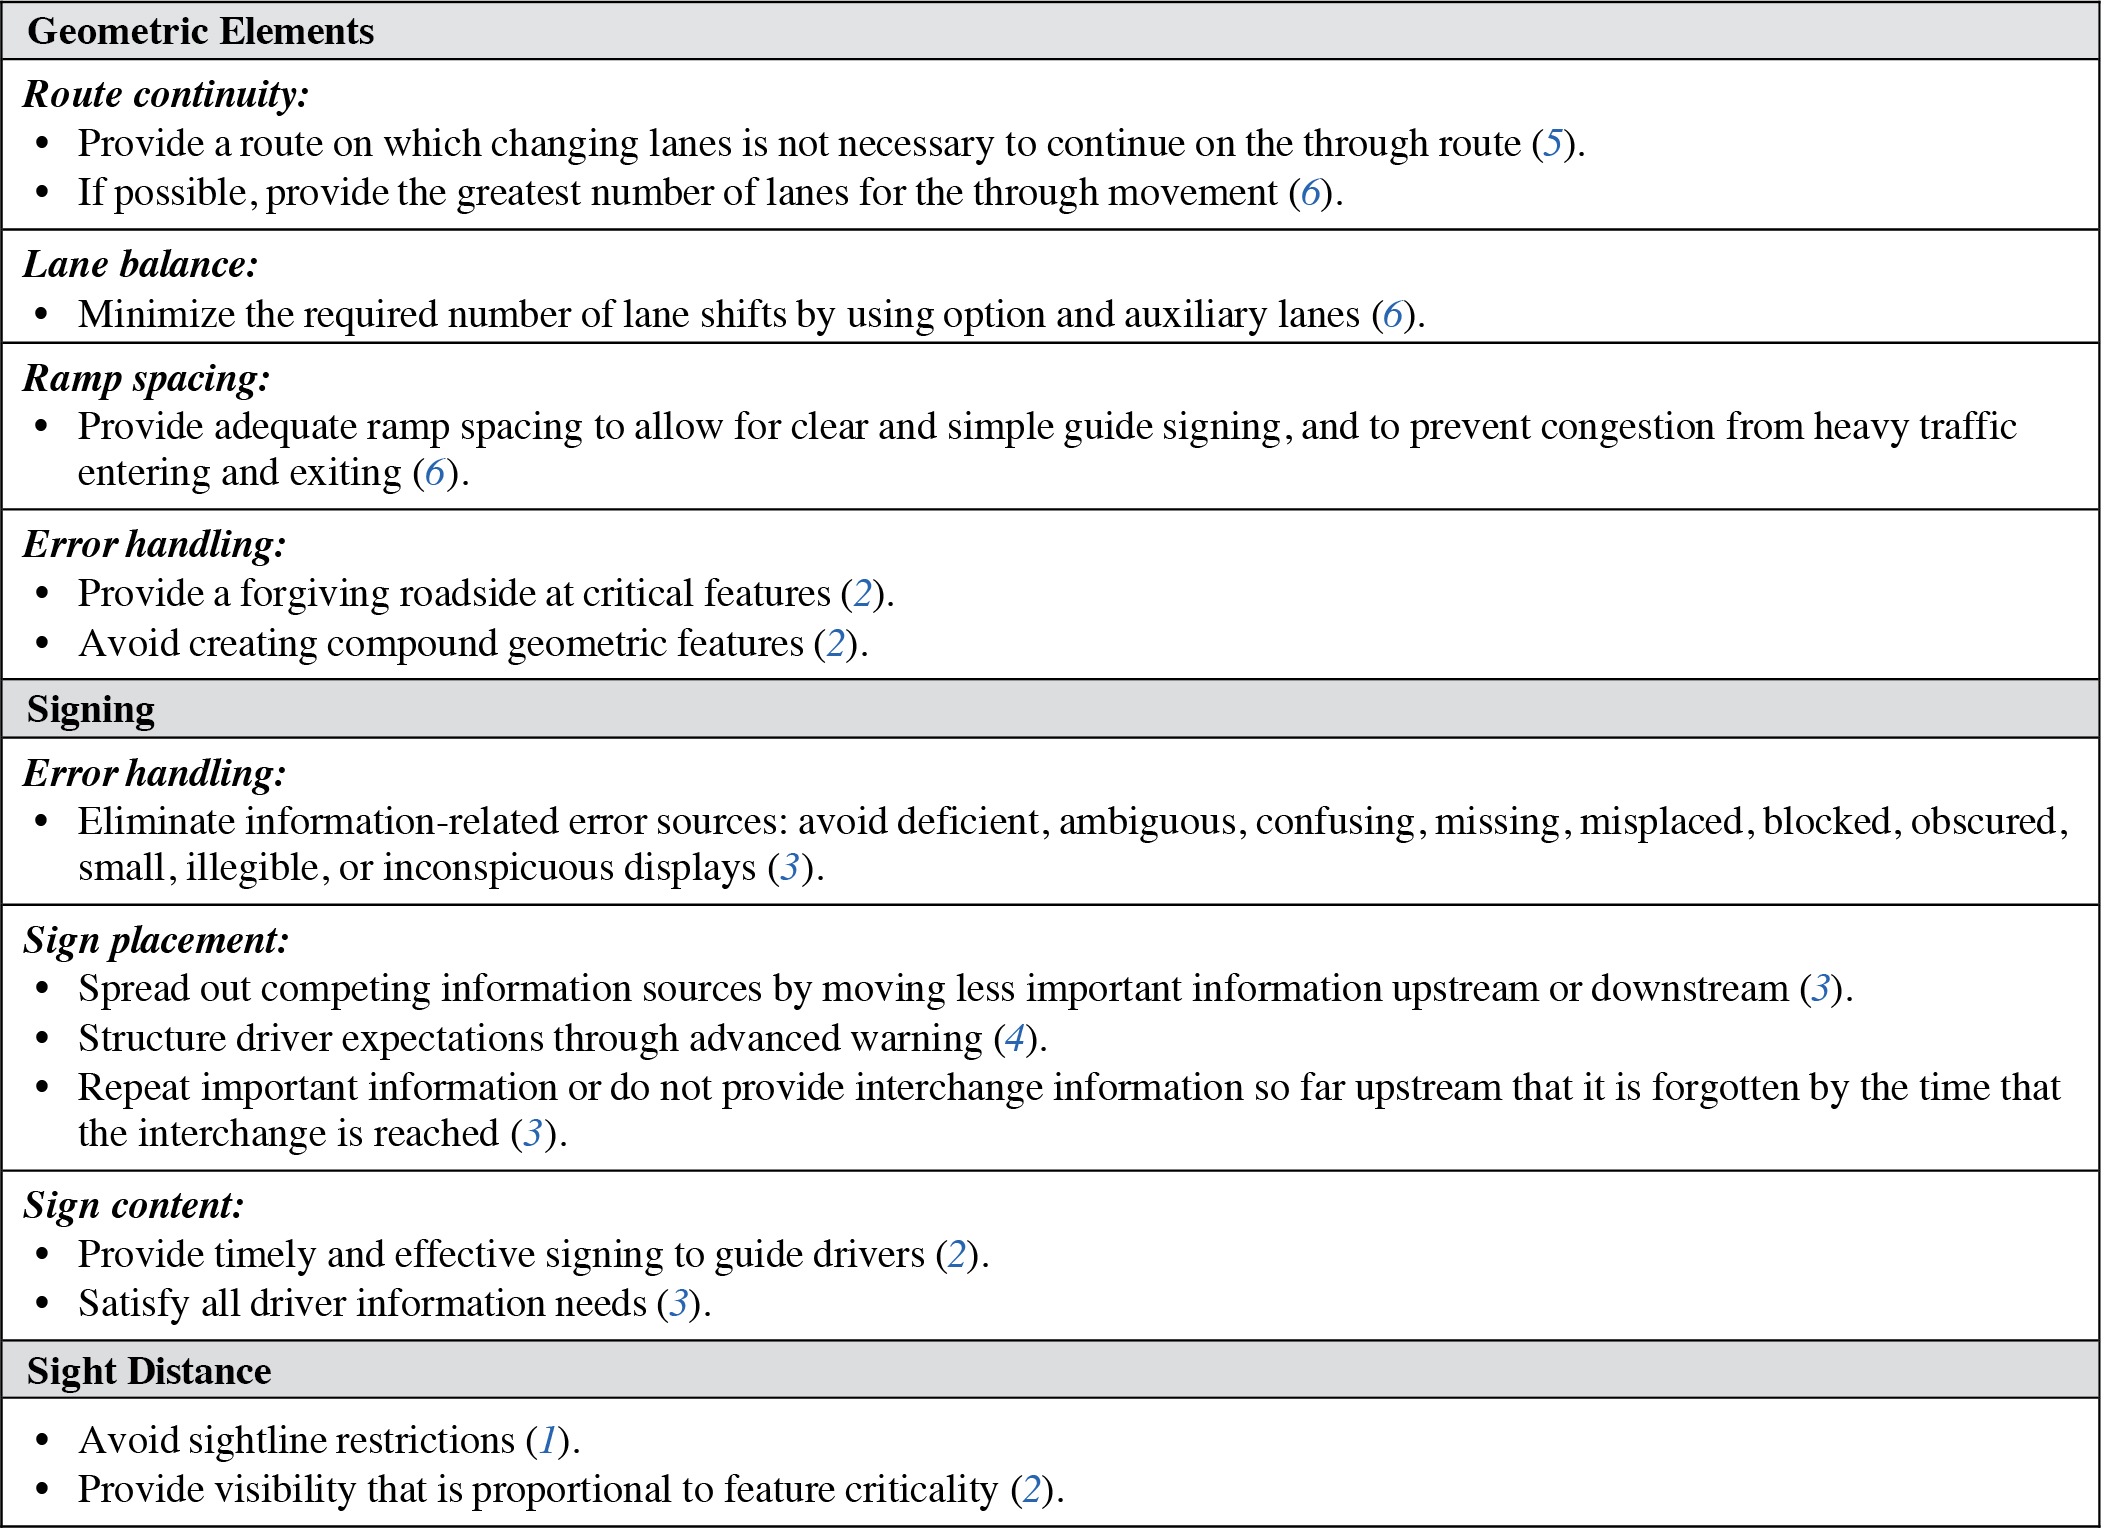
Overall, there is little information available in the research literature that provides specific guidance related to supporting driver expectations at interchanges. The information provided in the guideline on the previous page is generally related to principles of geometry, signage, and sight distance to support elements of driver expectations at interchanges.
Geometric elements. Doctor, Merritt, and Moler discuss driver expectations in reference to multiple elements of interchange design. Ramp spacing that is too close can lead to congestion and cluttered signage (6). The combination of system and service interchanges can lead to information overload, inconsistent sign design, and contradictory movements. Route continuity is provided by designing a roadway on which “changing lanes is not needed to continue on the through route” (5). This principle “reduces lane changes, simplifies signing, delineates the through route, and reduces the driverʼs search for directional signing” (5). Additionally, drivers sometimes assume that at a split, the leg with the greater number of lanes carries the main route. To use lane balance, designers arrange the lanes on the freeway to require drivers to take the minimum number of lane shifts. This is done by using option and auxiliary lanes.
Signing. Advance guide signing that prepares drivers to make decisions and maneuvers is possibly the most important strategy for helping drivers navigate complex interchanges (6). Signing can spread out the amount of time that drivers can use to perform lane changes in advance of the decision points. Additionally, signs at the decision point confirm decisions that drivers made on the approach (6). Lunenfeld stresses that the amount of information should not overwhelm the driver (3). When information sources compete, the less important sources should be moved upstream or downstream. However, information should not be provided so far upstream that it is forgotten by the time that the interchange is reached. If information is too far upstream, it may need to be repeated closer to the interchange.
Sight distance. Adequate sight distance is required due to the reliance on visual information and for complex decision-making (3). Sightline obstructions that cover up important or critical information cues should be avoided.
Design Considerations
In particular, driver expectations can be easily violated at transition sections where the roadway conditions change. Drivers anticipate the upcoming roadway characteristics based on features that are common to the road they are on (4). Roadway designers should look for possible expectancy violations where changes in roadway characteristics (e.g., geometrics, design, or operation) or changes in operating practices occur (e.g., speed zones, no passing zones, or signal timings; 1). Features that are “first of a kind” on a particular roadway or those that drivers may find unusual or special are also important to examine (1). Additionally, adequate transitions should be provided for clarity and effective decisions by drivers (2).
Cross References
Driver Expectations at Freeway Lane Drops and Lane Reductions
Key References
1. Lunenfeld, H., and Alexander, G. J. (1984). Human factors in highway design and operations. Journal of Transportation Engineering, 110(2), 149–158.
2. Messer, C. J., Mounce, J. M., and Brackett, R. Q. (1981). Highway Geometric Design Consistency Related to Driver Expectancy: Vol. I, Executive Summary. (FHWA/RD-81/035). Washington, DC: FHWA.
3. Lunenfeld, H. (1993). Human factors associated with interchange design features. Transportation Research Record: Journal of the Transportation Research Board, 1385, 84–89.
4. Cline, E. L. (1999). Adherence to design standards and guidelines: The human factor. Transportation Frontiers for the Next Millennium: 69th Annual Meeting of the Institute of Transportation Engineers.
5. AASHTO. (2011). A Policy on Geometric Design of Highways and Streets (6th ed.). Washington, DC.
6. Doctor, M., Merritt, G., and Moler, S. (2009). Designing complex interchanges. Public Roads, 73(3), 3–11.
7. Transportation Research Board of the National Academies. (2010). Highway Capacity Manual. Washington, DC.
ARROW-PER-LANE SIGN DESIGN TO SUPPORT DRIVER NAVIGATION
Introduction
Arrow-per-lane (APL) signs are composed of primarily two parts: arrows that point to individual lanes, and the destination information listed above the arrows. They generally either are large signs or occur in groups, because every individual lane requires its own arrow. These signs provide clear direction for the destinations reached by each lane and have been shown to increase the number of correct lane choices by older drivers as compared to standard diagrammatic signs (1). The signs shown in the guideline vary slightly from those recommended by the MUTCD (2), because they are modeled after real sign examples. Therefore, this guideline is focused on troubleshooting driver issues and potential uncertainty rather than informing new sign design.

Discussion
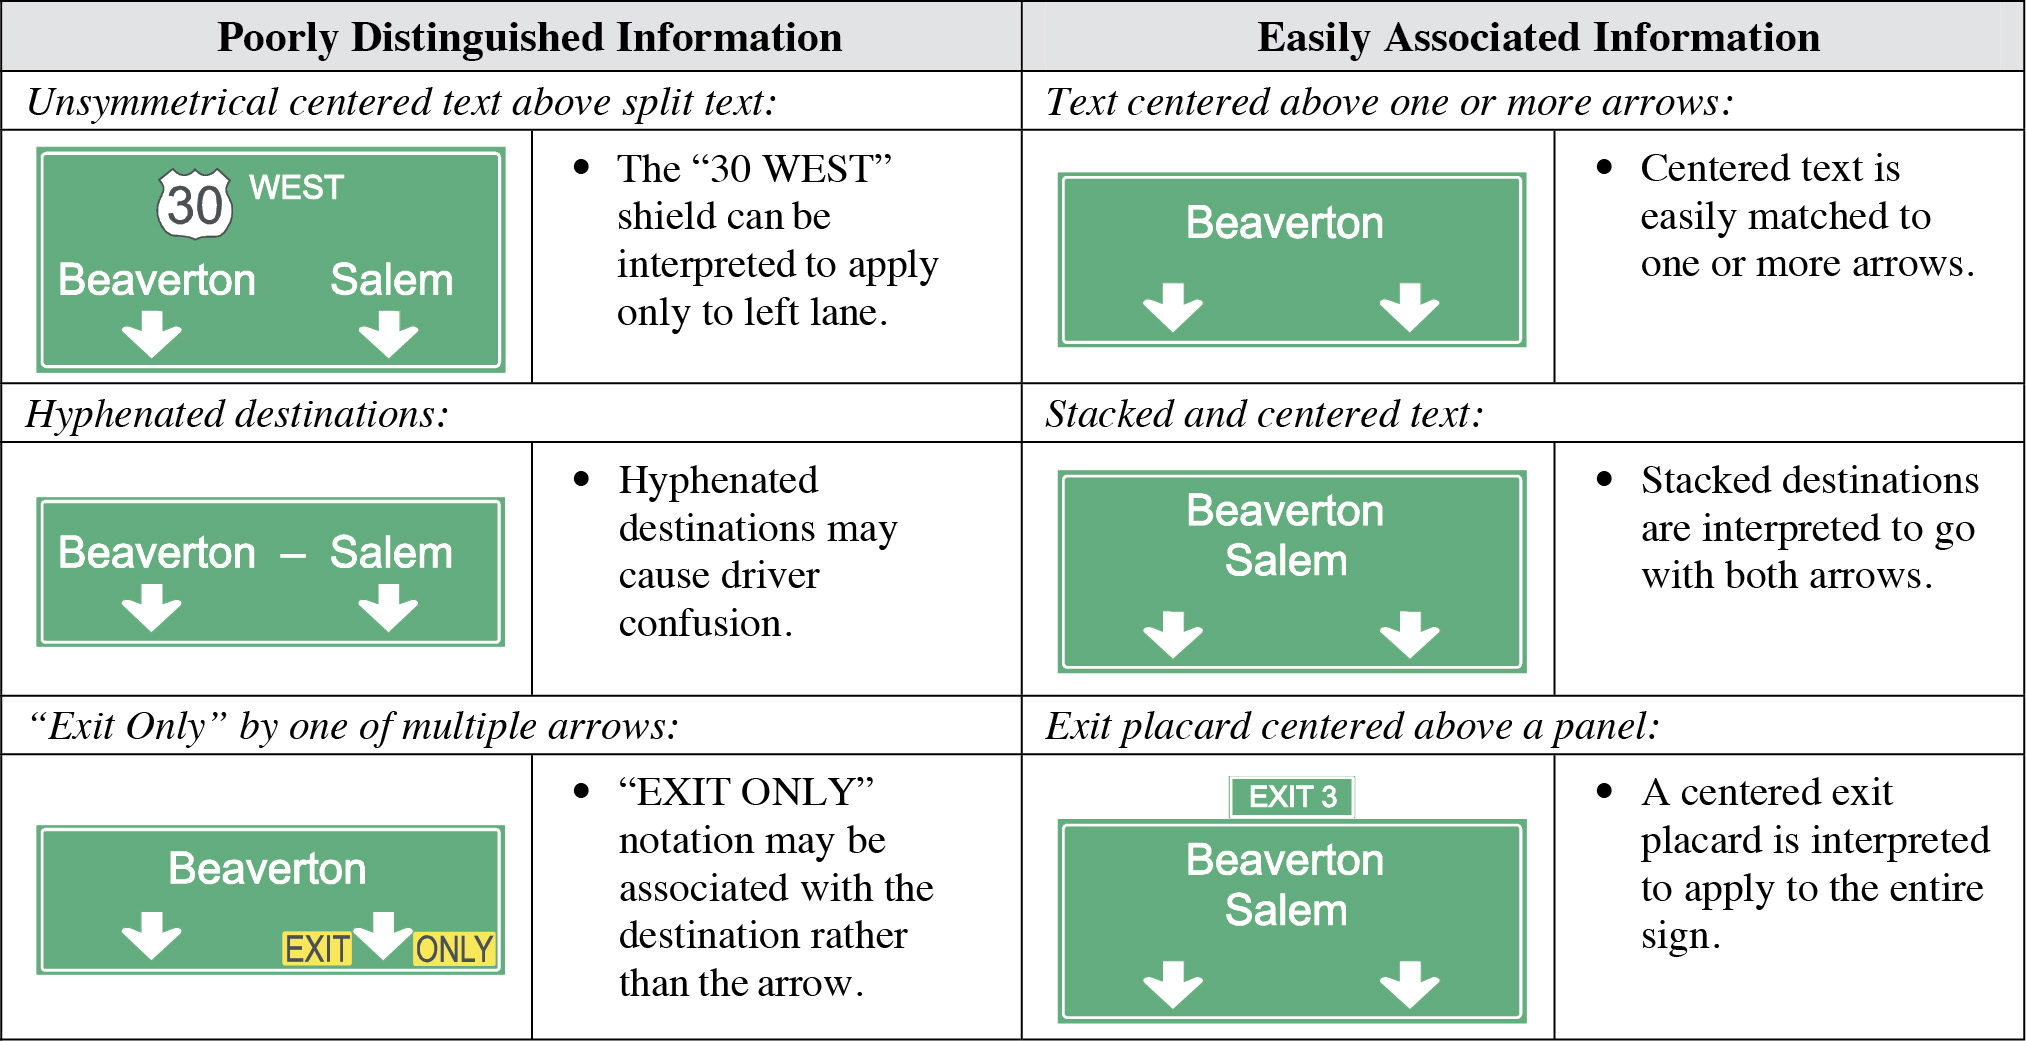
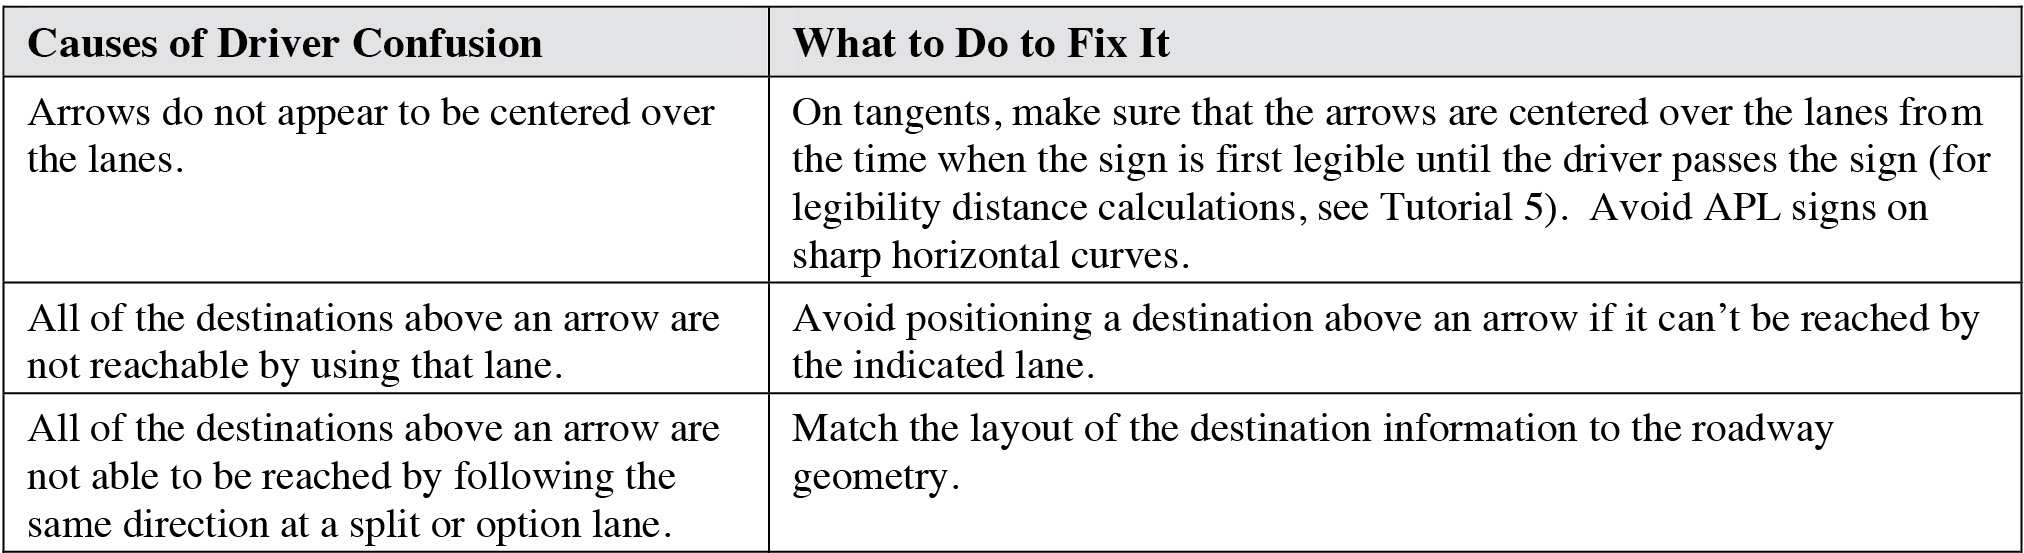
The driverʼs reading goal is to associate destination information with an arrow that points to a particular lane. To accomplish this goal, the pertinent destination information must be able to be separated from adjacent information and clearly pertain to one or more arrows. The primary sign feature that accomplishes this is the centering of information above the applicable arrows. In essence, destinations are interpreted as being centered above the arrow(s) to which they apply. Design elements that cause inappropriate continuity or separation between elements make the navigation task more difficult. The figure on the previous page shows both good and bad examples of pairing destination information with arrows.
Poorly distinguished information. Sign layout can make destination information more difficult for drivers to associate with the relevant arrows. One way in which this may occur is when destination information that is meant to be shared by multiple arrows (i.e., more than one lane leads to the same destination or destinations) is interpreted by drivers to mean that each lane leads to a different destination. For example, with the “30 WEST” notation in the guideline, the entire text segment is centered on the sign. Some drivers, however, may interpret the route shield as being more toward the left side of the sign and associate the route with only the left-hand arrow rather than both arrows because the route shield is much larger than the “WEST” notation. Another problem may occur when text and associated arrows that are meant to indicate different destinations are interpreted by drivers to indicate multiple lanes that lead to the same destination. Destination groupings that are separated by a hyphen may lead to this kind of confusion. The destinations can be interpreted as two areas on the same roadway, or two separate areas. The hyphen prevents association with a single arrow by creating continuity between destination names. Thus, it should be avoided.
In Richard and Lichty (3), a situation arose where the “EXIT ONLY” indication was positioned above a single lane on a multiple-APL sign. Drivers interpreted this “EXIT ONLY” text in a different way than the destination information when used above a single arrow; rather than applying this information to the arrow, and thus the travel lane, drivers assigned it to the destination(s). Therefore, this positioning may cause some drivers to believe that they need to be in the exit-only lane to reach the destination, causing unnecessary lane changes.
Easily associated information. In Richard and Lichty (3), destination information shown directly above an arrow was associated by all drivers with the lane below the arrow. Drivers thought that an arrow with multiple destinations meant that all of the listed destinations could be reached using that lane. Similarly, information that was centered above multiple arrows was generally seen as applying to all of the arrows that it was centered above. This applied to destination information above multiple arrows or smaller placards above larger guide signs that referred to the entire guide sign.
The signs included in the figure on the previous page are modeled after real sign examples. It should be noted that they vary slightly from those recommended in the MUTCD (2). For example, those included show downward pointing arrows, whereas the MUTCD recommends upward pointing arrows except in cases where the lane use is restricted to the listed destinations. The direction that the arrows point should not have an impact on the visual grouping performed by drivers. The MUTCD has additional guidance recommending using only one destination per movement; however, multiple destinations listed per movement are common on existing signs. This guideline does not seek to contradict the MUTCD with design guidance, but rather to discuss general interpretation patterns and provide guidance for troubleshooting problematic signs and prioritizing their replacement.
Design Considerations
Separations between sign panels can also be used to distinguish between lanes or lane groupings. Destinations on different panels are typically not associated with one another (3). Splits between sign panels also show where “Exit” placards apply and do not apply. The MUTCD (2) describes the usage of a vertical white line to separate diverging route movements. This is likely comparable to the distinction between separate sign panels. In general, information that is relevant to and associated with a particular travel lane should be placed on a sign that will be above and associated with that lane.
Cross References
General Principles for Sign Legends
Key References
1. Golembiewski, G., and Katz, B. J. (2008). Diagrammatic Freeway Guide Sign Design. Traffic Control Devices Pooled Fund Study. Retrieved July 2011 from http://www.pooledfund.org/projectdetails.asp?id=281&status=4.
2. FHWA. (2023). Manual on Uniform Traffic Control Devices for Streets and Highways. (11th ed.). Washington, DC.
3. Richard, C. and Lichty, M. G. (2011). Driver Expectations When Navigating Complex Interchanges. Task 4: Gather Feedback from Drivers. (FHWA Contract No. DTFH61-08-D-00032-T-10005). Seattle, WA: Battelle.
DRIVER BEHAVIORAL TRENDS BASED ON EXIT RAMP GEOMETRY
Introduction
Exit ramps provide the means of accessing adjacent surface streets from a freeway. Well-designed exit ramps provide sufficient area for vehicles to depart from the main freeway lanes and sufficient distance for vehicles to decelerate comfortably from freeway speeds to a speed appropriate for the controlling feature of the ramp, which may be the first curve encountered along the ramp or it could be the crossroad terminal. Driver behavior at freeway exit ramps is based upon a variety of factors, including the operating conditions along the freeway and the geometry of the ramp.
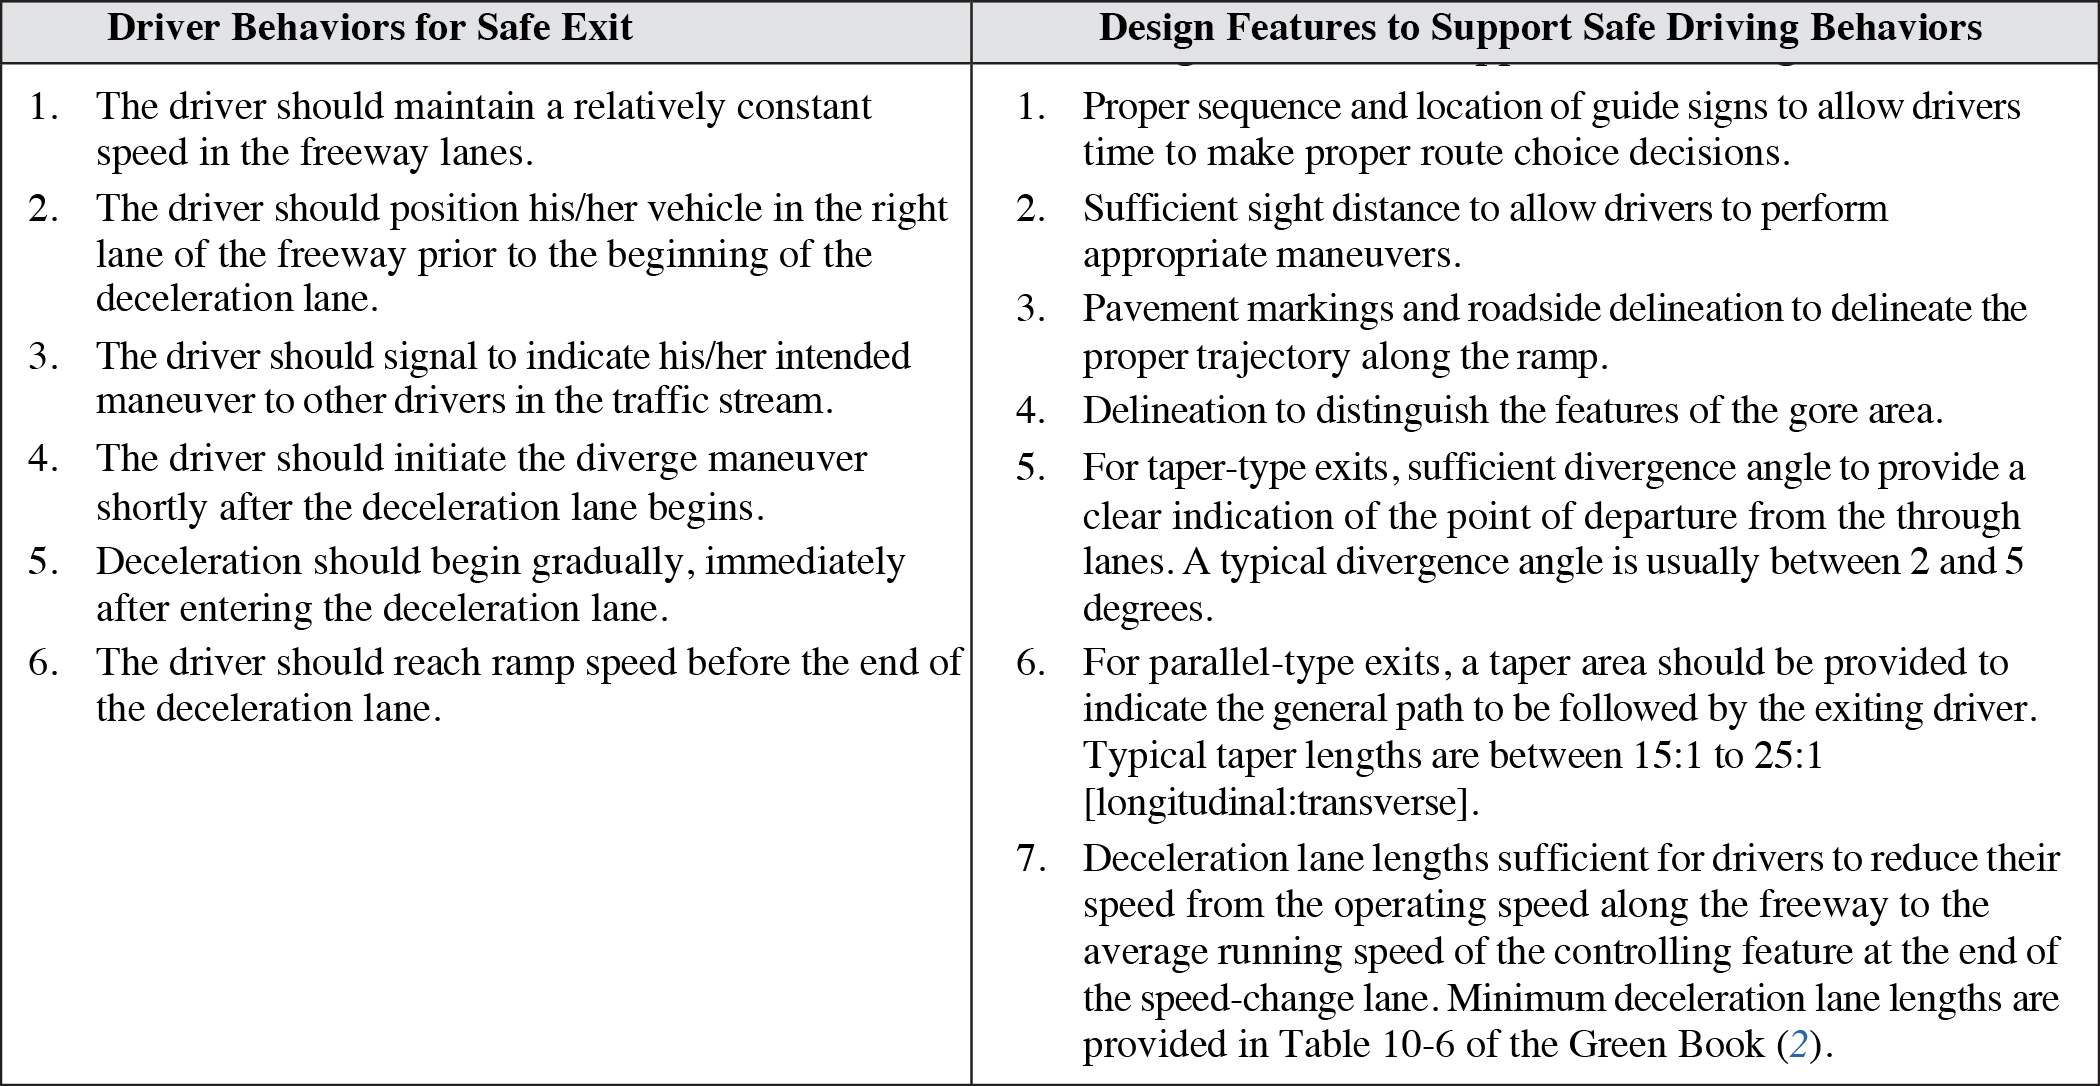

PLAN VIEW OF DRIVER BEHAVIORS AT EXIT RAMP*
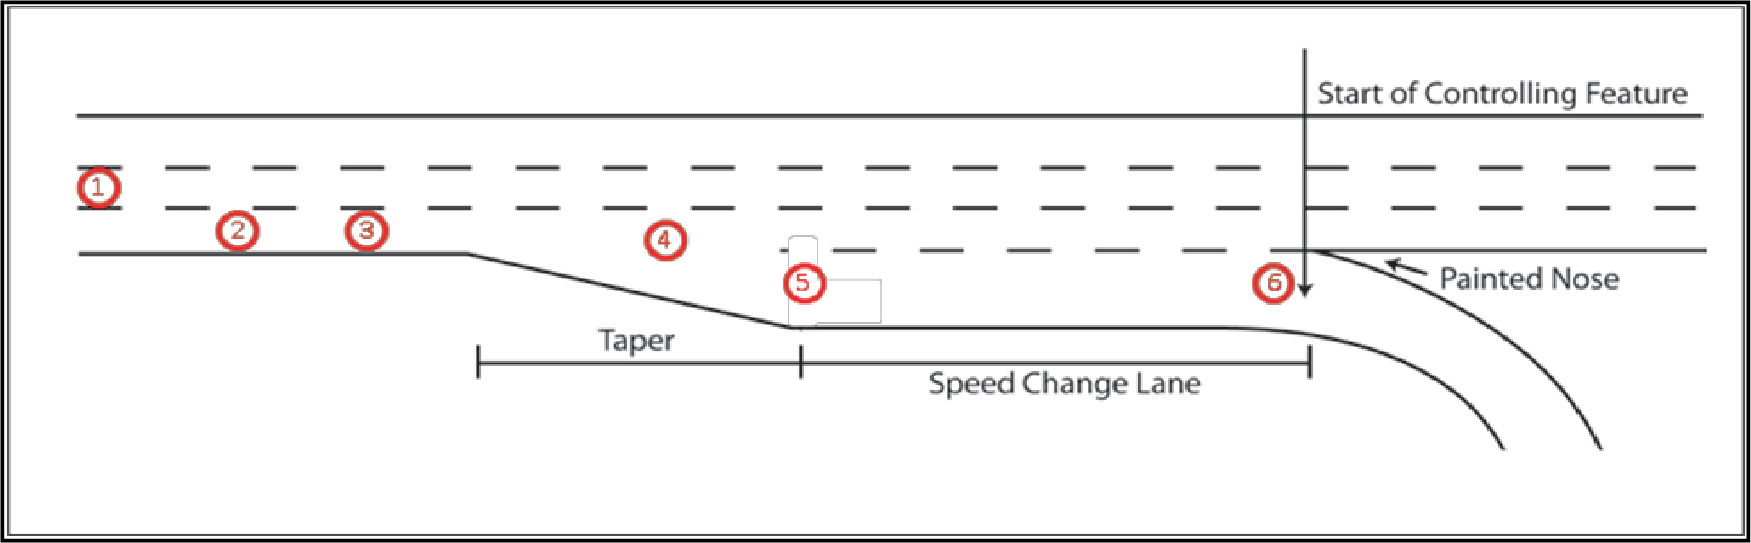
*Numbers correspond to “Driver Behaviors for Safe Exit” in the guideline above.
Long Description.
The driver moves from the lane to the side where the road tapers down to the speed change lane and moves into the exit ramp that has a painted nose. There are six red numbers on the road.
Discussion
On an exit ramp, deceleration is accomplished first as the driver removes his/her foot from the throttle and the vehicle coasts in gear for a period of time (typically) without the use of brakes, and then the driver applies the brakes and decelerates comfortably. A recent study (3) confirmed that drivers coast in gear an average of 3 s prior to applying the brakes to decelerate along a deceleration lane. Coasting time was defined to be the sum of the elapsed time between occurrence of peak speed and deactivation of throttle and the elapsed time between deactivation of throttle and activation of brake. Furthermore, drivers typically coast in gear approximately 2 s in the freeway lanes and approximately 1 s in the deceleration lane prior to applying the brakes.
Through further investigations of diverge locations and speeds and deceleration, Torbic et al. (3) concluded the minimum deceleration lane lengths provided by AASHTO (4) are conservative estimates, given the current vehicle fleet and driver population. Drivers decelerate at levels well within the capabilities of the vehicle fleet and driver preferences. This is, in part, due to some deceleration by drivers in the freeway prior to the diverge maneuver. Drivers typically diverge between 4 to 7 mi/h below average freeway speeds; however, it is prudent for designers to assume that all deceleration takes place in the speed-change lane when determining minimum deceleration lane length.
Although it seems intuitive that a relationship should exist between deceleration level and deceleration lane length, no relationship has been determined (5). It has been found that longer deceleration lanes lead to later deceleration at a higher level, perhaps because drivers relax thinking there is more time than there actually is to decelerate (5). Also, as deceleration lane length increases, the percentage of return maneuvers increases (6). On the other hand, shorter deceleration lanes lead to an increase in early exits (6) and deceleration along the taper to the lane. Torbic et al. (3) found similar results, indicating that providing deceleration lanes longer than the minimum values provided by AASHTO (4) may promote more casual deceleration by exiting drivers, particularly under uncongested or lightly congested conditions, but noted this is not necessarily a negative result. Simply, it changes the operational characteristics of the ramp.
Most drivers diverge from the freeway either within the taper or the first two-thirds of the speed-change lane (defined as the distance between the end of the taper to the painted nose). Few drivers diverge from the freeway in the final third of the speed-change lane or beyond the painted nose. Drivers that diverge earlier along the speed-change lane decelerate at a more casual level compared to drivers that diverge closer to the painted nose (3).
Design Considerations
The current design criteria for exit ramps assume free-flow or uncongested conditions along the freeway and are based upon the vehicle capabilities of passenger cars and driver comfort levels. Several studies (7, 8) recommend longer deceleration lane lengths on the order of 15% to 50% longer than those required for passenger cars to better accommodate the reduced vehicle capabilities of heavy vehicles. However, when exiting the freeway, trucks decelerate at levels very comparable to those of passenger cars (3).
One of the goals in designing an exit ramp should be to minimize erratic maneuvers near the ramp, such as crossing the gore point, crossing the gore area, stopping in the gore, backing up, sudden slowing, lane changing (to exit), swerving, and stopping on the shoulder. Research suggests that most erratic maneuvers are made by motorists taking unfamiliar routes, as contrasted to shopping or commuting-to-work trips, which involve familiar and frequently used routes (9). Proper sequencing and location of overhead guide signs, good delineation of the exit ramp, and clearly distinguishing the taper, the beginning of the deceleration lane, and the gore area using pavement markings (e.g., raised pavement markers) and roadside delineation, in addition to geometrics, need to be considered to reduce driver confusion near exit ramps.
Cross References
Task Analysis of Driver Merging Behavior at Freeway Entrance Ramps
Key References
1. Mace, D. J., Hostetter, R. S., and Sequin, L. E. (1969). Information Requirements for Exiting at Interchanges. (Report 89211-f). State College, PA: HRB-Singer.
2. AASHTO. (2018). A Policy on Geometric Design of Highways and Streets (7th ed.). Washington, DC.
3. Torbic, D. J., Hutton, J. M., Bokenkroger, C. D., Harwood, D. W., Gilmore, D. K., Knoshaug, M. M., et al. (2012). Design Guidance for Freeway Mainline Ramp Terminals. Final Report. NCHRP Project 15-31A. Washington, DC: Midwest Research Institute.
4. AASHTO. (2004). Guide for the Planning, Design, and Operation of Pedestrian Facilities. Washington, DC.
5. Bella, F., Garcia, A., Solves, F., and Romero, M. A. (2007). Driving simulator validation for deceleration lane design. 86th Annual Meeting of the Transportation Research Board.
6. Garcia, A., and Romero, M. A. (2006). Experimental observation of vehicle evolution on deceleration lanes with different lengths. 85th Annual Meeting of the Transportation Research Board.
7. Ervin, R., Barnes, M., MacAdam, C., and Scott, R. (1986). Impact of Specific Geometric Features on Truck Operations and Safety at Interchanges (FHWA/RD-86/057). Washington, DC: FHWA.
8. Firestine, M., McGee, H., and Toeg, P. (1989). Improving Truck Safety at Interchanges (FHWA-IP-89-024). Washington, DC: FHWA.
9. Taylor, J. I., and McGee, H. W. (1973). NCHRP Report 145: Improving Traffic Operations and Safety at Exit Gore Areas. HRB, National Research Council, Washington, DC.


