Human Factors Guidelines for Road Systems: Third Edition (2025)
Chapter: 11 Signalized Intersections

ENGINEERING COUNTERMEASURES TO REDUCE RED LIGHT RUNNING
Introduction
Red light running refers to driversʼ entering a signalized intersection when a red light is being presented (1). Several engineering countermeasures to reduce red light running have been proposed in McGee et al. (1) and Bonneson and Zimmerman (2). Some of these countermeasures reflect expert judgment, but most are supported by empirical research.
Importantly, Bonneson and Zimmerman (2) note the number of driver-, intersection-, vehicle-, and environment-related factors that are correlated with red light violation frequency and likelihood. These factors include traffic volume, cycle length, advance detection for green extension, speed, signal coordination, approach grade, yellow interval duration, proximity to other vehicles, presence of heavy vehicles, intersection width, and signal visibility.


Discussion
Several driver-related factors and driver behaviors are relevant to red light running and countermeasure selection. Campbell, Smith, and Najm (3) report on a study that examined fatal crashes from 1999 and 2000 included in the Fatal Accident Reporting System (FARS) and found that, of the 9,951 vehicles involved in fatal signalized-intersection crashes, 20% failed to obey the traffic signal and 13% failed to yield the right-of-way; contributing factors included alcohol, speeding, and racing. Porter and Berry (4) note that in a survey that assessed red-light-running perceptions of 880 licensed drivers, the only factor that predicted recent red light running was age group—younger respondents were more likely to run red lights. In Retting and Williams (5), video data collected by an automated camera were analyzed to identify key characteristics of red light running. The authors found that, as a group, red light runners were younger, were less likely to be wearing seat belts, and had more convictions for moving violations.
McGee et al. (1) summarizes the red-light-running problem, as well as a number of engineering countermeasures, and notes that driver-related factors associated with red light running include driver expectancies, driver knowledge of the intersection and the traffic signal (e.g., the yellow interval), and the driverʼs estimate of the consequences of not stopping (e.g., threat of a right-angle crash or a citation) versus stopping (e.g., threat of a rear-end crash or delays).
In Bonneson and Zimmerman (2), an integrative review of past analyses and research was conducted to identify engineering countermeasures having promise for reducing the number of red light violations at intersections and/or the number of crashes associated with red light violations. The engineering countermeasures presented on the opposing page have been adapted from Bonneson and Zimmerman (2), but are also presented in slightly different formats in McGee et al. (1) and Bonneson, Zimmerman, and Brewer (6).
Design Considerations
McGee et al. (1) make an important distinction between intentional and unintentional red light running that can affect countermeasure selection and development. Specifically, McGee et al. (1) note that intentional red light runners are most affected by enforcement countermeasures (such as red light cameras) while unintentional red light runners are most affected by engineering countermeasures. Factors such as length of queue, waiting times, traffic conditions, and urban/rural considerations may be important as well.
Red light cameras are frequently employed as enforcement countermeasures to reduce red light running. In Council et al. (7), an empirical Bayes before/after approach was used to determine effectiveness of red light cameras at 132 treatment sites. The authors report that red light cameras were associated with decreased right-angle crashes and increased rear-end crashes, with an aggregate crash cost-benefit associated with the use of red light cameras. Also, the presence of warning signs at both the city limit and the intersection was associated with a larger benefit than signs at just the intersection; high publicity was also associated with higher benefits. Caveats associated with the study were that other variables (driver, traffic volumes, temporal, environmental, signal, driver workload) were either not included in the analyses (uncontrolled or confounded) or not associated with a large enough sample to detect an effect. Also, the analyses could not distinguish the effects of other improvements occurring at the same location as the red light cameras.
Cross References
Heuristics for Selecting the Yellow Timing Interval
Key References
1. McGee, H. W., Eccles, K., Clark, J., Prothe, L., and OʼConnell, C. (2003). Making Intersections Safer: A Toolbox of Engineering Countermeasures to Reduce Red-Light Running. Washington, DC: ITE.
2. Bonneson, J., and Zimmerman, K. (2004). Red-Light-Running Handbook: An Engineerʼs Guide to Reducing Red-Light-Related Crashes. College Station: Texas Transportation Institute.
3. Campbell, B. N., Smith, J. D., and Najm, W. G. (2004). Analysis of Fatal Crashes Due to Signal and Stop Sign Violations (DOT HS 809 779). Cambridge, MA: Volpe National Transportation Systems Center.
4. Porter, B. E., and Berry, T. D. (2001). A nationwide survey of self-reported red light running: Measuring prevalence, predictors, and perceived consequences. Accident Analysis & Prevention, 22, 735–741.
5. Retting, R. A., and Williams, A. F. (1996). Characteristics of red light violators: Results of a field investigation. Journal of Safety Research, 27(1), 9–15.
6. Bonneson, J., Zimmerman, K., and Brewer, M. A. (2002). Engineering Countermeasures to Reduce Red-Light-Running (FHWA/TX-03/4027-2). College Station: Texas Transportation Institute.
7. Council, F. M., Persaud, B., Eccles, K., Lyon, C., and Griffith, M. S. (2005). Safety Evaluation of Red-Light Cameras. (FHWA-HRT-05-048). McLean, VA: FHWA.
RESTRICTING RIGHT TURNS ON RED TO ADDRESS PEDESTRIAN SAFETY
Introduction
This guideline describes approaches for implementing restrictions on right turn on red (RTOR) movements with the objective of reducing conflicts between pedestrians and right-turning vehicles. The MUTCD (1) provides six situations where RTOR should be restricted, and two of these specifically address pedestrians: (1) where an exclusive pedestrian or bicycle phase exists and (2) where an unacceptable number of conflicting pedestrian movements with RTOR maneuvers exist, especially involving pedestrians who are children, are elderly, or have disabilities.
Typically, around 40% of drivers do not stop completely before making a RTOR (2). Of those drivers that do stop, many will stop beyond the marked stop line and block the pedestrian crosswalk while waiting to turn. This blocking of the crosswalk can impede pedestrian movements or cause pedestrians to walk outside of the marked crosswalk. Also, pedestrians may yield the right-of-way before entering the intersection and may not have time to clear the intersection before the signal changes. This is especially problematic for older pedestrians who take longer to cross.

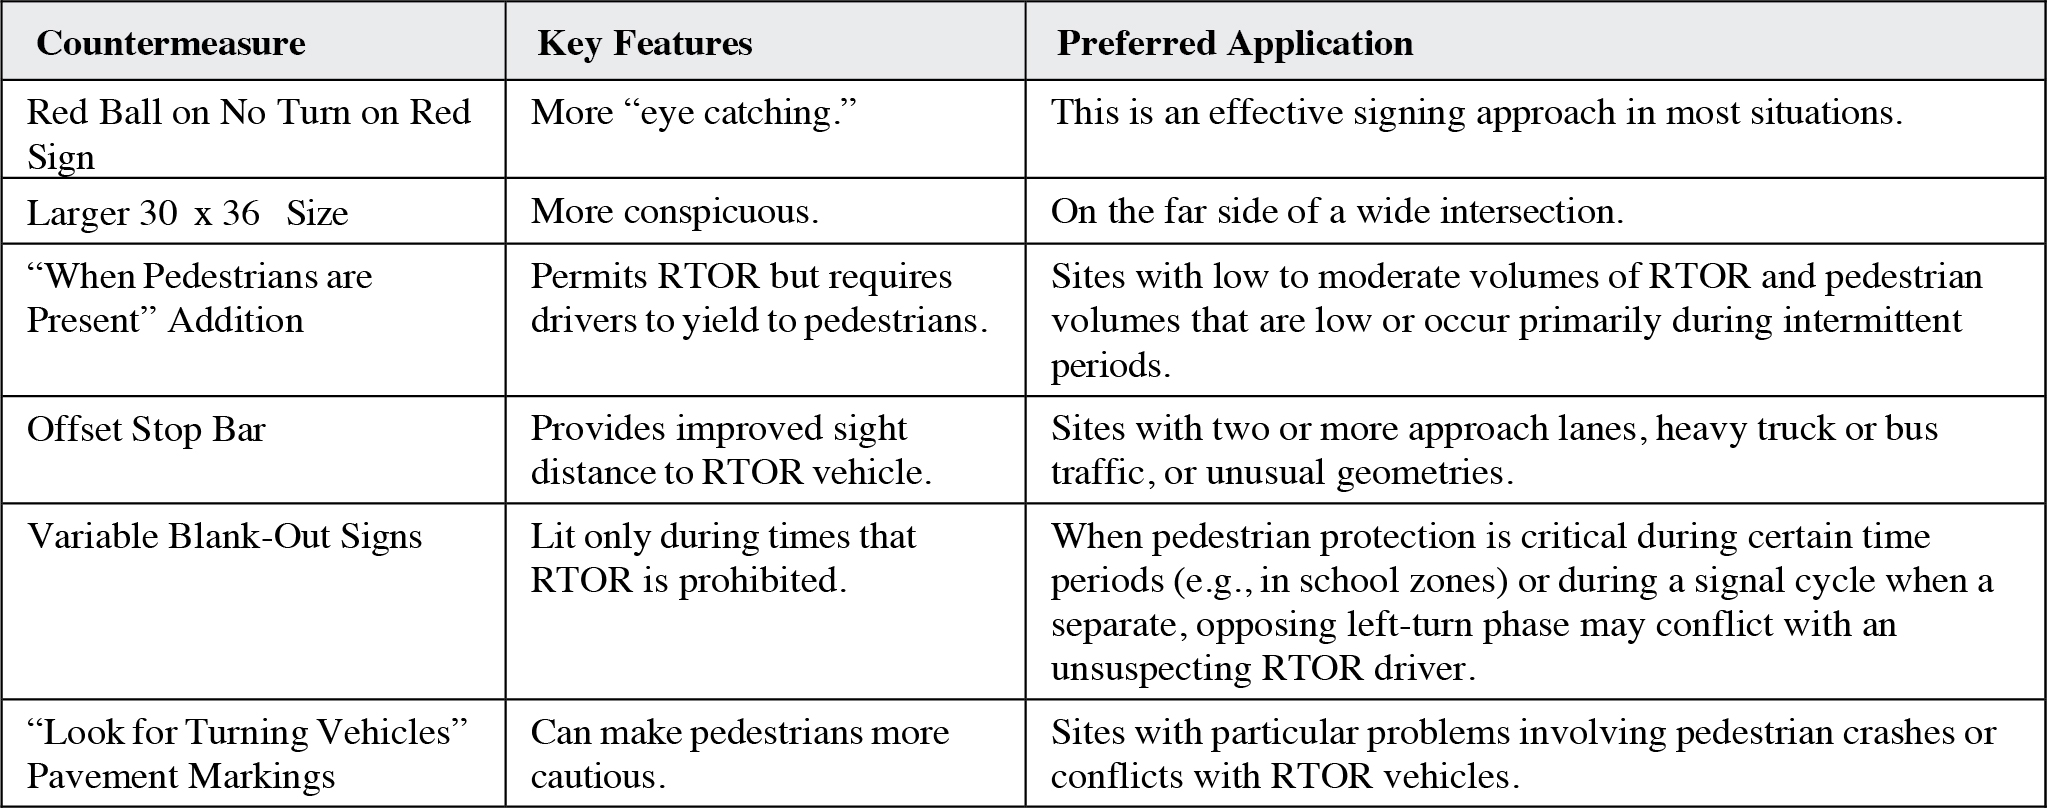
The table below shows examples of different implementations for RTOR signage.

Long Description.
An effectiveness rating indicates that this countermeasure is most effective.
Long Description.
An effectiveness rating indicates that this countermeasure is effective with low to modereate volume of RTOR.
Long Description.
The text reads, 'Inside lane stop bar is set back to improve sight lines for RTOR vehicles.' An effectiveness rating indicates that this countermeasure is effective when sight distances are problematic.
Long Description.
An effectiveness rating indicates that this countermeasure is effective.
Long Description.
Column 1: Countermeasure. Column 2: Key Features. Column 3: Preferred Application. Row 1, Column 1: Red Ball on No Turn on Red Sign. Column 2: More “eye catching.” Column 3: This is an effective signing approach in most situations. Row 2, Column 1: Larger 30 by 36 Size Column 2: More conspicuous. Column 3: On the far side of a wide intersection. Row 3, Column 1: “When Pedestrians are Present” Addition Column 2: Permits RTOR but requires drivers to yield to pedestrians. Column 3: Sites with low to moderate volumes of RTOR and pedestrian volumes that are low or occur primarily during intermittent periods. Row 4, Column 1: Offset Stop Bar Column 2: Provides improved sight distance to RTOR vehicle. Column 3: Sites with two or more approach lanes, heavy truck or bus traffic, or unusual geometries. Row 5, Column 1: Variable Blank-Out Signs Column 2: Lit only during times that RTOR is prohibited. Column 3: When pedestrian protection is critical during certain time periods (e.g., in school zones) or during a signal cycle when a separate, opposing left-turn phase may conflict with an unsuspecting RTOR driver. Row 6, Column 1: “Look for Turning Vehicles” Pavement Markings Column 2: Can make pedestrians more cautious. Column 3: Sites with particular problems involving pedestrian crashes or conflicts with RTOR vehicles.
Discussion
With regard to conditional RTOR restrictions, restrictions based on certain times of day (time-restricted) and those based on the presence of pedestrians (pedestrian-restricted) increase driversʼ stopping at the stop line (3). However, the time-restricted implementation appears to be more effective both when pedestrians are present and when they are not. Retting et al. (3) found that the pedestrian-restricted implementation significantly reduced RTOR when pedestrians were present (by 11%), but they still occurred 57% of the time. In contrast, time-restricted implementation led to a much greater reduction (from 77% to 19%). Additionally, the time-restricted implementation significantly increased the number of drivers that stopped before making a RTOR, while the pedestrian-restricted implementation did not. There was also a difference in terms of pedestrian capacity. In particular, the time-restricted implementation significantly reduced the number of pedestrians that yielded to drivers, but the pedestrian-restricted implementation did not.
Time-restricted implementations can be based on when pedestrian–turning vehicle crashes are most likely to occur. In particular, Stutts, Hunter, and Pein (4) found that 80% of intersection crashes involving pedestrians and turning vehicles occur between 6:00 am and 6:00 pm.
Regarding the relative effectiveness of different signage options, Zegeer and Cynecki (5) compared different approaches and found that the NO TURN ON RED (NTOR) sign with a red ball was more effective than the standard black and white NTOR sign. Also, NO TURN ON RED WHEN PEDESTRIANS ARE PRESENT signs were effective at sites with moderate to low volumes of RTOR vehicles, although the legend was found to be difficult to read when located adjacent to the signal or on the far side of the intersection. Lastly, the presence of an offset stop bar improved motorist compliance, reduced conflicts with cross-street traffic, and was recommended for use on multilane approaches under some conditions [see Zegeer and Cynecki (5)].
Another issue to consider is the use of electronic signing, such as blank-out NTOR signs that are lit only during the times that turns are restricted. In Zegeer and Cynecki (5), an electronic NTOR blank-out sign was slightly more effective, although considerably more costly, than traditional signs. Similarly, another study found that sites with variable message signs were effective in lowering incidence of motorists who illegally turned right on red. This study did not compare the effectiveness to traditional signs, so it is unclear if the benefits outweighed the additional costs of the variable message signs.
Design Considerations
Several factors can diminish the effectiveness of RTOR restrictions on driver compliance [see (6)]:
- Confusing partial prohibitions (e.g., 7–9 am and 4–6 pm, except Sundays)
- NTOR signs located on the far side of the intersection or otherwise not clearly visible
- Long cycle lengths
- Confusing multi-leg intersections
- NTOR that does not appear to be justified given the traffic conditions
Also, inconsistent placement of RTOR signs from intersection to intersection can reduce the effectiveness of the signs.
Cross References
Determining Intersection Sight Distance
Sight Distance at Right-Skewed Intersections
Key References
1. FHWA. (2023). Manual on Uniform Traffic Control Devices for Streets and Highways. (11th ed.). Washington, DC.
2. ITE. (1992). Driver behavior at right-turn-on-red locations. ITE Journal, 62(4), 18–20.
3. Retting, R. A., Nitzburg, M. S., Farmer, C. M., and Knoblauch, R. L. (2002). Field evaluation of two methods for restricting right turn on red to promote pedestrian safety. ITE Journal, 72(1), 32–36.
4. Stutts, J. C., Hunter, W. W., and Pein, W. E. (1996). Pedestrian-vehicle crash type: An update. Transportation Research Record: Journal of the Transportation Research Board, 1538, 68–74.
5. Zegeer, C. V., and Cynecki, M. J. (1986). Evaluation of countermeasures related to RTOR accidents that involve pedestrians. Transportation Research Record: Journal of the Transportation Research Board, 1059, 24–34.
6. Zegeer, C. V., and Zegeer, S. F. (1988). NCHRP Synthesis 139: Pedestrians and Traffic-Control Measures. TRB, National Research Council, Washington, DC.
HEURISTICS FOR SELECTING THE YELLOW TIMING INTERVAL
Introduction
The yellow timing interval refers to the duration of the yellow signal indication; the yellow timing interval is also referred to as the “yellow change interval” in a number of sources. The yellow signal warns oncoming traffic that their permission to proceed is being terminated after which they will be directed to stop, or in the case of a protected/permissive turning movement that their protected movement is being terminated after which they will need to perform their turn in a permissive manner (1, 2). Most traffic engineering sources (1, 2, 3) recommend a yellow change interval of 3 to 5 s duration (though the MUTCD recommends no more than 6 s). Increases to a given yellow timing interval are usually implemented to decrease instances of red light running. Van Winkle (4) notes that the many variables influencing the selection of yellow timing intervals include approach speed, intersection width, vehicle length, vehicle deceleration level, visibility of traffic signals, response time of the driver, degree of enforcement, specific laws, and motorist attitudes; this source also recommends using a consistent interval to eliminate driver uncertainty as a variable.


The figure below depicts the dilemma zone when a driver approaching a signalized intersection is faced with a green light that changes to yellow [adapted from Pant et al. (8)].

Long Description.
The dilemma zone is marked as a shaded red area. Line segments depicting the minimum stopping distance (X subscript S) and the maximum clearing distance (X subscript c) are marked.
Discussion
Driver decisions and behaviors relevant to the selection of a yellow timing interval have been studied by the transportation research community for many years. Tijerina et al. (6) note that crash data for signalized intersections show that the decision to proceed through a yellow signal likely represents a source of problems for many drivers. In particular, the most common contributing factors include deliberately running the signal (40%), either because drivers failed to obey the signal (23.1%) or tried to beat the signal (16.2%). The next most common contributing factor was driver inattention (36.4%). A critical aspect of driver behavior related to the yellow timing interval is associated with the “dilemma zone.” When a driver sees a green signal changing to yellow, a dilemma zone is created. The dilemma zone represents the portion of the roadway between (1) the clearing distance to the intersection (the distance the vehicle travels between the time the signal changes to yellow to the time the signal changes to red) and (2) the stopping distance (the distance traveled by the vehicle between the time the signal changes to yellow to the time when the vehicle actually stops) when the stopping distance is greater than the clearing distance. The dilemma zone is, therefore, not a fixed area. While in the dilemma zone, the driver must assess the situation and then decide whether to stop or proceed through the intersection based on that assessment.
A recent task analysis of driver behavior while traveling straight through an intersection on a yellow signal (7) confirms that the decision to stop or not is a complex one. As noted in Richard, Campbell, and Brown (7), there are two reasons drivers run the signal (and risk a right-angle crash) when the appropriate action would be to stop: (1) they correctly assess the situation as unsafe and then make a bad decision to go anyway, or (2) they incorrectly assess the situation as safe (perhaps because the driver missed relevant information) and make the logical—but incorrect—decision to proceed. The latter case is similar to driver inattention, whereby drivers also fail to adequately perceive and process the necessary situational information. Drivers have limited options in dilemma zone situations, not only because they have extremely limited time to perform several tasks, but also because they are limited in the types of actions they can safely or legally take.
Pant et al. (8) carried out a study to test and implement a dilemma zone protection technique (placement of detectors leading up to the intersection and the use of a green extension of 1 to 5 s) at three high-speed intersections in Ohio. The authors report that the use of detectors, combined with a 3-s extension, can provide drivers with some dilemma zone protection. They also note that differences among intersections with respect to vehicle speeds, operational characteristics, and geometries suggest that specific solutions are unique to individual intersections.
Design Considerations
The possibility of long-term driver adaptation to longer yellow timing intervals has not been extensively studied. Specifically, the driver behavior and crash rates associated with changes in the yellow timing interval seen in many of the field studies may reflect only temporary effects that will recede once drivers acclimate to the longer yellow.
Cross References
Engineering Countermeasures to Reduce Red Light Running
Key References
1. Pline, J. L. (Ed.). (2001). Traffic Control Devices Handbook. Washington, DC: ITE.
2. FHWA. (2023). Manual on Uniform Traffic Control Devices for Streets and Highways. (11th ed.). Washington, DC.
3. Pline, J. L. (Ed.). (1999). Traffic Engineering Handbook. (5th ed.). Washington, DC: ITE.
4. Van Winkle, S. N. (1999). Clearance interval timing—A viewpoint. Transportation Frontiers for the Next Millennium: 69th Annual Meeting of the Institute of Transportation Engineers.
5. ITE. (1994). Determining Vehicle Signal Change and Clearance Intervals. Washington, DC.
6. Tijerina, L., Chovan, J., Pierowicz, J., and Hendricks, D. (1994). Examination of Signalized Intersection, Straight Crossing Path Crashes, and Potential IVHS Countermeasures. (DOT HS 808 143). Washington, DC: NHTSA.
7. Richard, C. M., Campbell, J. L., and Brown, J. L. (2006). Task Analysis of Intersection Driving Scenarios: Information Processing Bottlenecks. (FHWA-HRT-06-033). Washington, DC: FHWA.
8. Pant, P. D., Cheng, Y., Rajaopal, A., and Kashayi, N. (2005). Field Testing and Implementation of Dilemma Zone Protection and Signal Coordination at Closely-Spaced High-Speed Intersections. Columbus: Ohio Department of Transportation.
COUNTERMEASURES FOR IMPROVING ACCESSIBILITY FOR VISUALLY IMPAIRED PEDESTRIANS AT SIGNALIZED INTERSECTIONS
Introduction
This guideline identifies accessible pedestrian signals (APSs) and curb treatment recommendations for improving accessibility for visually impaired pedestrians at signalized intersections. Title II of the ADA requires that new and altered facilities be designed to be readily accessible to and usable by people with disabilities (28 CFR 35.151). Unfamiliar signalized intersections can pose several challenges that reduce accessibility and safety for visually impaired or low-vision pedestrians who use signalized intersections while traveling on their own (1).


The figure below shows the ideal placement of pushbutton integrated APS and recommended positioning of curb ramps (1):

Long Description.
The pushbutton pole may be a stub pole, or may also support the ped head. A symbol key shows symbols for the sound emitted from the push button, the ped head, the push button-integrated APS, and the pole.
Discussion
Curb ramps: Aligning themselves with the crosswalk and staying within it are some of the biggest challenges that visually impaired pedestrians face at intersections. One study found that only 66% to 75% of pedestrians started within the crosswalk, started from an aligned position, traveled within the crosswalk, and ended within the crosswalk (2). Two factors that contribute to these problems are large-radius corners that eliminate important cues for alignment, and curb ramps that do not line up with the crosswalk, which make finding the crosswalk more difficult for visually impaired pedestrians (3). Factors that help visually impaired pedestrians detect the crosswalk location include a ramp slope that has a steep angle, an abrupt rate of change in the slope between the approach to each curb and the ramp itself, and curb ramps aligned with the crosswalk (4). One study (5) found that domed surfaces were far more detectable than rough aggregate surfaces and that a majority of the totally visually impaired participants failed to detect either of two exposed rough aggregate surfaces.
Signal timing: Visually impaired pedestrians can cross at the same speed as other pedestrians (4 ft/s), but they require additional time before crossing to determine that it is safe to cross (generally by listening to the near-side parallel vehicle surge). This additional time can result in pedestrians leaving the curb during the clearance interval after the initial “walk” interval has passed. Bentzen, Barlow, and Bond (2) found that the mean starting delay ranged from 5 to 8 s and resulted in 26.2% of all crossings being completed after the onset of perpendicular traffic. Note that these data are for non-electric vehicles.
APS: As indicated in the guideline, recommended characteristics for APSs (e.g., location, tones, speech messages) and associated pushbuttons (e.g., locator tone, tactile arrow, information message) are covered in detail in Barlow et al. (1). These recommendations address important difficulties that visually impaired pedestrians encounter with APSs and pushbuttons. In particular, common problems with APSs include (1) identifying which crosswalk had the signal, (2) hearing a signal that is too quiet, (3) remembering which sound is for which direction, and (4) finding the APS (6). Additionally, common problems with pushbuttons include (1) not being able to determine if a pushbutton is present, (2) locating the pushbutton (e.g., given variability in design, height from the pavement), (3) identifying which crosswalk is actuated by the pushbutton, and (4) having insufficient time to prepare for crossing because pushbuttons are located too far from the crosswalk (6).
Design Considerations
The MUTCD (7) states that the following factors are relevant in determining whether a particular signalized location presents difficulties for pedestrians with vision disabilities to cross the roadway: (1) potential demand for APSs; (2) a request for APSs; (3) traffic volumes during times when pedestrians might be present, including periods of low traffic volumes or high turn-on-red volumes; (4) the complexity of traffic signal phasing (e.g., split phases, protected turn phases, leading pedestrian intervals, and exclusive pedestrian phases); and (5) the complexity of intersection geometry.
Additional guidance about locations that may require APSs includes the following (1):
- Intersections with vehicular and/or pedestrian actuation of signals
- Very wide crossings
- Non-rectangular or skewed crossings
- T-shaped intersections
- High volumes of turning vehicles
- Major streets at intersections with low-traffic minor streets (an APS may be needed for crossing the major street)
- Split phase signal timing
- Exclusive pedestrian phasing, especially where right-turn-on-red is permitted
- A leading pedestrian interval
Cross References
Countermeasures for Improving Accessibility for Visually Impaired Pedestrians at Roundabouts
Key References
1. Barlow, J. M., Bentzen, B. L., and Tabor, L. S. (2003). NCHRP Research Results Digest 278: Accessible Pedestrian Signals: Synthesis and Guide to Best Practices. Transportation Research Board of the National Academies, Washington, DC.
2. Bentzen, B. L., Barlow, J. M., and Bond, T. (2004). Challenges of unfamiliar signalized intersections for pedestrians who are blind: Research on safety. Transportation Research Record: Journal of the Transportation Research Board, 1878, 51–57.
3. Barlow, J. M. (2004). Orientation and alignment for street crossing: Pedestrians who are blind or visually impaired. Curb Ramp and Intersection Wayfinding Workshop. Washington, DC: ITE.
4. Bentzen, B. L., and Barlow, J. M. (1995). Impact of curb ramps on the safety of persons who are blind. Journal of Visual Impairment and Blindness, 89(4), 319–328.
5. OʼLeary, A. A., Lockwood, P. B., and Taylor, R. V. (1996). Evaluation of detectable warning surfaces for sidewalk curb ramps. Transportation Research Record: Journal of the Transportation Research Board, 1538, 47–53.
6. Bentzen, B. L., Barlow, J. M., and Franck, L. (2000). Addressing barriers to blind pedestrians at signalized intersections. ITE Journal, 70(9), 32–35.
7. FHWA. (2023). Manual on Uniform Traffic Control Devices for Streets and Highways. (11th ed.). Washington, DC.
COUNTERMEASURES TO REDUCE LEFT-TURN CRASHES DURING PERMISSIVE PHASES
Introduction
Permissive left-turn signal phases allow drivers to make a left turn only after yielding to opposing traffic and conflicting pedestrians. Studies on driver eye movements and other human factors involved in permissive left turns have found that such situations can increase driver workload in terms of perception, comprehension, attention, and reaction time (1). The effectiveness of a permissive left-turn phase relies on:
- Driver understanding of the permissive indication and which movement has the right-of-way.
- Sufficient sight distance for a left-turning driver to see opposing traffic.
Two countermeasures may be considered to address these issues: a flashing yellow arrow (FYA) to improve driver understanding of the permissive indication and an offset left-turn lane to improve sight distance for left-turning drivers.
The FYA and offset left-turn lane countermeasures are presented in the figure below the design guidelines.


FYA AND OFFSET LEFT-TURN LANES

Long Description.
The traffic light has an arrow pointing leftward. A sign reads 'Left Turn yield' on the flashing arrow. The three illustrations show intersections with negative offset, no offset, and positive offset.
Discussion
Flashing Yellow Arrows
Evaluations of the safety effects of the FYA suggest that this relatively new permissive indication is associated with a reduction in left-turn crashes if the before-period phasing is not a protected left turn (2). Intersections where the FYA was implemented and the before period comprised a permissive or protected-permissive phasing experienced reductions in left-turn crashes ranging from 15 to 50 percent, depending on the specific phasing (2).
Brehmer et al. (3) conducted a comprehensive study to identify a preferred traffic signal display for protected-permissive left-turn control. The authors performed engineering analyses, static and video-based driver comprehension studies, field implementation, video conflict studies, and crash analyses. They determined that (1) the FYA is a preferred alternative to a circular green signal as the permissive signal display for a left-turn movement and (2) left-turn drivers have a high level of understanding and correct response to FYAs.
The MUTCD (4) provides guidance on the use of the FYA.
Offset Left-Turn Lanes
The safety effects of offset left-turn lanes depend largely on the type of offset (negative, no offset, positive offset) and the amount of offset provided. Sight distance (i.e., visibility) for left-turn drivers can be greatly improved by shifting the left-turn lane to the left, giving it a positive offset rather than a negative or zero offset. However, slight improvements to sight distance can even be obtained by modifying a left-turn lane from a negative offset to a less negative offset. Such modifications can also reduce the turning driverʼs workload by reducing the amount of opposing traffic to monitor.
Persaud et al. (5) conducted an evaluation of offset left-turn lane installations in Florida, Nebraska, and Wisconsin. Florida and Nebraska utilized pavement-marking adjustments or implemented minor construction to improve the left-turn lane offset at left-turn lanes. While the offset was improved at each site, most improvements did not result in a positive offset, and the results showed little or no effect on total crashes. In contrast, Wisconsin created significant positive offsets by reconfiguring left-turn lanes through major construction projects. These improvements resulted in significant reductions in all crash types investigated: total crashes by 34%, injury crashes by 36%, left-turn crashes by 38%, and rear-end crashes by 32%.
Design Considerations
The AASHTO Green Book states that for medians wider than about 18 ft, it is desirable to offset a left-turn lane to improve the visibility of oncoming traffic for left-turning drivers (6). The Green Book also presents advantages of offset left-turn lanes: (1) better visibility of opposing through traffic; (2) decreased chances for conflict between opposing left-turn movements within the intersection; and (3) more left-turn vehicles served in a given period of time, particularly at a signalized intersection (6). Illustrations of parallel and tapered offset left-turn lanes are presented in the Green Book, and guidance suggests that tapered offset left-turn lanes are normally constructed with a 4-ft nose between the left-turn lane and the opposing through lanes (6).
Cross References
Key References
1. Song, Y., M. Chitturi, W. Bremer, A. Bill, and D. Noyce. (2022). Review of United States research and guidelines on left turn lane offset: Unsignalized intersections and signalized intersections with permitted left turns. Journal of Traffic and Transportation Engineering, 9(4), 556–570.
2. Srinivasan, R., B. Lan, D. Carter, S. Smith, and K. Signor. (2019). Safety Evaluation of Flashing Yellow Arrows at Signalized Intersections. (FHWA-HRT-19-036). Washington, DC: FHWA.
3. Brehmer, C. L., Kacir, K. C., Noyce, D. A., and Manser, M. P. (2003). NCHRP Report 493: Evaluation of Traffic Signal Displays for Protected/Permissive Left-Turn Control. Transportation Research Board of the National Academies, Washington, DC.
4. FHWA. (2023). Manual on Uniform Traffic Control Devices for Streets and Highways. (11th ed.). Washington, DC.
5. Persaud, B., C. Lyon, K. Eccles, N. Lefler, and F. Gross. (2009). Safety Evaluation of Offset Improvements for Left-Turn Lanes. (FHWA-HRT-09-035). Washington, DC: FHWA.
6. AASHTO. (2018). A Policy on Geometric Design of Highways and Streets (7th ed.). Washington, DC.
This page intentionally left blank.


