Human Factors Guidelines for Road Systems: Third Edition (2025)
Chapter: 5 Sight Distance

CHAPTER 5
Sight Distance
Key Components of Sight Distance
Determining Stopping Sight Distance
Determining Intersection Sight Distance
Determining When to Use Decision Sight Distance
Determining Passing Sight Distance
Influence of Speed on Sight Distance
Key References for Sight Distance Information
Where to Find Sight Distance Information for Specific Roadway Features
KEY COMPONENTS OF SIGHT DISTANCE
Introduction
Sight distance (SD) is the distance that a vehicle travels before completing a maneuver in response to some roadway element, obstacle (i.e., any obstacle on the roadway, such as an animal, a pothole, an object, or a stalled vehicle), or other condition that necessitates a change of speed and/or path. Sight distance is based on two key components:
- The perception-reaction time (PRT) required to initiate a maneuver (pre-maneuver phase).
- The time required to safely complete a maneuver (MT).
The PRT component is the sum of the time needed to see/perceive the roadway element, complete relevant cognitive operations (e.g., recognize hazard and implications of its presence, read sign, decide how to respond), and initiate a maneuver (e.g., take foot off accelerator and step on brake pedal).
MT includes actions and time required to safely coordinate and complete a required driving maneuver (e.g., stop at intersection, pass a vehicle, etc.). Typically, a vehicle maintains its current speed and trajectory during the PRT phase, while changing its speed and/or path during the MT phase.

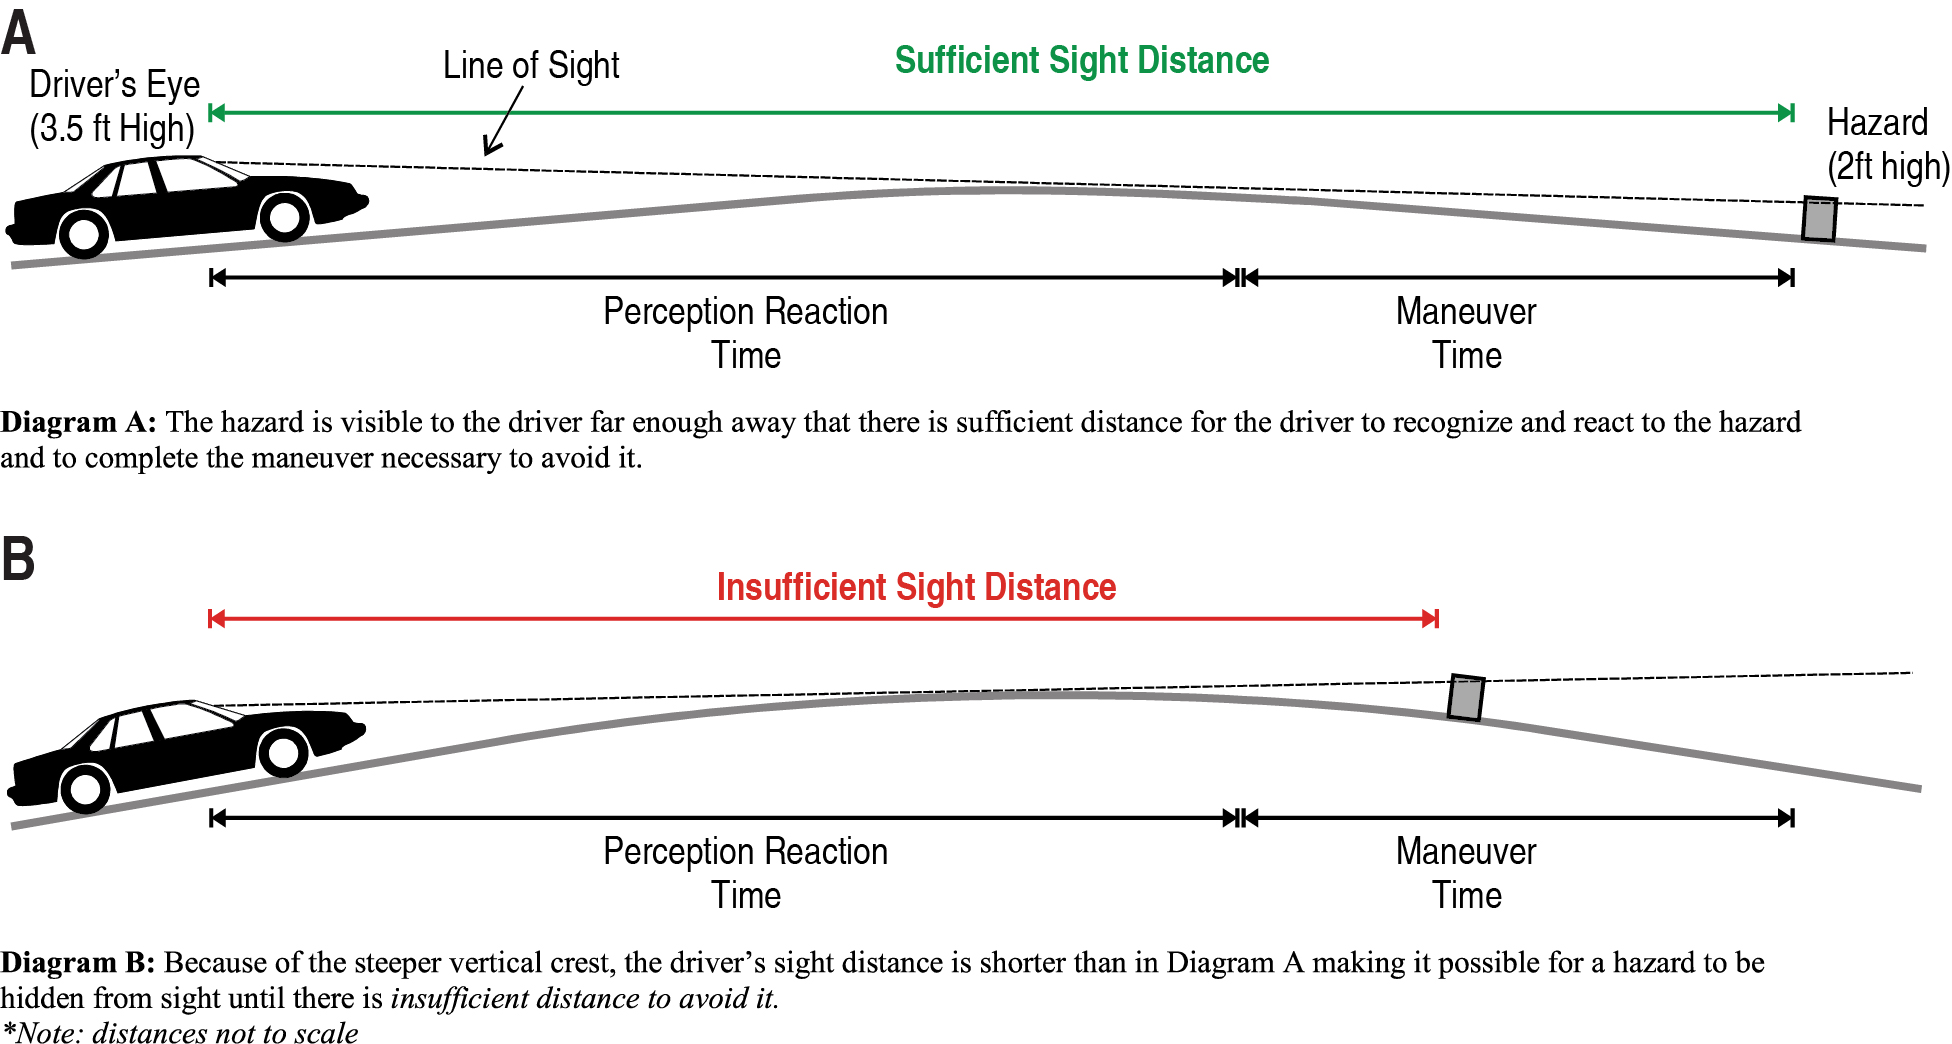
SCHEMATIC SHOWING THE PERCEPTION-REACTION TIME AND MANEUVER TIME COMPONENTS OF SIGHT DISTANCE
Long Description.
Each diagram shows a road with a crest in the middle. On one side of the diagram is a car, and the driver's eye is labeled as being 3.5 feet high. On the opposite side of the crest is a 2-foot-high hazard. Segments of the road are labeled Perception Reaction Time and Maneuver Time. In Diagram A, there is sufficient sight distance for the vehicle traveling over the crest. In Diagram B, the crest is steeper than in Diagram A, and the approaching car has insufficient sight distance traveling over the crest. Diagram A: The hazard is visible to the driver far enough away that there is sufficient distance for the driver to recognize and react to the hazard to complete the maneuver necessary to avoid it. Diagram B: Because of the steeper vertical crest, the driver’s sight distance is shorter than in Diagram A making it possible for a hazard to be hidden from sight until there is insufficient distance to avoid it.
Discussion
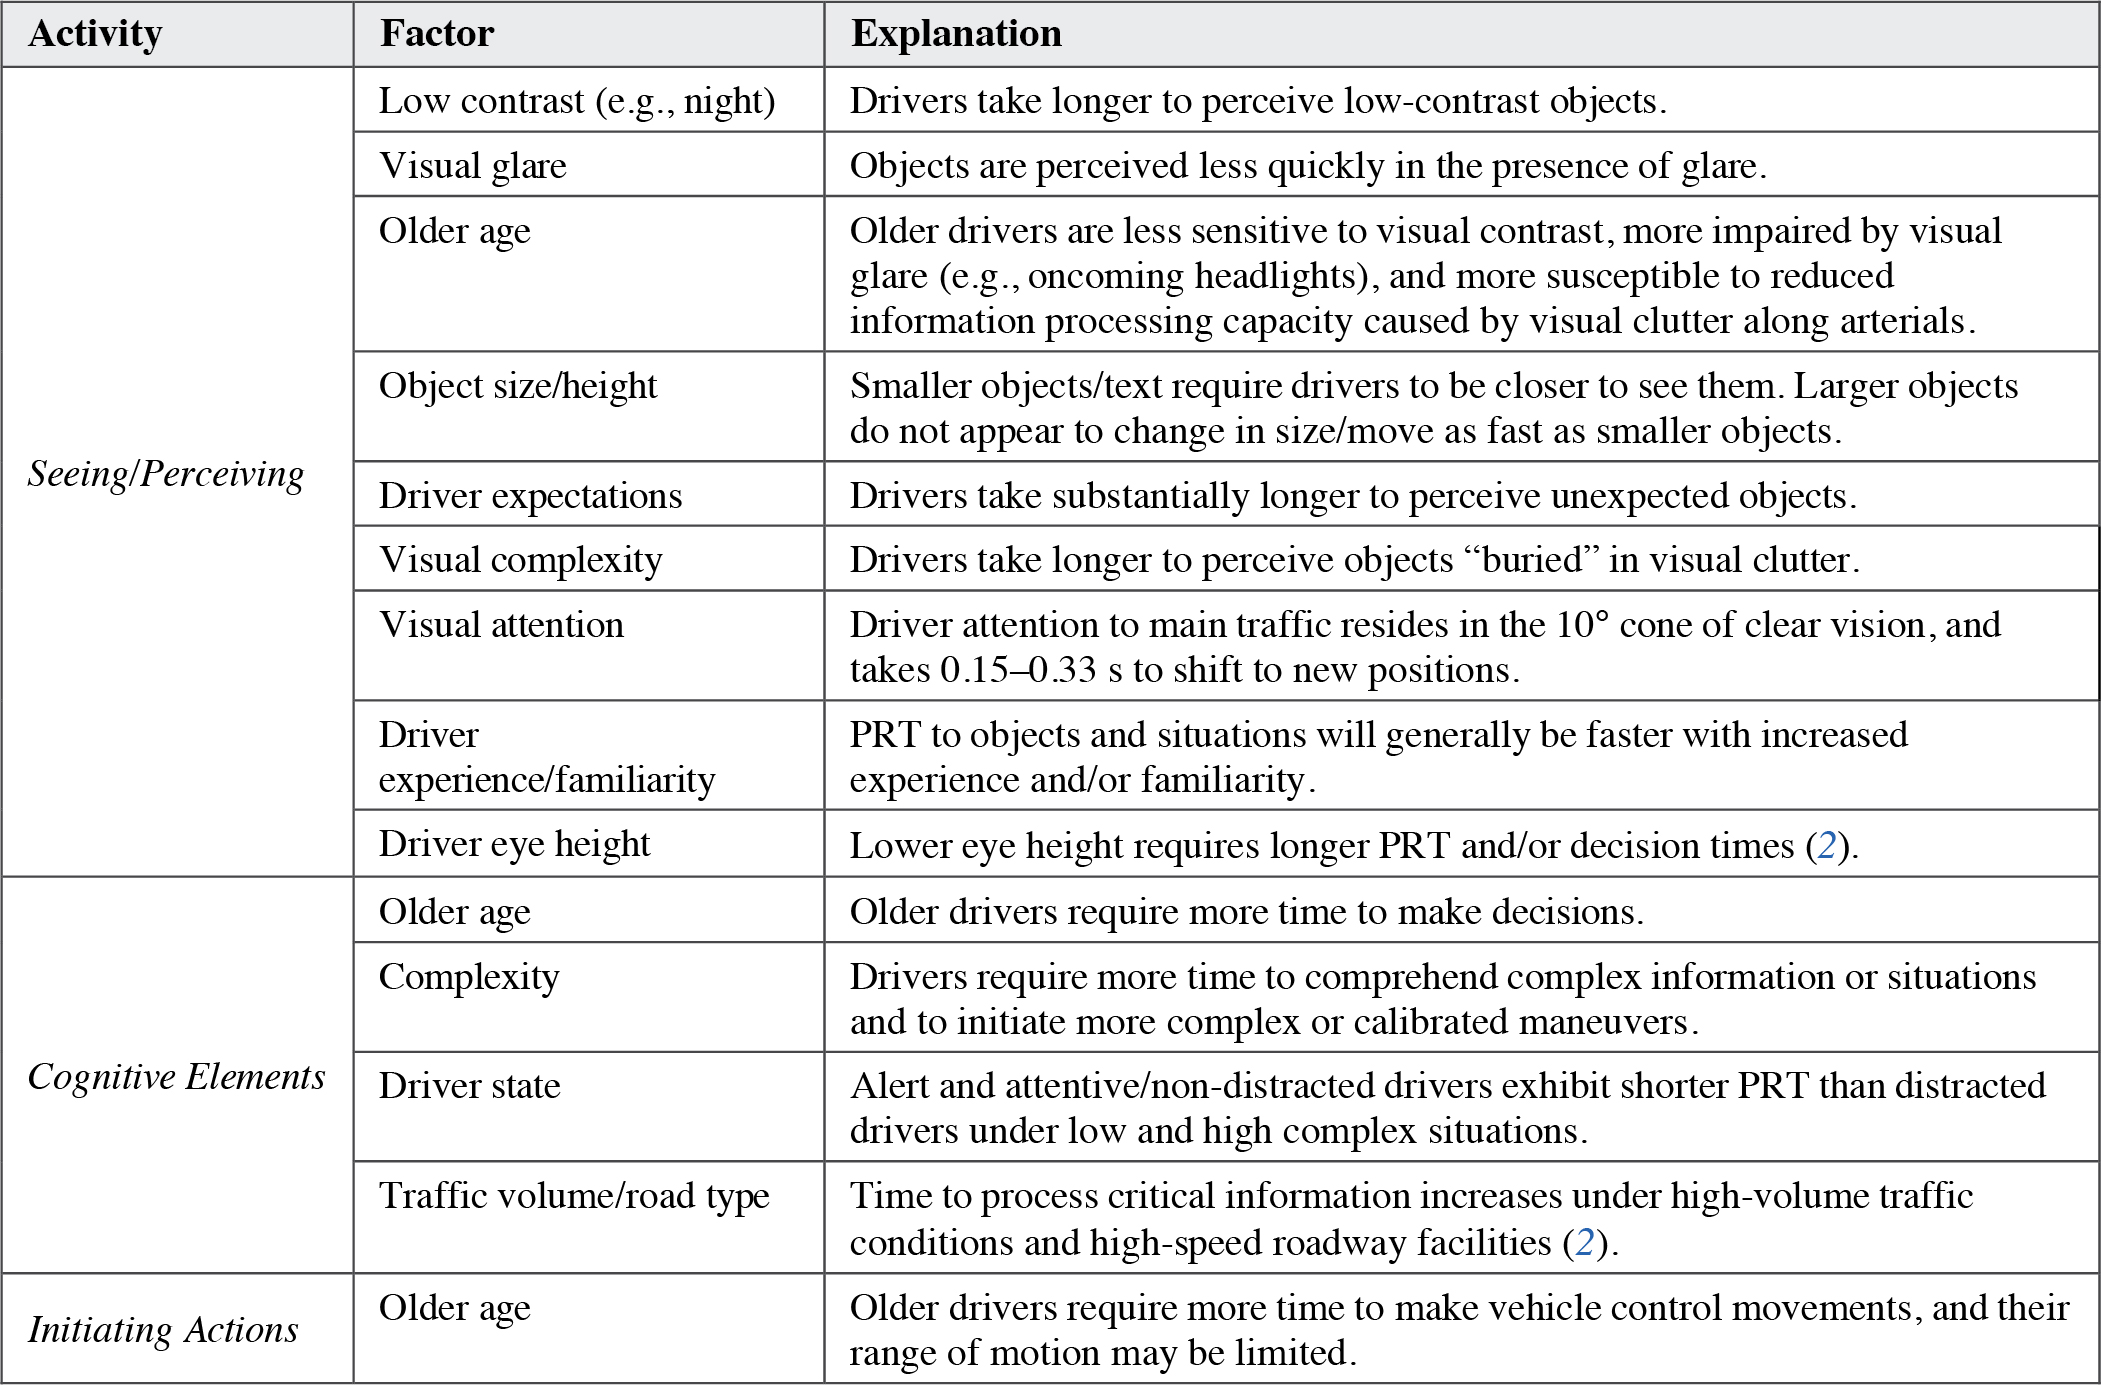
Before drivers can execute a maneuver, they must first recognize that some action is required and decide what that action should be. Therefore, this mental activity—perception, cognition, and action planning—precedes an overt vehicle control action and takes some amount of time to execute. PRT is typically defined as the period from the time the object or condition requiring a response becomes visible in the driverʼs field of view to the moment of initiation of the vehicle maneuver (e.g., first contact with the brake pedal). Although a particular PRT value [e.g., 2.5 s (1)] is used in deriving sight distance requirements for a given design situation, this PRT value should not be viewed as a fixed human attribute, because it is influenced by many factors. Some of the key factors that influence PRT are shown in the table below.
Long Description.
The table has three columns. Column 1: Activity, Column 2: Factor. Column 3: Explanation. Column 1 is divided into 3 rows: Row 1: Seeing / Perceiving, Row 2: Cognitive Elements, Row 3: Initiating Actions. Row 1 is divided into 9 rows in columns 2 and 3. Row 1.1, Column 2: Low contrast, for example, night. Column 3: Drivers take longer to perceive low-contrast objects. Row 1.2, Column 2: Visual glare. Column 3: Objects are perceived less quickly in the presence of glare. Row 1.3, Column 2: Older age. Column 3: Older drivers are less sensitive to visual contrast, more impaired by visual glare, e.g. oncoming headlights, and more susceptible to reduced information processing capacity caused by visual clutter along arterials. Row 1.4, Column 2: Object size / height. Column 3: Smaller objects/text require drivers to be closer to see them. Larger objects do not appear to change in size/move as fast as smaller objects. Row 1.5, Column 2: Driver expectations. Column 3: Drivers take substantially longer to perceive unexpected objects. Row 1.6, Column 2: Visual complexity. Column 3: Drivers take longer to perceive objects “buried” in visual clutter. Row 1.7, Column 2: Visual attention. Column 3: Driver attention to main traffic resides in the 10 degree cone of clear vision, and takes 0.15 to 0.33 seconds to shift to new positions. Row 1.8, Column 2: Driver experience / familiarity. Column 3: PRT to objects and situations will generally be faster with increased experience and/or familiarity. Row 1.9, Column 2: Driver eye height. Column 3: Lower eye height requires longer PRT and/or decision times, note for Key Reference 2. Row 2.1, Column 2: Older age. Column 3: Older drivers require more time to make decisions. Row 2.2, Column 2: Complexity. Column 3: Drivers require more time to comprehend complex information or situations and to initiate more complex or calibrated maneuvers. Row 2.3, Column 2: Driver state. Column 3: Alert and attentive/non-distracted drivers exhibit shorter PRT than distracted drivers under low and high complex situations. Row 2.4, Column 2: Traffic volume / road type. Column 3: Time to process critical information increases under high-volume traffic conditions and high-speed roadway facilities, note for Key Reference 2. Row 3.1, Column 2: Older Age. Column 3: Older drivers require more time to make vehicle control movements, and their range of motion may be limited.
In contrast to the PRT, the MT is primarily affected by the physics of the situation, including vehicle performance capabilities and deceleration. In particular, tire-pavement friction, road surface conditions (e.g., ice, rain, etc.), and downgrades can increase MT or make some maneuvers higher speeds that increase crash potential. MT is also affected to a lesser extent by driver-related factors (e.g., deceleration profile), but these factors are highly situation specific because the maneuvers are very different (e.g., emergency stop, passing, left turn through traffic, etc.).
Design Considerations
Although most design requirements are expressed as a design distance in which a driver can perceive and react, from the driverʼs perspective, the critical aspect is time. Time is required to recognize a situation, understand its implications, decide on a reaction, and initiate the maneuver. While this process may seem almost instantaneous to us when driving, it can translate into hundreds of feet at highway speeds before a maneuver is even initiated. Speed selection is also critical because the relative speed between the driver and the hazard determines how much distance is traversed in the time to complete the maneuver.
Cross References
Determining Intersection Sight Distance
Determining When to Use Decision Sight Distance
Determining Passing Sight Distance
Key References
1. AASHTO. (2018). A Policy on Geometric Design of Highways and Streets (7th ed.). Washington, DC.
2. Layton, R., and Dixon, K. (2012). Decision Sight Distance. Salem, OR: Oregon State University.
DETERMINING STOPPING SIGHT DISTANCE
Introduction
Stopping sight distance (SSD) is the distance from a stopping requirement (such as an obstacle) that is required for a vehicle traveling at or near design speed to be able to stop before reaching that stopping requirement. SSD depends on: 1) the time required for a driver to perceive and react to the stopping requirement (PRT) and 2) how aggressively the driver decelerates (MT). MT on crest vertical curves is affected by driver eye height and object height (see figure on page 5-2), in addition to factors that influence deceleration (1). Note that in this guideline, a hazard refers to any object, obstacle, or condition that requires the driver to decelerate to a stop.

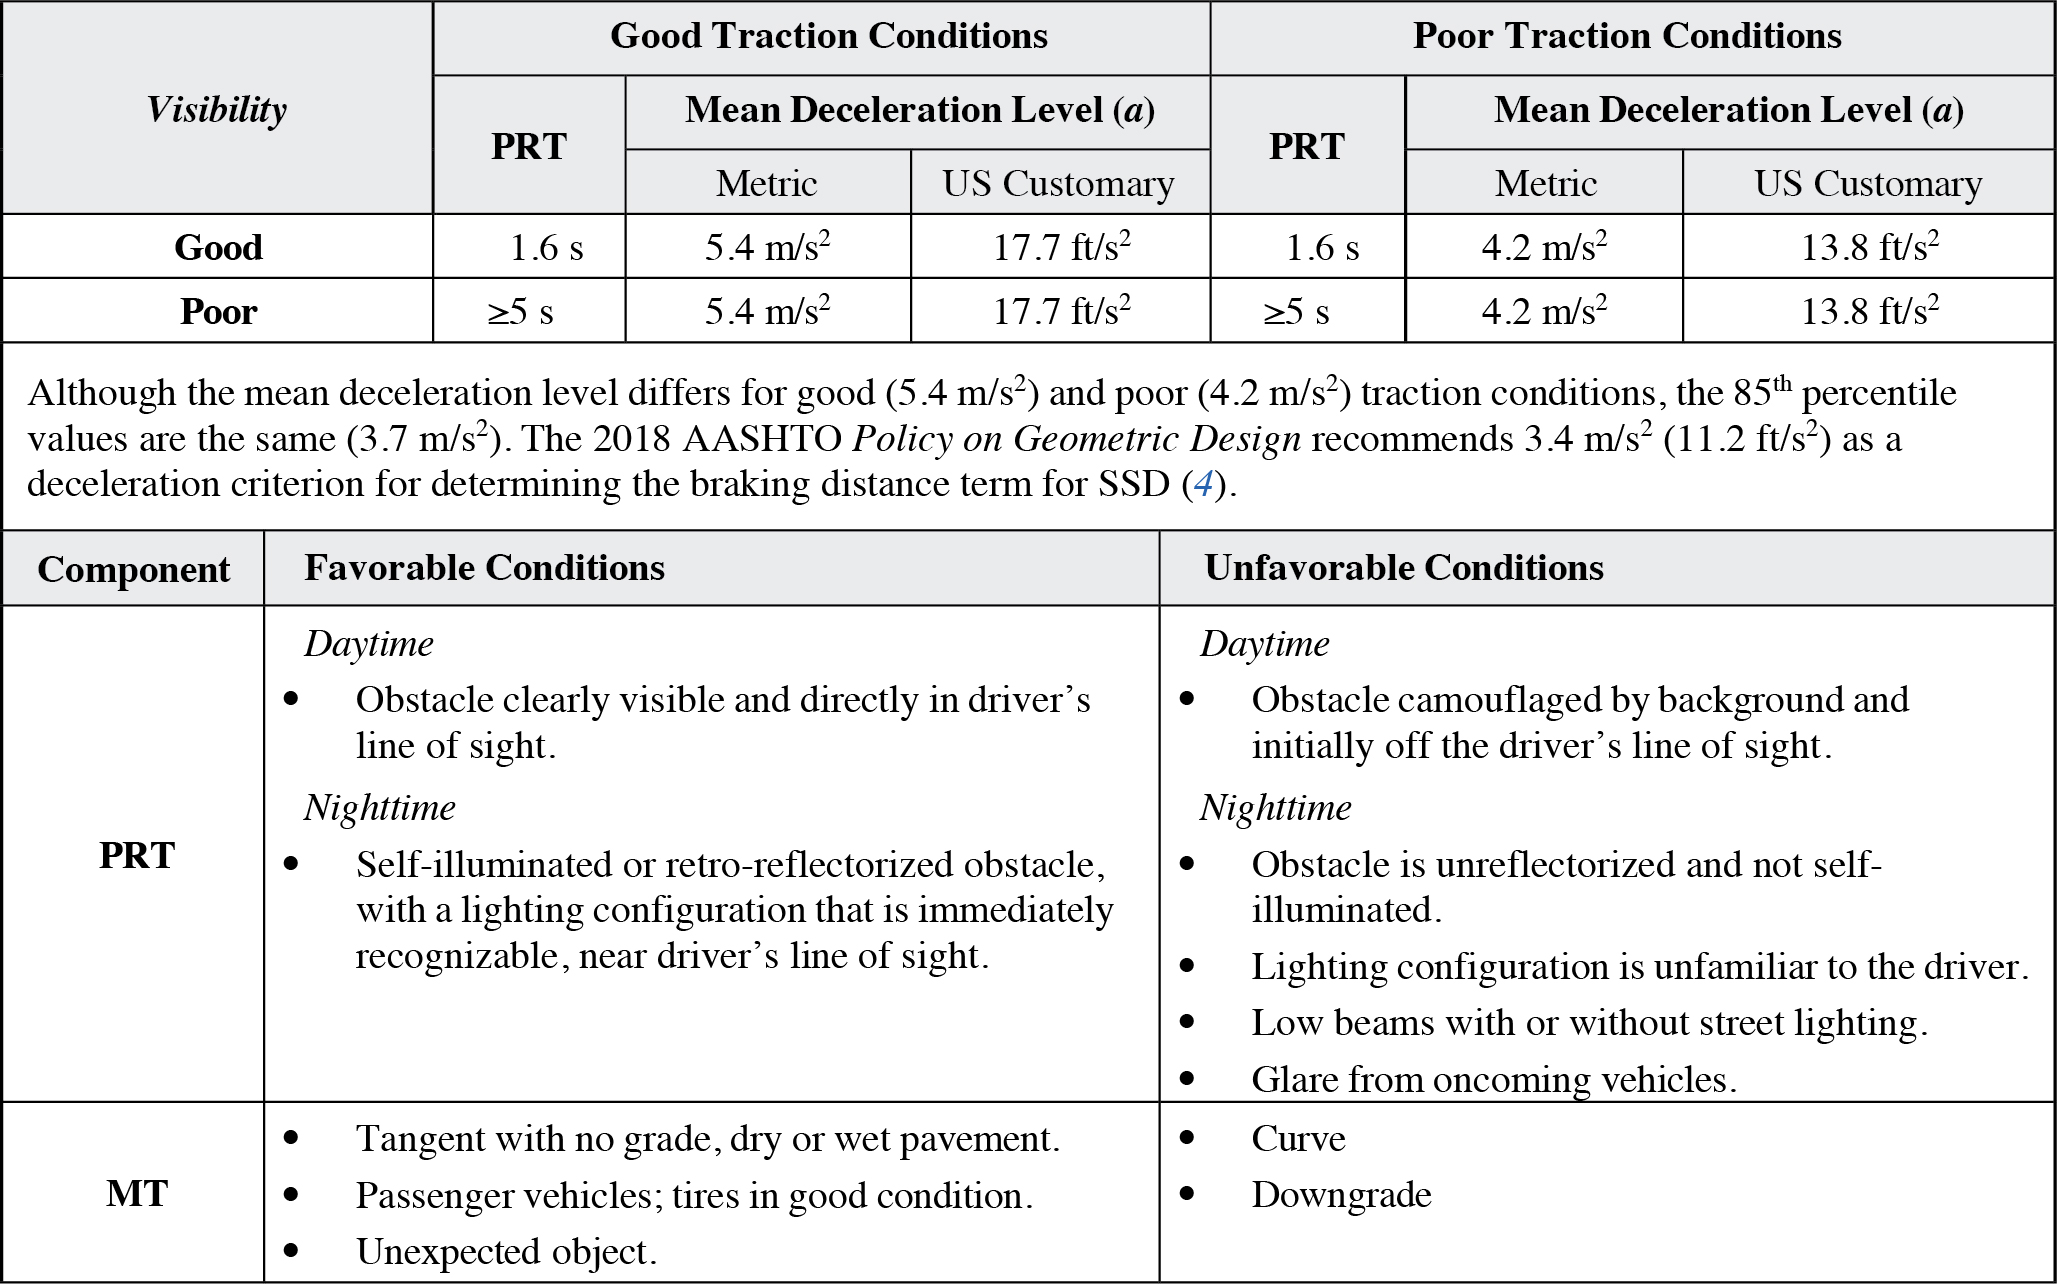
The following table presents driver PRTs and mean deceleration levels under favorable and unfavorable conditions calculated from driver responses to unexpected roadway obstacles (2, 3). The mean deceleration rates and 85th percentile values (3.7 m/s2) are higher than those recommended in Lerner, Huey, McGee and Sullivan (2), but are shown to provide an indication of driver performance capabilities under emergency conditions.
Long Description.
The first part of the table lists the PRT and mean deceleration level under good and poor traction conditions and visibility: Under good visibility and good traction conditions, the P R T is 1.6 seconds. The mean deceleration level is 5. 4 meters per second squared or 17.7 feet per second squared. Under good visibility and poor traction conditions, the PRT is 1.6 seconds, and the mean deceleration level is 4.2 meters per second squared or 13.8 feet per second squared. Under poor visibility and good traction conditions, the PRT is 5 seconds or more and the mean deceleration level is 5.4 meters per second squared or 17.7 feet per second squared. Under poor traction conditions and poor visibility, the PRT is 5 seconds or more and the mean deceleration level is 4.2 meters per second squared or 13.8 feet per second squared.The following text comes after the table: Although the mean deceleration level differs for good (5.4 meters per second squared) and poor (4.2 meters per second squared) traction conditions, the 85th percentile values are the same (3.7 meters per second squared). The 2018 AASHTO Policy on Geometric Design recommends 3.4 meters per second squared (11.2 feet per second squared) as a deceleration criterion for determining the braking distance term for SSD, note for Key Reference 4. Below that text another table describes the effects of favorable and unfavorable conditions on PRT and MT. Favorable conditions for PRT in Daytime: Obstacle clearly visible and directly in driver’s line of sight. In nighttime: Self-illuminated or retro-reflectorized obstacle, with a lighting configuration that is immediately recognizable, near driver’s line of sight. Favorable conditions for MT: Tangent with no grade, dry or wet pavement. Passenger vehicles; tires in good condition. Unexpected object. Unfavorable conditions for PRT in Daytime: Obstacle camouflaged by background and initially off the driver’s line of sight. In nighttime: Obstacle is unreflectorized and not self-illuminated. Lighting configuration is unfamiliar to the driver. Low beams with or without street lighting. Glare from oncoming vehicles.
Discussion
The PRT stage is significantly influenced by visibility conditions. In particular, the distance at which drivers can see an unilluminated, unreflectorized obstacle depends on their headlights, their sensitivity to contrast, and their expectation of seeing an obstacle. When drivers are not expecting a particular low-contrast obstacle, their SSD is one-half of that which would pertain if the object were expected. At speeds of 60 km/h and greater, using low-beam headlights, most drivers will be too close to an unexpected, unreflectorized obstacle at the point they can detect a very-low-contrast obstacle in time to stop. Also, the PRT component can be further increased by high workload (e.g., traffic merging, reading signs), fatigue, and impairment.
The deceleration maneuver is significantly influenced by road surface conditions. A greater design speed will result in less skid resistance, which will deviate deceleration from the design standard of 3.4 m/s2 (11.2 ft/s2). However, stopping is also influenced by the deceleration level that a driver adopts (which affects the braking efficiency). Under wet conditions, with standard brakes, the mean constant deceleration is about 0.43 g (54% of the pavementʼs coefficient of friction), and the 85th percentile is 0.38 g (47%). On wet pavements with anti-locking brake systems (ABSs), the mean constant deceleration is about 0.53 g (66% of the pavementʼs coefficient of friction), and the 85th percentile is about 0.45 g (56%). Under unfavorable conditions, slightly lower braking efficiencies (by 2% to 8%) are obtained on curves and tangents, but this information is based on physics because no human factors studies are available. Note also that downgrade MT can be increased by age and gender because older drivers and women will not apply as much braking force as younger drivers and males. Some research suggests that under most rushed braking situations, drivers stop rapidly, but not to the point of locked wheel braking (in locked wheel braking, which is typical in crashes, drivers are 100% efficient in making use of the available pavement friction) (3). The mean maximum deceleration in one comprehensive study was about 75% of the pavementʼs coefficient of friction (3).
Design Considerations
SSD should always be provided because any road location can include an obstacle. One study found that the most common objects hit on sight-restricted curves were large animals and parked cars [e.g., as provided by AASHTO (4)], the presence of which can create an obstacle on any road section (3). If SSD is below standard at a number of locations, then priorities must be set. Some examples of hazards and conditions that may be high priority with respect to the need for SSD are:
- Change in lane width
- Reduction in lateral clearance
- Beginning of hazardous side slope
- Crest vertical curve
- Horizontal curve
- Driveway
- Narrow bridge
- Roadside hazards (e.g., boulder markers at driveways)
- Unmarked crossovers on high-speed rural arterials
- Unlit pedestrian crosswalks
- High-volume pedestrian crosswalks
- Frequent presence of parked vehicles very near or intruding into through lane
For design purposes, neither rapid nor locked wheel braking is a desirable driver response because of the potential for skidding or of a rear-end crash when there is a following vehicle. It should also be noted that the AASHTO model of driver deceleration assumes constant deceleration throughout the braking maneuver; however, empirical data suggest that maximum deceleration is generally not exhibited until the last part of the braking when the vehicle has slowed and come closer to the unexpected object (3). Under wet conditions, the 95th percentile value for equivalent constant deceleration without ABSs was 0.29 g (equivalent to 2.8 m/s2 [9.3 ft/s2]) and with ABSs, 0.41 g (equivalent to 4 m/s2 [13.2 ft/s2]).
Many design references use the term “design speed” to characterize the expected driving speed on a roadway. However, as noted in “Influence of Speed on Sight Distance” (page 5-12 of this document), neither design speed nor posted speed is always the best determinant of actual driving speed. When available, actual operating speeds should be used instead of design speed to help determine needed sight distance.
MT on crest vertical curves is affected by eye height and object height. AASHTO (4) uses anthropometric models that estimate eye height of 1,080 mm (3.5 ft) and object height of 600 mm (2.0 ft) when computing SSD in passenger vehicles. This estimate of eye height has been periodically adjusted as the average height of vehicles changes (1).
Cross References
Key Components of Sight Distance
Determining Intersection Sight Distance
Determining When to Use Decision Sight Distance
Key References
1. Layton, R., and Dixon, K. (2012). Stopping Sight Distance. Salem, OR.
2. Lerner, N., Huey, R. W., McGee, H. W., and Sullivan, A. (1995). Older Driver Perception-Reaction Time for Intersection Sight Distance and Object Detection. Volume I, Final Report. (FHWA-RD-93-168). Washington, DC: FHWA.
3. Fambro, D. B., Fitzpatrick, K., and Koppa, R. J. (1997). NCHRP Report 400: Determination of Stopping Sight Distances. TRB, National Research Council, Washington, DC.
4. AASHTO. (2018). A Policy on Geometric Design of Highways and Streets (7th ed.). Washington, DC.
DETERMINING INTERSECTION SIGHT DISTANCE
Introduction
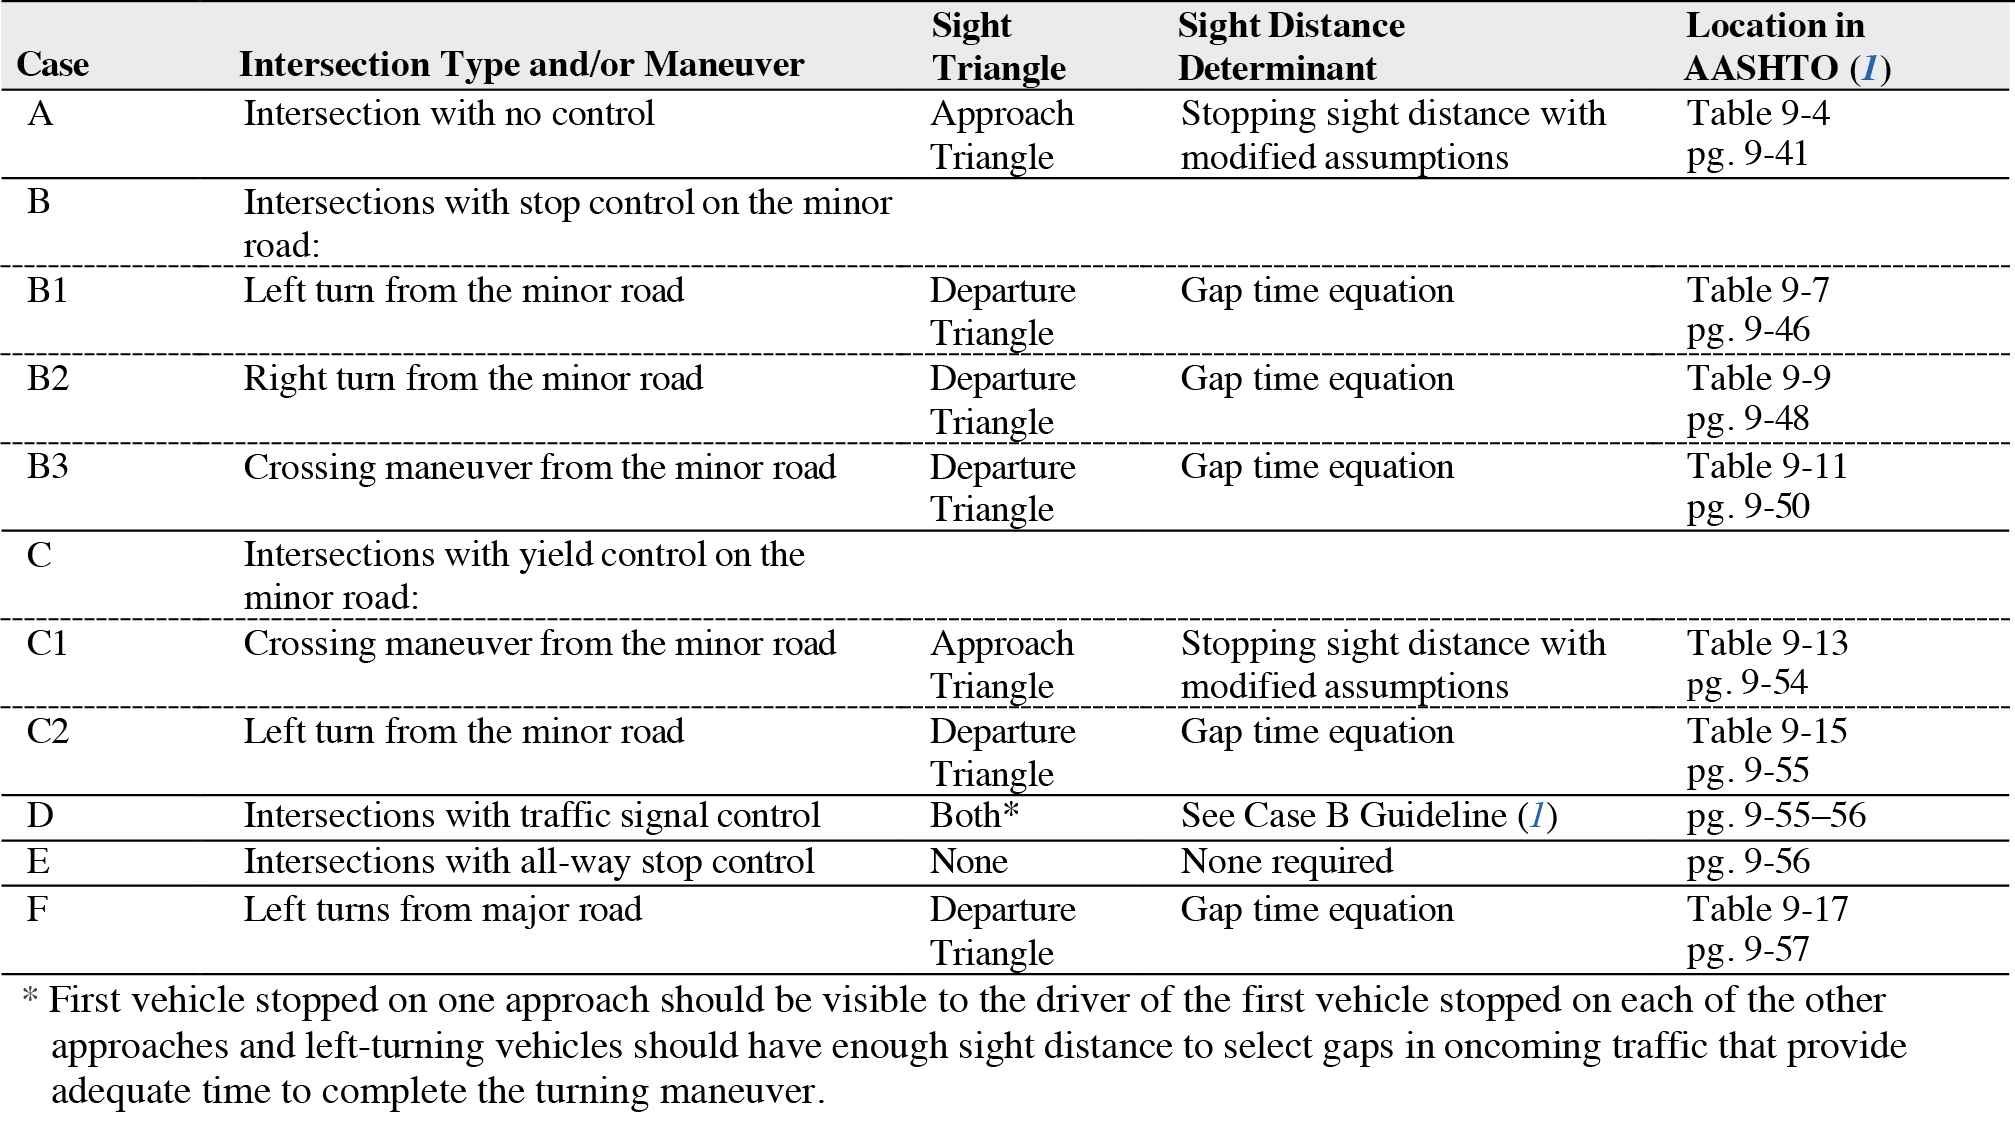
Providing stopping sight distance at intersections is fundamental to intersection operation. Drivers require an unobstructed view of the entire intersection, including any traffic control devices, and sufficient lengths along the intersecting highway to permit the driver to identify acceptable gaps in cross traffic and to anticipate and avoid potential crashes with other vehicles. Thus, intersection sight distance (ISD) differs depending on the type of intersection and maneuver involved. The different types of ISD are summarized in the table below.

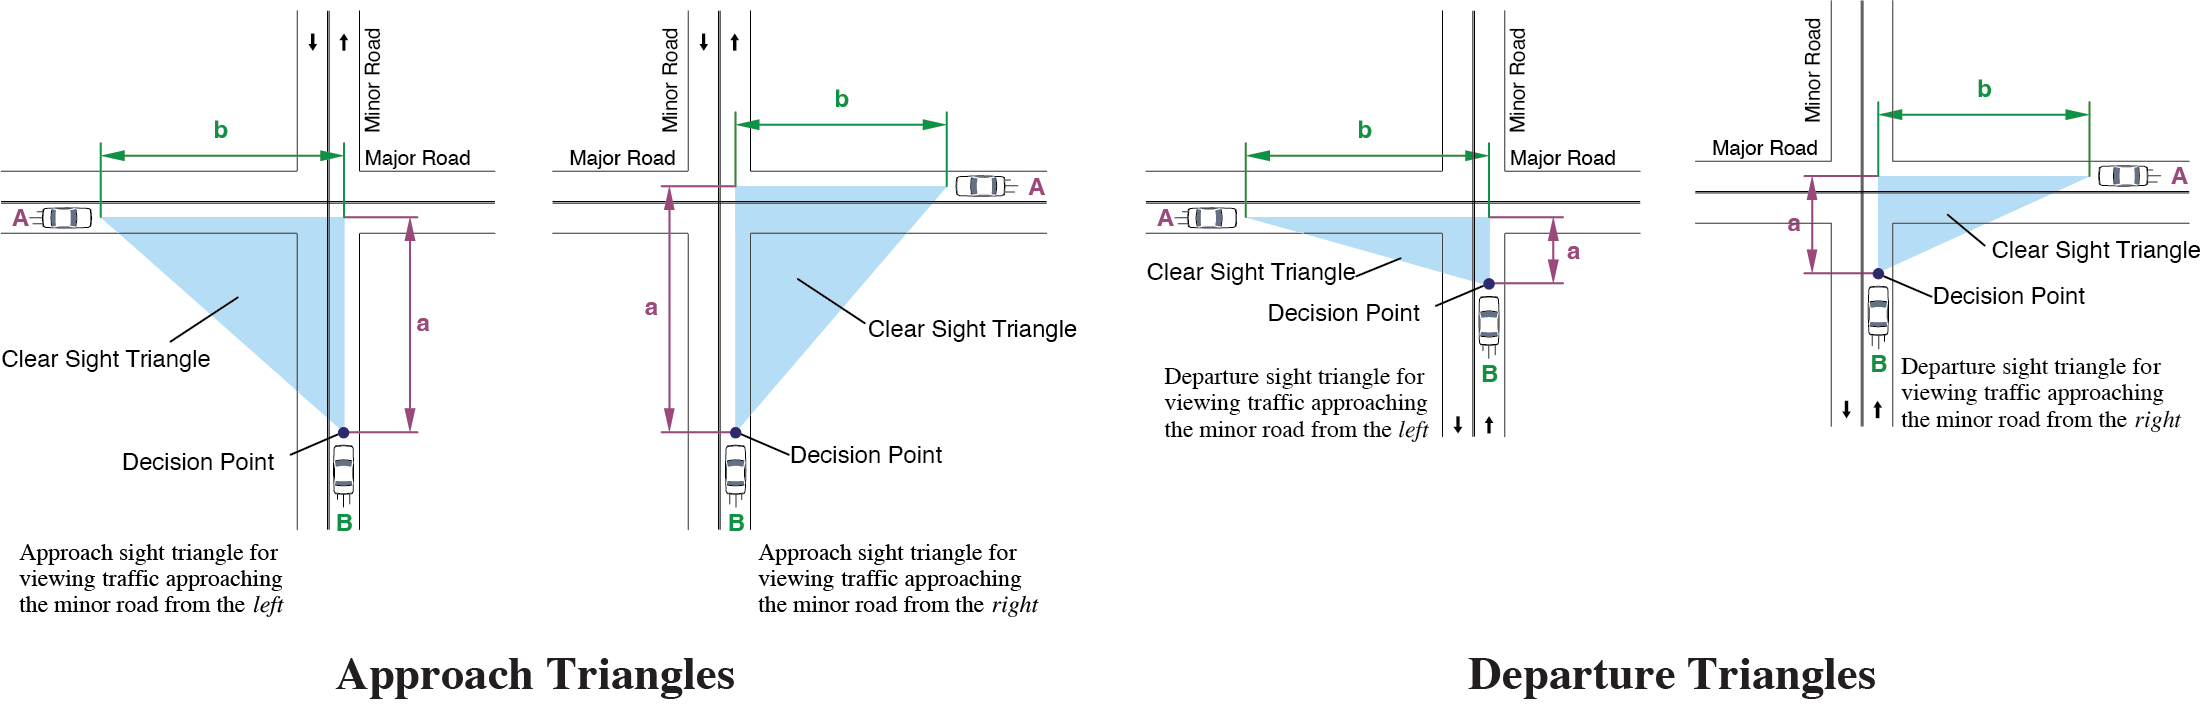
The figure below shows the approach and departure sight triangles for different intersections/maneuvers. These triangles represent areas along intersection approach legs and across corners where visibility is clear of obstructions.
Long Description.
Approach triangles: The illustration shows two four-lane intersections of a minor road and a major road. The intersection has a clear sight triangle and decision point. In the first intersection, the approach sight triangle is for viewing traffic approaching the minor road from the left. In the second intersection, the approach sight triangle is for viewing traffic approaching the minor road from the right. Departure Triangles: The illustration shows two four-lane intersections of a minor road and a major road. The intersection has a clear sight triangle and decision point. In the first intersection, the departure sight triangle is for viewing traffic approaching the minor road from the left. In the second intersection, the departure sight triangle is for viewing traffic approaching the minor road from the right.
Discussion
The two types of sight triangles used in calculating ISD are described below.
Approach Sight Triangles: According to AASHTO (1), “Each quadrant of an intersection should contain a triangular area free of obstructions that might block an approaching driverʼs view of potentially conflicting vehicles. The length of the legs of this triangular area (shown as “a” and “b” in the figure on the previous page), along both intersecting roadways, should be such that the drivers can see any potentially conflicting vehicles in sufficient time to slow or stop before colliding within the intersection.” The vertex of the triangle that is nearest to the approaching driver represents the decision point at which the driver must begin to stop if the driver determines that a potential conflict is possible.
Departure Sight Triangles: According to AASHTO (1), departure sight triangles provide “sight distance sufficient for a stopped driver on a minor-road approach to depart from the intersection and enter or cross the major road.” In this case, the vertex of the sight triangle is positioned over the driver of the stationary departing vehicle, and the length of the triangle represents how far ahead the driver must be able to check for oncoming traffic to ensure there is enough time to traverse the intersection. According to AASHTO (1), the length of the triangle is based on an acceptable gap time (which is independent of oncoming vehicle speed) that provides the departing vehicle with sufficient time to safely accelerate, cross the intersection and thus complete the maneuver. The gap time varies based on the vehicle type (e.g., passenger vehicle, combination truck, etc.) and the distance that the vehicle must cross during the maneuver (e.g., number of lanes) at the design speed of the major road.
Right-turning departure crashes can be reduced by considering suitable design gap acceptance values reflecting the comfortable speed reduction of approaching vehicles. Various field-test experiments have modeled departure sight distance based on actual driving behavior at various design speeds (2). As can be seen in the graph to the right, most of the validation models for departure sight distance based on acceleration deviate from AASHTO standards as the design speeds pass 60 km/h. This suggests that gap acceptance when turning right onto roads with speed limits greater than 50 km/h may require more conservative departure ISD values than the 6.5 s fixed value recommended by AASHTO.
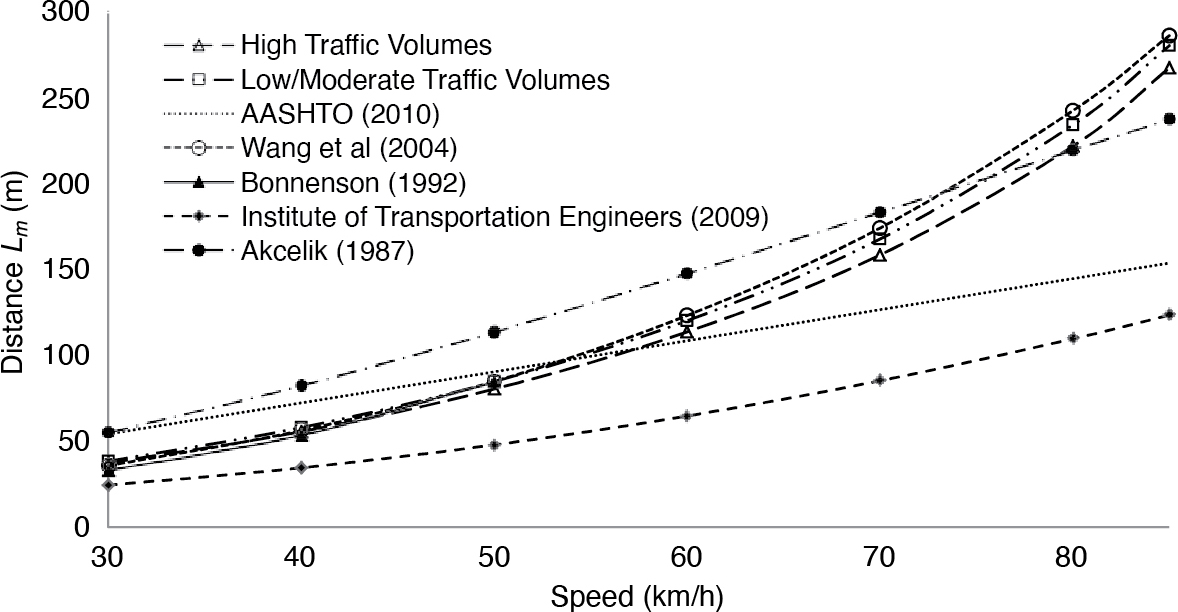
Source: Dabbour (2).
Long Description.
The graph has curves for high traffic volumes, low or moderate traffic volumes, AASHTO (2010), Wang et al (2004), Bonnenson (1992), Institute of Transportation Engineers (2009), and Akcelik (1987). All the curves show an increasing trend.
Design Considerations
Although desirable at higher-volume intersections, approach sight triangles are not necessary at intersections controlled by stop controls or traffic signals, because the stopping requirement is determined by the controls, not by approaching vehicles (1).
Departure sight triangles should be provided in each quadrant of the intersection approach controlled by stop or yield signs, and for some signalized intersections (1). Also, grade adjustments are recommended if the departing vehicleʼs rear wheels are on an upgrade that exceeds 3% at the stop line (1). Skew angle and mainline on a curve also impact the driverʼs ability to acquire the location and speed of the approaching vehicle on the mainline, often resulting in higher crash rates at locations with these geometric characteristics.
Cross References
Key Components of Sight Distance
Determining Stopping Sight Distance
Sight Distance at Left-Skewed Intersections
Sight Distance at Right-Skewed Intersections
Key References
1. AASHTO. (2018). A Policy on Geometric Design of Highways and Streets (7th ed.). Washington, DC.
2. Dabbour, E. (2015). Design Gap Acceptance for Right-Turning Vehicles Based on Vehicle Acceleration Capabilities. Transportation Research Record: Journal of the Transportation Research Board, 2521, 12–21.
DETERMINING WHEN TO USE DECISION SIGHT DISTANCE
Introduction
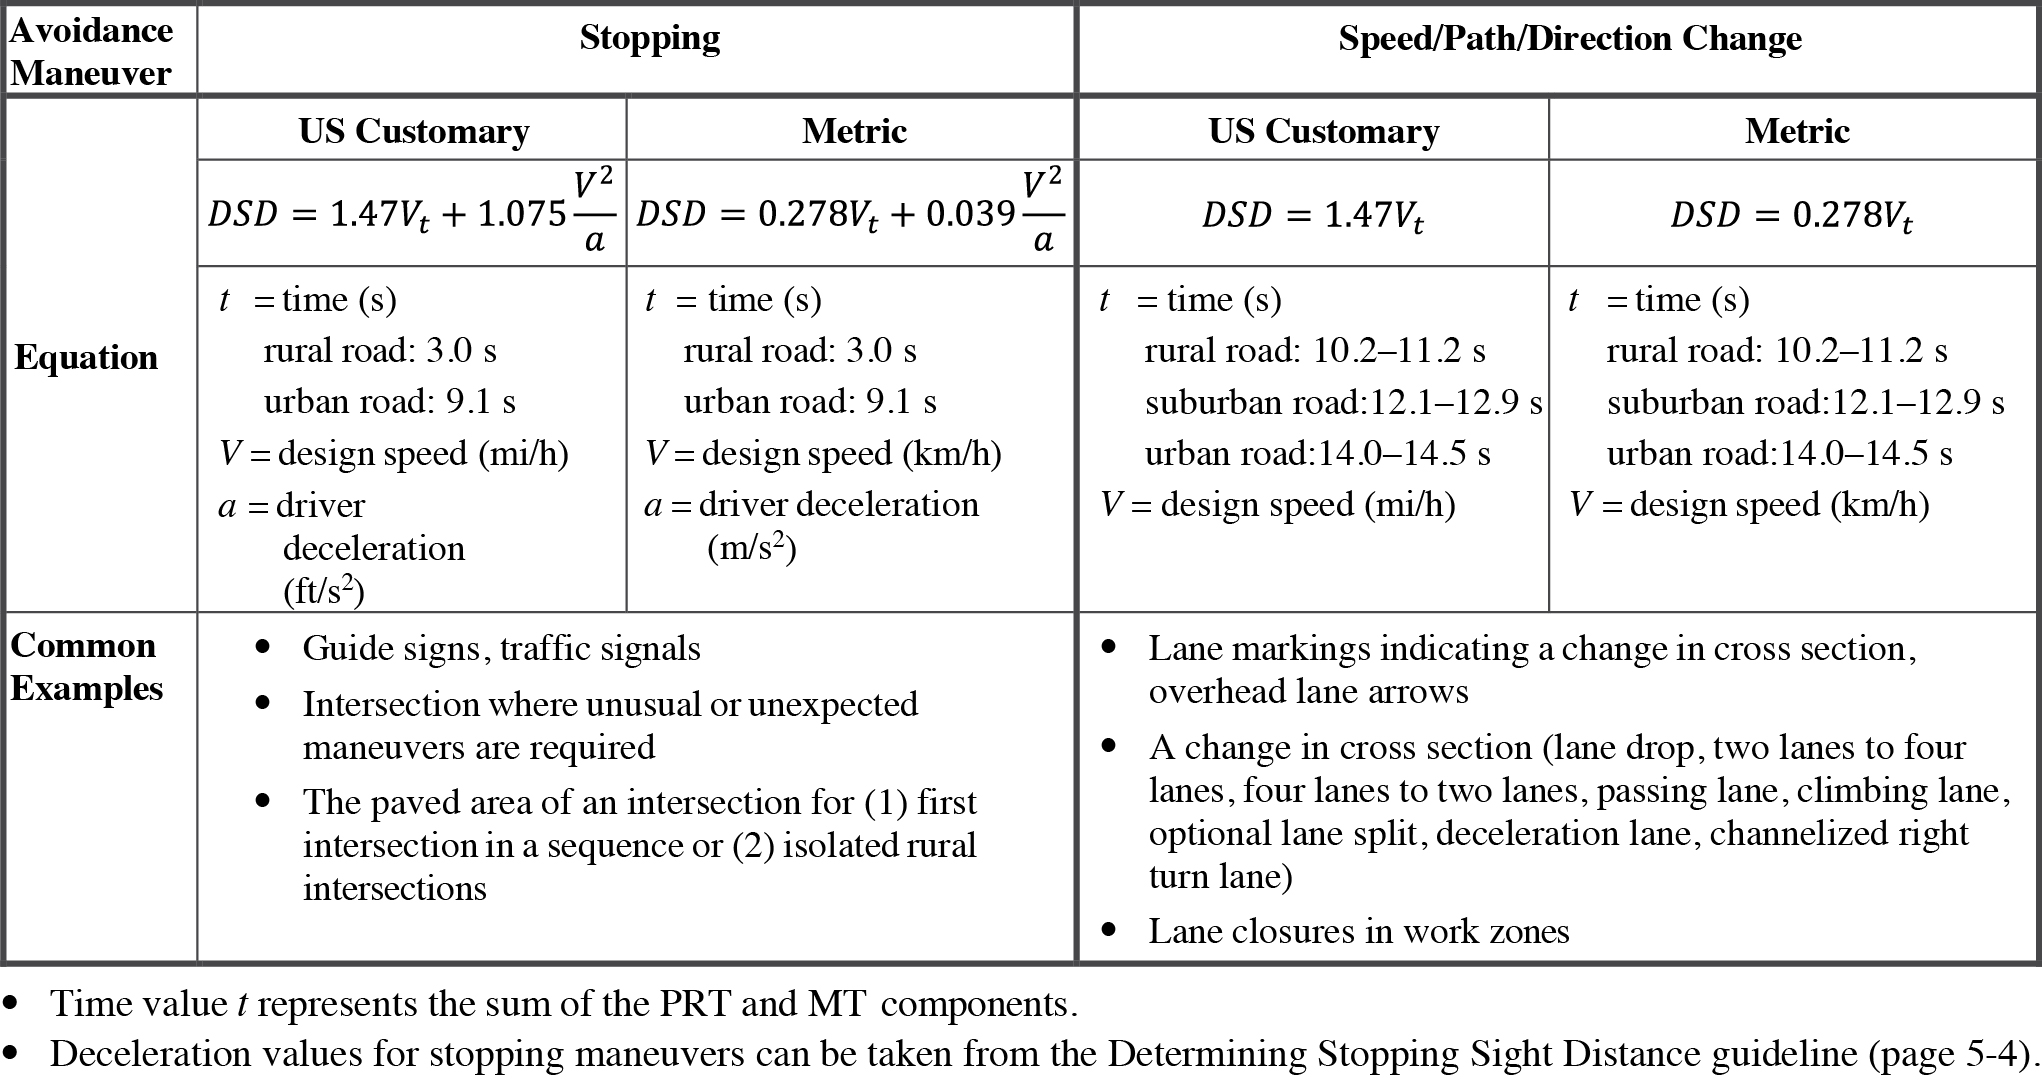
According to AASHTO (1, pg. 3-7), decision sight distance (DSD) represents a longer sight distance than is usually necessary for situations in which (1) drivers must make complex or instantaneous decisions, (2) information is difficult to perceive, or (3) unexpected or unusual maneuvers are required. DSD provides drivers with an additional safety margin for error when there is insufficient sight distance, affording them sufficient length to maneuver their vehicles at the same or reduced speed. The application of DSD in the roadway includes perception and reaction of a queue, adequate time for changes in speed, path, or travel direction, as well as accommodations for truck parking, transit, pedestrians, and bicycles (2).

The figure below illustrates favorable and unfavorable conditions for a speed/path/direction change on an urban road.
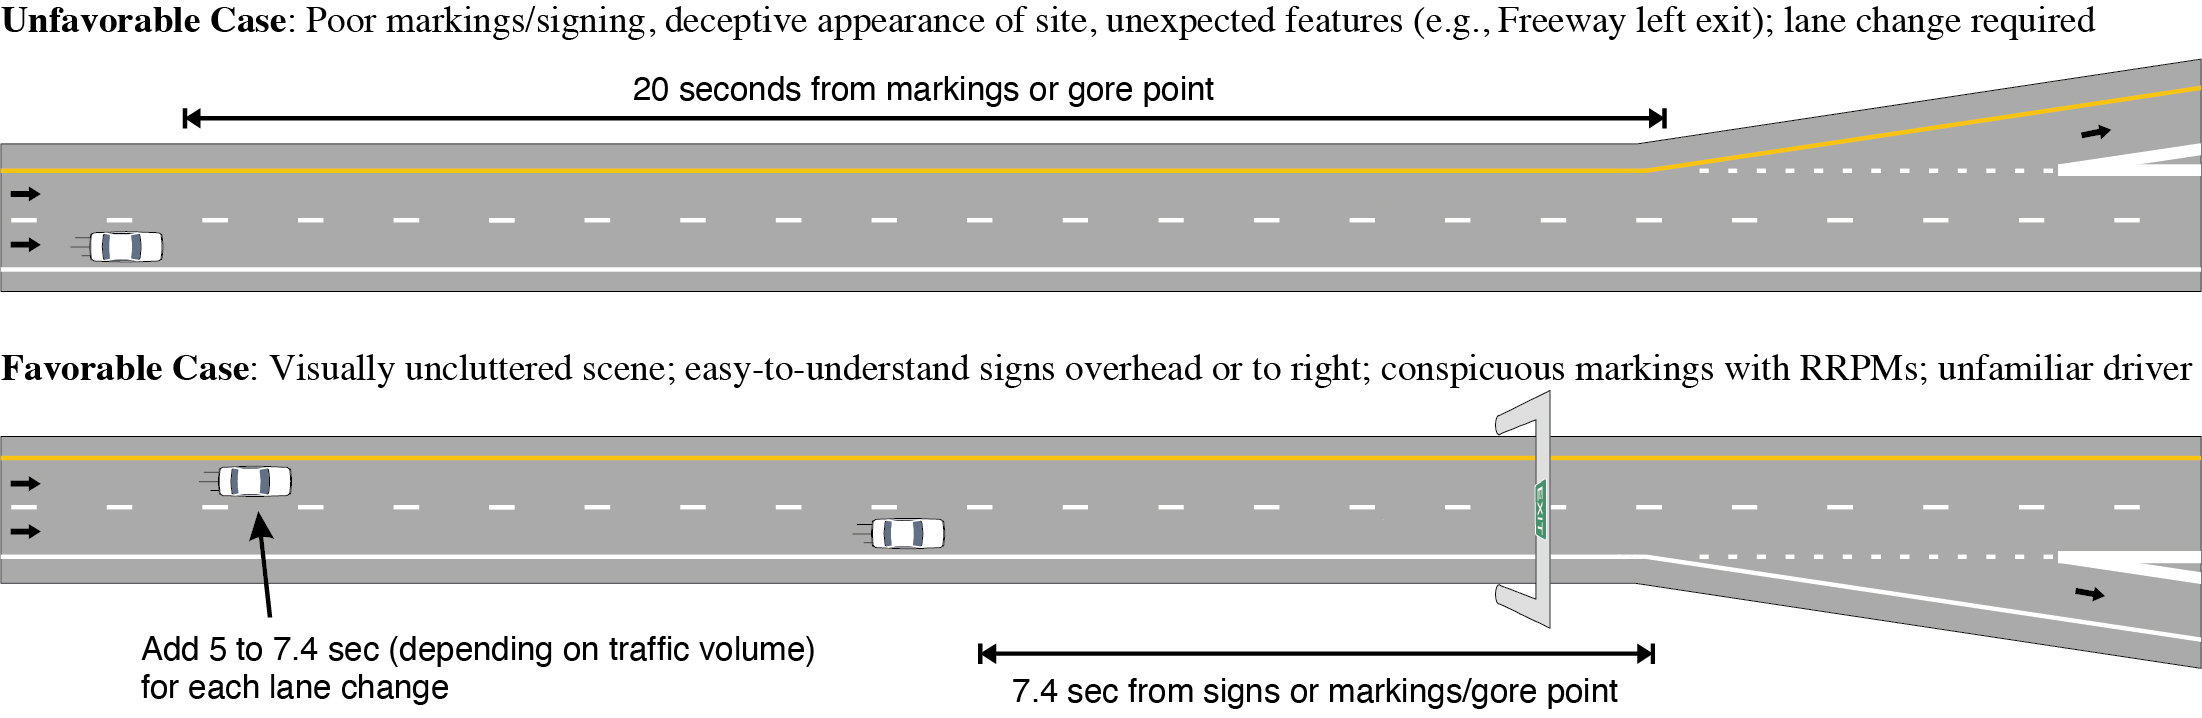
Long Description.
Unfavorable case: Poor markings and signings, deceptive appearance of site, unexpected features (Example Freeway left exit); lane change required. The illustration shows an exit branching off to the left from the main road. The road separation point is 20 seconds from markings or gore point. Favorable case: Visually uncluttered scene; easy-to-understand signs overhead or to right; conspicuous markings with RRPMs; unfamiliar driver. The illustration shows an exit branching off to the right of the main road. The road separation point is 7.4 seconds from signs or markings/gore point.
Discussion
Because some driving situations are particularly challenging (e.g., merging in moderate traffic during a lane drop), drivers require additional time to plan and execute the necessary maneuvers, or additional “safety margin” to compensate for errors they may make in the process. In these situations, use of DSD is appropriate because it incorporates the additional time that drivers need to complete more complicated driver actions. In particular, empirical data indicate that DSD should be sufficiently long to accommodate the 85th percentile values in most challenging driving situations, even for older drivers. The DSD time specifically provides more time so that drivers can do the following:
- Detect an unexpected or difficult-to-perceive information source or condition in a roadway environment that may be visually cluttered (PRT)
- Recognize the condition or its potential threat (PRT)
- Select an appropriate speed and path (PRT)
- Execute the appropriate maneuver safely and efficiently (MT)
In keeping with the components discussed in other sight distance guidelines (page 5-2), the first three of these tasks compose the PRT component while the fourth task is the MT component.
Although application of DSD is typically based on roadway features, certain situational factors can also adversely impact driver responsiveness. The frequent occurrence of the following factors at a site may indicate that the use of DSD is appropriate for that site:
- High driver workload due to concurrent tasks (e.g., traffic merging, reading signs)
- Truck traffic that intermittently blocks the view
- Off-roadway clutter that can distract drivers
- Poor weather that increases driver workload and makes cues (especially markings) less conspicuous
- High traffic volume levels
Design Considerations
An important assumption when using DSD is that drivers are provided with and able to respond to signage that allows them to prepare in advance of the roadway feature. Studies indicate that when this advance information is not available or easy to miss, drivers may require additional time beyond the DSD. In these situations, driver responses are based on when they are able to see the actual roadway feature (e.g., turn arrow pavement marking, gore point), rather than on their perception of advance signage. In this situation, the 85th percentile maneuver completion time (including the PRT) is between 20 and 23 s from the point at which the feature becomes visible (2, 3). Factors that may lead to these situations include: dense traffic, poor marking and signing, deceptive appearance of site, and features that violate driver expectancies (e.g., freeway left exit, add-drop lane).
Another design issue that warrants mention concerns lane changes. Additional sight distance may be necessary if drivers are expected to make multiple lane changes to complete a maneuver. In particular, each additional lane change adds an average of 5 s/lane in light traffic (≤ 725 vehicles/h) and 7.4 s/lane in medium-density traffic (726 to 1225 vehicles/h) to the maneuver.
Many design references use the term “design speed” to characterize the expected driving speed on a roadway. However, as noted in “Influence of Speed on Sight Distance” (5-12), neither design speed nor posted speed is always the best determinant of actual driving speed. When available, actual operating speeds could be used instead of design speed to help determine needed sight distance.
Although DSD has safety implications, NCHRP Report 783 (4) noted that DSD does not have a defined relationship with safety in FHWAʼs controlling criteria for roadway design (5) and requires engineering judgment in their applications instead of serving as controlling criteria for design.
Cross References
Key Components of Sight Distance
Determining Stopping Sight Distance
Key References
1. AASHTO. (2018). A Policy on Geometric Design of Highways and Streets (7th ed.). Washington DC.
2. Layton, R., and Dixon, K. (2012). Decision Sight Distance. Salem, OR.
3. Lerner, N., Huey, R. W., McGee, H. W., and Sullivan, A. (1995). Older Driver Perception-Reaction Time for Intersection Sight Distance and Object Detection. Volume I, Final Report. (FHWA-RD-93-168). Washington, DC: FHWA.
4. Harwood, D. W., Hutton, J. M., Fees, C., Bauer, K. M., Glen, A., and Ouren, H. (2014). NCHRP Report 783: Evaluation of the 13 Controlling Criteria for Geometric Design. Transportation Research Board of the National Academies, Washington, DC.
5. FHWA. (2016). Revision of Thirteen Controlling Criteria for Design and Documentation of Design Exceptions. (FHWA Docket No. FHWA-2015-0020).
DETERMINING PASSING SIGHT DISTANCE
Introduction
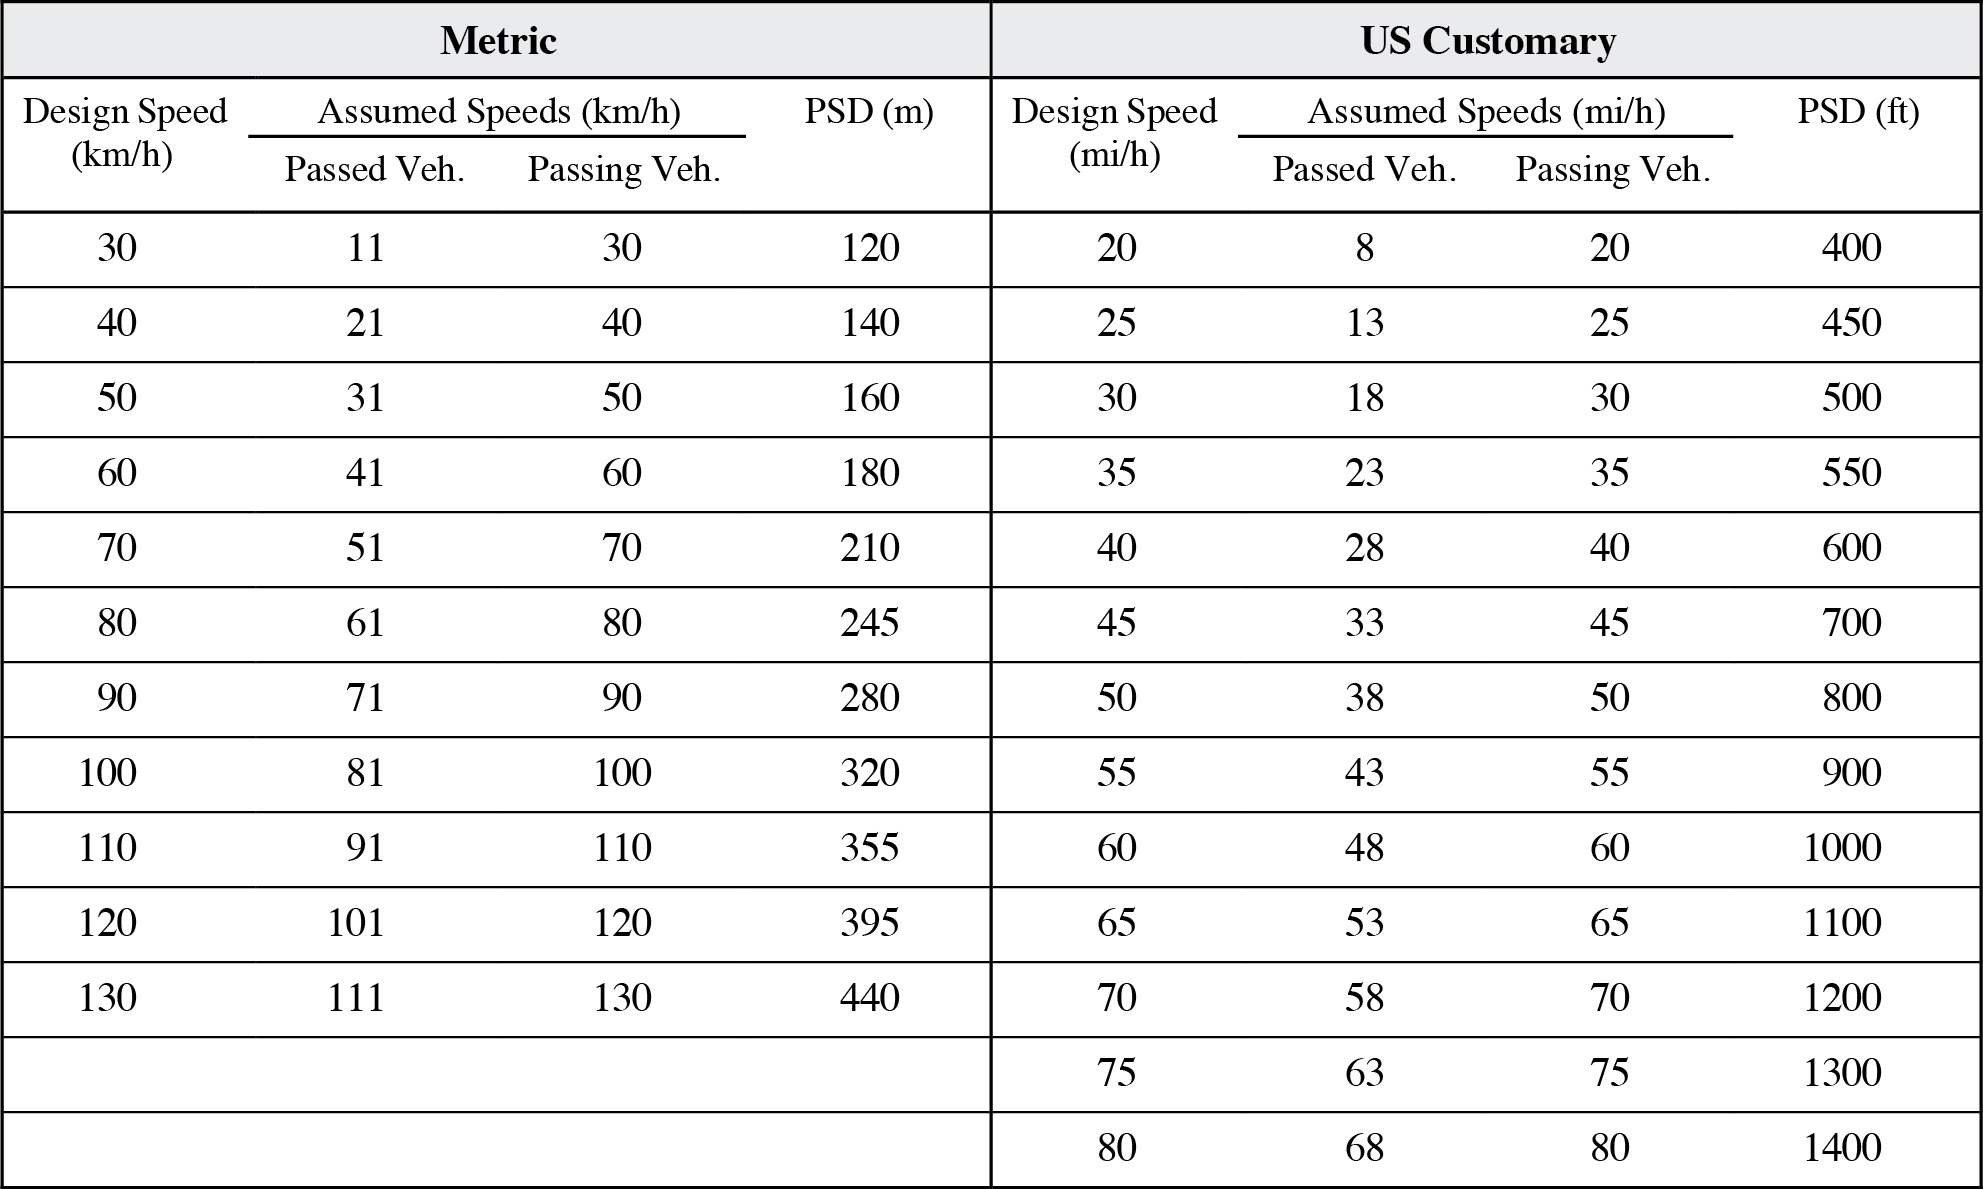
According to AASHTO (1), passing sight distance (PSD) is how far ahead a driver must be able to see to complete a passing maneuver without cutting off the passed vehicle before meeting an opposing vehicle that appears during the maneuver. This guideline provides the design values for passes made at different speeds provided in AASHTO (1). Six alternatives for determining PSD criteria for design can be found in NCHRP Report 605 (2, pg. 72).

The figure below shows the lane change maneuver used by the white car to pass the black car.
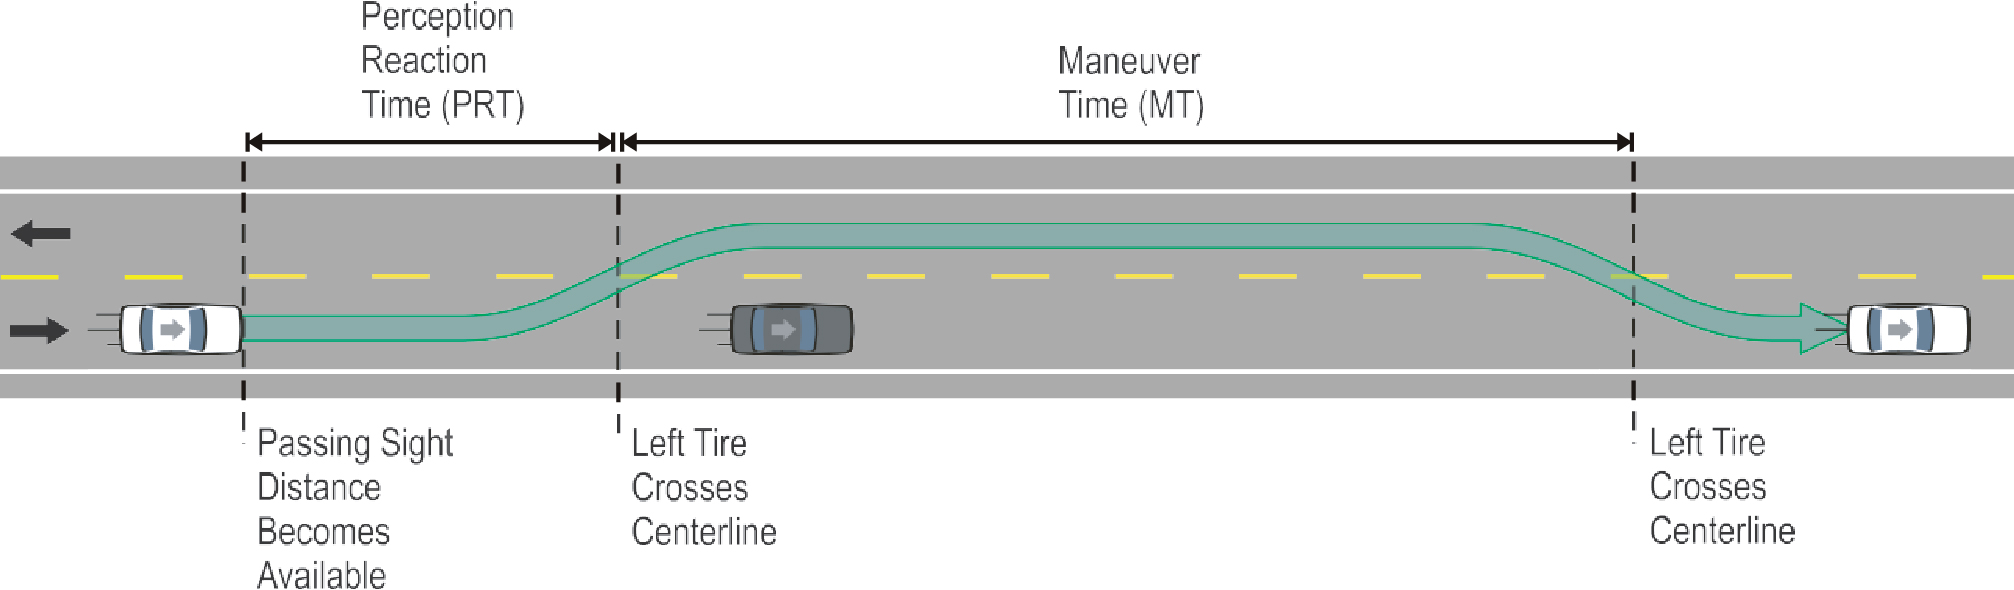
Long Description.
A car traveling from right to left overtakes another vehicle traveling on the left. The point where the left tire crosses centerline, maneuver time (MT), the perception reaction time (PRT) and the point where the passing sight distance becomes available are marked.
Discussion
The PSD encompasses both a PRT and an MT component. Mean PRTs to initiate a pass, measured from when PSD was available until when the right tire crossed the centerline, have been found to vary from 3.6 to 6.0 s, depending on the particular site on two-lane rural highways (3). No information is available on subject variability, but 85th percentile PRTs will certainly exceed mean reaction times. Just as other PRTs are affected by age, gender, standard transmissions, and day versus night conditions, PSD PRT may be as well. For example, NCHRP Report 605 (2) noted that older drivers may need more time to complete a passing maneuver, although older drivers are less likely to make passes; however, no other studies were found on this topic. The primary cue that a driver uses to determine if there is enough time to complete a passing maneuver is the size of the image of the oncoming vehicle. Research suggests that drivers make reasonable estimates of the distance of an oncoming car but not of its speed. This inability to reasonably estimate speed may be more pronounced for older drivers.
MT is measured from the point at which either the left or right front tire (depending on the study) of the subject vehicle crossed the centerline to the point at which the same front tire of the subject vehicle crossed the centerline back into the lane. One study found that on two-lane rural highways with approximately 96 km/h (60 mi/h) operating speeds and low traffic volumes (200 to 250 vehicles/h in the major/passing vehicle direction and 85 to 175 vehicles/h in the minor/opposing traffic direction), 65% to 75% of passes were attempted where there was no oncoming traffic, 25% to 35% of passes were attempted in the presence of oncoming traffic, and 0.8% of passes were aborted (4). In contrast, at high volumes (330 to 420 vehicles/h in the major direction and 70 to 170 vehicles/h in the minor direction), 51% to 76% of passes were made with no oncoming traffic, 26% to 50% of passes were in the presence of oncoming traffic, and 7.2% of passes were aborted. Straight and level road geometry increases the likelihood of passing (5).
The average time in the opposing lane was 12.2 s under low-traffic conditions and 11.3 s with high traffic volumes (based on when the front left tire, not the right tire as in the PRT case, entered and left the opposing lane). Depending on site and direction, times varied from a low of 8.0 s to a high of 12.9 s, and there was no clear association between the length of the available passing lane and time spent in the opposing lane. At a speed of 96 km/h (60 mi/h), the average times in the opposing lane are equivalent to distances of 325 m (1,064 ft) for low traffic and 301 m (986 ft) for high traffic.
Length of time spent in the passing lane is clearly related to the size of the time gap. In one study, drivers returning to their own lane with more than 10 s to spare averaged 12 s in the opposing lane. Drivers returning with 5 to 10 s to spare averaged 8.7 s and those with less than 5 s to spare, 6.8 s.
Drivers who pass may approach a slower vehicle and pass immediately (a flying pass) or may adopt a short headway and wait for an opportunity (a delayed pass). In the second case, more time for acceleration is required. In either case, drivers may adopt a short headway just prior to the pass. A study on two-lane highways found that 40% of drivers following at short headways (0.5 s or less) were doing so in anticipation of passing (6).
Design Considerations
Driversʼ inaccurate estimates cannot be compensated for by increasing sight distance because drivers misjudge the time they have to pass once they see the oncoming vehicle, regardless of how far down the road drivers can see. Related crashes should be addressed through speed control measures or site factors that improve speed judgments. Factors that increase the time needed to execute a passing maneuver include: (1) a passenger vehicle passing multiple vehicles, (2) a passenger vehicle passing a truck, (3) a truck passing another vehicle, (4) passing on an upgrade, and (5) passing on a curve to the right.
Many design references use the term “design speed” to characterize the expected driving speed on a roadway. However, as noted in “Influence of Speed on Sight Distance” (5-12), neither design speed nor posted speed is always the best determinant of actual driving speed. When available, actual operating speeds could be used instead of design speed to help determine needed sight distance.
Cross References
Key Components of Sight Distance
Key References
1. AASHTO. (2018). A Policy on Geometric Design of Highways and Streets (7th ed.). Washington, DC.
2. Harwood, D. W., Gilmore, D. K., Richard, K. R., Dunn, J. M., and Sun, C. (2008). NCHRP Report 605: Passing Sight Distance Criteria. Transportation Research Board of the National Academies, Washington, DC.
3. Hostetter, R. S., and Seguin, E. L. (1969). The effects of sight distance and controlled impedance on passing behavior. Highway Research Record, 299, 64–78.
4. Kaub, A. R. (1990). Passing operations on a recreational two-lane, two-way highway. Transportation Research Record: Journal of the Transportation Research Board, 1280, 156–162.
5. Dyre, B. P., Dixon, M., Grover, A., Meyer, M., Rember, J., and Abdel-Rahim, A. (2015). Modeling Passing Behavior on Two-Lane Rural Highways: Evaluating Crash Risk under Different Geometric Configurations. Retrieved from http://depts.washington.edu/pactrans/wp-content/uploads/2013/11/PacTrans-47-UI-Wen.pdf
6. Rajalin, S., Hassel, S. O., and Summala, H. (1997). Close following drivers on two-lane highways. Accident Analysis & Prevention, 29(6), 723–729.
INFLUENCE OF SPEED ON SIGHT DISTANCE
Introduction
Although posted speed has been found to have the strongest association with operating speed, some visual aspects or driving-task demands associated with the roadway environment can “unconsciously” influence driversʼ speed choice. Consequently, if operating speeds on a roadway significantly exceed design speed, sight distances on that roadway may be inadequate. In particular, drivers would have less time to react to an event or object at higher speeds because they travel a greater distance during the initial PRT component of a response. Similarly, at higher speeds, vehicles either take longer to stop/slow, or maneuvers may become overly difficult to perform, with the potential for loss of vehicle control and/or crash. Also, drivers do not see objects approaching in a linear fashion. Large objects far away do not appear to change in size as rapidly as closer objects, which makes it easier to misjudge high-speed objects approaching.

EVIDENCE BETWEEN OPERATING SPEED AND DESIGN ELEMENT (1)
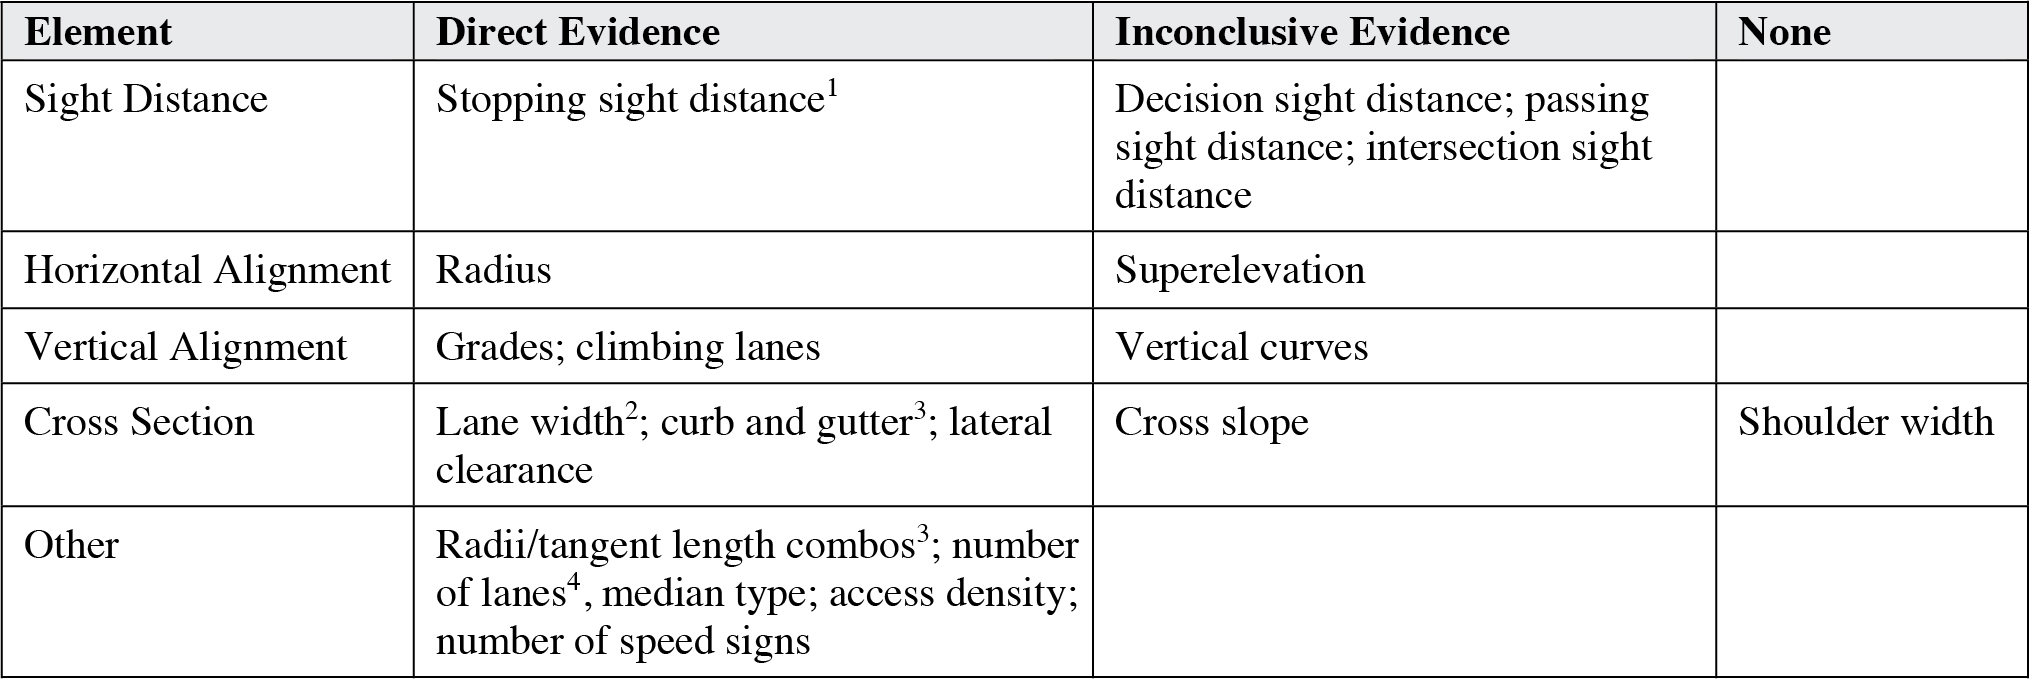
1with limits; 2weak; 3per one study; 4freeways
Long Description.
The table has four columns: Column 1: Element. Column 2: Direct Evidence. Column 3: Inconclusive Evidence. Column 4: None. Row 1, Column 1: Sight Distance, Column 2: Stopping sight distance, note: with limits. Column 3: Decision sight distance; passing sight distance; intersection sight distance. Column 4 blank. Row 2, Column 1: Horizontal Alignment. Column 2: Radius. Column 3: Superelevation. Column 4 blank. Row 3 Column 1: Vertical Alignment. Column 2 Grades; climbing lanes. Column 3: Vertical curves. Column 4: blank. Row 4 Column 1: Cross Section. Column 2: Lane width, note: weak; curb and gutter, note: per one study; lateral clearance. Column 3: Cross slope. Column 4: Shoulder width. Row 5, Column 1: Other. Column 2: Radii/tangent length combos, note: per one study; number of lanes, note: freeways; median type; access density; number of speed signs. Column 3, blank. Column 4, blank.
Discussion
The design of a road affects driversʼ speeds through two major mechanisms. First, the design creates the driving task. Narrow lanes and sharp curves make the driving task more difficult and lead to reductions in speed. Second, drivers have expectations about the posted speeds—and comfortable speeds—based on various combinations of design elements. Users of this guide should be aware that operating speeds may be very different from the posted speed when the road message and the posted speed are at variance. Thus, design sight distances may be more appropriately determined based on operating, not posted, speed. The effects of different design features on speed are discussed below:
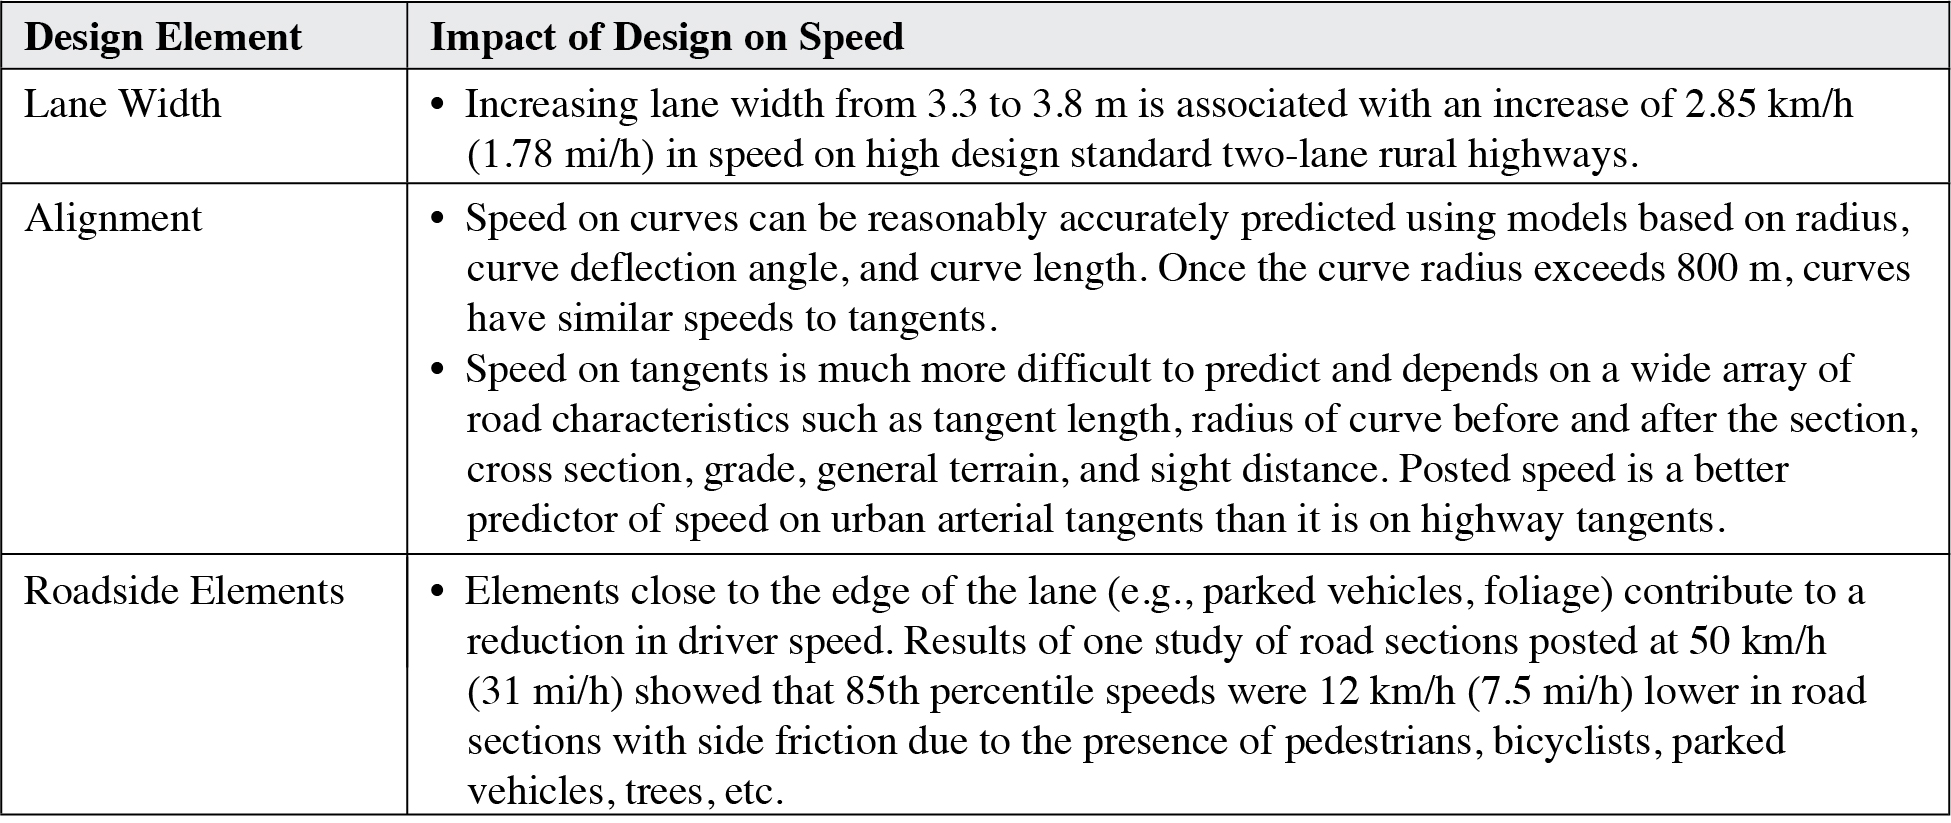
Lane Width. Lane width influences speed because it influences the difficulty of the driving task. Narrower lanes require more frequent, smaller steering corrections, which correspond to more effort. Slowing down reduces the effort required.
Alignment. Speed is strongly related to the radius of curvature. Typically, models of predicted speed based on radius, deflection angle, and curve length account for more than 80% of the variance in speed. One study of speeds in 176 curves on rural two-lane highways with posted speeds of 75 to 115 km/h found that 85th percentile speed was most strongly related to radius and related, but less so, to grade and sight distance (R2 = .58 to .92) (2). Once the curve radius exceeded 800 m, curves had speeds similar to those on tangents. This is consistent with other studies that have found that free-flow speeds on curves with large radii are greater than on sharper curves when sight distance is unrestricted (e.g., 3). Speed on tangents is much more difficult to predict and is dependent on a wide array of road characteristics such as tangent length, radius of curve before and after the section, cross section, grade, general terrain, and sight distance. Accordingly, studies on urban arterials find posted speed limits typically account for only half of the variance in speed.
Pavement Surface. One of the cues drivers use to estimate their own speed is noise level. When sound cues were removed through the use of earmuffs, drivers underestimated their actual speeds by 6 to 10 km/h (4).
Roadside Elements. Elements close to the edge of the lane—such as pedestrians, bicyclists, parked vehicles, and foliage—can strongly affect speed. One of the major cues used by drivers is the streaming of information in peripheral vision. Side friction increases the stimulus in peripheral vision, giving a sense of higher speed or greater potential hazard. In one study, drivers were asked to drive at 60 mi/h (96 km/h) with the speedometer covered. In an open-road situation, drivers averaged 57 mi/h (91 km/h). However, along a tree-lined route, drivers averaged 53 mi/h (85 km/h) (5). The trees close by provided peripheral stimulation, giving a sense of higher speed or greater potential hazard. For example, studies showed that heavily treed roads have lower operating speeds compared to roads surrounded by wide flat fields (6, 7). The elements that create side friction, such as pedestrians, bicyclists, parked vehicles, and landscaping, also present various levels of potential hazard, likely influencing drivers to slow down to various degrees. In other words, pedestrian presence close to the road edge is more likely to affect speed than landscaping close to the road edge (5).
Design Considerations
The relationship between several design elements and operating speed was investigated in a previous review of design elements (1). In some cases, the relationship was found to be strong, such as for horizontal curves; however, for several other cases, such as lane width, the relationship was found to be weak. In all cases when a relationship between the design element and operation speed exists, there are ranges when the influence of the design element on speed is minimal.
Cross References
Key Components of Sight Distance
Determining Stopping Sight Distance
Determining Passing Sight Distance
Key References
1. Fitzpatrick, K., Carlson, P., Brewer, M. A., Wooldridge, M. D., and Miaou, S.-P. (2003). NCHRP Report 504: Design Speed, Operating Speed, and Posted Speed Practices. Transportation Research Board of the National Academies, Washington DC.
2. Fitzpatrick, K., Carlson, P. J., Wooldridge, M. D., and Brewer, M. A. (2000). Design Factors That Affect Driver Speed on Suburban Arterials. (FHWA/TX-001/1769-3). Washington, DC: FHWA.
3. Watson, D. C., Al-Kaisy, A., and Anderson, N. D. (2014). Examining the effect of speed, roadside features, and roadway geometry on crash experience along a rural corridor. Journal of Modern Transportation, 22(2), 84–95. https://doi.org/10.1007/s40534-014-0040-4.
4. Evans, L. (1970). Speed estimation from a moving automobile. Ergonomics, 13, 219–230.
5. Shinar, D., McDowell, E. D., and Rockwell, T. H. (1977). Eye movements in curve negotiation. Human Factors, 19(1), 63–71.
6. Fitzpatrick, K., Carlson, P., Brewer, M., and Wooldridge, M. (2001). Design factors that affect driver speed on suburban streets. Transportation Research Record: Journal of the Transportation Research Board, 1751, 18–25.
7. Ewing, R., and Dumbaugh, E. (2009). The Built Environment and Traffic Safety: A Review of Empirical Evidence. Journal of Planning Literature, 23(4), 347–367.
KEY REFERENCES FOR SIGHT DISTANCE INFORMATION
Introduction
Sight distance requirements, issues, and subtopics have been covered extensively in a range of standard reference sources for roadway design and highway. It is important for roadway designers and traffic engineers to recognize that most of the information presented in this chapter has been adopted from these other sources, and for users of the HFG to know where to go to find alternative sources of sight distance information.

Discussion
The HFG focuses on key aspects of sight distance from the roadway usersʼ perspective and is not intended to provide a comprehensive or definitive presentation of sight distance. Additional data sources follow:
A Policy on Geometric Design of Highways and Streets (1) provides guidance to roadway designers in the form of recommended values for a host of critical design dimensions. It is based on both established practices and standards, and reflects recent research. Most of the chapters contain sections or subsections that focus on user needs and characteristics; as noted above, Chapters 2, 3, 5, 6, 7, and 9 contain sight distance information.
The Manual on Uniform Traffic Control Devices (2) is the national standard for traffic control devices installed on any street, highway, or bicycle trail open to public travel. MUTCD provides uniform standards for the design of all signs, signals, markings, and other devices that are used to regulate, warn, or guide traffic and that are placed on, over, or adjacent to streets, highways, pedestrian facilities, and bikeways. Though MUTCD does not address sight distance issues as comprehensively as A Policy on Geometric Design of Highways and Streets, it does provide a number of very accessible and useful figures and tables on sight distance.
The Traffic Engineering Handbook (3) provides relevant key principles and techniques on “best” traffic engineering practices.
The Traffic Control Devices Handbook (4) is intended to augment and supplement the MUTCD by providing additional information and background information on selected topics. Although sight distance is not addressed as a separate chapter, PRT and MT are addressed in Chapter 2, Human Factors, and sight distance requirements for at-grade crossings are covered in Chapter 11, Highway-Rail Grade Crossings.
Guidelines and Recommendations to Accommodate Older Drivers and Pedestrians (5) focuses on older roadway users but includes relevant information from key sources relating to sight distance (see also the accompanying handbook for these guidelines, published as FHWA-RD-01-103).
The Highway Safety Manual (6) has limited information about estimating sight distance; however, it includes some discussion of sight distance as a contributing factor in crashes.
NCHRP Report 783: Evaluation of the 13 Controlling Criteria for Geometric Design (7) is a resource for when a design exception is made for state projects to consider traffic and safety impacts related to the following controlling criteria: design speed, lane width, shoulder width, bridge width, structural capacity, horizontal alignment, vertical alignment, grade, stopping sight distance, cross slope, super elevation, vertical clearance and horizontal clearance.
Design Considerations
None.
Cross References
Key Components of Sight Distance
Determining Stopping Sight Distance
Determining Intersection Sight Distance
Determining When to Use Decision Sight Distance
Determining Passing Sight Distance
Influence of Speed on Sight Distance
Key References
1. AASHTO. (2018). A Policy on Geometric Design of Highways and Streets (7th ed.). Washington, DC.
2. FHWA. (2023). Manual on Uniform Traffic Control Devices for Streets and Highways (11th ed.). Washington, DC.
3. Pline, J. L. (Ed.). (1999). Traffic Engineering Handbook (5th ed.). Washington, DC: ITE.
4. Seyfried, R. K. (Ed.). (2013). Traffic Control Devices Handbook. Washington, DC: ITE.
5. Staplin, L., Lococo, K., Bynington, S., and Harkey, D. (2001). Guidelines and Recommendations to Accommodate Older Drivers and Pedestrians. (FHWA-RD-01-051). McLean, VA: FHWA, Office of Safety R&D.
6. AASHTO. (2010). Highway Safety Manual (1st ed.). Washington, DC.
7. Harwood, D. W., Hutton, J. M., Fees, C., Bauer, K. M., Glen, A., Ouren, H., Quincy Engineering, and HQE, Inc. (2014). NCHRP Report 783: Evaluation of the 13 Controlling Criteria for Geometric Design. Transportation Research Board of the National Academies, Washington, DC.
WHERE TO FIND SIGHT DISTANCE INFORMATION FOR SPECIFIC ROADWAY FEATURES
Introduction
The following table lists the information required to diagnose sight distance for specific roadway features. Although the roadway designer and the traffic engineer work with distances, sight distance needs actually originate from driver maneuver time needs and speed choice. Therefore, to understand, diagnose, and address sight distance concerns, one must address the human factors issues of time and speed. Stopping sight distance is needed for all roadway features. Note that in this guideline, a hazard refers to any object, obstacle, or condition that requires the driver to decelerate to a stop.
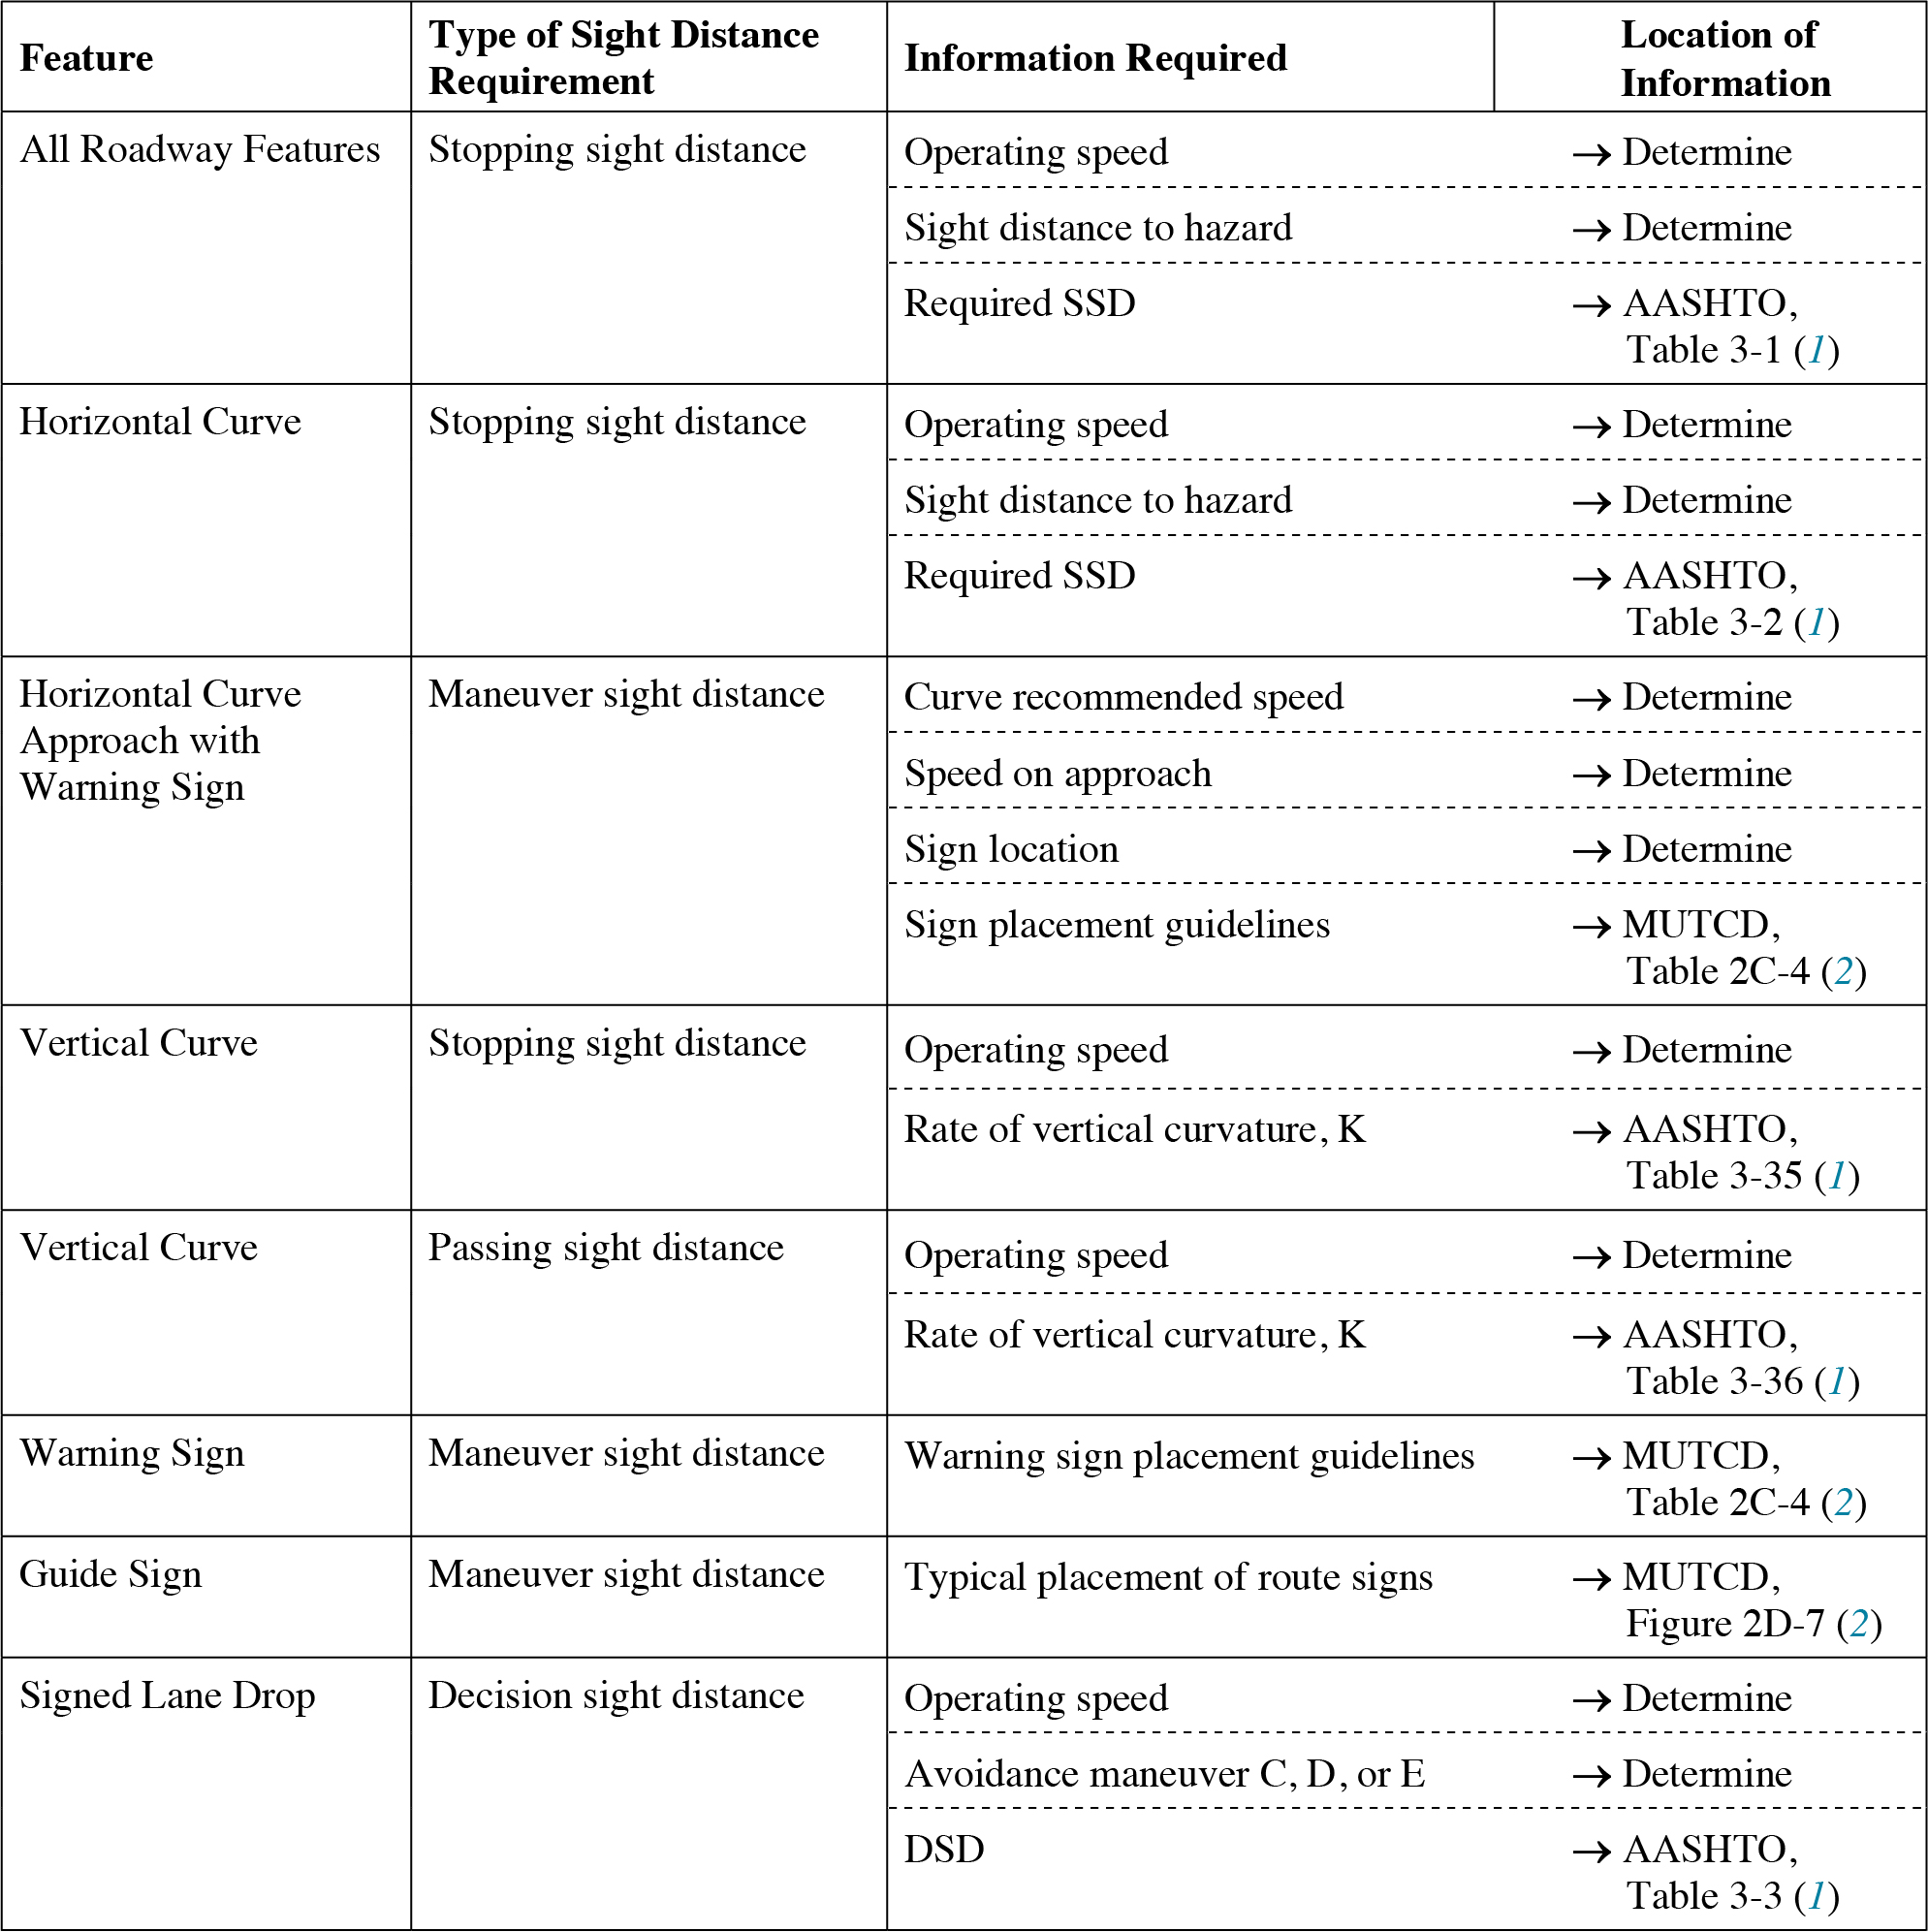

Discussion
The sight distance diagnostic procedure is a systematic on-site investigation technique used to evaluate the highway environment and support sight distance needs. The highway location is surveyed, diagrammed, and divided into component sections based on specific driving demands (e.g., need to perform a specific maneuver). Then, each section is analyzed in terms of its suitability to support the required task (e.g., the information provided to the driver, the allotted time to complete the required task or maneuver). This procedure enables the practitioner to compare the available sight distance with the sight distance required to perform the driving task safely.
Procedures for measuring available sight distance are given in AASHTO (1) and the Manual of Transportation Engineering Studies (3). Available sight distance can be checked on plans for proposed designs or in the field for existing locations.
Design Considerations
Many design references use the term “design speed” to characterize the expected driving speed on a roadway. However, as noted in “Influence of Speed on Sight Distance” (5-12), neither design speed nor posted speed is always the best determinant of actual driving speed. When available, actual operating speeds could be used instead of design speed to help determine needed sight distance.
Cross References
Tutorial 1: Real-World Driver Behavior Versus Design Models
Tutorial 2: Diagnosing Sight Distance Problems and Other Design Deficiencies
Key References
1. AASHTO. (2018). A Policy on Geometric Design of Highways and Streets (7th ed.). Washington, DC.
2. FHWA. (2023). Manual on Uniform Traffic Control Devices for Streets and Highways (11th ed.). Washington, DC.
3. Robertson, H. D., Hummer, J. E., and Nelson, D. C. (Eds.). (2000). Manual of Transportation Engineering Studies. Washington, DC: ITE.
WHERE TO FIND SIGHT DISTANCE INFORMATION FOR INTERSECTIONS
Introduction
The following table lists the information required to diagnose sight distance at various intersection types. Although the roadway designer and the traffic engineer work with distances, sight distance needs actually originate from driver MT needs and speed choice. Therefore, to understand, diagnose, and address sight distance concerns, one must address the human factors issues of time and speed. Stopping sight distance is needed for all roadway features.
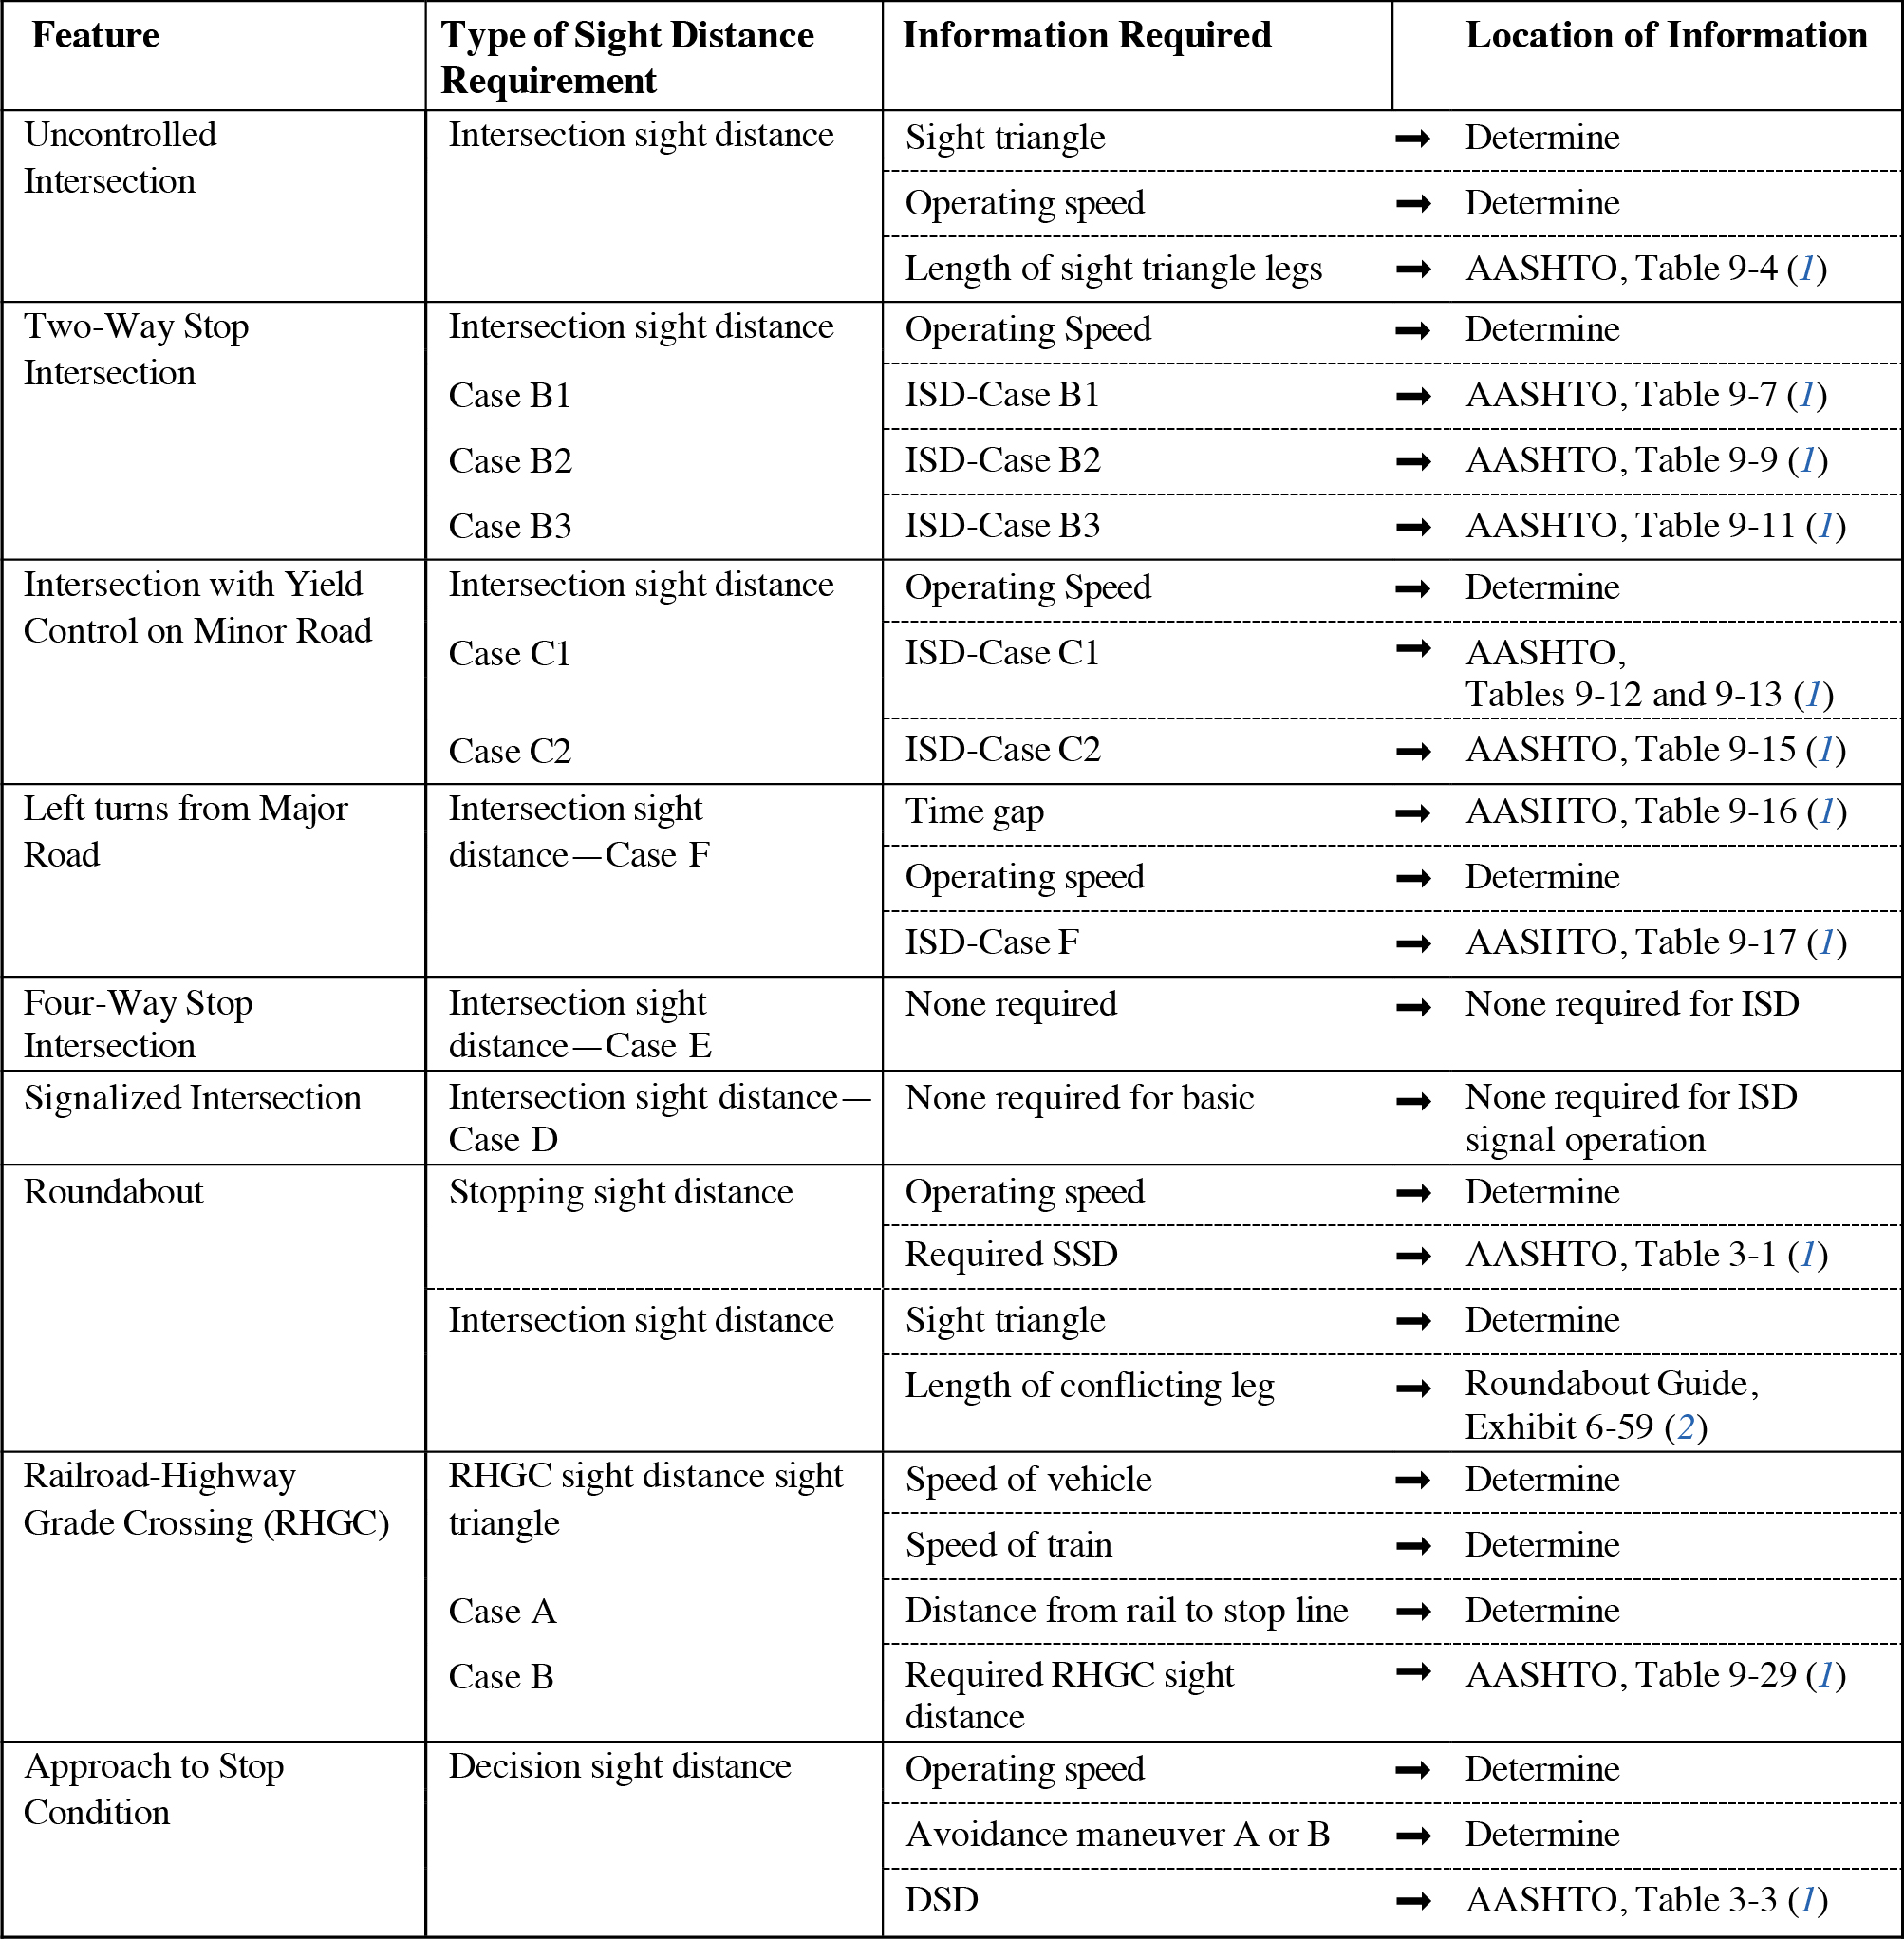

Discussion
The sight distance diagnostic procedure consists of a systematic on-site investigation technique to evaluate the highway environment to support sight distance needs. The highway location is surveyed, diagrammed, and divided into component sections based on specific driving demands (e.g., the need to perform a specific maneuver). Then each section is analyzed in terms of its suitability to support the required task (e.g., information provided to the driver, allotted time to complete the required task or maneuver). This procedure enables the practitioner to compare the available sight distance with the sight distance required to perform the driving task safely.
Procedures for measuring available sight distance are given in AASHTO (1) and the Manual of Transportation Engineering Studies (3). Available sight distance can be checked on plans for proposed designs or in the field for existing locations.
Robertson et al. (3) and Tustin et al. (4) provide additional information that may be useful for determining sight distance.
Design Considerations
Many design references use the term “design speed” to characterize the expected driving speed on a roadway. However, as noted in “Influence of Speed on Sight Distance” (page 5-12 of this document), neither design speed nor posted speed is always the best determinant of actual driving speed. When available, actual operating speeds could be used instead of design speed to help determine needed sight distance.
Also, crashes generally go down when the skew angle is reduced, though the reason behind this finding is unclear. It may be the case that smaller skew angles (e.g., less than 75 degrees) could reduce the driverʼs PRT.
Cross References
Tutorial 1: Real-World Driver Behavior Versus Design Models
Tutorial 2: Diagnosing Sight Distance Problems and Other Design Deficiencies
Key References
1. AASHTO. (2018). A Policy on Geometric Design of Highways and Streets (7th ed.). Washington, DC.
2. Rodegerdts, L., Bansen, J., Tiesler, C., Knudsen, J., Myers, E., Johnson, M., Moule, M., Persaud, B., Lyon, C., Hallmark, S., Isebrands, H., Crown, R. B., Guichet, B., and OʼBrien, A. (2010). NCHRP Report 672: Roundabouts: An Informational Guide (2nd ed.). Transportation Research Board of the National Academies, Washington, DC.
3. Robertson, H. D., Hummer, J. E., and Nelson, D. C. (Eds.). (2000). Manual of Transportation Engineering Studies. Washington, DC: ITE.
4. Tustin, B., Richards, H., McGee, H., and Patterson, R. (1986). Railroad-Highway Grade Crossing Handbook (2nd ed.). (FHWA-TS-86-215). Fairfax, VA: Tustin Enterprises.


