Human Factors Guidelines for Road Systems: Third Edition (2025)
Chapter: 17 Special Considerations for Rural Environments

CHAPTER 17
Special Considerations for Rural Environments
It is crucial for the planner, designer, and engineer to consider the environment in which a roadway will be or is located. In this regard, the Green Book (AASHTO, 2018) uses the term ‘environment’ to refer to “the totality of humankindʼs surroundings: social, physical, natural, and synthetic, It includes the human, animal, and plant communities and the forces that act on all three.” In particular, urban and rural environments may vary greatly with respect to the density and type of land use, the density and layout of roadways, and the numbers and demographics of their respective populations. The Green Book also notes that a roadwayʼs formal classification (e.g., as urban vs rural) may be different from the siteʼs actual conditions and features – it is therefore important for the designers to be working with the community early in the project planning process (AASHTO, 2018).
PASSING LANES
Introduction
A passing lane is a lane added in one or both directions of travel on a two-lane, two-way highway to improve passing opportunities. This definition includes passing lanes in level or rolling terrain, climbing lanes on grades, and short four-lane sections (1). Passing lanes have been used mostly to allow drivers to bypass vehicles that are unable to maintain normal highway speeds on grades, usually called climbing lanes. Potts and Harwood (2) found that the primary benefit of passing lanes is the improvement of overall traffic operations on two-lane highways. This improved operation has direct implications for driver behavior because a driver stuck behind a slow-moving vehicle may be more likely to experience time delays and frustration, which could lead drivers to increase speeds to unsafe levels to pass a slow-moving vehicle.
Passing maneuvers involve complex decisions by drivers that require real-time estimates of speed and distance that translate into steering and acceleration/braking behaviors. Drivers need both time and space to complete passing maneuvers without crashing.

Discussion
Two-lane highways with passing lanes provide a definite improvement in level of service over those without passing lanes (2). In particular, at medium and high volumes, a roadway with continuous alternating passing lanes can provide improvement by two levels of service over conventional two-lane highways without passing lanes. Similarly, a two-lane highway with less frequent passing lanes typically provides an improvement of one level of service over a conventional two-lane highway (2). Comparable improvements in service provided by passing lanes were found to reduce driver frustration and improve overall quality of service, and the benefits of the passing lane extend beyond the confines of the added lane itself (4). Harwood et al. (3) found that passing lanes improve the percentage of time drivers spend following other cars on those roads by 10% to 31% in comparison to a conventional two-lane highway without passing lanes. Passing lanes are generally well-received by drivers; one study conducted in Kansas found that 93% of all respondents were positive about passing lanes and indicated higher acceptance of and satisfaction with the concept. Also, 46% of these drivers thought the passing lanes were just right in length, while 53% thought the passing lanes were too short (5). Mutabazi et al. (5) also found that 88% of drivers agree that more passing lanes are needed.
Highway engineers typically provide passing lanes with a primary objective of dispersing platoons and hence reducing travel time, with safety as a secondary objective. However, drivers view safety as the main benefit accrued from passing lanes (5). In the Kansas survey, 93% of drivers thought passing lanes improve safety, while 8% believed it encourages speeding. These driver perceptions are consistent with crash data analyses, which indicate that the installation of a passing lane on a two-lane highway reduces crash rates by approximately 25% (3). Harwood et al. (3) also found that crash frequency per mile per year within passing-lane sections on two-lane highways is 12% to 24% lower than for conventional two-lane highway sections.
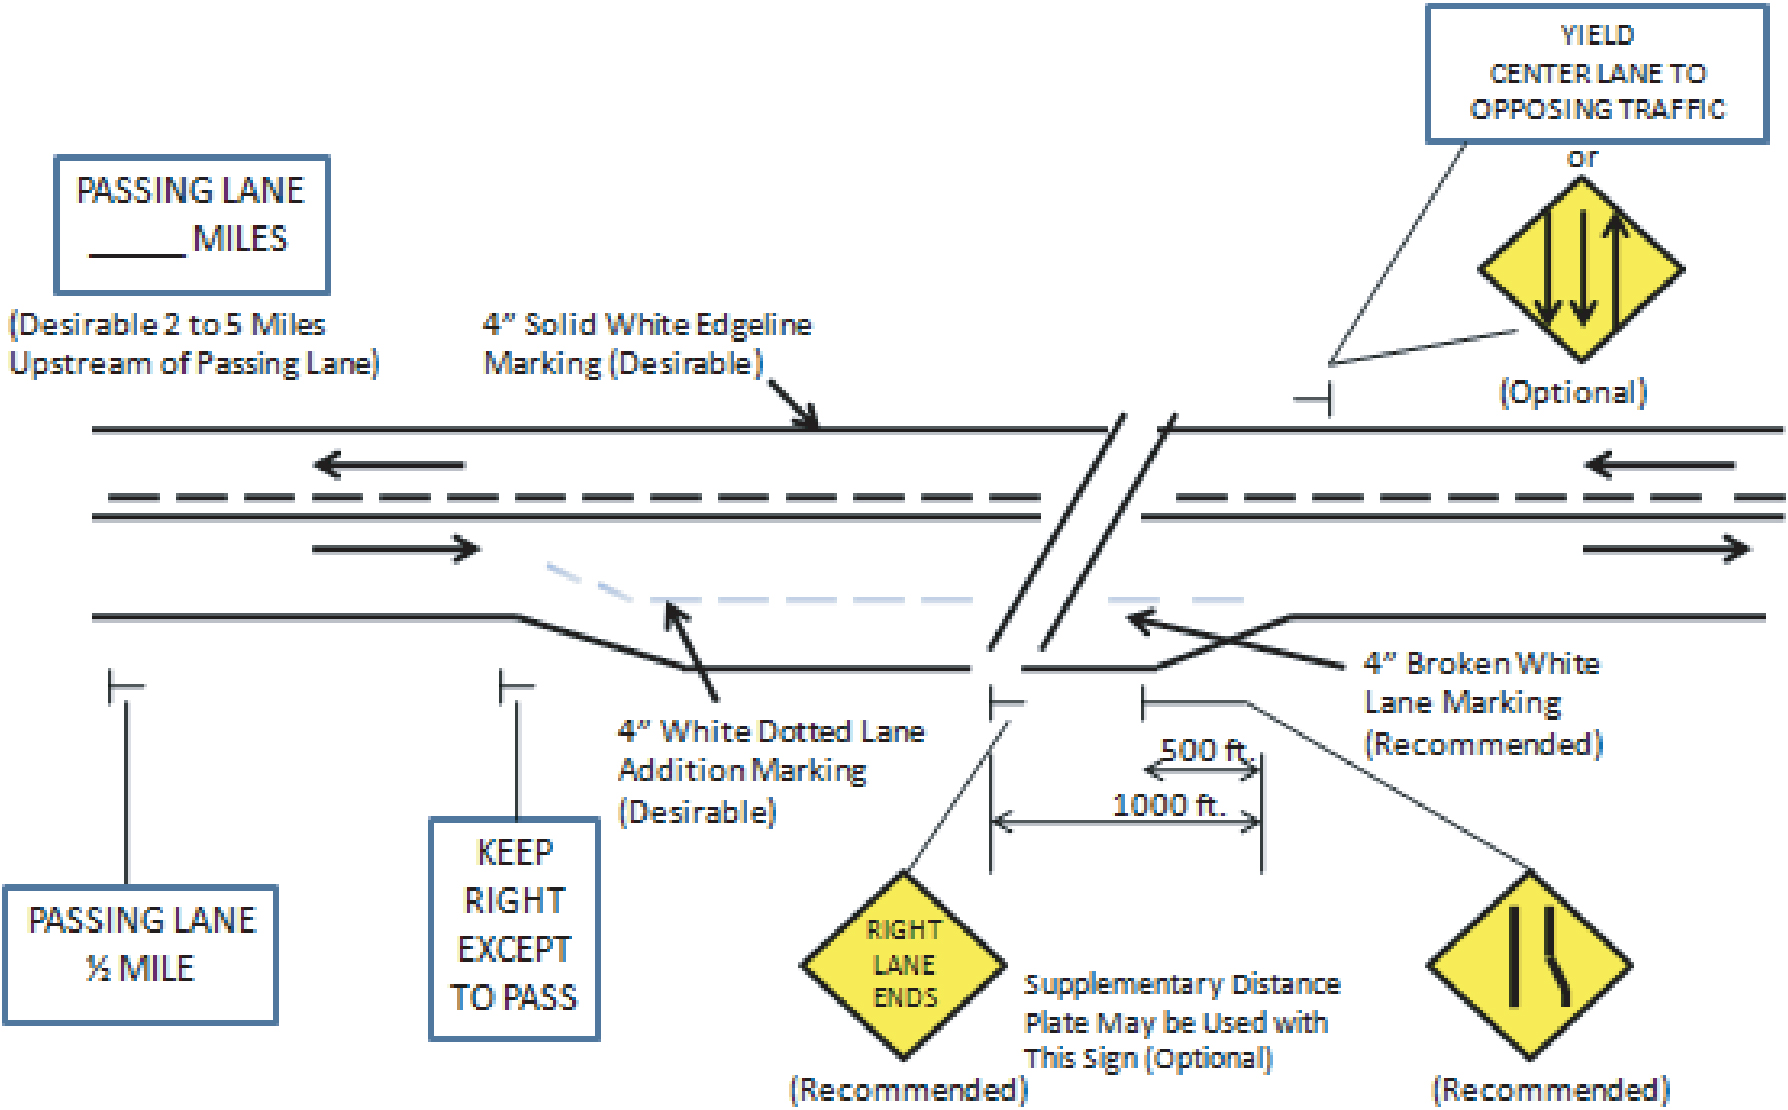
Signage. Warning signs can be used to give drivers a preview of an upcoming passing lane and to warn drivers that the passing lane is ending. The safety and convenience benefits of passing lanes are reduced if signs are not used to inform drivers of upcoming passing lanes or to guide lane selections. Clearly defined and well-maintained lane markings provide a similar function that can reduce the likelihood of driversʼ selecting an oncoming lane in an attempt to enter or remain in a passing lane. In a survey of passing-lane signs, Wooldridge et al. (6) found that 61% of motorists prefer the wording “Left Lane for Passing Only” versus 29% who prefer “Keep Right Except to Pass.” When surveyors reviewed the sign “Passing Lane Ahead 2 Miles,” 61% of motorists would wait 2 mi to pass while the rest would pass when ready. This advance signing is useful because it also informs the driver of the repetitive nature of the passing lane design, allowing the driver to understand the purpose and nature of the roadwayʼs characteristics. The sign should be used if the distance to the next passing lane is less than 12 mi. The sign “Right Lane Ends” is recommended to be located at a distance that will provide notice that the passing lane is terminating and that a merge back into the regular travel lane will be required.
Design Considerations
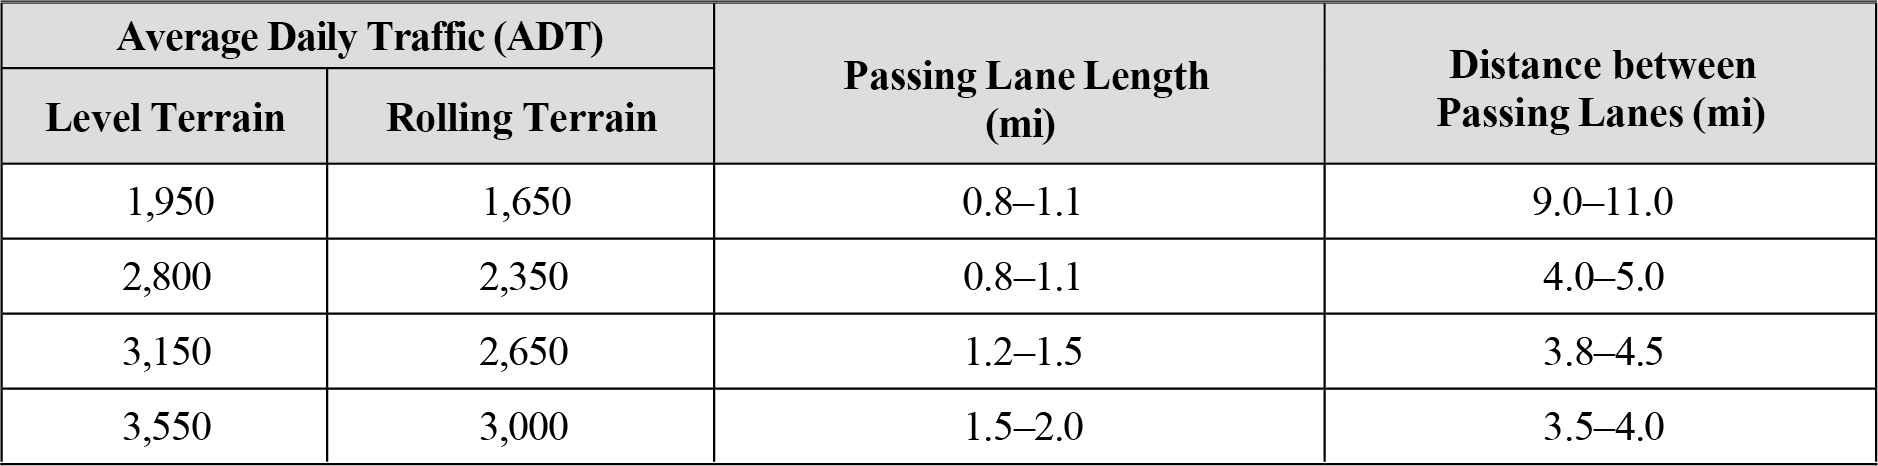
Length. The effective length of the passing lane is defined as the physical length of the passing lane plus the distance downstream to the point where traffic conditions return to a level similar to that immediately upstream of the passing lane (5). Through computer simulation, Harwood et al. (3) found the effective length to range between 4.8 km (3 mi) and 12.8 km (8 mi), depending on the physical length of the passing lane, traffic flow, traffic composition, and downstream passing opportunities.
Width and lane drop. Rinde found the minimum width for a two-lane road with a passing lane to be 40 ft (7). In the opinion of Rinde, passing should not be allowed for vehicles traveling in the single lane of three-lane roadways at traffic volumes above 3,000 AADT (7). Also, the use of an appropriate lane-addition transition on the upstream end of a passing lane is needed for effective passing-lane operations (2). The recommended length of this transition area is half to two-thirds of the length of the lane-drop taper (2).
Cross References
Key References
1. Mutabazi, M. I., Russell, E. R., and Stokes, R. W. (1999). Location and configuration of passing lanes. Transportation Research Record: Journal of the Transportation Research Board, 1658, 25–33.
2. Potts, I. B., and Harwood, D. W. (2004). Benefits and Design/Location Criteria for Passing Lanes. Jefferson: Missouri Department of Transportation.
3. Harwood, D. W., Hoban, C. J., and Warren, D. L. (1988). Effective use of passing lanes on two-lane highways. Transportation Research Record: Journal of the Transportation Research Board, 1195, 79–91.
4. Hoban, C. J. and Morrall, J. F. (1986). Overtaking Lane Practice in Canada and Australia (ARR 144). Victoria: Australia Road Research Board.
5. Mutabazi, M. I., Russell, E. R., and Stokes, R. W. (1998). Driversʼ attitudes, understanding and acceptance of passing lanes in Kansas. Transportation Research Record: Journal of the Transportation Research Board, 1628, 25–33.
6. Wooldridge, M. D., Messer, C. J., Heard, B. D., Raghupathy, S., Parham, A. H., Brewer, M. A., and Lee, S. (2001). Design Guidelines for Passing Lanes on Two-Lane Roadways (Super 2) (FHWA/TX-02/4064-1, TTI: 0-4064). College Station: Texas Transportation Institute.
7. Rinde, E. A. (1977). Accident Rates vs. Shoulder Width: Two-Lane Roads, Two-Lane Roads with Passing Lanes (CA-DOT-TR-3147-1-77-01). Sacramento: California Department of Transportation.
COUNTERMEASURES FOR PAVEMENT/SHOULDER DROP-OFFS
Introduction
A shoulder is a portion of the roadway contiguous with the traveled way for accommodation of stopped vehicles, for emergency use, and for lateral support of the sub-base, base, and surface courses. The roadway shoulder has been recognized as desirable ever since engineers began paving roadways. However, the width, uniformity, and stability of roadway shoulders have varied greatly from roadway to roadway and along different sections of the same roadway (1). Shoulders on rural roadways serve as structural support for the surfacing and additional width for the traveled way. Shoulder drop-offs occur when there is a difference in height (ranging from a fraction of an inch to several inches) between the pavement surface and the roadside surface (2). This height difference typically arises from tire rutting erosion, excessive wear, or resurfacing. The primary concern related to drop-offs is that if they are too deep, then it can pose a crash risk if a vehicle drifts outside the road and has a wheel go into the drop-off.

EXAMPLE OF SAFETY EDGE RECOMMENDED BY THE FHWA (4)
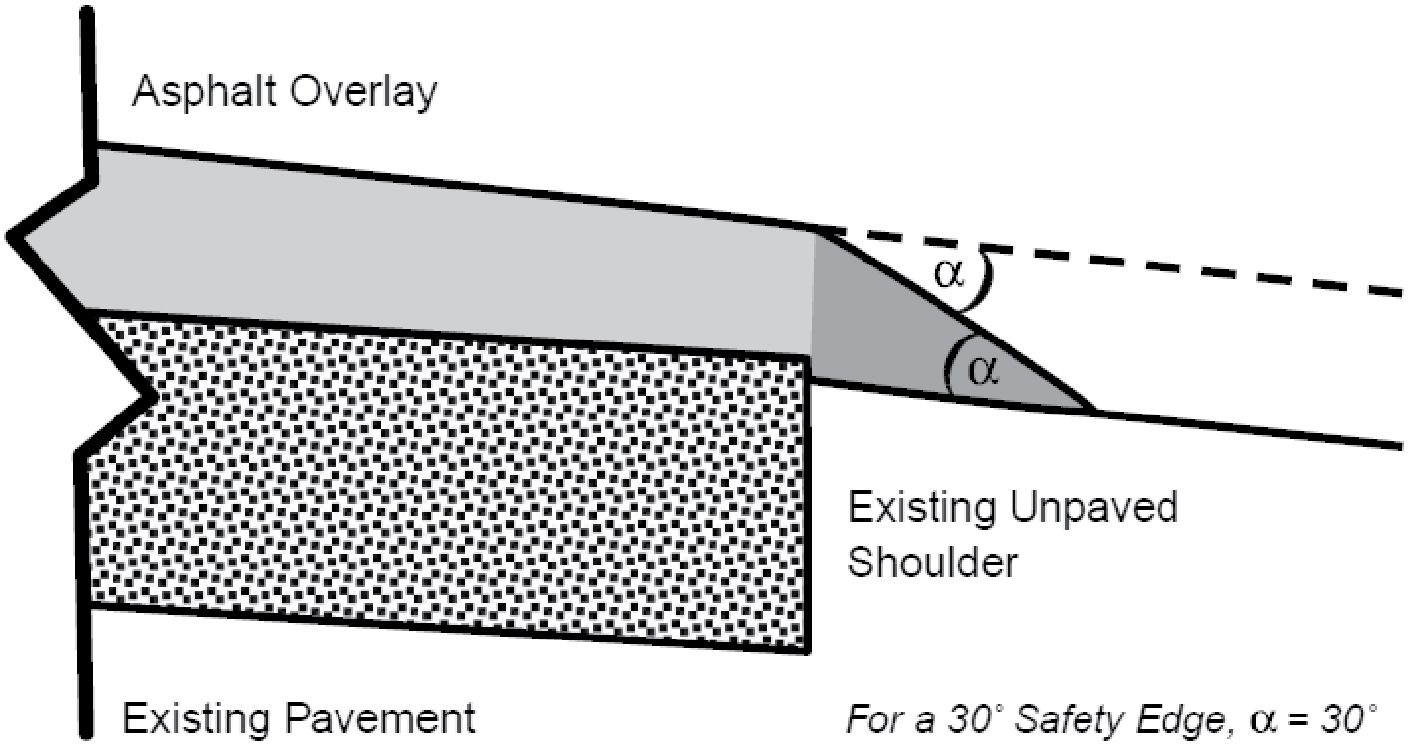
Long Description.
The overlay slopes down at an angle of alpha over the existing unpaved shoulder. For a 30 degree safety edge, alpha is 30 degrees.
Discussion
A primary safety concern related to drop-off from the perspective of driver performance occurs when a vehicle leaves the lane and has a tire go into the drop-off (typically the front right tire). This event is often surprising and unfamiliar for most drivers, and a drop-off can interfere with their ability to return the vehicle safely to the lane. In particular, if drivers try to return to the lane at high speed and at low steering angles, their tires can “scrub” against the drop-off edge, impeding their return. A common response is to increase the steering angle towards the lane, which can lead to an abrupt change in heading once the drop-off is overcome. In severe cases, this response can result in a vehicle swerving out of the lane into the opposite direction travel lane, putting the driver at risk of a collision with an oncoming vehicle. Motorcyclists can also have difficulties traversing drop-offs, although the vehicle control issues are somewhat different. Crash data analyses suggest that the overall frequency of crashes “probably” or “possibly” related to high drop-off is relatively low (less than 3% of rural road crashes for related road types), but that these crashes tend to result in a greater proportion of fatalities or injuries than typical rural road crashes (4).
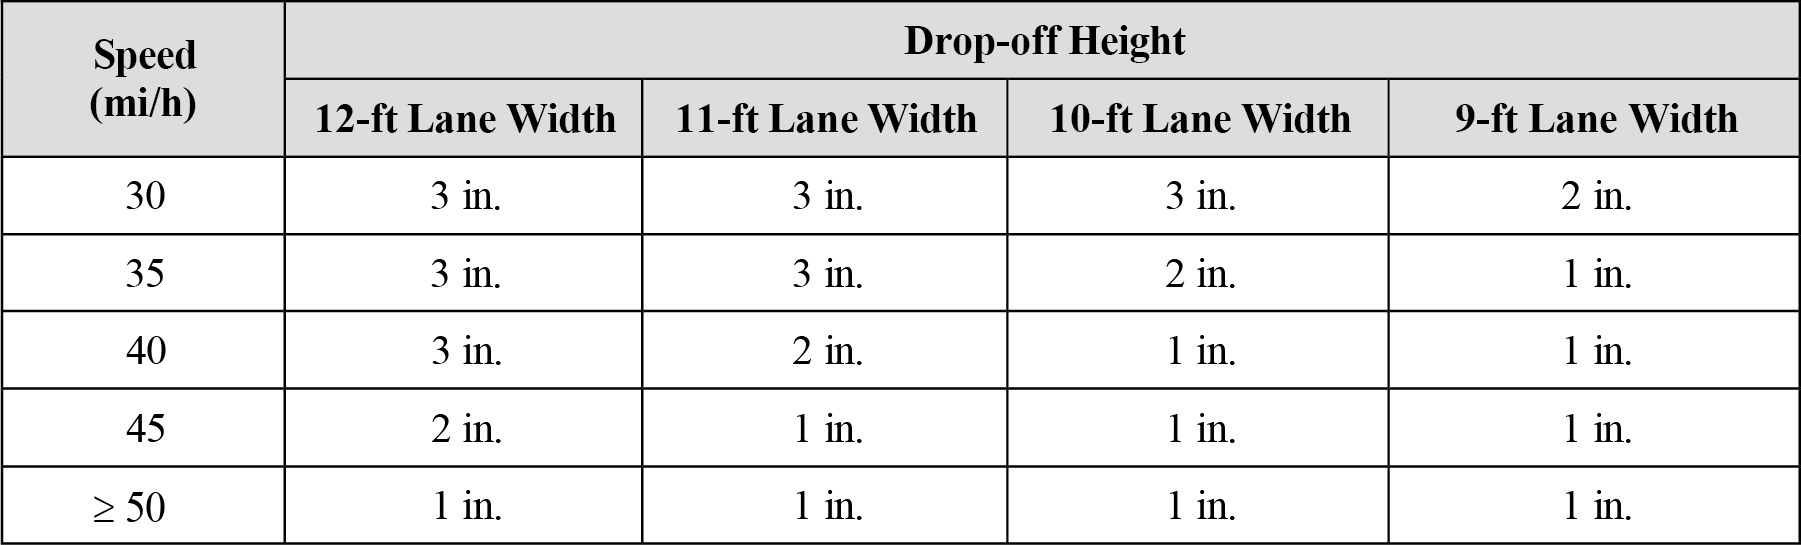
The guideline information is primarily based on an analysis of drop-offs for work zones (3). The original source table also contained drop-off depth thresholds that were higher than 3 in., but these were changed in the current guideline to reflect a more conservative assessment of other related driver performance data on driver encounters with drop-offs of various heights (4). Note that the recommendation only represents general guidance related to driver performance; other sources—such as the Roadside Design Guide (5)—recommend that vertical drop-offs with differentials of 2 in. or more should be avoided. What the guideline table is intended to convey is that vertical drop-off depths that exceed the listed values are more likely to be associated with increased difficulty for drivers trying to recover in a controlled manner if one of their tires goes over the drop-off edge.
Another design aspect related to drop-offs that affects driver performance is the shape of the drop-off. In particular, safe return to the lane is significantly more successful if a tire has to overcome a drop-off with a slope of 45° or shallower. The figure accompanying the guideline illustrates the relative “safety” of three drop-off geometries. Lane recovery with a sloped or filleted drop-off is significantly better than a straight vertical or curved drop-off. Moreover, the effectiveness of sloped drop-offs persists at higher speeds and at deeper drop-off depths (4).
Design Considerations
It is preferred that vehicles remain on the road and avoid unintended drifts to the shoulder – treatments like profile edge line marking and rumble strips can be used to help drivers remain on the traveled roadway.
There are several accepted approaches for addressing drop-offs that are too high. For example, in work zones, MUTCD warning signs for edge drop-off can notify users of present drop-off conditions. The application of a wedge-shaped asphalt material called “Safety Edge” is another possible countermeasure (see figure on previous page). When placed between the roadway and the shoulder, the material can help drivers recover from the shoulder to the driving surface. The asphalt material needs to be compacted to increase strength, otherwise the material will break apart over time due to forces and runoff water. Graham, Richard, and Harwood (6) found that the results of an Empirical Bayes and cross-sectional analysis of sites paved with and without Safety Edge revealed that the material has a net positive effect on the safety of rural highways. Humphreys and Parham found that the shoulder is best resurfaced when the roadway is resurfaced so that shoulder drop-off does not form (1). They also recommend that the contractor, in areas where road-resurfacing contracts must be bid separately, should be required to provide a 45° angle fillet along the edge of the roadway as part of the scope of work (1).
Cross References
Design Consistency in Rural Driving
Key References
1. Humphreys, J. B., and Parham, J. A. (1994). The Elimination or Mitigation of Hazards Associated with Pavement Edge Drop-offs During Roadway Resurfacing. Washington, DC: AAA Foundation for Traffic Safety.
2. Fitzpatrick, K., Parham, A. H., and Brewer, M. A. (2002). Treatments for Crashes on Rural Two-Lane Highways in Texas (FHWA/TX-02/4048-2). College Station: Texas Transportation Institute.
3. Graham, J. L. and Glennon, J. C. (1984). Work Zone Design Considerations for Truck Operations and Pavement/Shoulder Drop-Offs. Washington, DC: FHWA.
4. Hallmark, S. L., Veneziano, D., McDonald, T., Graham, J., Bauer, K. M., Patel, R., and Council, F. M. (2006). Safety Impacts of Pavement Edge Drop-Offs. Washington, DC: AAA Foundation for Traffic Safety.
5. AASHTO. (2011). Roadside Design Guide. (4th ed.) Washington, DC.
6. Graham, J. L., Richard, K. R., and Harwood, D. W. (2009). Safety Evaluation of Safety Edge Treatment—Year 2, Interim Report. Kansas City, MO: Midwest Research Institute.
RUMBLE STRIPS
Introduction
Shoulder rumble strips (SRS) are raised or grooved patterns on the shoulder of a travel lane intended to provide a tactile/haptic and auditory alert to drivers who stray onto the shoulder. When a vehicleʼs wheels traverse SRS, they generate both an increase in sound and haptic (physical) vibrations that drivers feel through their seat, foot pedals, floor, and steering wheel. SRSs are best suited for warning inattentive or drowsy drivers who are leaving the traveled way. SRSs can potentially wake drivers who fall asleep; however, this result typically requires a greater level of sound and vibration. In general, SRSs must produce sound and vibration levels that are easily detectable, yet not so loud and jarring that they startle drivers. The design challenge is balancing the need to provide alerts in a variety of situations (e.g., in heavy trucks or to sleeping drivers) with the need to avoid potentially undesirable startling effects and difficulties that SRSs can cause bicyclists.
Previous safety evaluations of SRSs confirm their overall effectiveness. For example, Griffith (1) indicates there is a medium-high level of predictive certainty that SRSs reduce all single-vehicle run-off-road (SVROR) crashes by 21% on rural freeways and by 18% on all freeways (i.e., both rural and urban). Harkey et al. found that continuous SRSs reduce injury SVROR crashes by 7% on rural freeways and by 13% on all freeways (2). Rumble strips have been shown to significantly reduce the run-off-road crash rate on some rural highways by up to 80% (3).

Discussion
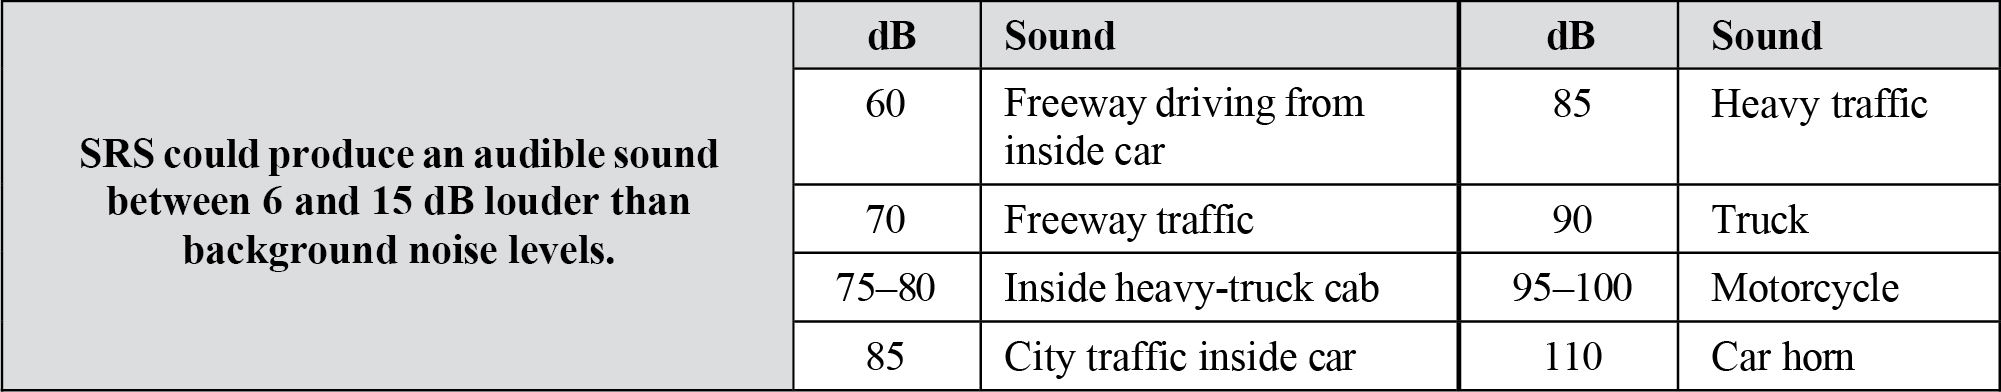
Torbic et al. (4) found that there is no conclusive evidence indicating a clear minimum level of stimulus that a shoulder or centerline rumble strip must generate in order to alert an inattentive, distracted, drowsy, or fatigued driver. However, the applicable research literature generally indicates that rumble strips that generate a 3 to 15 dBA increase above the ambient in-vehicle sound level can be detected by awake drivers. Also, some evidence suggests that a sudden change in sound level above 15 dBA could startle a driver. However, a rumble strip generating more than a 15 dBA increase above the ambient sound level should not be automatically assumed to cause negative impacts (e.g., an increase in crashes), but rather to increase the potential for startling drivers who encounter the rumble strip.
Related guidance for in-vehicle warning tones typically recommends sound intensity levels for auditory-only warnings (unaccompanied by vibrations) of between 10 and 30 dB above background noise levels, while not exceeding 90 dB overall. The SRS guidelines differ significantly from the guidance for in-vehicle warning tones because of the presence of haptic vibrations with the SRS. In particular, at least for passenger vehicles, background vibration levels are low in small vehicles, and even a small change in vibration can be clearly detected. Laboratory driving simulator studies show that drivers usually easily detect steering wheel or brake pedal vibrations of 1.2–1.5 N • m torque presented over half a second. In contrast to passenger vehicles, cab vibrations in heavy trucks are significant, and the size and weight of heavy trucks reduce the vibrations generated by SRS; therefore, the vibration component of SRS is viewed to have minimal benefit for alerting heavy-truck drivers.
It is also worth noting that the effectiveness of SRS for waking sleeping drivers has not been closely examined and that it is likely that SRS are much less effective in this application. The primary reasons for this lesser effectiveness are that greater stimulus levels are required to wake a sleeping driver rather than to merely alert a distracted or drowsy driver, and that the increased arousal caused by traversing rumble strips is brief and insufficient (5).
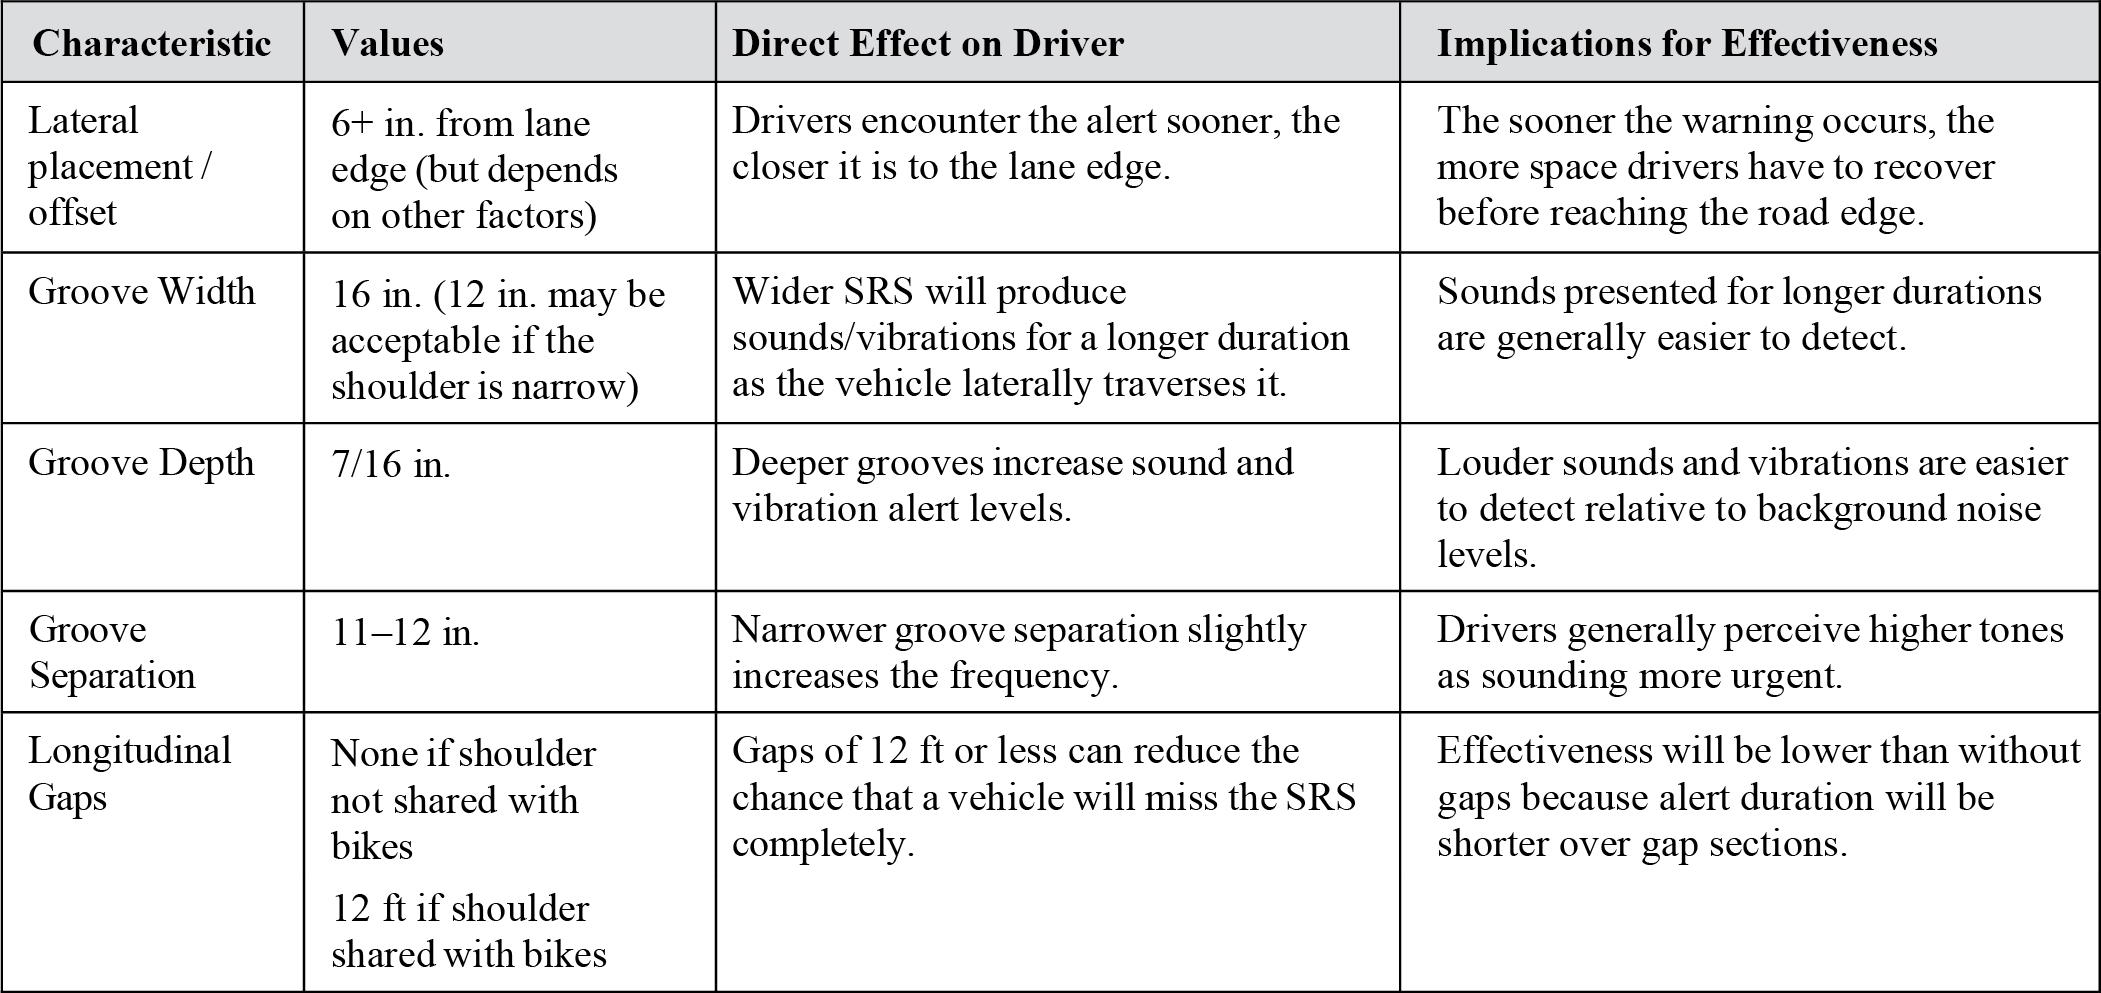
The rationale for the “suitable values” in the guidelines table is discussed in further detail in FHWA (6), Spring (7), and Torbic et al. (4). For the most part, the values also accommodate bicycle traffic on the shoulder.
Design Considerations
An important consideration when installing SRS on non-controlled-access roadways is the impact on bicyclists (and possibly motorcyclists) because several aspects that improve the alerting aspects of rumble strips (e.g., depth) also make SRS more challenging to traverse. A key factor in the suitability of a shoulder for accommodating both SRS and bicycle traffic is the shoulder width (see table below). Bicyclists also need gaps at sufficient frequency to cross the rumble strips in advance of hazards or intersections. Moeur (8) suggests a 12-ft gap in a 60-ft cycle, which will result in 80% coverage of the shoulder with rumble strips and exactly 1.5 times cycle length for lane line striping. Other options are to use a 40-ft cycle, consisting of a 28-ft long rumble strip with a 12-ft gap, though the 40-ft cycle will provide gaps more frequently for a given speed.
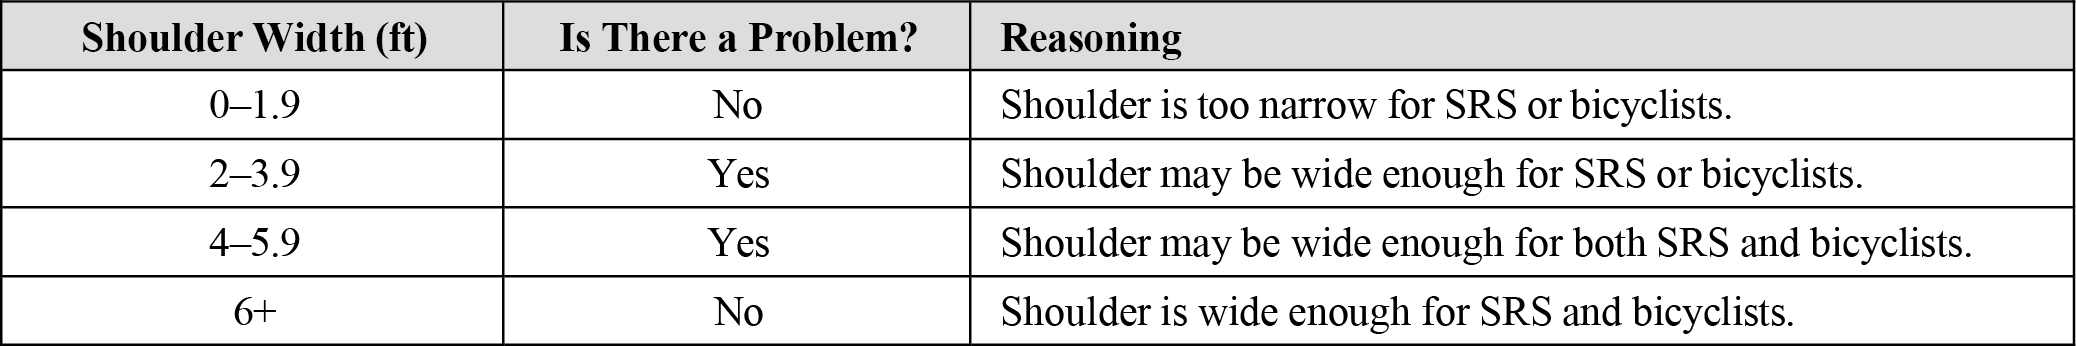
Long Description.
The table has 3 columns: Column 1: Shoulder Width in inches. Column 2: Is there a Problem? Column 3: Reasoning. The data, by row, is as follows: Row 1: 0–1.9; No; Shoulder is too narrow for SRS or bicyclists. Row 2: 2–3.9; Yes; Shoulder may be wide enough for SRS or bicyclists. Row 3: 4–5.9; Yes; Shoulder may be wide enough for both SRS and bicyclists. Row 4: 6+; No; Shoulder is wide enough for SRS and bicyclists.
Cross References
Countermeasures for Pavement/Shoulder Drop-Offs
Key References
1. Griffith, M. S. (1999). Safety evaluation of rolled-in continuous shoulder rumble strips installed on freeways. Transportation Research Record: Journal of the Transportation Research Board, 1665, 28–34.
2. Harkey, D. L., Srinivasan, R., Zegeer, C., Persaud, B., Lyon, C., Eccles, K., Council, F., and McGhee, H. (2005). NCHRP Research Results Digest 299: Crash Reduction Factors for Traffic Engineering and Intelligent Transportation System (ITS) Improvements: State-of-Knowledge Report. Transportation Research Board of the National Academies, Washington, DC.
3. Harwood, D. W. (1993). NCHRP Synthesis 191: Use of Rumble Strips to Enhance Safety. TRB, National Research Council, Washington, DC.
4. Torbic, D. J., Hutton, J. M., Bokenkroger, C. D., Bauer, K. M., Harwood, D. W., Gilmore, D. K., Dunn, J. M., Ronchetto, J. J., Donnell, E. T., Sommer, H. J., III, Garvey, P., Persaud, B., and Lyon, C. (2009). NCHRP Report 641: Guidance for the Design and Application of Shoulder and Centerline Rumble Strips. Transportation Research Board of the National Academies, Washington, DC.
5. OʼHanlon, J. F., and Kelley, G. R. (1974). A Psychophysiological Evaluation of Devices for Preventing Lane Drift and Run-Off-Road Accidents. Goleta, CA: Human Factors Research, Inc.
6. FHWA. (n.d.). Synthesis of Shoulder Rumble Strip Practices and Policies. Washington DC. Retrieved from https://rosap.ntl.bts.gov/view/dot/35972.
7. Spring, G. S. (2003). Shoulder Rumble Strips in Missouri. (RDT 03-007, Final Report). Rolla: University of Missouri.
8. Moeur, R. (2000). Analysis of gap patterns in longitudinal rumble strips to accommodate bicycle travel. Transportation Research Record: Journal of the Transportation Research Board, 1705, 93–98.
DESIGN CONSISTENCY IN RURAL DRIVING
Introduction
Design consistency refers to the conformance of a highwayʼs geometric and operational features with driver expectancy (1). All other factors being equal, drivers will make fewer errors when faced with geometric features that are consistent with their expectations. Note that the guideline information below only provides general information about some of the factors associated with the concept of design consistency. Although research suggests that the factors listed are relevant to design consistency, at this time there is insufficient data to provide detailed quantitative recommendations.

Discussion
As noted on the previous page, design consistency refers to the conformance of a highwayʼs geometric and operational features with driver expectancy (1). In a key study leading to the development of the Interactive Highway Safety Design Model (IHSDM), crash and field data were analyzed, and speed prediction models were developed for a variety of different roadway alignments (3). Four design consistency measures were associated with crash frequency:
- Predicted speed reduction on a horizontal curve relative to the preceding curve or tangent (has the strongest and most sensitive relationship to crash frequency)
- Ratio of an individual curve radius to the average radius for the roadway section as a whole
- Average rate of vertical curvature on a roadway section
- Average radius of curvature on a roadway section
Design consistency is an important concept because the driving task requires continuous/frequent:
- Sampling of visual, auditory, and haptic (touch or feel) cues
- Processing of these cues and decision-making
- Outputs in the form of steering, brake, and accelerator actions
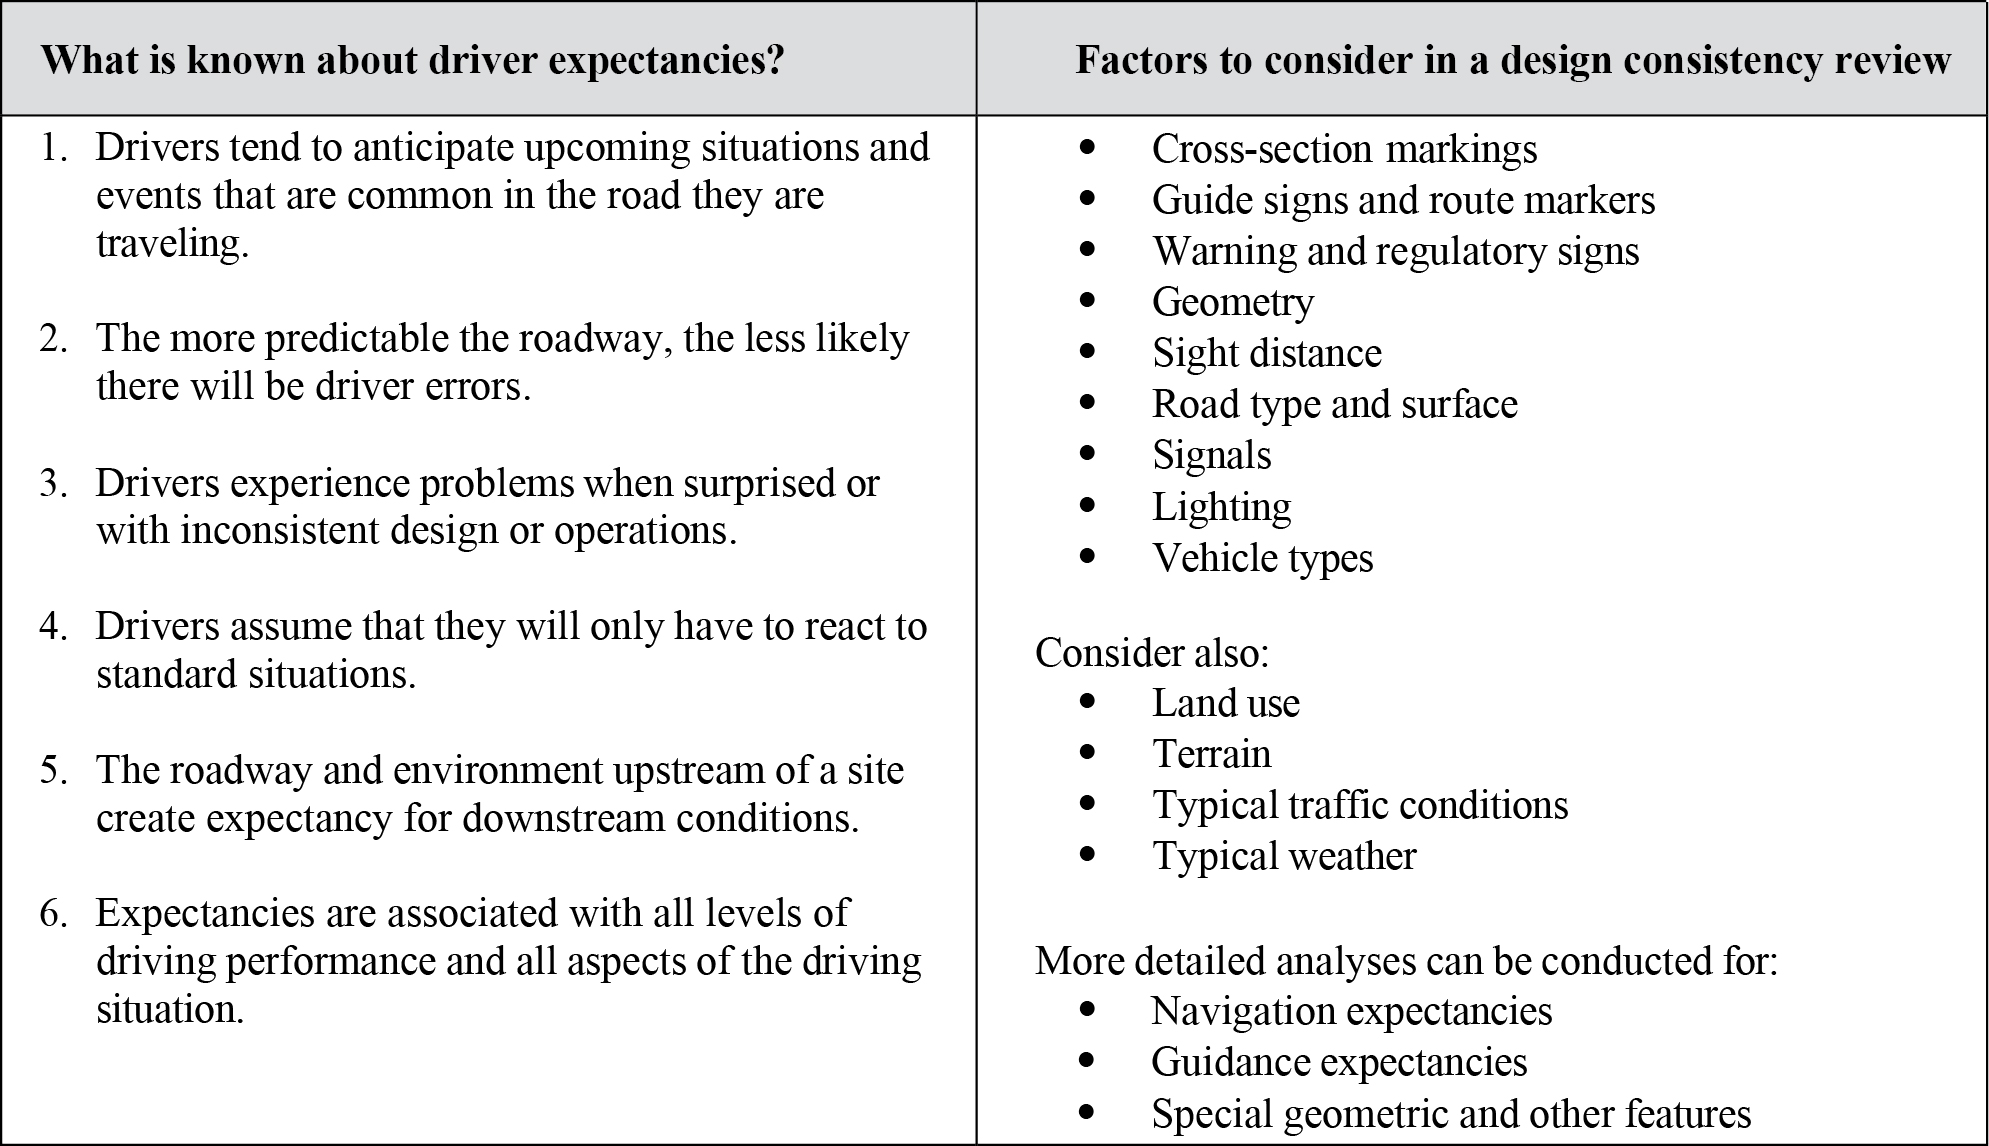
This requirement to continuously “perceive–think–act” takes considerable effort (even when some activities become more or less automated), especially under challenging circumstances such as poor weather, nighttime conditions, heavy traffic, high speeds, etc. Inconsistent roadway design has the potential for increasing driver uncertainty about, for example, where to look for signs, how much illumination to expect from roadway section to roadway section, and how fast to drive. An inability to anticipate and predict the conditions that shape driving decisions and behaviors can lead to higher workload and, ultimately, decrements in driving performance and safety. Thus, minimizing driver workload through consistent layout and alignment of roadways is an important design goal. Although driver expectancies for a roadway can vary widely with respect to their completeness and correctness, there should ideally be a reasonable match between the geometric and operating characteristics of the rural driving environment and the driverʼs expectancies for this environment.
The underlying psychological factor supporting the need for design consistency is the notion of mental models or schemas [see Gentner and Stevens (4)], which—broadly defined in the context of system design—is the userʼs internal understanding and representation of an external reality. In the driving environment, one type of mental model is the driverʼs understanding of the roadway and the surrounding infrastructure, how the roadway system works, and how to operate within it. A key aspect of mental models is that they allow the driver to predict the outcome of his or her driving decisions.
Design Considerations
The IHSDM is a suite of software analysis tools for evaluating the safety and operational effects of geometric design decisions on two-lane rural highways. IHSDM is a decision support tool that checks existing or proposed two-lane rural highway designs against relevant design policy values and provides estimates of a designʼs expected safety and operational performance.
Cross References
Key References
1. Wooldridge, M. D., Fitzpatrick, K., Harwood, D. W., Potts, I. B., Elefteriadou, L., and Torbic, D. J. (2003). NCHRP Report 502: Geometric Design Consistency on High-Speed Rural Two-Lane Roadways. Transportation Research Board of the National Academies, Washington, DC.
2. Lunenfeld, H., and Alexander, G. J. (1984). Human factors in highway design and operations. Journal of Transportation Engineering,110(2), 149–158.
3. Fitzpatrick, K., Elefteriadou, L., Harwood, D. W., Collins, J. M., McFadden, J., Anderson, I. B., Krammes, R. A., Irizarry, N., Parma, K. D., Bauer, K. M., and Passettiet, K. (2000). Speed Prediction for Two-Lane Rural Highways (FHWA-RD-99-171, Final Report). McLean, VA: FHWA.
4. Gentner, D., and Stevens, A. L. (Eds.). (1983). Mental Models. Hillsdale, NJ: Lawrence Erlbaum Associates.
This page intentionally left blank.


