Human Factors Guidelines for Road Systems: Third Edition (2025)
Chapter: 18 Construction and Work Zones

OVERVIEW OF WORK ZONE CRASHES
Introduction
This guideline provides a framework for characterizing work zone crashes and, by extension, provides guidelines for work zone design. It specifies the need for additional driver guidance in work zones based on the number, type and severity of crashes occurring in work zones. The typical work zone crash involves a male driver, age 25–34, who, while driving in clear weather during mid-afternoon on a US Highway or Interstate roadway, comes upon slow or stopped traffic due to construction and crashes into another vehicle. As discussed below, information provided by arrow panels, changeable message signs, and work zone speed limits is critical to safe and efficient work zone operations.

Discussion
In discussions of work zone crashes, some research sources provide specific information about the driver behaviors related to crashes, in addition to the characteristics of overrepresented drivers (e.g., age, gender, etc.). Other sources include the most frequent collision types, overrepresented types of vehicles (e.g., heavy trucks), and the involvement of other vehicles in work zone crashes. There is also information that is more specific to how work zone characteristics may contribute to driver-related factors, including lighting conditions, pavement markings, and the presence of warning signs or cones. Other aspects that are covered include the type of work zone activity in addition to crash characteristics by work zone area (advance warning area, transition area, longitudinal buffer area, activity area, and termination area). The remaining guidelines in this chapter focus on signing and speed limit information for work zones.
Source: FHWA (1).
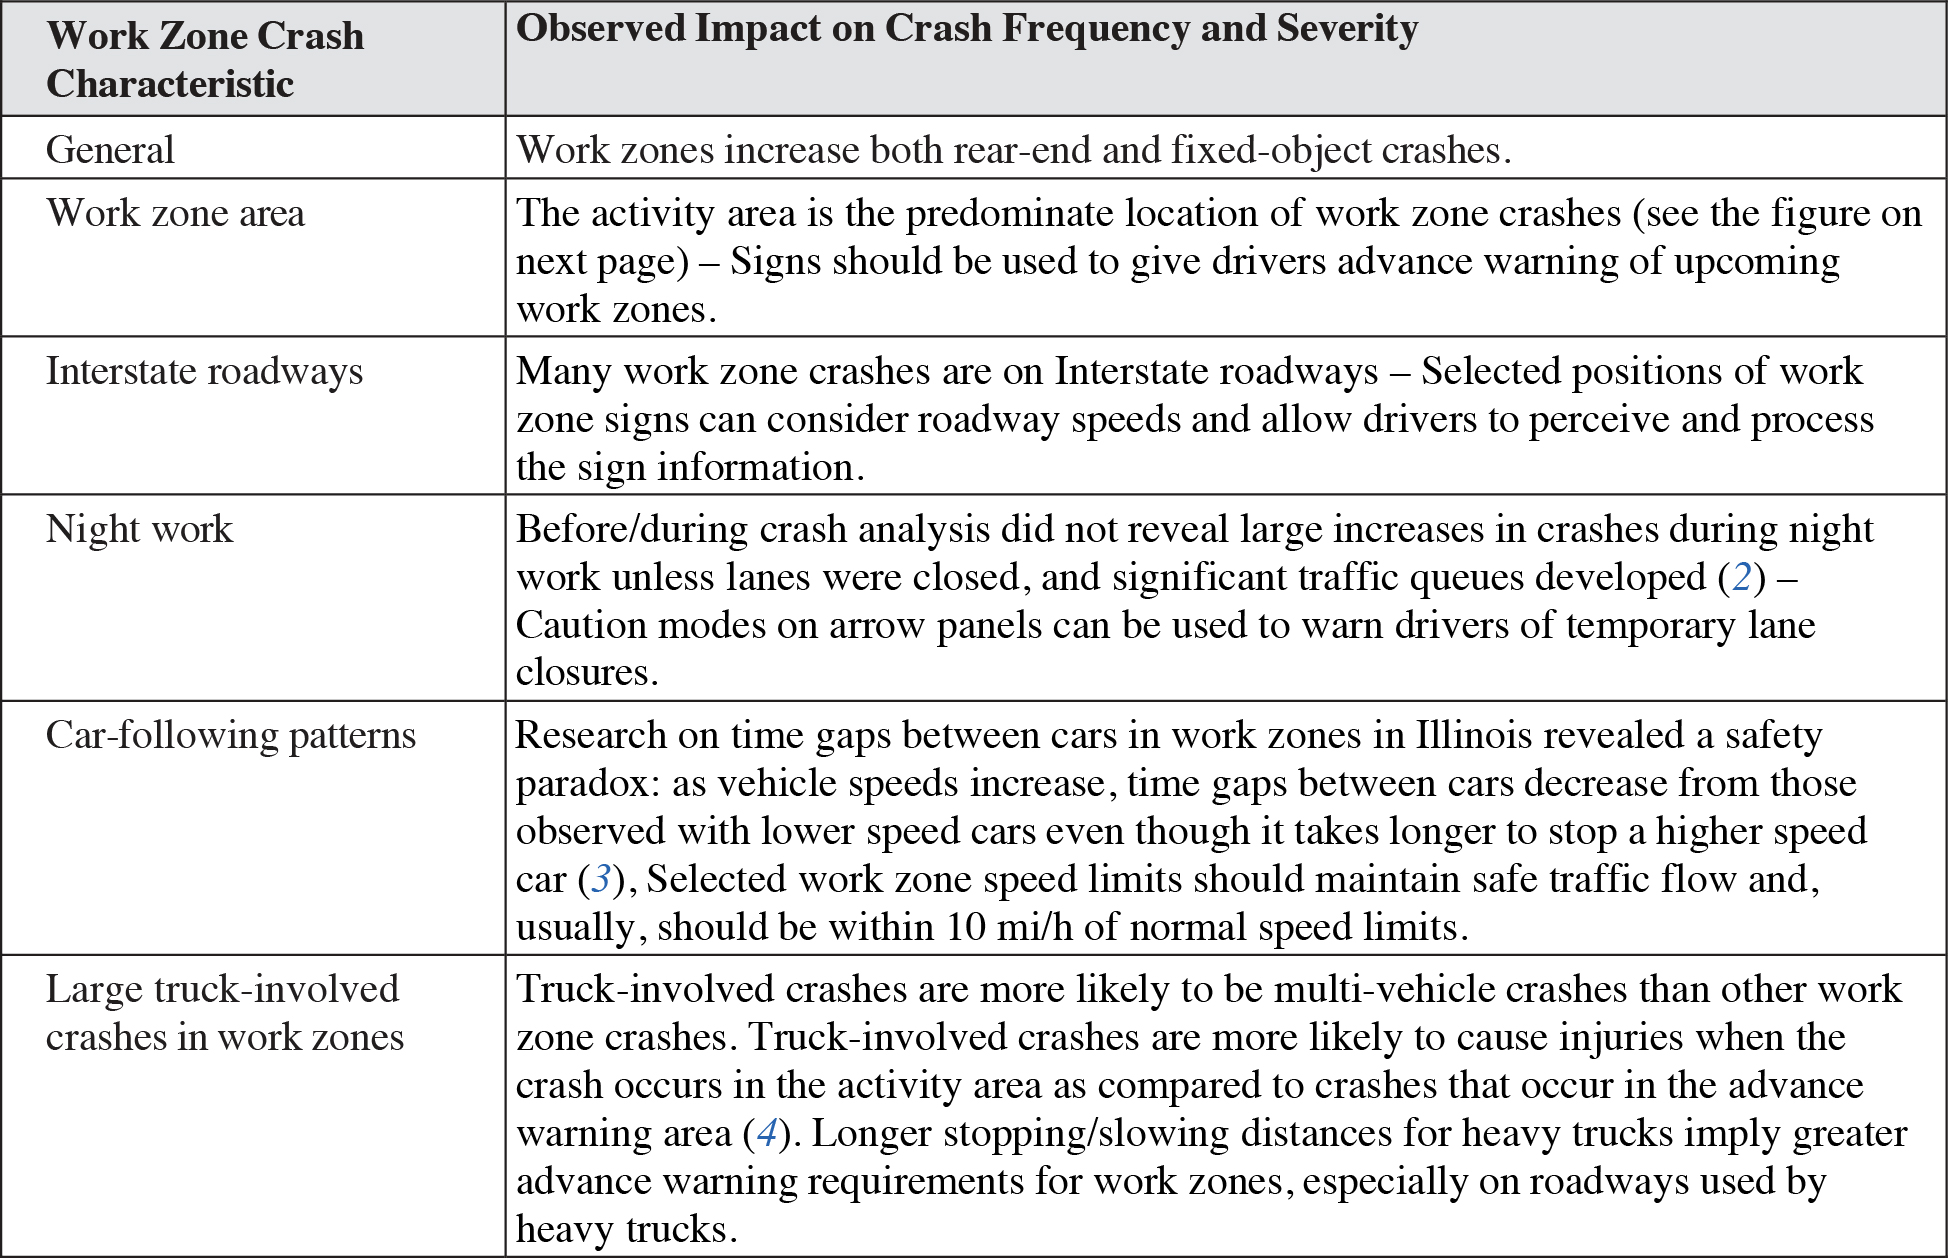
COMPONENT PARTS OF A TEMPORARY TRAFFIC CONTROL ZONE
Long Description.
The zone has an advance warning area that tells traffic what to expect ahead and a transition area that moves traffic out of its normal path. It also has an activity area, which is where work takes place. Within the activity area are two segments: a Buffer space (longitudinal) that provides protection for traffic and workers, and a work space set aside for workers, equipment, and material storage. Next is the Termination Area that lets traffic resume normal operations, within which is a buffer space (longitudinal), buffer space (lateral), activity area, workspace, traffic space, buffer space (longitudinal), downstream taper, and terminal area.
Design Considerations
The rear-end crash is the predominant type of work zone crash. The design of work zones, particularly speed control methods and work zone speed limits, should reduce speed variance or cause drivers to drive at the same speed. This does not necessarily mean lowering the speed limit in the work zone, as a lower speed limit does not always result in a lower speed variance (5).
The study of fatal crashes in Texas work zones determined two design-related countermeasures: (1) design exits or refuge areas at regular intervals where shoulders are removed or no longer available for disabled vehicles and (2) use opposing lane dividers or arrow pavement markings at sites where the travel direction of a lane is changed temporarily, such as when lanes are closed, and two-way traffic is handled in the remaining open lanes (6).
In general, any lack of consistency across states with respect to work zone signage is a problem that should be addressed in future research.
Cross References
Determining Work Zone Speed Limits
Key References
1. FHWA. (2023). Manual on Uniform Traffic Control Devices for Streets and Highways. (11th ed.) Washington, DC.
2. Ullman, G. L., Finley, M. D., and Ullman, B. R. (2004). Assessing the Safety Impacts of Active Night Work Zones in Texas (FHWA/TX-05/0-4747-1). College Station: Texas A&M University.
3. Sun, D., and Benekohal, R. F. (2004). Analysis of car following characteristics for estimating work zone safety. 83rd Annual Meeting of the Transportation Research Board.
4. Khattak, A. J. and Targa, F. (2004). Injury severity and total harm in truck-involved work zone crashes. Transportation Research Record: Journal of the Transportation Research Board, 1877, 106–11.
5. Zhao, M. and Garber, N. J. (2001). Crash Characteristics at Work Zones: Final Report. Charlottesville: University of Virginia.
6. Shrock, S. D., Ullman, G. L., Cothron, A. S., Kraus, E., and Voigt, A. P. (2004). An Analysis of Fatal Work Zone Crashes in Texas. (FHWA/TX-05/0-4028-1). College Station: Texas Transportation Institute.
PROCEDURES TO ENSURE PROPER ARROW PANEL VISIBILITY
Introduction
Arrow panel visibility depends on a number of factors, including the capability of the lamps in the panel, the type of roadway, the physical location of the panel, the panelʼs relation to horizontal and vertical curves, ambient light, and weather. Procedures to ensure arrow panel visibility should include specifications for the arrow panel as well as field procedures to check in-service arrow panels.

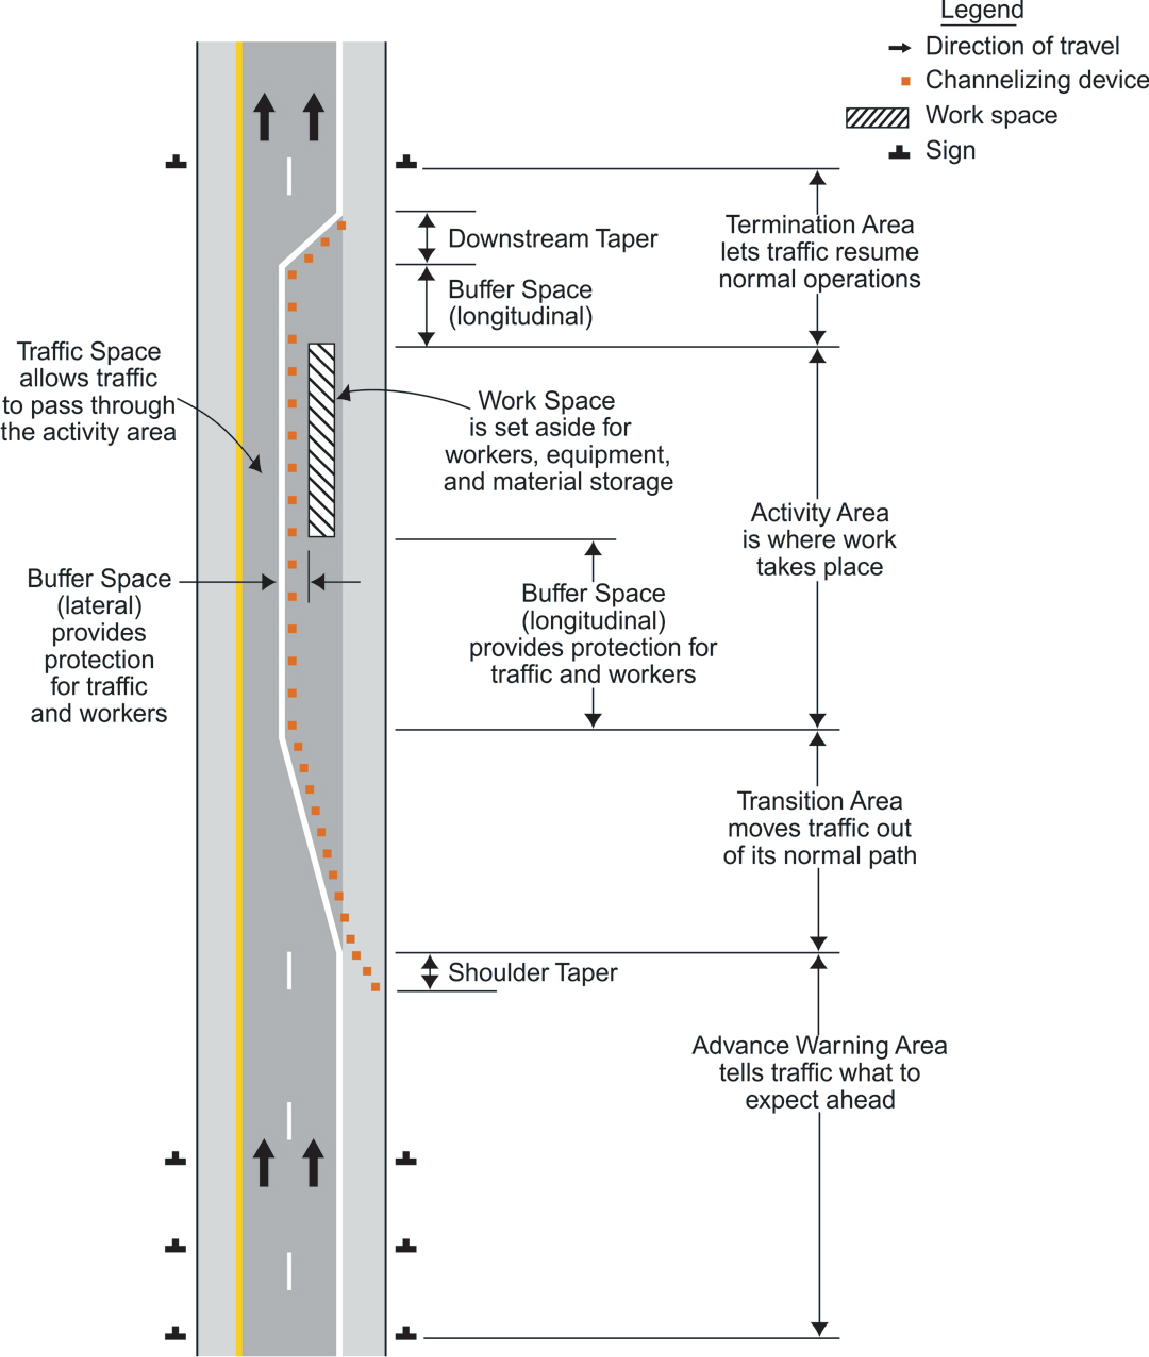
VIEWING ANGLE ON HORIZONTAL CURVE
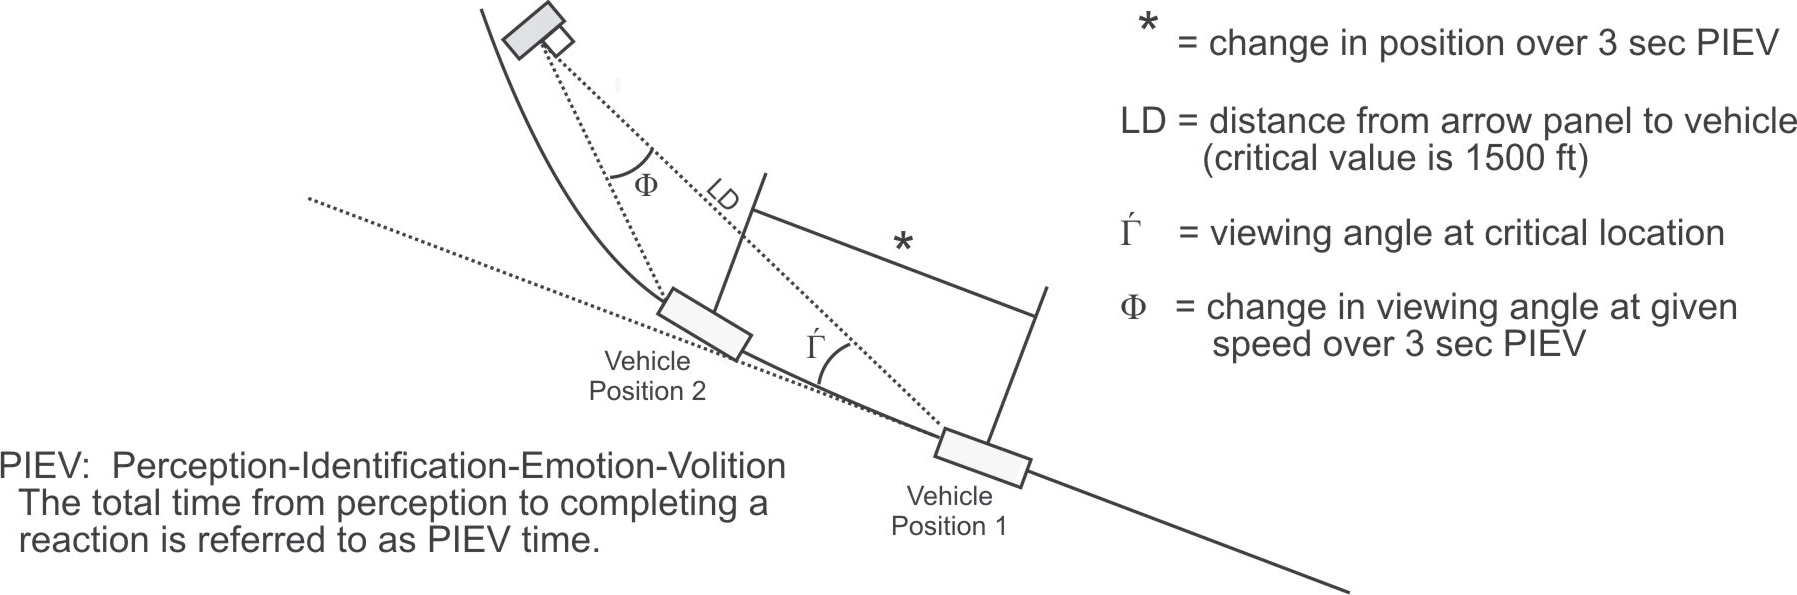
Source: Adapted from Wooldridge et al. (1).
Long Description.
It shows the change in viewing angle at a given speed, viewing angle at critical position, and change in position over 3 seconds PIEV, and distance from arrow panel to vehicle. PIEV is defined as perception-identification-emotion-volition. The total time from perception to completing a reaction is referred to as PIEV time.
Discussion
Human factors studies conducted as part of this research are discussed in detail in Knapp and Pain (2).
In Graham et al. (3), the effect of arrow panels was judged in three situations: (1) when a lane is closed, (2) in diversions where the traffic route is modified without a lane reduction, and (3) in shoulder work zones. The following findings were reported:
- In lane closures, the presence of an arrow panel produced lane changing patterns that are closer to ideal. In other words, the arrow panel encouraged drivers to leave the closed lane sooner and, consequently, fewer lane changes occurred close to the lane closure taper.
- In traffic diversions, arrow panels produced some unnecessary lane changing; however, the number of these lane changes was small, particularly at night and for truck traffic. Overall, the use of arrow panels for diversions was not shown to be beneficial.
- Arrow panels had little effect on traffic operations in moving shoulder closures on freeways. Conflicts due to slow-moving vehicles were greater when the caution-bar mode was used.
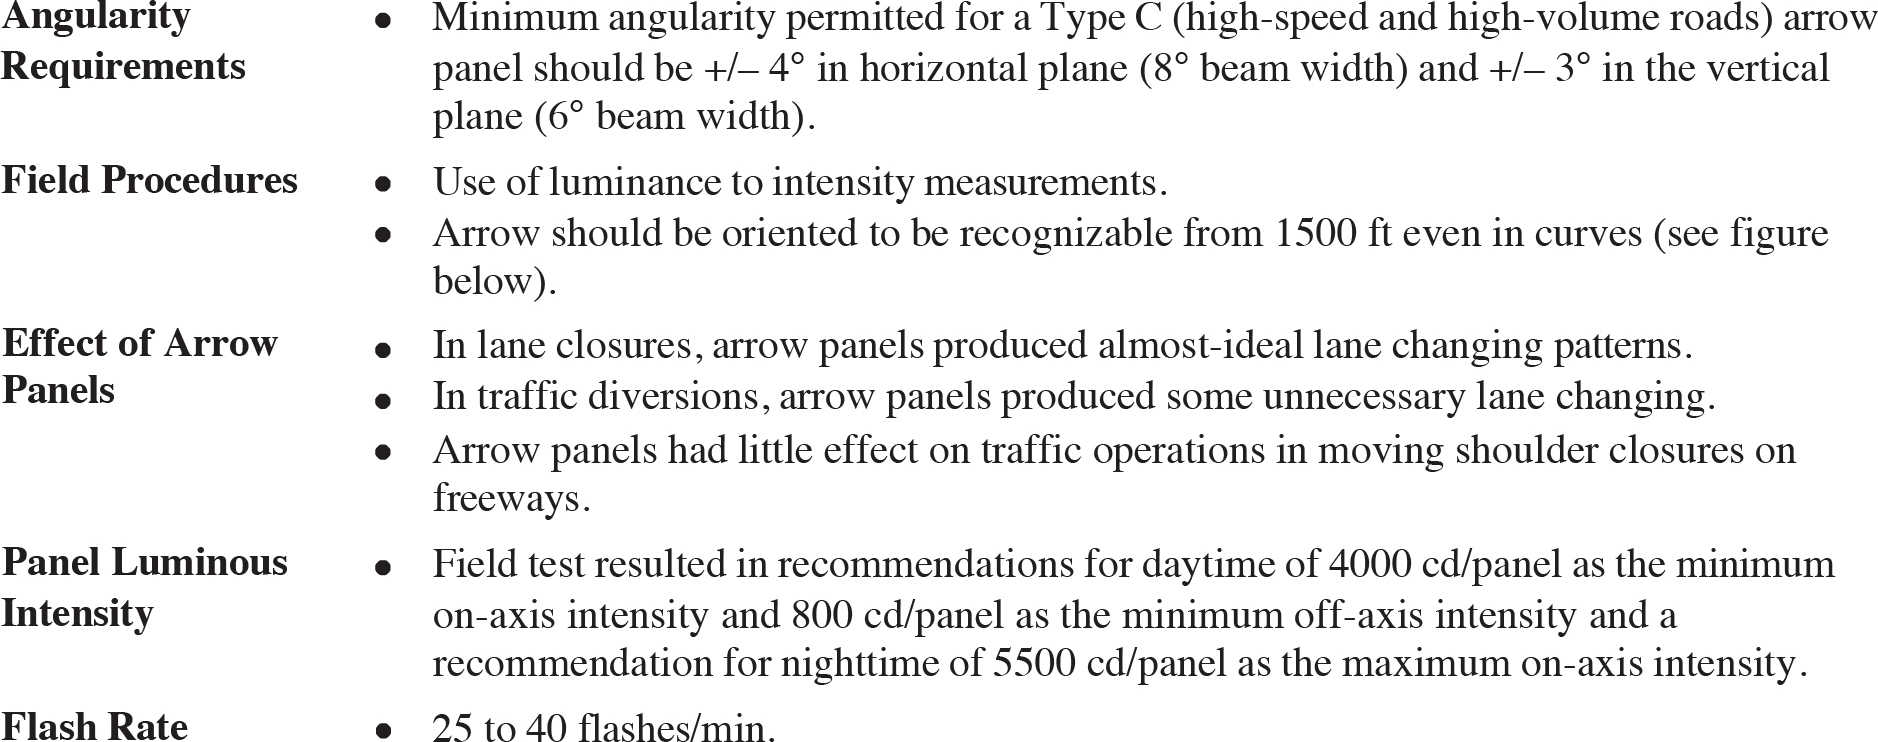
- No differences were detected in the effect of various arrow panel modes such as the flashing arrow or sequential chevron. The MUTCD (4) states that arrow panels should “not be used to indicate a lane shift.” Additionally, a separate arrow panel should be used for each closed lane in a multilane closure.
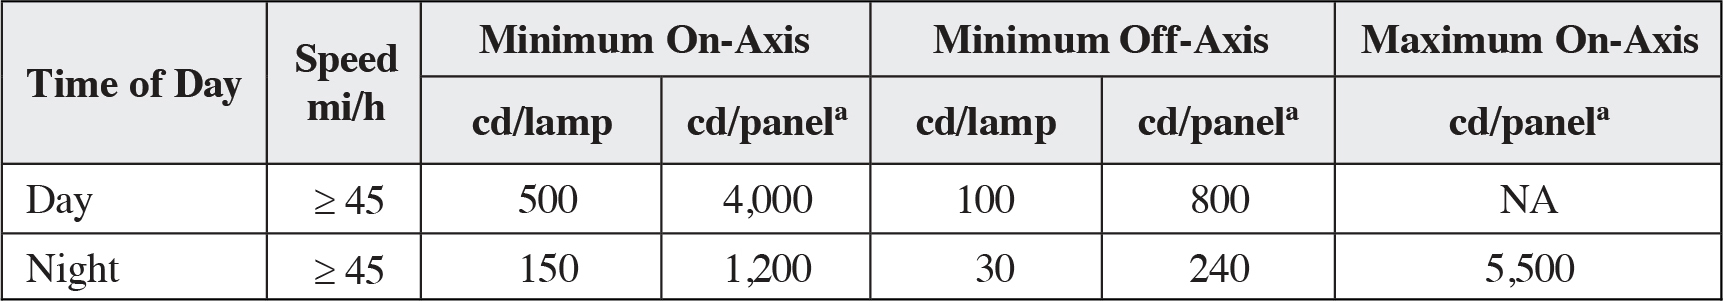
Wooldridge et al. (1) made the following recommendations based on a field test conducted to examine requirements for panel luminance intensity:
- Minimum nighttime on-axis intensity of 150 cd/lamp luminance.
- Minimum nighttime off-axis intensity of 30 cd/lamp luminance.
- Minimum daytime on-axis intensity of 500 cd/lamp luminance.
- Minimum daytime off-axis intensity of 100 cd/lamp luminance.
- If arrow panels are located on curves, orient them to be seen by a vehicle 1500 ft upstream.
- Realign the arrow panel to be perpendicular to the driverʼs line of sight at the distance desired for observation.
- Minimum daytime on-axis intensity of 4000 cd/panel, minimum daytime off-axis intensity of 800 cd/panel, and maximum nighttime on-axis intensity of 5500 cd/panel.
Design Considerations
Field conditions such as fog or a high level of ambient light (advertising signs) might impact the visibility of the arrow panel in the field.
Mace et al. note that the arrow panel should flash at a rate of 25 to 40 flashes per minute (5).
Cross References
Determining When to Use Decision Sight Distance
Key References
1. Wooldridge, M. D., Finley, M., Denholm, J., Mace, D., and Patrick, B. (2001). Photometric Requirements for Arrow Panels (TX-02/4940-1). College Station: Texas A&M University.
2. Knapp, B., and Pain, R. F. (1979). Human factors considerations in arrow-board design and operation. Transportation Research Record: Journal of the Transportation Research Board, 703, 1–8.
3. Graham, J. L., Migletz, J., and Glennon, J. C. (1978). Guidelines for the Applications of Arrow Boards in Work Zones (FHWA-RD-79-58). Washington, DC: FHWA.
4. FHWA. (2023). Manual on Uniform Traffic Control Devices. (11th ed.) Washington, DC.
5. Mace, D., Finkle, M., and Pennack, S. (2001). NCHRP Research Results Digest 259: Guidelines for the Effective Use and Procurement of Advanced Warning Arrow Panels. TRB, National Research Council, Washington, DC.
CHANGEABLE MESSAGE SIGNS
Introduction
Changeable message signs (CMSs) are electronic, reconfigurable signs placed above or near the roadway. They are used to inform motorists of specific conditions or situations. CMSs can communicate messages clearly in a brief period of time. Improper CMS usage defeats its credibility and can cause motorist confusion. Display messages ideally should be limited to a maximum of two phases. Many three-phase messages can be reduced to two or one phase by eliminating unnecessary wording. Other issues to avoid include splitting information across phases, using multiple formats of calendar dates, and displaying out-of-date information.

The following table provides examples of how to revise a message to reduce reading time:
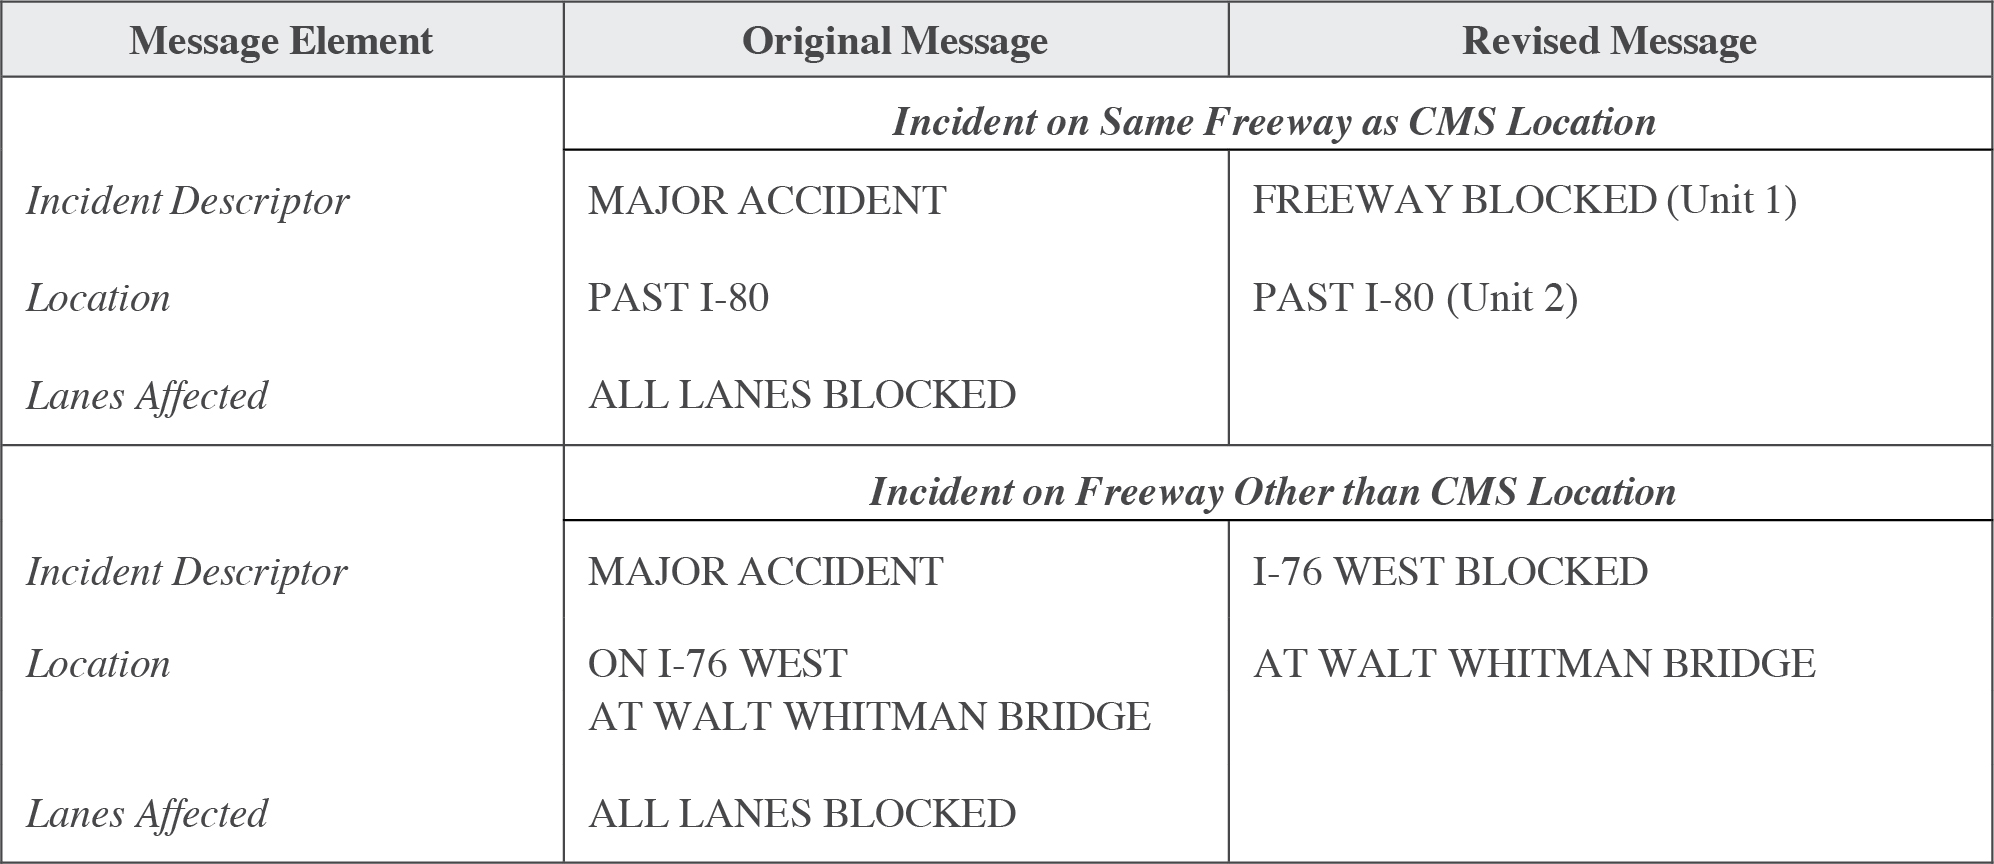
Long Description.
The table has 3 columns: Message Element, Column 2: Original Message. Column 3: Revised Message. Rows 1 to 3 are in a section labeled Incident on Same Freeways as CMS Location. Row 1, Column 1: Incident Descriptor. Column 2: MAJOR ACCIDENT. Column 3: FREEWAY BLOCKED (Unit 1). Row 2, Column 1: Location. Column 2: PAST I-80. Column 3: PAST I-80 (Unit 2). Row 3, Column 1: Lanes Affected. Column 2: ALL LANES BLOCKED. Column 3: Blank. Rows 4 to 6 are in a section labeled Incident on Freeway Other than CMS Location. Row 4, Column 1: Incident Descriptor. Column 2: MAJOR ACCIDENT. Column 3: I-76 WEST BLOCKED. Row 5, Column 1: Location. Column 2: ON I-76 WEST. AT WALT WHITMAN BRIDGE. Column 3: AT WALT WHITMAN BRIDGE. Row 6, Column 1: Lanes Affected. Column 2: ALL LANES BLOCKED. Column 3: blank
Discussion
Message length and format. Because of the limited space on CMSs, suggestions for use are as follows:
- Messages should abbreviate the month in conjunction with the date.
- When future work will span days, the month should be noted only once in the message.
Other factors to consider include the following:
- Attempts to present day, date, and time information about upcoming roadwork appear to approach the limits of driver information processing abilities.
- Regardless of the format used, only about two-thirds to three-quarters of the drivers viewing the portable changeable message sign (PCMS) will be able to correctly tell whether the work activity will affect their trip (2).
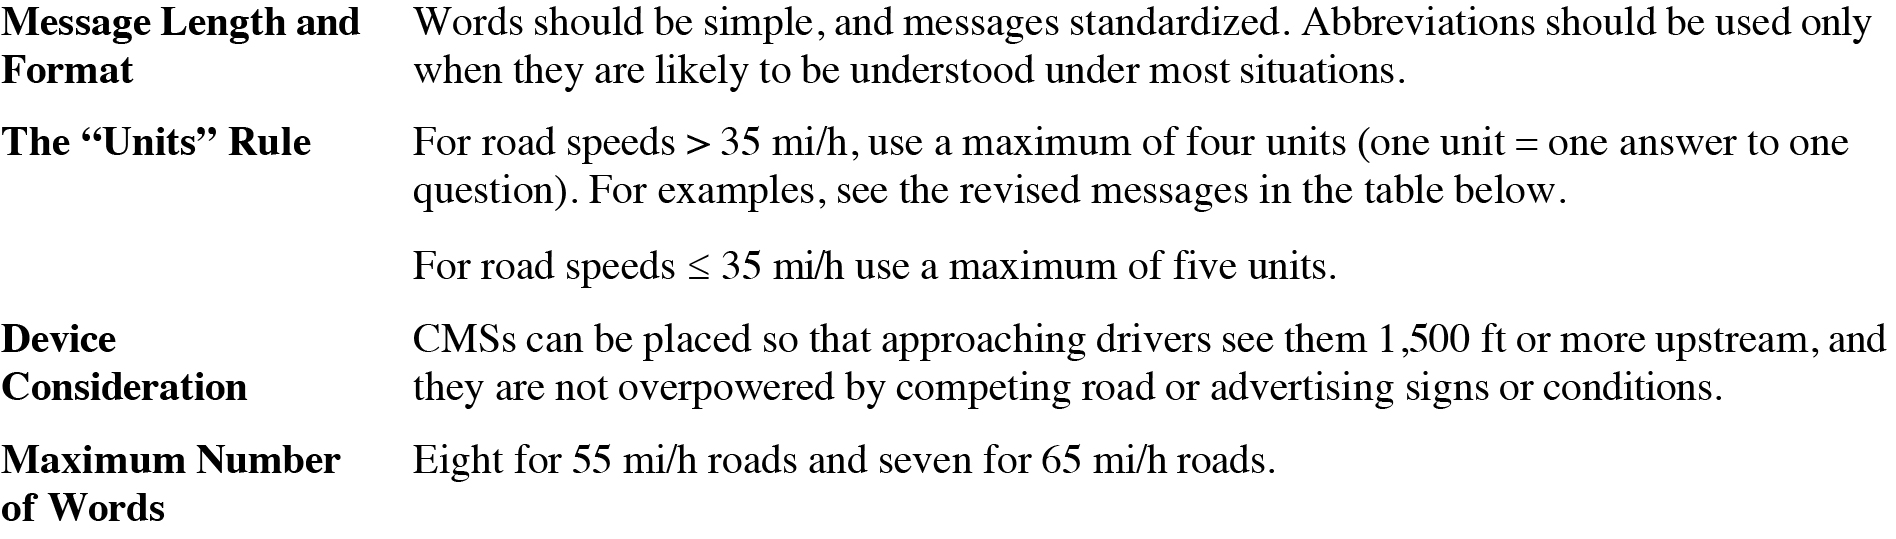
The “Units” rule. One unit of information equals one answer for one question. Research and operational experience suggest that no more than four units of information should be in a CMS when the traffic operating speeds are 35 mi/h or more. No more than five units of information should be displayed when the operating speeds are less than 35 mi/h. In addition, no more than three units of information should be displayed on a single message frame (1).
Because motorists can process only a limited amount of information at a given time, legibility and distance must be kept in mind. Based on the known legibility distance of CMSs, the calculated maximum message length that can be read by motorists is eight words for a traveling speed of 55 mi/h and seven words for a speed of 65 mi/h. A driver traveling at 60 mi/h is moving at 88 ft/s and can see a CMS for only 7.4 s at that speed (generally a CMS is legible for 650 ft) (1).
Device consideration. The Institute for Transportation Engineersʼ (ITE) proposed equipment standard states that each PCMS unit shall be self-contained and consist of a message board, controller, power supply, electric cable, and adjustable height structural support system. The PCMS shall be suitable for either moving on a truck or two-wheeled trailer (3). The MUTCD (4) states that PCMSs mounted on trailers or large trucks should have a minimum letter height of 450 mm (18 in.). CMSs mounted on service patrol trucks should have a minimum height of 250 mm (10 in.). Each character should consist of a matrix at least five pixels wide and seven pixels high. The color of the elements should be yellow or orange on a black background. In addition, research suggests the following guidelines for CMS use:
- Device format should permit maximum amount of information display at a glance.
- CMS devices should be located 0.75 mi in advance of closure.
- CMS devices are to be considered supplemental to currently applied standard traffic control device schemes.
- A portable CMS device may be used to simulate an arrow board display (4).
Design Considerations
None.
Cross References
Changeable Message Signs, Chapter 22
Older Driver Considerations for Work Zones – Signs
Key References
1. Dudek, C. (2002). Guidelines for changeable message sign messages. TMC Pooled-Fund Study Annual Meeting. Retrieved July 21, 2006, from http://tmcpfs.ops.fhwa.dot.gov/meetings/mtg_detail.cfm?id=10
2. Ullman, G. L., Ullman, B. R, Dudek, C. L, Williams, A., and Pesti, G. (2005). Advanced Notification Messages and Use of Sequential Portable Changeable Message Signs in Work Zones. College Station: Texas A&M University.
3. ITE. (1988). Portable bulb-type changeable message signs for highway work zones: Proposed equipment standard. ITE Journal, 58(4), 17–20.
4. FHWA. (2023). Manual on Uniform Traffic Control Devices. (11th ed.) Washington, DC.
SIGN LEGIBILITY
Introduction
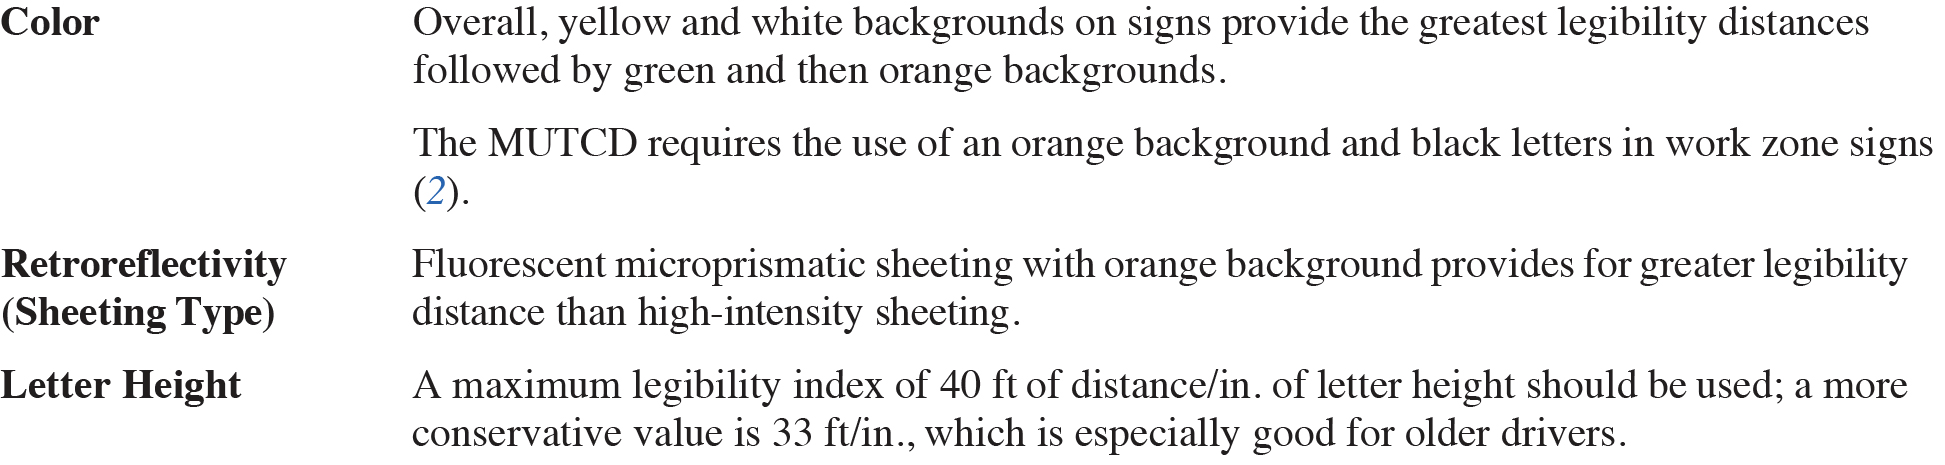
Sign legibility refers to specific design characteristics of work zone signs that contribute to driversʼ ability to perceive and understand the signʼs message. A number of factors determine the legibility of work zone signs, including retroreflectivity (sheeting type), color, letter font, and location of the sign (roadside or overhead). The legibility index of various sign sheeting can be used to develop designs that can accommodate all drivers regardless of age and light conditions. Prismatic sheeting ensures greater retroreflectivity of work zone signs, and the addition of fluorescent colors improves the signʼs conspicuity in daytime low-light conditions such as dusk, dawn, or fog conditions.

The figure below describes legibility distance for work zone signs.
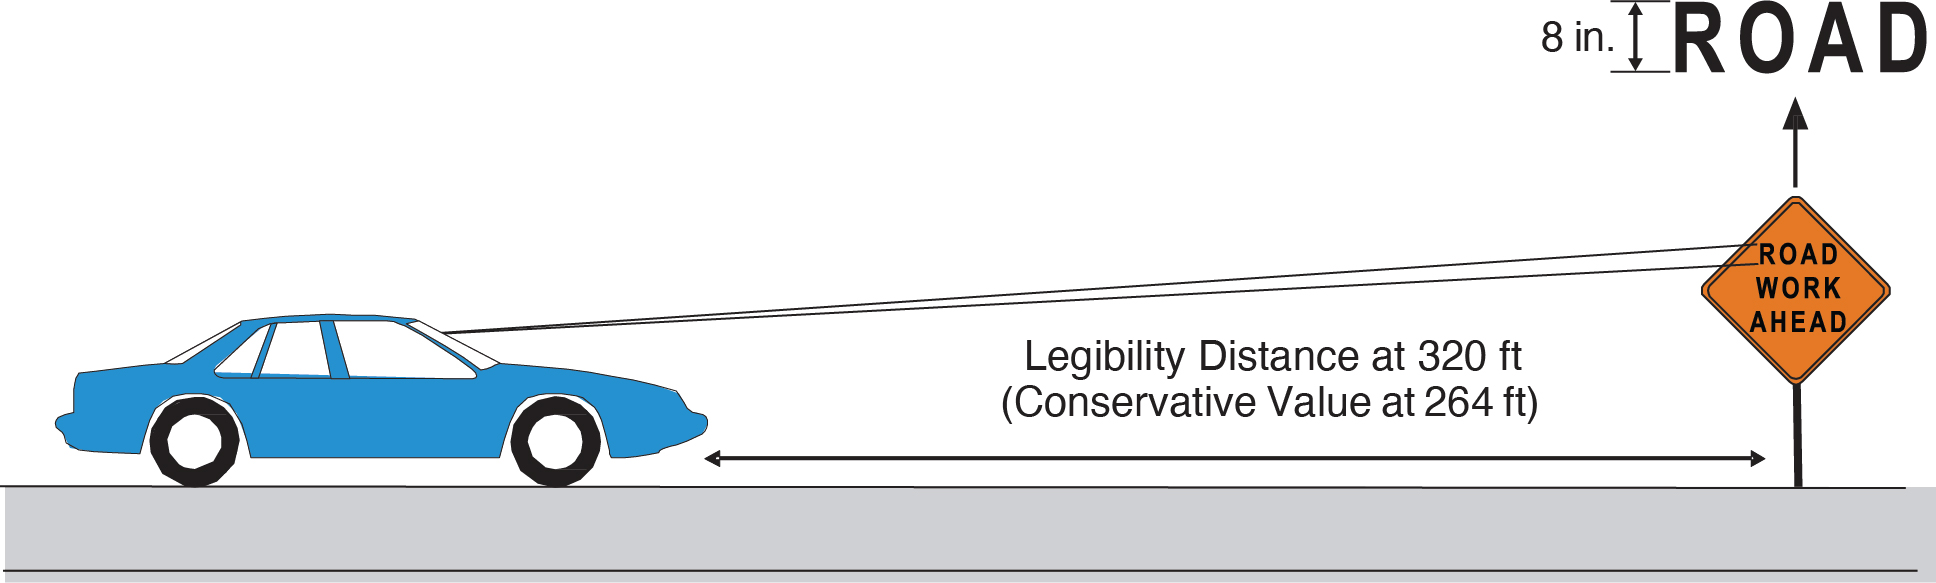
Long Description.
The legibility distance for the road work ahead sign is marked as 320 feet (conservative value of 264 feet). The height of the text on the road work ahead sign is marked as 8 inches.
Discussion
Retroreflectivity. A report by the Virginia Transportation Research Council has specified that for a prismatic lens retroreflective sheeting material, the specification should include values for the materialʼs orientation and rotation angles, in addition to its entrance and observation angles (3). For high-speed (usually greater than 50 mi/h) highways, anywhere a critical vehicle maneuver is necessary, and in areas of high to medium visual complexity, higher values of sign luminance are required for safety (4). Another report finds that for existing traffic control devices, the beneficial effects of upgrading the type of sheeting used on barrels, barricades, and vertical panels were demonstrated by increased detection and recognition distances. However, the super-engineering grade offered the most cost-effective and balanced solution for upgrading sheeting (5).
Legibility. A study has recommended the use of work zone signs with orange background, microprismatic materials, which provide far greater legibility distance than high-intensity ones (6). Microprismatic fluorescent orange materials were found to perform better than Type 3 (1).
Color. Speed variances tended to decrease at the midpoint and the taper with fluorescent signs relative to standard orange signs. The collision reduction in the overall traffic conflicts from what was expected at all treatment sites was about 7% (6).
Design Considerations
The height of letters used depends on site characteristics such as operating speed (1).
Cross References
None.
Key References
1. Chrysler, S. T., Carlson, P. J., and Hawkins, H. G. (2003). Nighttime legibility of traffic signs as a function of font, color, and retroreflective sheeting. 82nd Annual Meeting of the Transportation Research Board.
2. FHWA. (2023). Manual on Uniform Traffic Control Devices. (11th ed.) Washington, DC.
3. Brich, S. C. (2002). A Determination of the Appropriateness of Virginiaʼs Retroreflective Sign Sheeting Specification for Fluorescent Orange Construction and Maintenance Signs. (FHWA/VTRC 03-R5). Charlottesville: Virginia Transportation Research Council.
4. Russell, E. R., and Rys, M. (1992). A Review of Kansas Department of Transportationʼs Reflective Sheeting Policy. Final Report. Manhattan: Kansas State University.
5. Ahmed, S. A. (1991). Evaluation of Retroreflective Sheetings for Use on Traffic Control Devices at Construction Work Zones. Final Report. Stillwater: Oklahoma State University.
6. Hummer, J. E., and Scheffler, C. R. (1999). Driver performance comparison of fluorescent orange to standard orange work zone traffic signs. Transportation Research Record: Journal of the Transportation Research Board, 1657, 55–62.
DETERMINING WORK ZONE SPEED LIMITS
Introduction
Work zone speed limits refer to the reduced speed limits used in work zones to reduce errors and crashes associated with traffic flow. Vehicle speeds in work zones are influenced by the geometrics of the roadway and the location of various work zone features such as lane closure tapers and work activity. Work zone speed limits within 10 mi/h of normal speed limits have more credibility and have been proven to be safer than speed limits that are 15 to 30 mi/h below the normal speed limit.

SPEED CONSIDERATIONS IN WORK ZONES
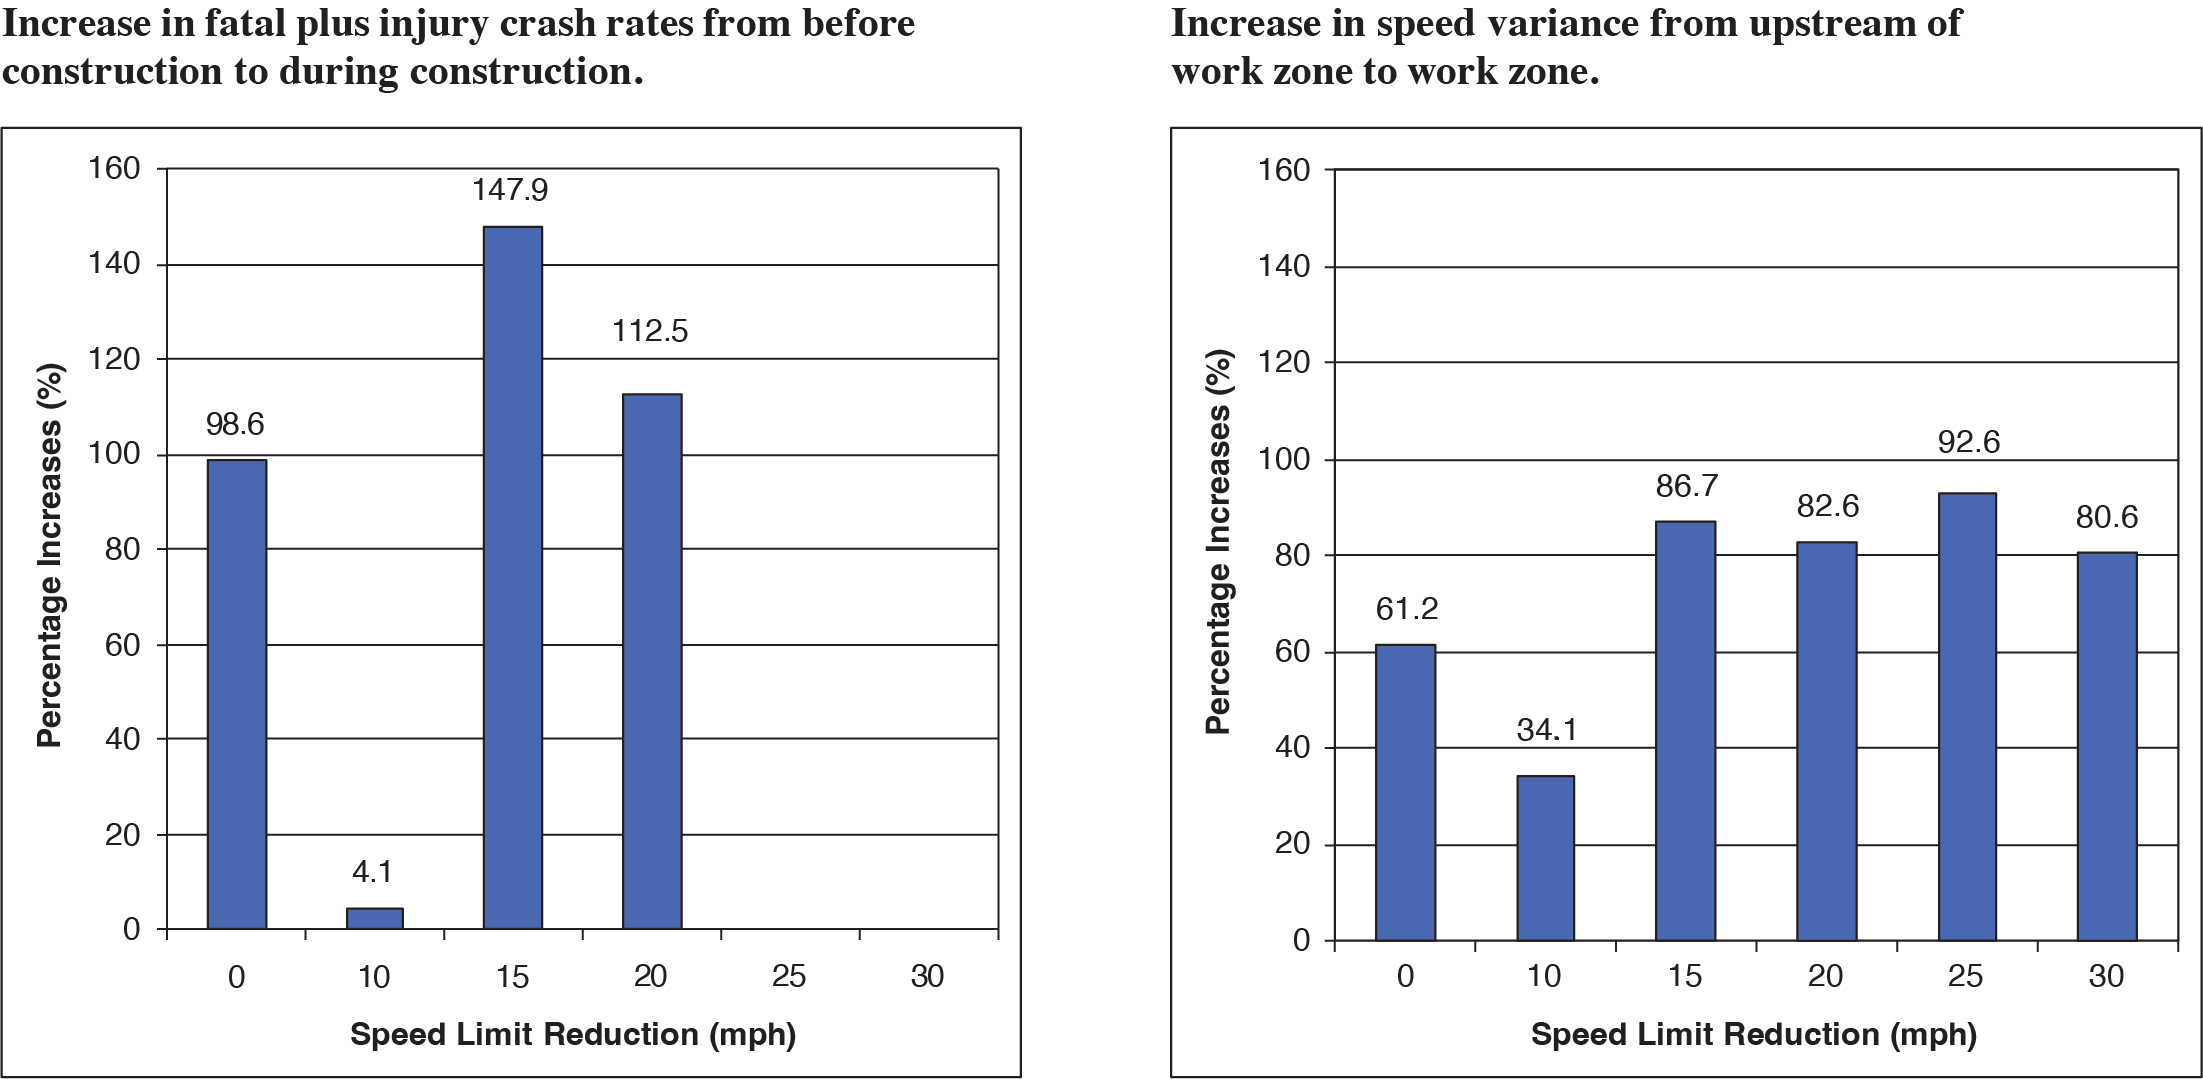
Long Description.
The data show a 98.6 percent increase for a speed limit reduction of 0 miles per hour, a 4.1 percent increase for a speed limit reduction of 10 miles per hour, a 147.9 percent increase for a speed limit reduction of 15 miles per hour, and a 112.5 percent increase for a speed limit reduction of 20 miles per hour.
Long Description.
The data show a 61.2 percent increase for a speed limit reduction of 0 miles per hour, a 34.1 percent increase for speed limit reductions of 10 miles per hour, an 86.7 percent increase for speed limit reductions of 15 miles per hour, an 82.6 percent increase for speed limit reductions of 20 miles per hour, a 92.6 percent increase for speed limit reductions of 25 miles per hour, and an 80.6 increase for speed limit reductions of 30 miles per hour.
Discussion
Speed reductions and speed limit. Studies have found that speed limit compliance decreased when the speed limit was reduced by more than 10 mi/h. Mean speeds were approximately 5 mi/h lower within work zones with no speed limit reduction than they were upstream of the same work zones. Speed limit compliance was found to be the greatest in work zones where the speed limit was not reduced (1). Another study noted that the mean and 85th percentile speeds were approximately 9 mi/h lower within the work zones of speed limit reductions of 10 mi/h than upstream of those same work zones and showed that the entire traffic stream uniformly reduced speeds (2). In general, speed reduction is better achieved when the work zone is well marked in advance of the work zone activity; motorists slow down out of self-preservation and not the speed limit. Note that people drive the speed they feel comfortable with, regardless of the posted speed limit, if enforcement is not present (3), whereas speed reduction as high as 9.1 mi/h was observed with the presence of police (4).
Lane widths and number of lanes. Lane widths can be directly related to speed reduction on roadways. For 10.5-ft lanes, the observed reduction of 7.2 mi/h was 69% greater than the value of 4.25 mi/h recommended by the Highway Capacity Manual (5). In addition, speed reduction appears to be highly correlated with the number of open lanes. Motorists tend to select higher speeds, regardless of the posted work zone speed limit, when more lanes are open to traffic (6).
Speed display. CMSs with radar were successful in effecting significant speed reduction in work zones. Also, no significant differences were found to exist in the speed reductions between vehicle types (7). However, another study found that the use of work zone speed limit signs with flashing beacons produced mixed results. Speed reductions were insignificant on urban arterials where commercial advertisements and other traffic control devices compete for driversʼ attention (8).
Design Considerations
A work zone speed limit may also be affected by restrictive geometric features such as curves or intersections.
Cross References
Influence of Speed on Sight Distance
Key References
1. Migletz, J., Graham, J., Hess, B., Anderson, I., Harwood, D., and Bauer, K. (1998). Effectiveness and Implementability of Procedures for Setting Work Zone Speed Limits. NCHRP Project 3-41(2) Final Report. TRB, National Research Council, Washington, DC.
2. Sisiopiku, V. P., Lyles, R. W., Krunz, M., Yang, Q., Akin, D., and Abbasi, M. (1999). Study of Speed Patterns in Work Zones. East Lansing: Michigan State University.
3. Fors, C. (2000). Work zone ahead: reduce speed. Roads and Bridges, 38(1), 58–61.
4. Lyles, R. W., and Sisiopiku, V. P. (1999). An Evaluation of Speed Control Techniques in Work Zones (Work Zones 2). East Lansing: Michigan State University.
5. Chitturi, M. V., and Benekohal, R. F. (2005). Effect of lane width on speeds of cars and heavy vehicles in work zones. Transportation Research Record: Journal of the Transportation Research Board, 1920, 41–48.
6. Sawaya, O. B., and Schofer, J. L. (2000). Speed up, or slow down. World Highways/Routes Du Monde, 9(6), 78–79.
7. Fontaine, M. D., and Garber, N. J. (1996). Controlling Vehicle Speeds in Work Zones: Effectiveness of Changeable Message Signs with Radar (UVA/529242/CE96/102). Charlottesville: University of Virginia.
8. Hall, J., and Wrage, E. (1997). Controlling Vehicle Speeds in Highway Construction Zones (NMSHTD-97-07). Albuquerque: University of New Mexico.
This page intentionally left blank.


