Human Factors Guidelines for Road Systems: Third Edition (2025)
Chapter: 14 Speed Perception, Speed Choice, and Speed Control

CHAPTER 14
Speed Perception, Speed Choice, and Speed Control
Behavioral Framework for Speeding
Speed Perception and Driving Speed
Effects of Roadway Factors on Speed
Effects of Posted Speed Limits on Speed Decisions
Speeding Countermeasures: Setting Appropriate Speed Limits
Speeding Countermeasures: Communicating Appropriate Speed Limits
BEHAVIORAL FRAMEWORK FOR SPEEDING
Introduction
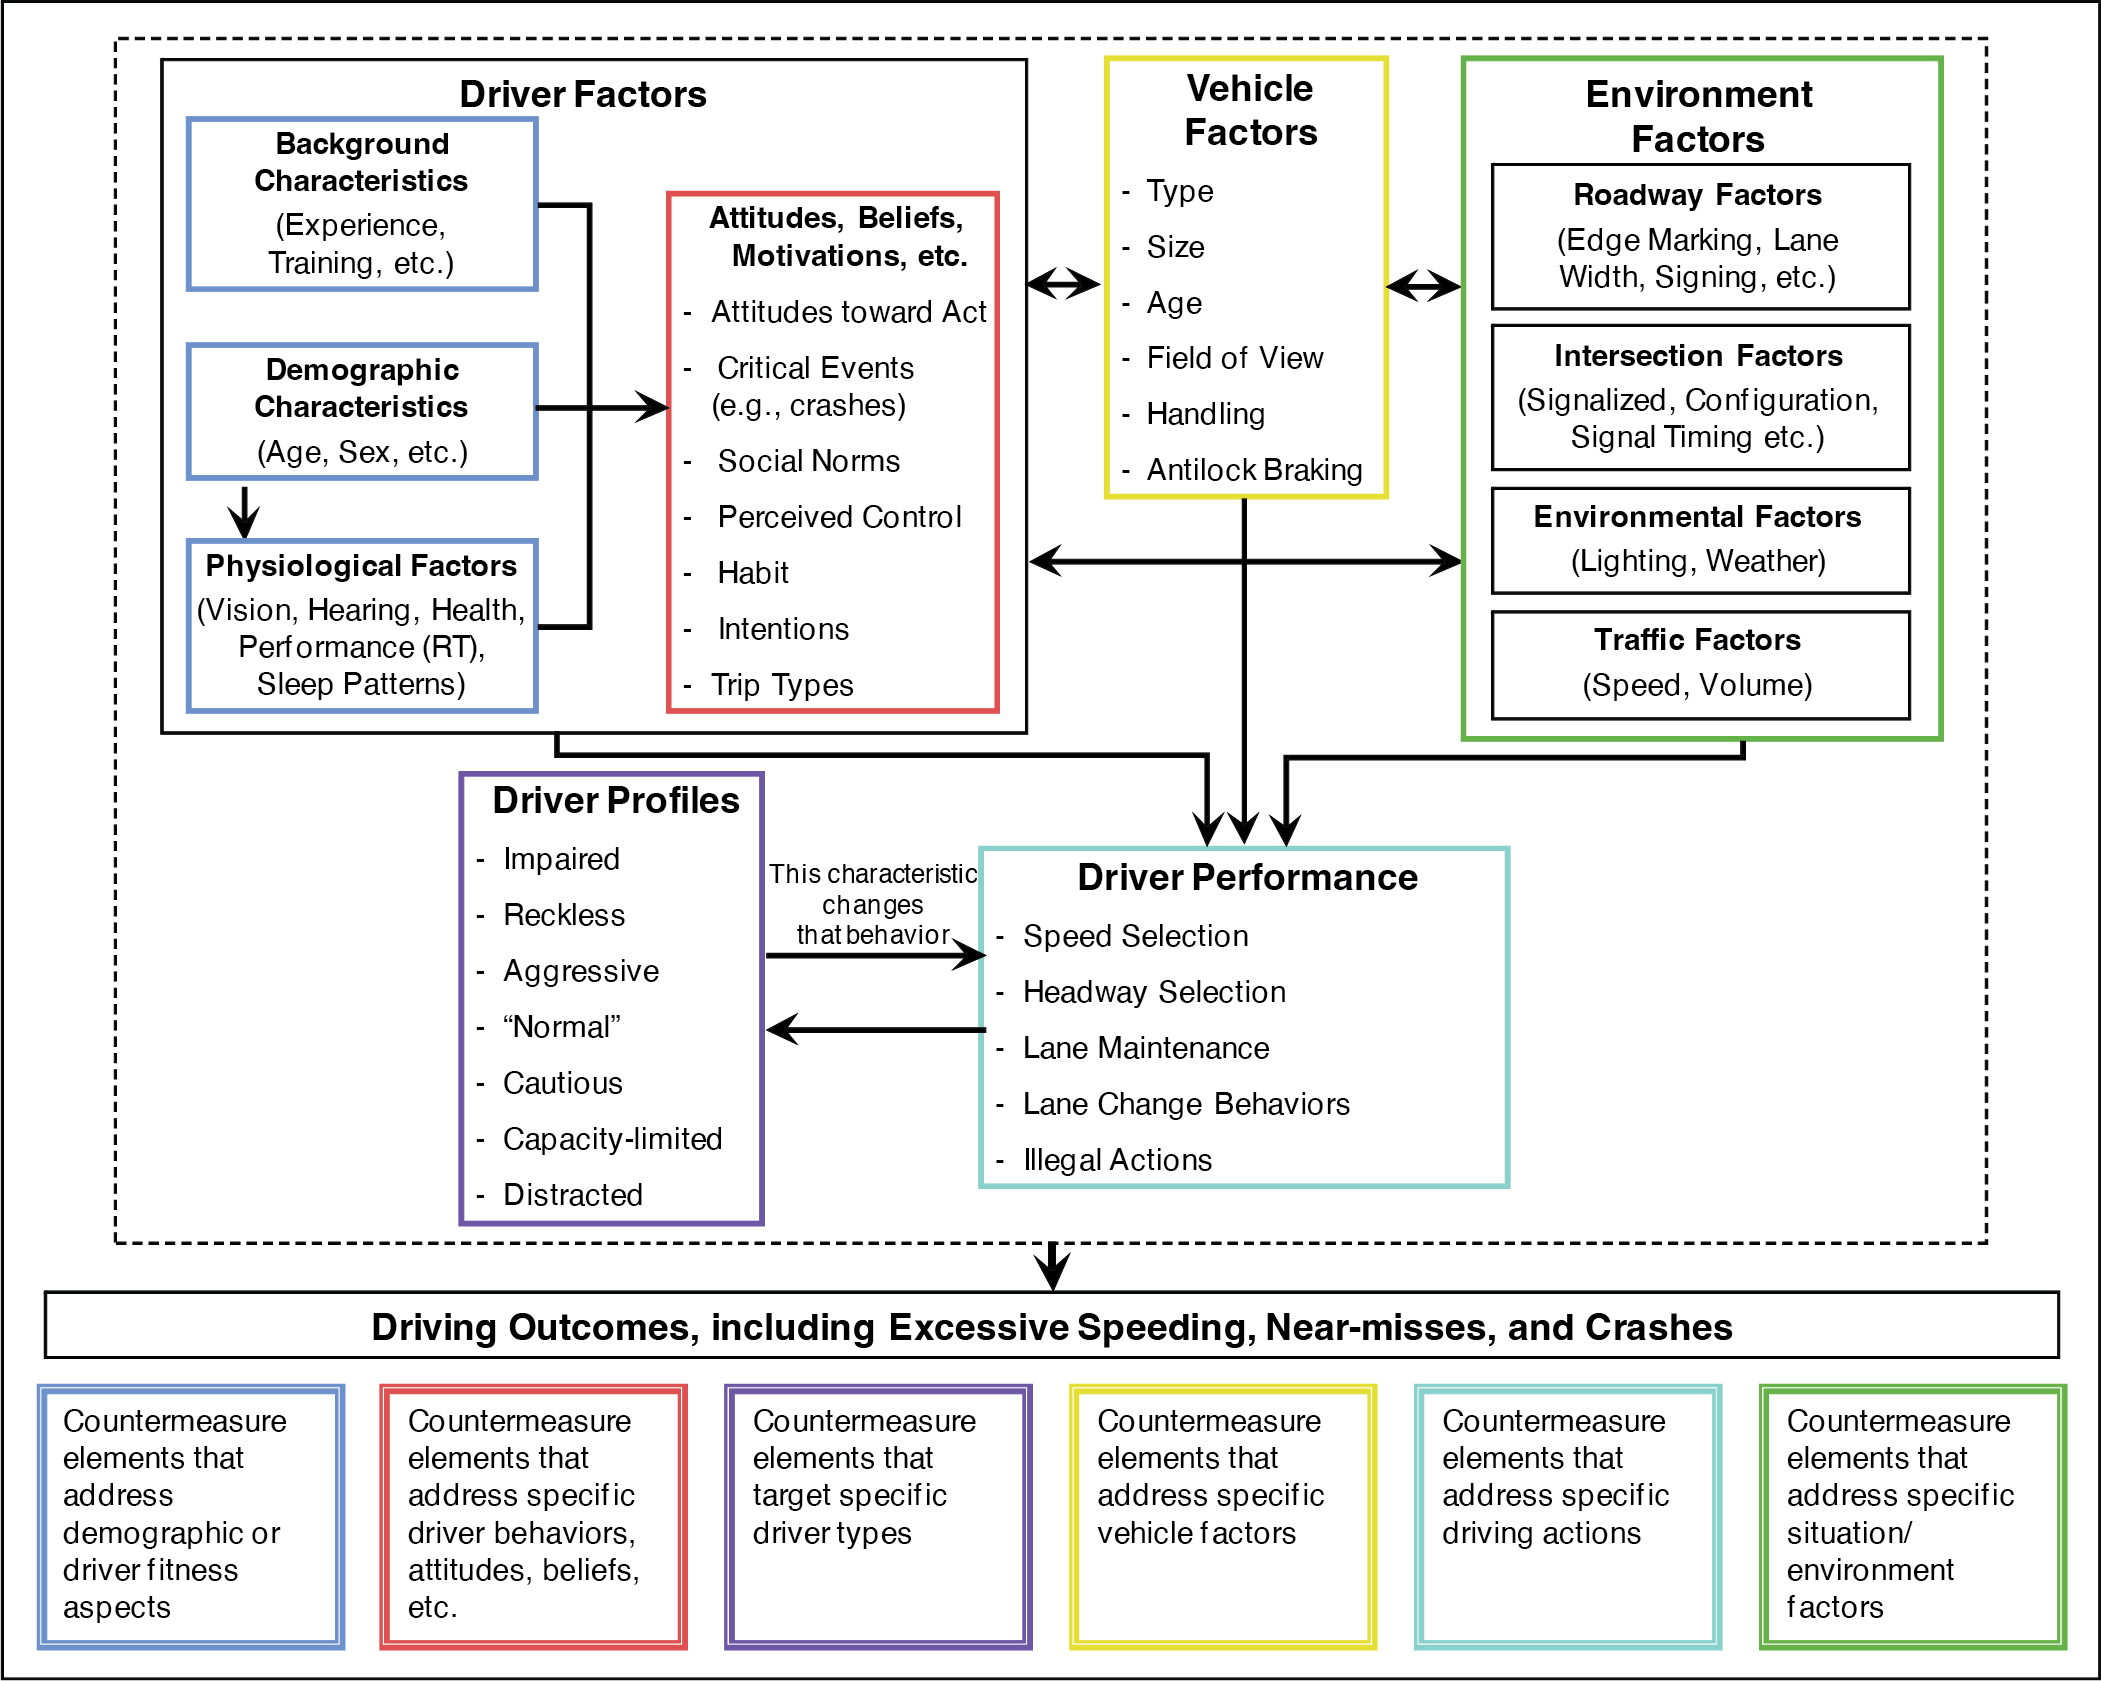
This guideline provides a conceptual overview of the key factors relevant to speed selection, as well as their relationship to potential speeding countermeasures. The figure below provides such a framework and attempts to capture the relevant driver, vehicle, roadway, and environment (DVRE) factors and to link these “predictor variables” to specific indices of driver behavior and driver performance. The factors and relationships depicted in the figure are firmly grounded in relevant studies and analyses of driver behavior. Specifically, it reflects past analyses and syntheses of the research literature on driver behavior and crash risk (1, 2), run-off-road safety work (3), safety countermeasures (4, 5), results from the 100-car study conducted by VTTI (6), results from the SHRP2 naturalistic driving study (7), as well as research that covers driving or crashes more generally (e.g., 8, 9, 10). Importantly, the framework includes a variety of countermeasure types, explicitly targeted at specific DVRE interactions.

Discussion
A substantial amount of research has been done on the causes of speeding, and it is clear that speeding is a complex driving decision. There is typically no single, simple solution for addressing speeding concerns. The table below shows the multitude of factors that have been found to be associated with speeding or speed-related crashes. Despite all this research, there is still uncertainty regarding the relative importance of these factors and how this information can be used to develop countermeasures that effectively target specific types of drivers. The figure shown as part of the guideline on the previous page depicts how several of these factors are related.
FACTORS FOUND TO BE ASSOCIATED WITH SPEEDING IN PREVIOUS RESEARCH
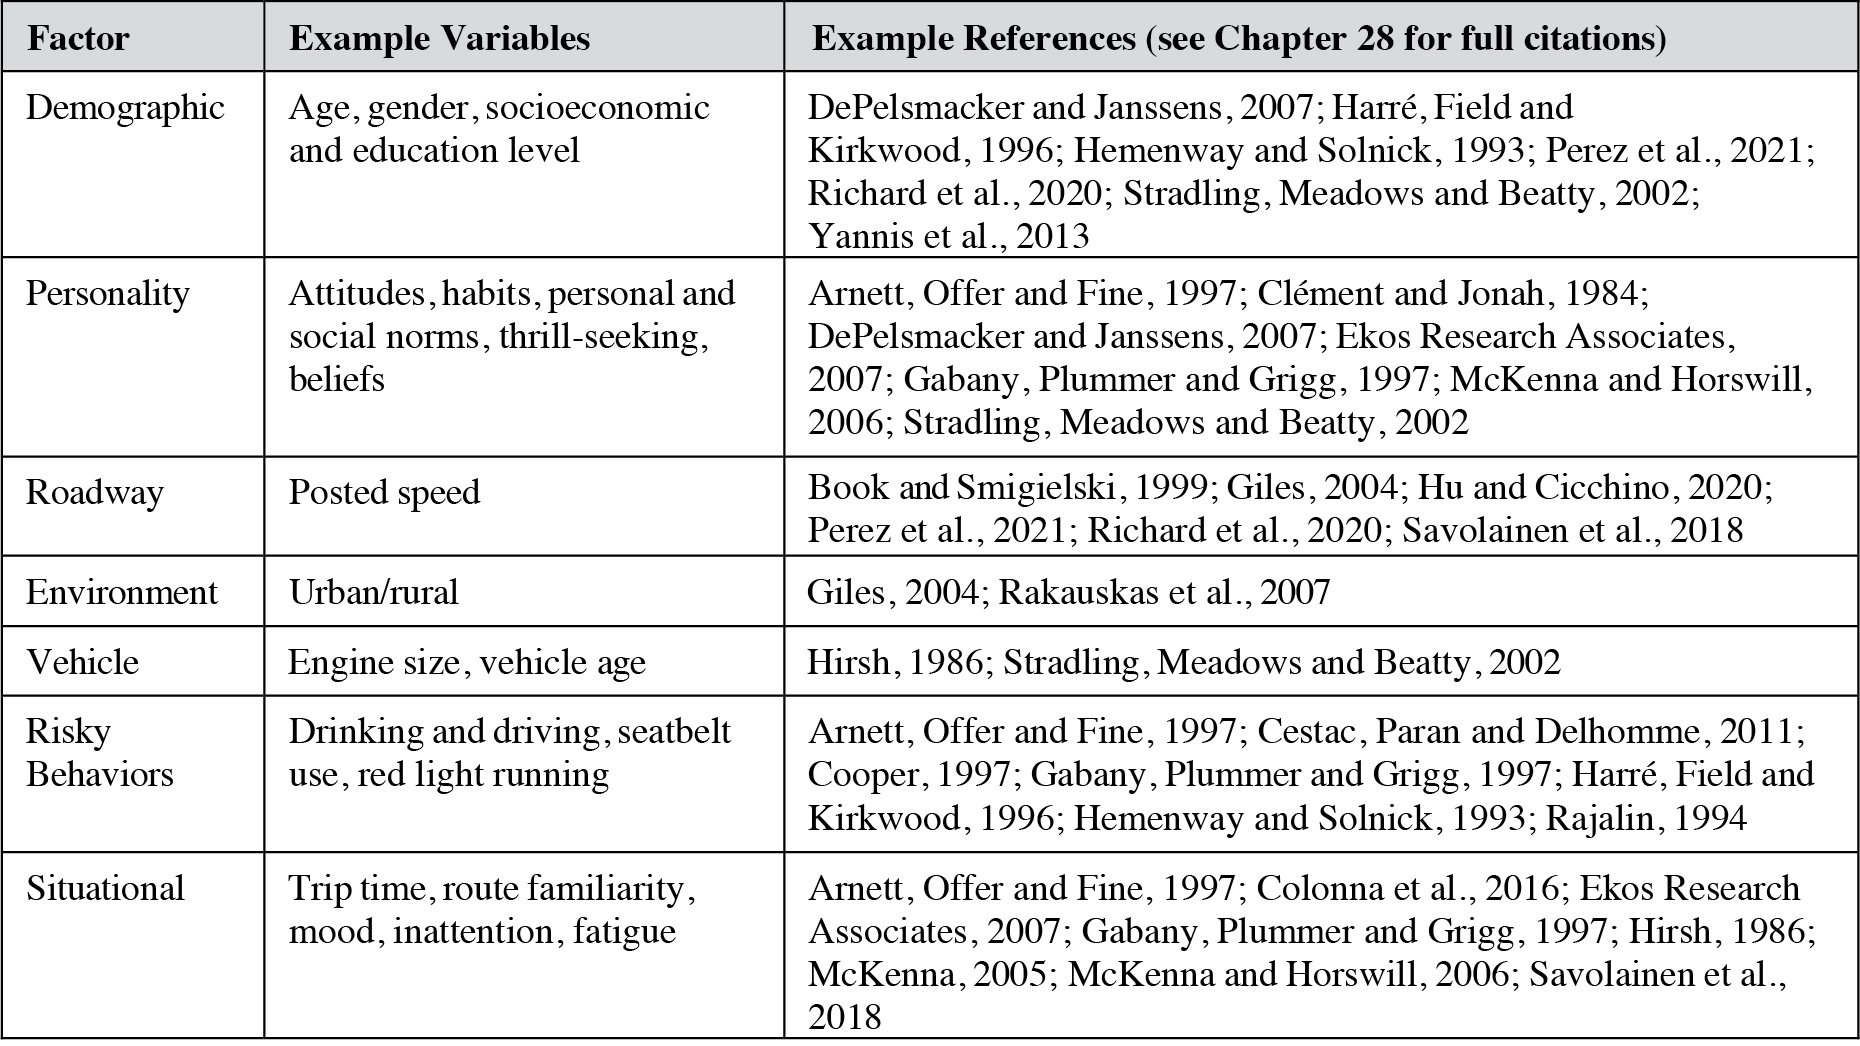
Long Description.
The table has 3 columns: Column 1 Factor. Column 2: Example Variables. Column 3: Example References (see Chapter 28 for full citations). Row 1, Column 1: Demographic Column 2: Age, gender, socioeconomic and education level Column 3: DePelsmacker and Janssens, 2007; Harré, Field and Kirkwood, 1996; Hemenway and Solnick, 1993; Perez et al., 2021; Richard et al., 2020; Stradling, Meadows and Beatty, 2002; Yannis et al., 2013 Row 2, Column 1: Personality Column 2: Attitudes, habits, personal and social norms, thrill-seeking, beliefs Column 3: Arnett, Offer and Fine, 1997; Clément and Jonah, 1984; DePelsmacker and Janssens, 2007; Ekos Research Associates, 2007; Gabany, Plummer and Grigg, 1997; McKenna and Horswill, 2006; Stradling, Meadows and Beatty, 2002 Row 3, Column 1: Roadway Column 2: Posted speed Column 3: Book and Smigielski, 1999; Giles, 2004; Hu and Cicchino, 2020; Perez et al., 2021; Richard et al., 2020; Savolainen et al., 2018 Row 4, Column 1: Environment Column 2: Urban/rural Column 3: Giles, 2004; Rakauskas et al., 2007 Row 5, Column 1: Vehicle Column 2: Engine size, vehicle age Column 3: Hirsh, 1986; Stradling, Meadows and Beatty, 2002 Row 6, Column 1: Risky Behaviors Column 2: Drinking and driving, seatbelt use, red light running Column 3: Arnett, Offer and Fine, 1997; Cestac, Paran and Delhomme, 2011; Cooper, 1997; Gabany, Plummer and Grigg, 1997; Harré, Field and Kirkwood, 1996; Hemenway and Solnick, 1993; Rajalin, 1994 Row , Column 1: Situational Column 2: Trip time, route familiarity, mood, inattention, fatigue Column 3: Arnett, Offer and Fine, 1997; Colonna et al., 2016; Ekos Research Associates, 2007; Gabany, Plummer and Grigg, 1997; Hirsh, 1986; McKenna, 2005; McKenna and Horswill, 2006; Savolainen et al., 2018
Design Considerations
None.
Cross References
Speeding Countermeasures: Setting Appropriate Speed Limits
Speeding Countermeasures: Communicating Appropriate Speed Limits
Key References
1. Campbell, J. L., Richard, C. M., Brown, J. L., Nakata, A., and Kludt, K. (2003). Technical Synthesis of IVI Human Factors Research: Compendium of IVI Human Factors Research. Seattle, WA: Battelle Human Factors Transportation Center.
2. Kludt, K., Brown, J. L., Richman, J., and Campbell, J. L. (2006). Human Factors Literature Reviews on Intersections, Speed Management, Pedestrians and Bicyclists, and Visibility (FHWA-HRT-06-034). Washington, DC: FHWA.
3. Leblanc, D., Sayer, J., Winkler, C., Ervin, R., Bogard, S., Devonshire, J., Mefford, M. L., Hagan, M., Barekt, Z., Goodsell, R., and Gordon, T. J. (2006). Road Departure Crash Warning Field Operational Test. Washington, DC: NHTSA.
4. Various. (2005). NCHRP Report 500: Guidance for Implementation of the AASHTO Strategic Highway Safety Plan, Volumes 1–17. Washington, DC: Transportation Research Board of the National Academies.
5. NHTSA. (2007). Countermeasures That Work: A Highway Safety Countermeasure Guide for State Highway Safety Offices. Washington, DC.
6. Klauer, S. G., Dingus, T. A., Neale, V. L., Sudweeks, J. D., and Ramsey, D. J. (2006). The Impact of Driver Inattention on Near-Crash/Crash Risk: An Analysis Using the 100-Car Naturalistic Driving Study Data. (DOT HS 810 594). Washington, DC: NHTSA.
7. Victor, T., Dozza, M., Bärgman, J., Boda, C. N., Engström, J., Flannagan, C., Lee, J. D., and Markkula, G. (2015). SHRP 2 Report S2-S08A-RW-1: Analysis of Naturalistic Driving Study Data: Safer Glances, Driver Inattention, and Crash Risk. Transportation Research Board, Washington, DC.
8. Hendricks, D. L., Fell, J. C., and Freedman, M. (1999). The Relative Frequency of Unsafe Driving Acts in Serious Traffic Crashes, Summary Technical Report. Washington, DC: NHTSA.
9. Groeger, J. A. (2000). Understanding Driving: Applying Cognitive Psychology to a Complex Everyday Task. Hove, U.K.: Psychology Press.
10. Treat, J. R., Tumbas, N. S., McDonald, S. T., Shinar, R. D., Mayer, R. E., Stansifer, R. L., Castellan, N. J. (1979). Tri-Level Study of the Causes of Traffic Accidents. (Executive Summary). (DOT HS 805 099). Washington, DC: NHTSA.
SPEED PERCEPTION AND DRIVING SPEED
Introduction
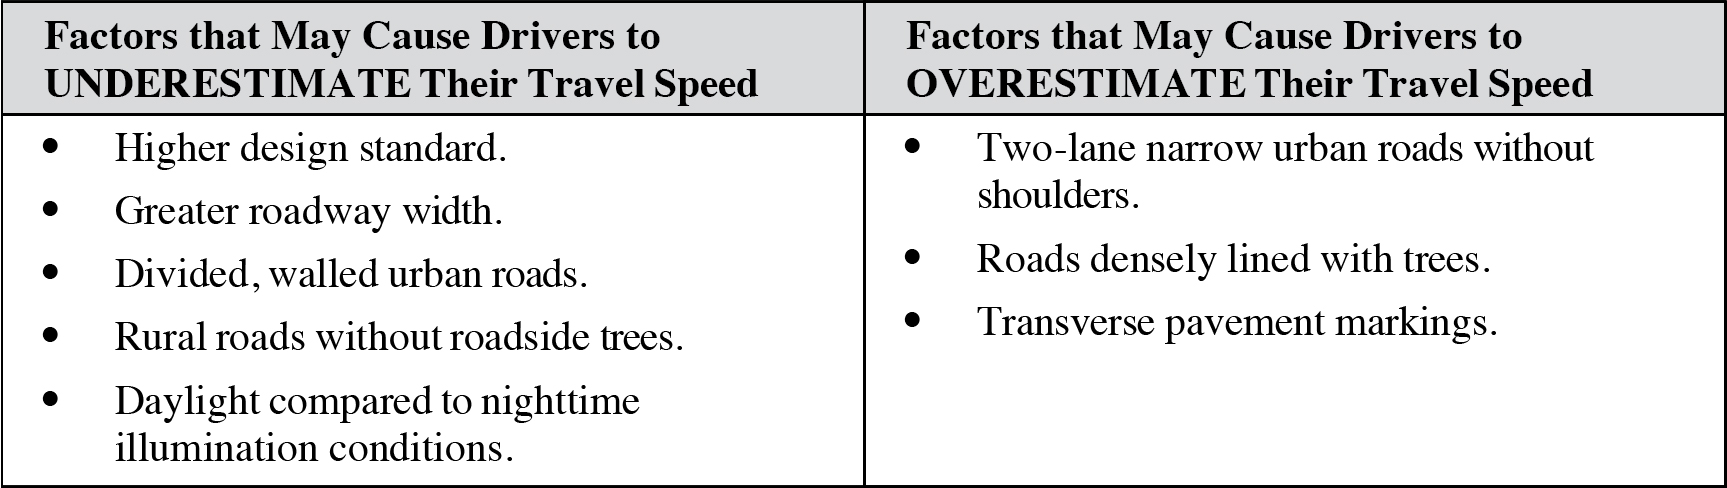
Speed perception refers to driversʼ judgment of how fast they are traveling. While direct speed information is available from the speedometer, drivers still rely heavily on cues from the environment to judge how fast they are traveling. Auditory (engine noise) and tactile (vibrations) information can influence speed perception; however, driversʼ primary basis for estimating their speed is the visual sensation provided by the highway geometrics and other information about objects in their immediate environment streaming through their visual field. If drivers underestimate their travel speed, they are traveling faster than they expect, and if they overestimate their travel speed, they are traveling slower than they expect.

Discussion
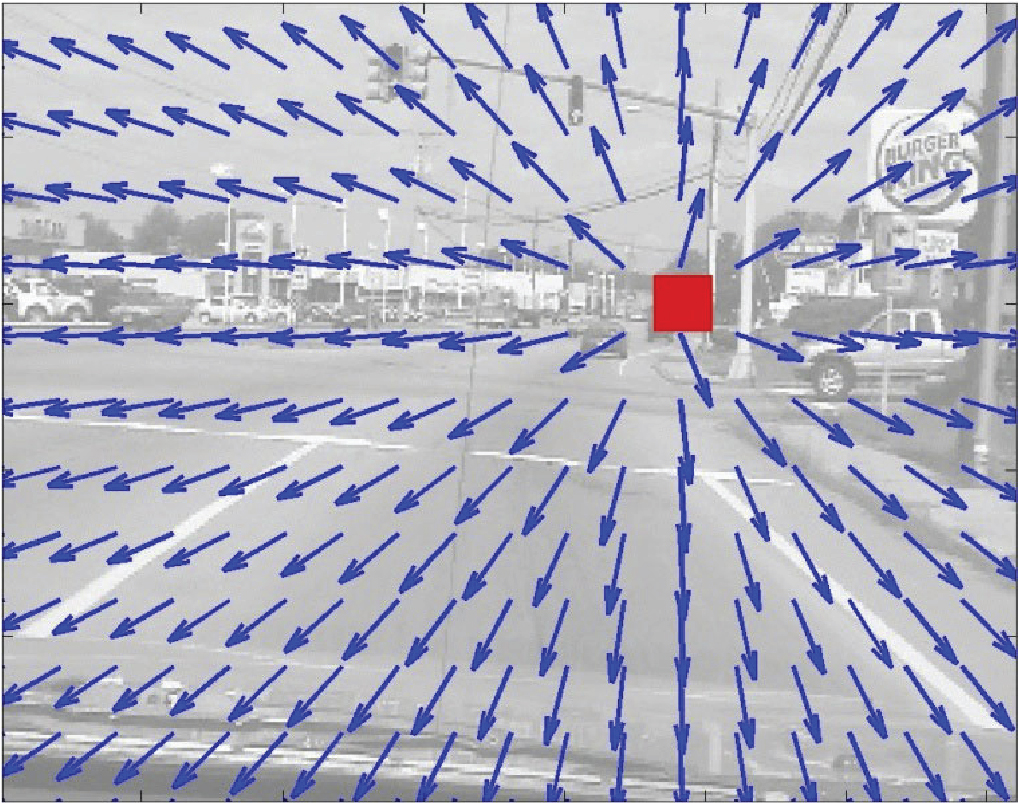
The figure on the previous page illustrates two important sources of information that underlie driversʼ speed perception. The first is the point of expansion, which is denoted by the red square, and the second is the optic flow, which is shown as the blue arrows. During forward motion, the point of expansion indicates the observerʼs destination and appears stationary relative to the observer. All other points are seen as moving away from the point of expansion, and the relative motion (i.e., both the direction and speed of other elements in the driverʼs field of view) of the optic flow points forms the basis for speed perception. Points that are closer to the observer appear to move faster than points closer to the point of expansion. Stronger and more consistent optic-flow cues (e.g., dense/cluttered visual environments, salient pavement marking, etc.) can amplify the sensation of speed through the environment and cause higher speed judgments.
In Fildes, Fletcher, and Corrigan (2), subjects viewed a film presentation of moving scenes in a laboratory setting to assess sensory perception of speed on the road and to evaluate the effects of several road and roadside features on the speed judgments of drivers. Among other findings, the researchers reported that drivers underestimated their travel speeds on roads with higher design standards, on roads with a greater width, on divided and wide urban roads, and on rural roads without roadside trees (compared to those with many trees). They tended to overestimate their speeds on two-lane narrow urban roads.
In Triggs and Berenyi (3), subjects estimated speed under day and night conditions as passengers driving in a car on an unlit freeway. Speed was underestimated in both day and night conditions; however, judgments were more accurate at night than during the day. Importantly, centerline pavement-mounted reflectors provided a highly visible feature that was unavailable during the day.
Zhao et al. (5) investigated the effect of tunnel sidewall mural designs on driversʼ speed control and speed perception in a driving simulator. They found that higher frequency spacing (i.e., close spacing) of the tunnel resulted in driversʼ overestimation of the vehicle speed and deceleration, suggesting that high frequency visual information flow reduces speed.
In a broad review of speed estimation studies, Triggs (4) found the following trends:
- Speed perception increases when transverse stripes are painted across the road with their separation progressively decreasing (though they may be effective only for drivers who are unfamiliar with the site).
- Speed judgments tend to be higher when a rural road is lined with trees. Speed judgments tend to be higher in low-light conditions.
- During car following, judgments of relative speed tend to be made more accurately when the gap between the two vehicles is closing rather than when it is opening.
- When car following, observers in the following car tend to underestimate the relative speed difference between their car and the one in front of it.
Design Considerations
Speed adaptation, which occurs for drivers who continue at a constant speed for an extended period of time, leads to drivers generally underestimating their speed in latter sections of extended tangent sections (5). This adaptation effect has implications for design elements requiring speed changes, such as horizontal curves, because drivers may be traveling faster than expected. Additionally, this effect may also carry over to nearby roadways (6).
Cross References
Behavioral Framework for Speeding
Effects of Roadway Factors on Speed
Effects of Posted Speed Limits on Speed Decisions
Key References
1. CNS Vision Lab (n.d.) Heading Perception: Where Am I Going? Retrieved November 24, 2009, from http://cns.bu.edu/visionlab/projects/buk/.
2. Fildes, B. N., Fletcher, M. R., and Corrigan, J. M. (1987). Speed Perception 1: Driversʼ Judgements of Safety and Speed on Urban and Rural Straight Roads. (CR 54). Canberra, Australia: Federal Office of Road Safety.
3. Triggs, T. J., and Berenyi, J. S. (1982). Estimation of automobile speed under day and night conditions. Human Factors, 24(1), 111–114.
4. Triggs, T. J. (1986). Speed estimation. Automotive Engineering and Litigation, 95–124.
5. Zhao, X., Dong, W., Li, J., Liu, Q. and Ju, Y. (2022). How does the mural decoration of the long tunnel sidewall affect the driverʼs speed control ability? Tunnelling and Underground Space Technology, 130, 104731.
6. Casey, S. M., and Lund, A. K. (1987). Three field studies of driver speed adaptation. Human Factors, 29(5), 541–550.
EFFECTS OF ROADWAY FACTORS ON SPEED
Introduction
The effects of roadway factors on speed refers to the impact of geometric, environmental, and traffic factors on driving speed under free-flow conditions in tangent roadway sections. Speed in curve entry is covered in Chapter 6. Free-flowing speed is defined as conditions in which a driver has the ability to choose a speed of travel without undue influence from other traffic, conspicuous police presence, or environmental factors. In other words, drivers of free-flowing vehicles choose a speed that they find comfortable based on the appearance of the road. Typically, this involves a minimum headway time of 4 to 6 s (1). Note that although posted speed is often found to be one of the factors that is most strongly correlated with free-flow speed, this correlation is somewhat misleading, because driver compliance with posted speed can be low if the posted speed is set too low (see “Effects of Posted Speed Limits on Speed Decisions,” on page 14-8). In contrast, the strong association between posted speed and free-flow speed typically occurs because the 85th percentile speed is often used to set the posted speed limit.
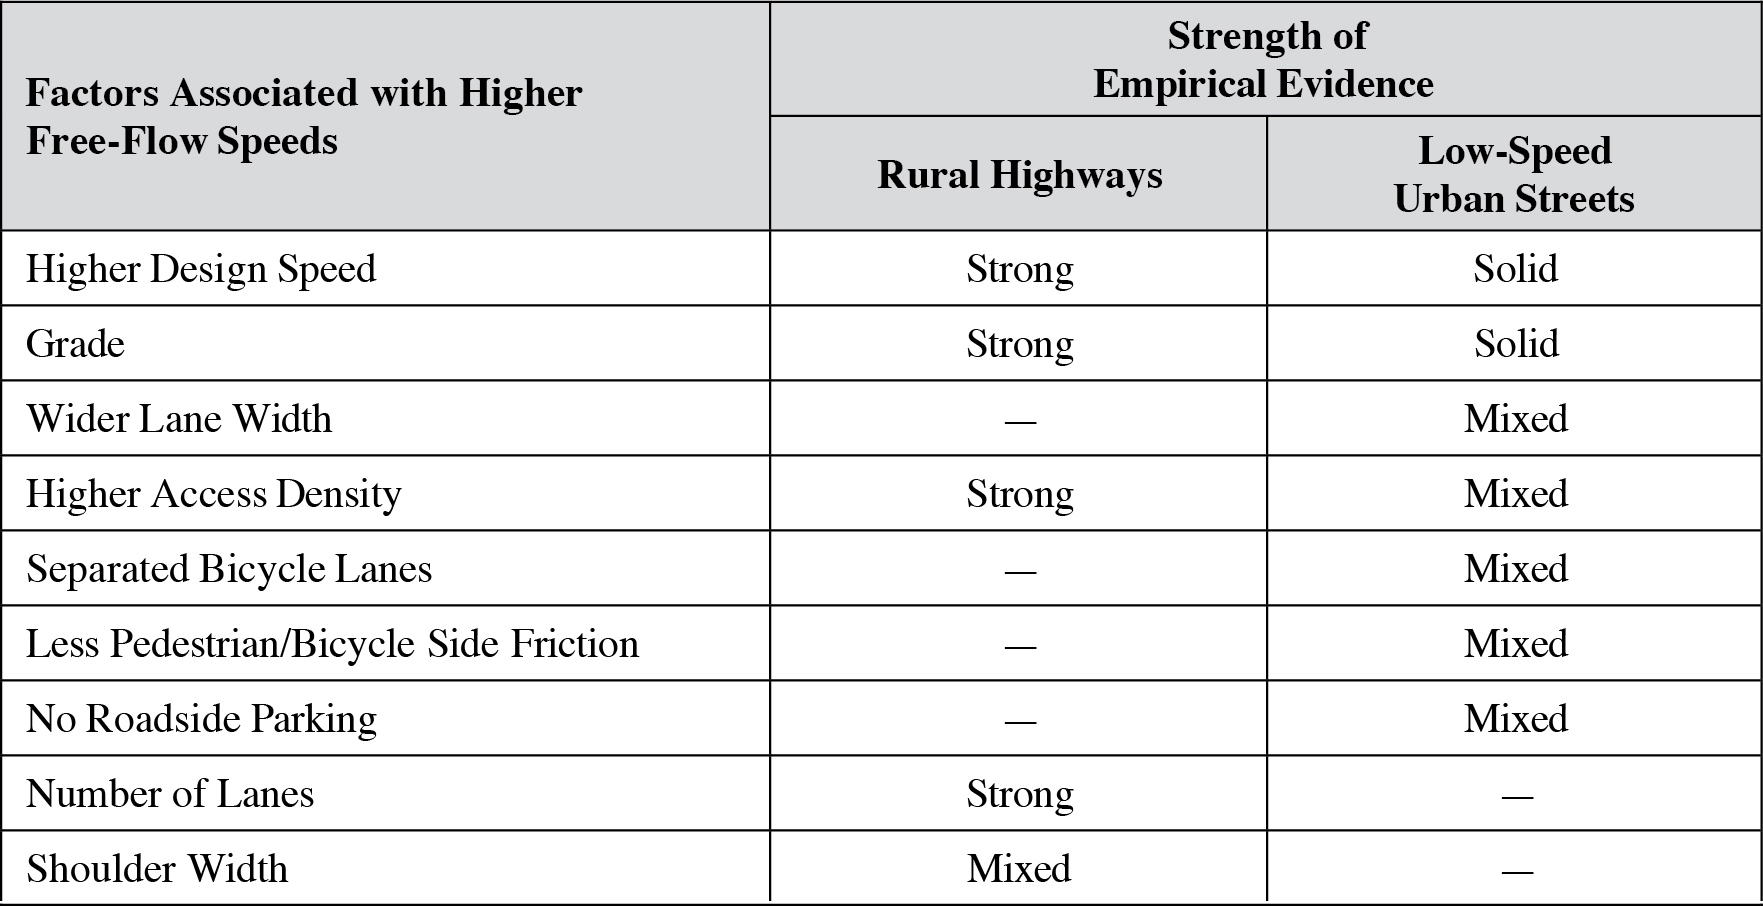

Discussion
As the table on the previous page makes clear, the empirical record is far from conclusive with respect to the ability to predict driversʼ speed choices associated with relevant geometric, environmental, and traffic factors. Nonetheless, some relationships between driversʼ speed choices and these factors, however tentative, have emerged from the literature and are worth presenting here. Currently, there is insufficient research to provide more quantitative guidance about how much the factors listed in the guideline table increase free-flow speed.
As seen in the figure below, roadway factors influence both the driverʼs choice of speed and overall crash probability and severity. In Fitzpatrick et al. (3), data were collected at 24 horizontal curve sites and 36 straight section sites to identify roadway factors that influence speed. Data collected included details of alignment (e.g., curve radius, curve length, straight section length), cross-section (e.g., lane width, superelevation, median characteristics), roadside details (e.g., access, density, pedestrian activity), and information on traffic control devices. Speed guns were used to collect speed from vehicles at the 60 (total) sites. Multiple regression techniques, using 85th percentile speed as a “quantifiable definition of operating speed,” were used in the analysis. The alignment (downstream distance to control) and cross-section (lane width) factors explained about 25% of the variability in the speed data for both curve and straight road sections. Roadside factors were not significant for the straight road sections but accounted for about 40% of the variability in the speed data for curves. Additional analyses conducted without using posted speed limits resulted in only lane width as a significant variable for straight road sections, with both median presence and roadside development as significant variables for curves.
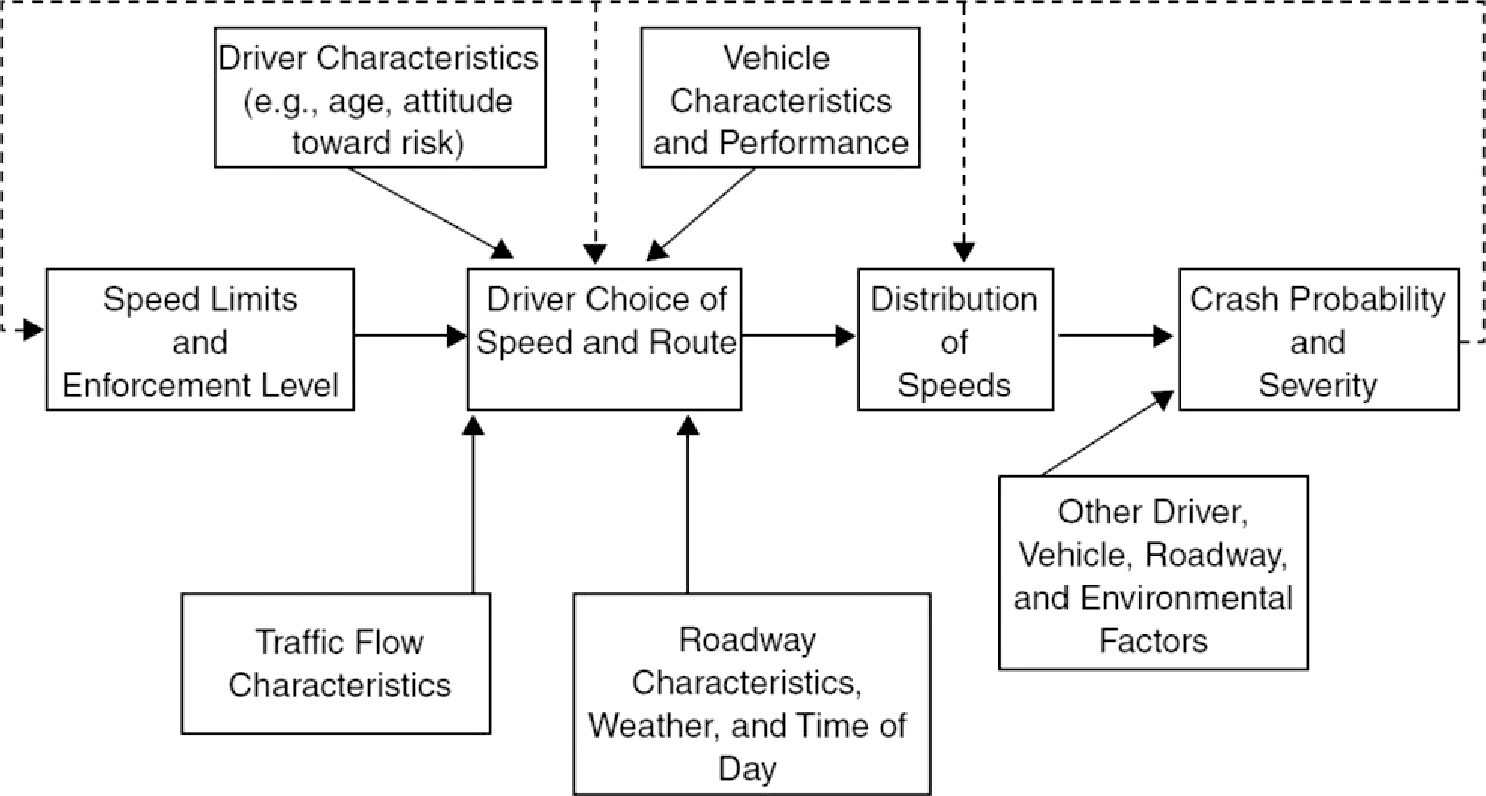
Source: Milliken et al. (2).
Long Description.
The factors include driver characteristics, vehicle characteristics and performance, speed limits and enforcement level, driver choice of speed and route, distribution of speeds, crash probability and severity, traffic flow characteristics, roadway characteristics, and other driver, vehicle, roadway and environment factors.
Design Considerations
None.
Cross References
Behavioral Framework for Speeding
Design Consistency in Rural Driving
Key References
1. Parker, M. R., Jr. (1997). Effects of Raising and Lowering Speed Limits on Selected Roadway Sections. (FHWA-RD-92-084). McLean, VA: FHWA.
2. Milliken, J. G., Council, F. M., Gainer, T. W., Garber, N. J., Gebbie, K. M., Hall, J. W., Lave, C. A., Mason, J. M., Mosteller, F., Nichols, S. D., Oster, C. V., Retting, R. A., Sheridan, T. B., Taylor, W. C., Tsebelis, G., Viano, D. C., and Weaver, R. P. (1998). Special Report 254: Managing Speed: Review of Current Practice for Setting and Enforcing Speed Limits. TRB, National Research Council, Washington, DC.
3. Fitzpatrick, K., Carlson, P., Brewer, M., and Wooldridge, M. (2001). Design factors that affect driver speed on suburban streets. Transportation Research Record: Journal of the Transportation Research Board, 1751, 18–25.
EFFECTS OF POSTED SPEED LIMITS ON SPEED DECISIONS
Introduction
The effects of posted speed limits on speed decisions refers to the impact that posted speed has on actual speeds selected by drivers. This guideline covers light-vehicle driver compliance with posted speed limits on non-limited-access rural and urban highways. Drivers are legally in compliance when they are traveling at or below the posted speed limit. At a practical level, however, drivers are typically given—and they expect to be given—some small margin above the posted speed limit before being subject to law enforcement (1). Driver compliance is best assessed under free-flow conditions for a roadway segment because driver speed behavior is then largely unconstrained by external influences (e.g., traffic congestion, road work, or extreme weather) and they are free to choose their “natural” speed based on the roadway.

Discussion
It is quite clear from both everyday observation and existing research data that most drivers do not comply with posted speed limits. In Harkey et al. (3), data were collected and analyzed from 50 locations in four states to determine travel speed characteristics. The authors reported that 70.2% of drivers did not comply with posted speed limits, specifically (1) 40.8% exceeded posted speed limits by more than 5 mi/h; (2) 16.8% exceeded posted speed limits by more than 10 mi/h; and (3) 5.4% exceeded posted speed limits by more than 15 mi/h.
Milliken et al. (2) conducted a broad review of current practices in setting speed limits and provided guidelines to state and local governments on appropriate methods of setting speed limits and related enforcement strategies. With respect to driver perceptions of speeding and speed limits, the review found that (1) most drivers do not perceive speeding as a particularly risky activity; (2) most drivers will drive at what they consider an appropriate speed regardless of the speed limit; and (3) advisory speeds have modest to little effect on driver speed, particularly for drivers who are familiar with the road. Taken together, these attitudes result in generally low compliance with posted speed.
Also, from Milliken et al. (2), changing speed limits does not always result in the intended changes in behavior. Lowering the speed limits on major highways reduced both travel and speed fatalities, although driver speed compliance gradually eroded. Drivers violate new, higher speed limits because they expect the same enforcement tolerance of 5 to 10 mi/h at the higher limits. Specifically, average and 85th percentile speed typically increased 1 to 3 mi/h despite larger increases in the speed limit, a minimum of 5 mi/h. Parker (4) also found that increasing or reducing the posted speed on urban and rural non-limited-access roadways did not significantly change the number of injury or fatal crashes.
Overall, changes in speed limits seem to simply legalize existing driver behavior; that is, they change compliance levels rather than speeding behavior. The findings suggest the difficulty of altering behavior merely by changing a speed sign.
As noted elsewhere, speed choices are clearly mediated by a number of factors. Milliken et al. (2) found evidence that speed enforcement is the most common mediator between speed limit and speed choice. Where speed choice is not constrained by speed limits and their enforcement, the driver does trade off travel time and safety. In an analysis of FHWA data, Uri (5) found that adherence to the 55-mph limit does depend on the time cost of travel, cost in terms of discomfort and irritability, enforcement and, for a subset of states, the price of gasoline.
Perez et al. (6) analyzed data from the SHRP2 naturalistic driving study and found the likelihood of speeding was greater in low-speed limit areas (10–20 mi/h zones) than areas with higher speed limits (e.g., above 60 mi/h), suggesting drivers are unaware of the higher safety risks of speeding in a low-speed limit region.
Design Considerations
One design issue to consider when changes to the posted speed limit are contemplated is the possibility of speed changes carrying over to connecting roadways. The basic idea is that drivers adapt to higher speeds on the primary road and may be biased toward driving at those higher speeds once they switch to a connecting roadway. The evidence for carryover effects is limited, especially because many studies find such a small relationship between posted speed limit change and free-flow speed on the principal roads (4, 2).
Another issue worth examining in detail is the effects of speed limit changes on speed dispersion. Speed limit changes increase speed dispersion on interstate freeways, and variation in driversʼ speed appears related to crash risk (2).
Cross References
Speeding Countermeasures: Setting Appropriate Speed Limits
Speeding Countermeasures: Communicating Appropriate Speed Limits
Key References
1. Giles, M. J. (2004). Driver speed compliance in Western Australia: A multivariate analysis. Transport Policy, 11(3), 227–235.
2. Milliken, J. G., Council, F. M., Gainer, T. W., Garber, N. J., Gebbie, K. M., Hall, J. W., et al. (1998). Special Report 254: Managing Speed: Review of Current Practice for Setting and Enforcing Speed Limits. TRB, National Research Council, Washington, DC.
3. Harkey, D. L., Robertson, H. D., and Davis, S. E. (1990). Assessment of current speed zoning criteria. Transportation Research Record: Journal of Transportation Research Board, 1281, 40–51.
4. Parker, M. R., Jr. (1997). Effects of Raising and Lowering Speed Limits on Selected Roadway Sections. (FHWA-RD-92-084). McLean, VA: FHWA.
5. Uri, N. D. (1990). Factors affecting adherence to the 55 mi/h speed limit. Transportation Quarterly, 44(4), 533–547.
6. Perez, M., Sears, E., Valente, J., Huang, W., and Sudweeks, J. (2021). Factors modifying the likelihood of speeding behaviors based on naturalistic driving data. Accident Analysis and Prevention, 159, 106267.
SPEED MANAGEMENT
Introduction
A speed management program is a comprehensive strategy that addresses all factors that influence speeding behavior, including speed limits, roadway designs, traffic control, enforcement, and public awareness. The USDOT and FHWA have emphasized the importance of speed management, and specifically the Safe System Approach for Speed Management (1), as part of the USDOTʼs first National Roadway Safety Strategy published in 2022. The FHWAʼs Speed Management Safety webpage (2) has additional resources for selecting and implementing different speed management countermeasures. FHWA and the Institute of Transportation Engineers (ITE) developed a Traffic Calming ePrimer that contains a module entitled “Toolbox of Individual Traffic Calming Measures” (3).

Discussion
The FHWA has assembled a large set of speed management resources on its Speed Management Safety webpage (2) to facilitate the development and implementation of speed management programs. These resources include a tool for speed limit determination [USLIMITS2 (4)], speeding facts and statistics, engineering speed limits, a traffic calming ePrimer, and links to many additional resources (5) such as best practices, additional ePrimers, outreach materials, and guidance documents. Notable resources include:
- Safe System Approach for Speed Management
- Speed Safety Camera Program Planning and Operations Guide
- Speed Management Practices
- Self-Enforcing Roadways: A Guidance Report
- Speed Management ePrimer for Rural Transition Zones and Town Centers
- Speed Management Outreach Materials
- Jurisdiction Speed Management Action Plan Development Package
- Speed Management: A Manual for Local Rural Road Owners
- Speed Management Workshops
In addition, the FHWA and the ITE published a report (6) that describes eight case studies that highlight noteworthy practices over a range of speed management issues. These case studies include:
- Strategic Speed Management Program in Austin, TX
- Self-Enforcing Roadways in Golden, CO
- Setting Credible Speed Limits by the New Hampshire DOT
- High Visibility Enforcement in Oro Valley, AZ
- Successful Strategies for Adoption of Safety Cameras in New York, NY
- Targeted Reporting of Speeding-Related Crashes by the Arizona DOT
- Consistent Speed Limits for Vulnerable Road Users by various agencies
- Network Approach to Setting Speed Limits by the New Zealand Transport Agency
Design Considerations
This guideline is provided as an overview for Speed Management and available resources for the development and implementation of such programs, and is based on materials and resources produced and assembled by the FHWA (2). The guidance documents, toolkits, etc., available on the FHWAʼs Speed Management site should be consulted for detailed design guidance on the various speed management countermeasures, including speed limits, roadway designs, enforcement, and public awareness.
Cross References
Behavioral Framework for Speeding
Effects of Roadway Factors on Speed
Effects of Posted Speed Limits on Speed Decisions
Speeding Countermeasures: Setting Appropriate Speed Limits
Speeding Countermeasures: Communicating Appropriate Speed Limits
Key References
1. Kumfer, W., Martin, L., Turner, S., and Broshears, L. (2023). Safe System Approach for Speed Management (No. FHWA-SA-23-002). Washington, DC: FHWA.
2. FHWA. (n.d.). Speed Management Safety. https://highways.dot.gov/safety/speed-management.
3. FHWA. (n.d.). Speed Management Safety: Traffic Calming ePrimer. https://highways.dot.gov/safety/speed-management/traffic-calming-eprimer.
4. FHWA. (n.d.). Speed Management Safety: USLIMITS2. https://highways.dot.gov/safety/speed-management/uslimits2.
5. FHWA. (n.d.). Speed Management Safety: Reference Materials. https://highways.dot.gov/safety/speed-management/reference-materials.
6. Hawkins, N., and Hallmark, S. (2020). Noteworthy Speed Management Practices (FHWA-SA-20-047). Washington, DC: FHWA.
SPEEDING COUNTERMEASURES: SETTING APPROPRIATE SPEED LIMITS
Introduction
Setting appropriate speed limits refers to guidelines and best practices for determining appropriate speed limits that consider the unique traffic, design, and environmental aspects of the roadway. Much of the information in this guideline, as well as its companion guidelines (“Speeding Countermeasures: Communicating Appropriate Speed Limits” on page 14-14 and “Speeding Countermeasures: Using Roadway Design and Traffic Control Elements to Address Speeding Problems,” on page 14-16), are adapted from Neuman et al. (1). As part of NCHRP Report 500: Guidance for Implementation of the AASHTO Strategic Highway Safety Plan, the study by Neuman et al. (1) was developed to address two key problems involved in excessive or inappropriate speeds: (1) driver behavior (i.e., deliberately driving at an inappropriate or unsafe speed) and (2) driver response to the roadway environment (i.e., inadvertently driving at an inappropriate or unsafe speed, failure to change speed in a proper or timely manner, or failure to perceive the speed environment). Both these problems result in an increased risk of a crash or conflict.

Discussion
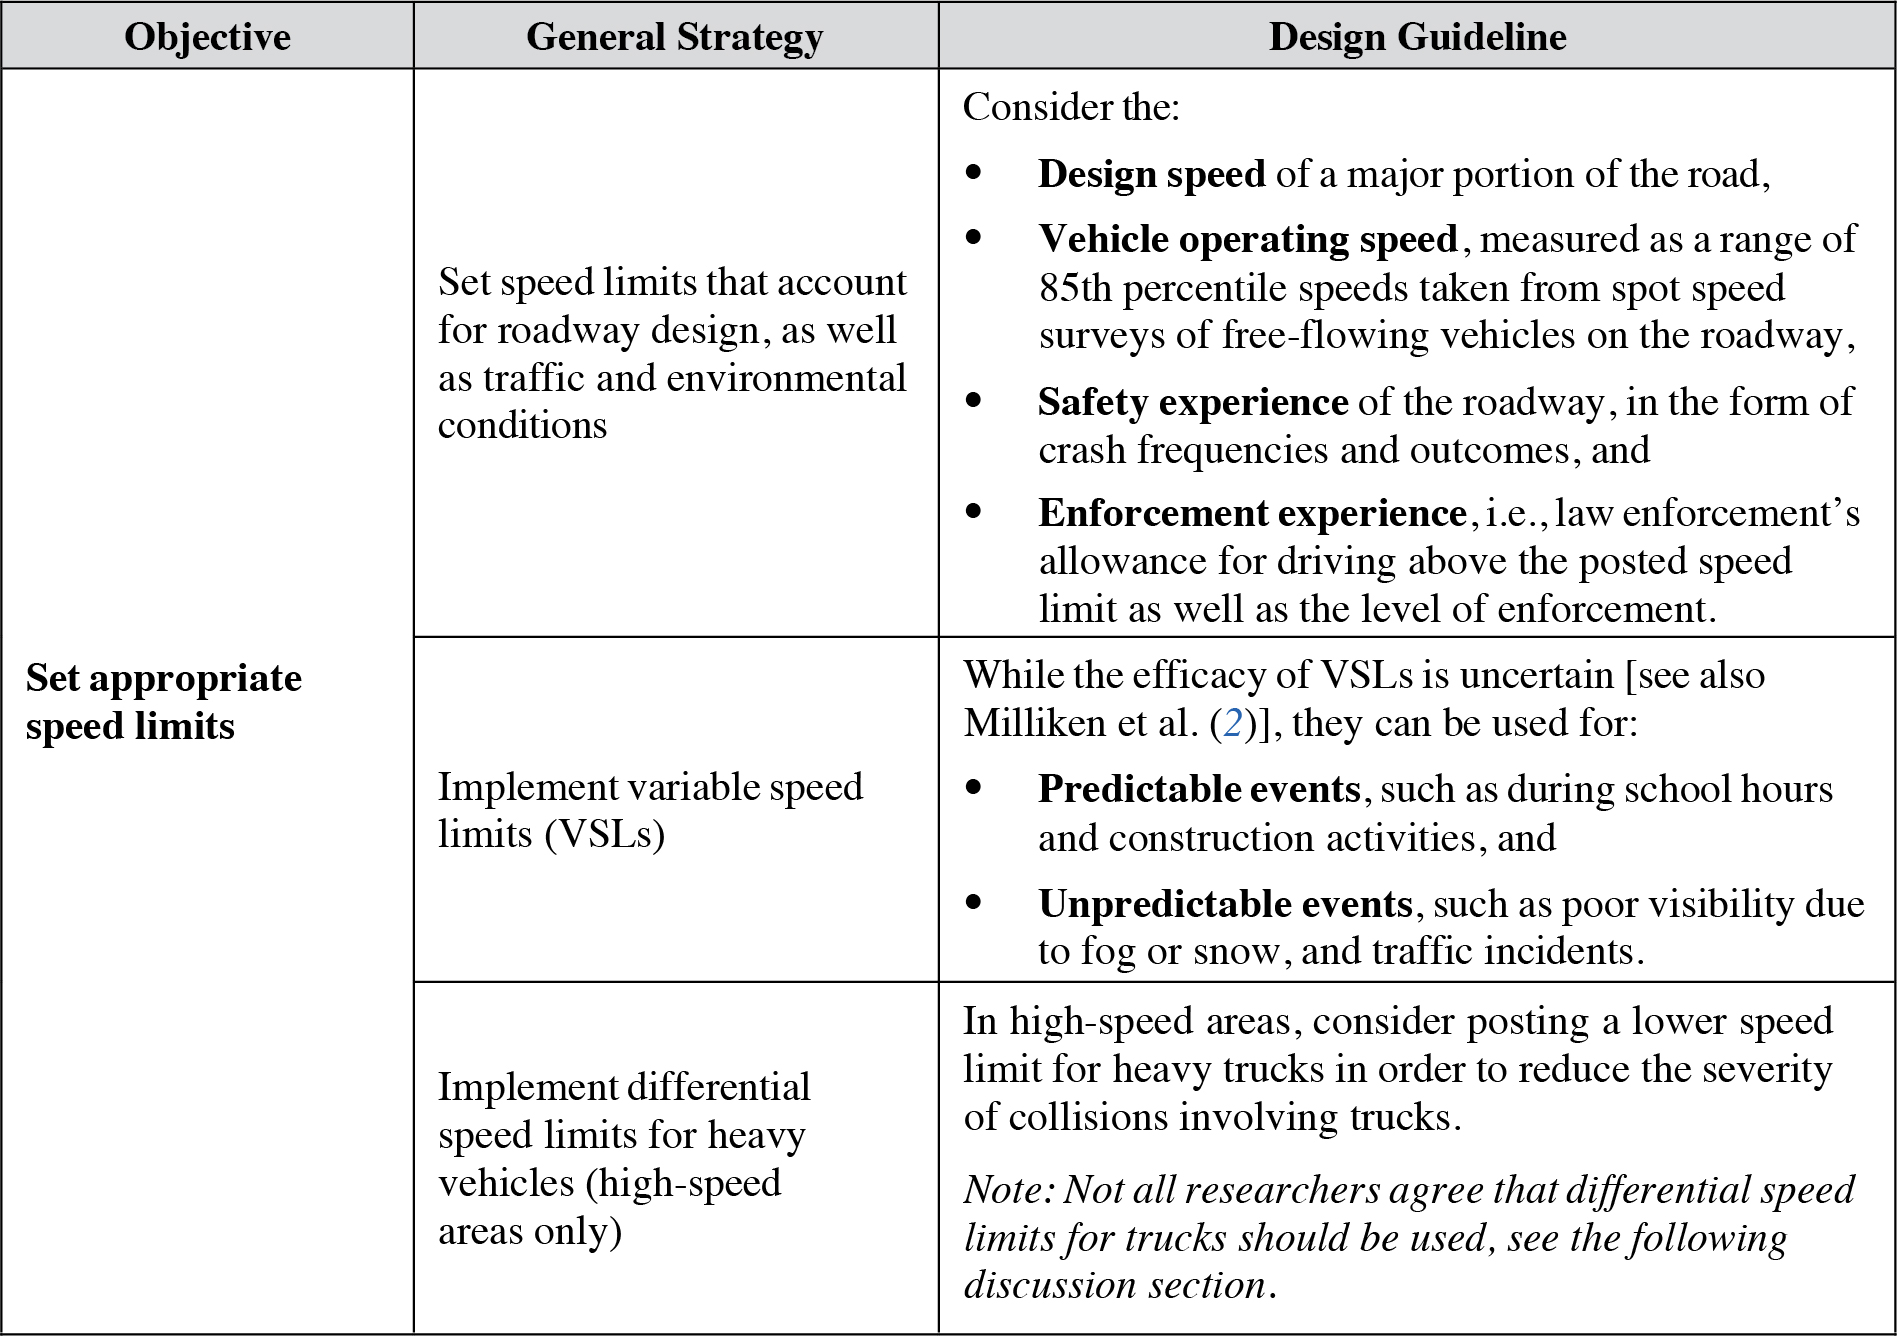
As discussed in Neuman et al., speed limits that appear inconsistent, fail to reflect the immediate roadway environment, or are inconsistent with driver expectancies may be ignored by drivers (1). This situation, in turn, can contribute to a lack of respect for and compliance with speed limits. The posted speed limit provides drivers with not just a legal limit, but also the maximum speed that highway engineers and road designers consider to be safe and appropriate. As noted by Milliken et al., well-conceived speed limits also provide the basis for enforcement by law enforcement officers and the court system (2).
For the set speed limits that account for roadway design, as well as traffic and environmental conditions strategy, practicality and enforcement are key considerations. Setting the speed limit at the 85th percentile speed is expected to result in compliance by most drivers; however, unique design, traffic, or environmental characteristics of the roadway can also affect actual driving speeds. Conditions that might warrant lower speeds include proximity to schools or hospitals, an unusually high percentage of trucks in the traffic flow, unusually heavy pedestrian volumes, or a concentration of elderly pedestrians.
Variable speed limits (VSLs) are generally communicated through CMSs or other traffic control devices. A critical issue with VSLs is determining where they should be used, when the speed limits should be changed, and what the “other” speed limits should be; cameras or other detection equipment can be used to make these determinations (1). Visible and regular enforcement is also required to ensure compliance with the speed limits. VSLs may be most effective when conditions on a particular stretch of roadway often change quickly due to, for example, congestion, weather, or frequent crashes. Under such circumstances, providing VSLs that can adapt speeds to such changing circumstances can improve safety performance.
The use of differential speed limits for heavy trucks is an option for locations associated with a high incidence of truck crashes; however, the research is mixed with respect to the efficacy of doing so. The logic underlying the use of having a lower posted speed limit for trucks than for passenger vehicles is “that trucks have much longer stopping distances than do light vehicles and have other speed-related risks such as rollover at lower speeds and vulnerability to loss of control in cross winds” (3). The counterargument is that differential speed limits for trucks vs. cars increase the overall variability in vehicle speeds (at a given location at a given time), resulting in greater potential for conflicts and crashes between trucks and cars. In a review of safety outcomes associated with heavy vehicles, Harwood et al. found that the use of differential speed limits does not seem to reduce crashes, but may vary the distribution of crash types (4).
Design Considerations
This guideline, and its companion guidelines (“Speeding Countermeasures: Communicating Appropriate Speed Limits” on page 14-14 and “Speeding Countermeasures: Using Roadway Design and Traffic Control Elements to Address Speeding Problems” on page 14-16), only include those countermeasures provided by Milliken et al. (2) that are directed at roadway design. Neuman et al. (1) should be consulted for a more detailed discussion of these countermeasures, as well as countermeasures intended (1) to heighten driver awareness of speeding-related safety issues and (2) to improve the efficiency and effectiveness of speed enforcement efforts.
Cross References
Speeding Countermeasures: Communicating Appropriate Speed Limits
Key References
1. Neuman, T. R., Slack, K. L., Hardy, K. K., Bond, V. L., Potts, I., and Lerner, N. (2009). NCHRP Report 500: Guidance for Implementation of the AASHTO Strategic Highway Safety Plan, Volume 23: A Guide for Reducing Speeding-Related Crashes. Transportation Research Board of the National Academies, Washington, DC.
2. Milliken, J. G., Council, F. M., Gainer, T. W., Garber, N. J., Gebbie, K. M., Hall, J. W., Lave, C. A., Mason, J. M., Jr., Mosteller, F., Nichols, S. D., Oster, C. V., Retting, R. A., Sheridan, T. B., Taylor, W. C., Tsebelis, G., Viano, D. C., and Weaver, R. P. (1998). Special Report 254: Managing Speed: Review of Current Practice for Setting and Enforcing Speed Limits. TRB, National Research Council, Washington, DC.
3. Knipling, R. R., Waller, P., Peck, R. C., Pfefer, R., Neuman, T. R., Slack, K. L., and Hardy, K. (2004). NCHRP Report 500: Guidance for Implementation of the AASHTO Strategic Highway Safety Plan, Volume 13: A Guide for Reducing Collisions Involving Heavy Trucks. Transportation Research Board of the National Academies, Washington, DC.
4. Harwood, D. W., Potts, I. B., Torbic, D. J., and Glauz, W. D. (2003). CTBSSP Synthesis of Safety Practice 3: Highway/Heavy Vehicle Interaction. Transportation Research Board of the National Academies, Washington, DC.
SPEEDING COUNTERMEASURES: COMMUNICATING APPROPRIATE SPEED LIMITS
Introduction
This guideline provides best practices for communicating posted speed limits to drivers. Much of the information in this guideline, as well as its companion guidelines (“Speeding Countermeasures: Setting Appropriate Speed Limits” on page 14-12 and “Speeding Countermeasures: Using Roadway Design and Traffic Control Elements to Address Speeding Problems” on page 14-16), are adapted from Neuman et al. (1). As part of NCHRP Report 500: Guidance for Implementation of the AASHTO Strategic Highway Safety Plan, the study by Neuman et al. (1) was developed to address two key problems involved in excessive or inappropriate speeds: (1) driver behavior (i.e., deliberately driving at an inappropriate or unsafe speed) and (2) driver response to the roadway environment (i.e., inadvertently driving at an inappropriate or unsafe speed, failure to change speed in a proper or timely manner, or failure to perceive the speed environment). Both these problems result in an increased risk of a crash or conflict.

Discussion
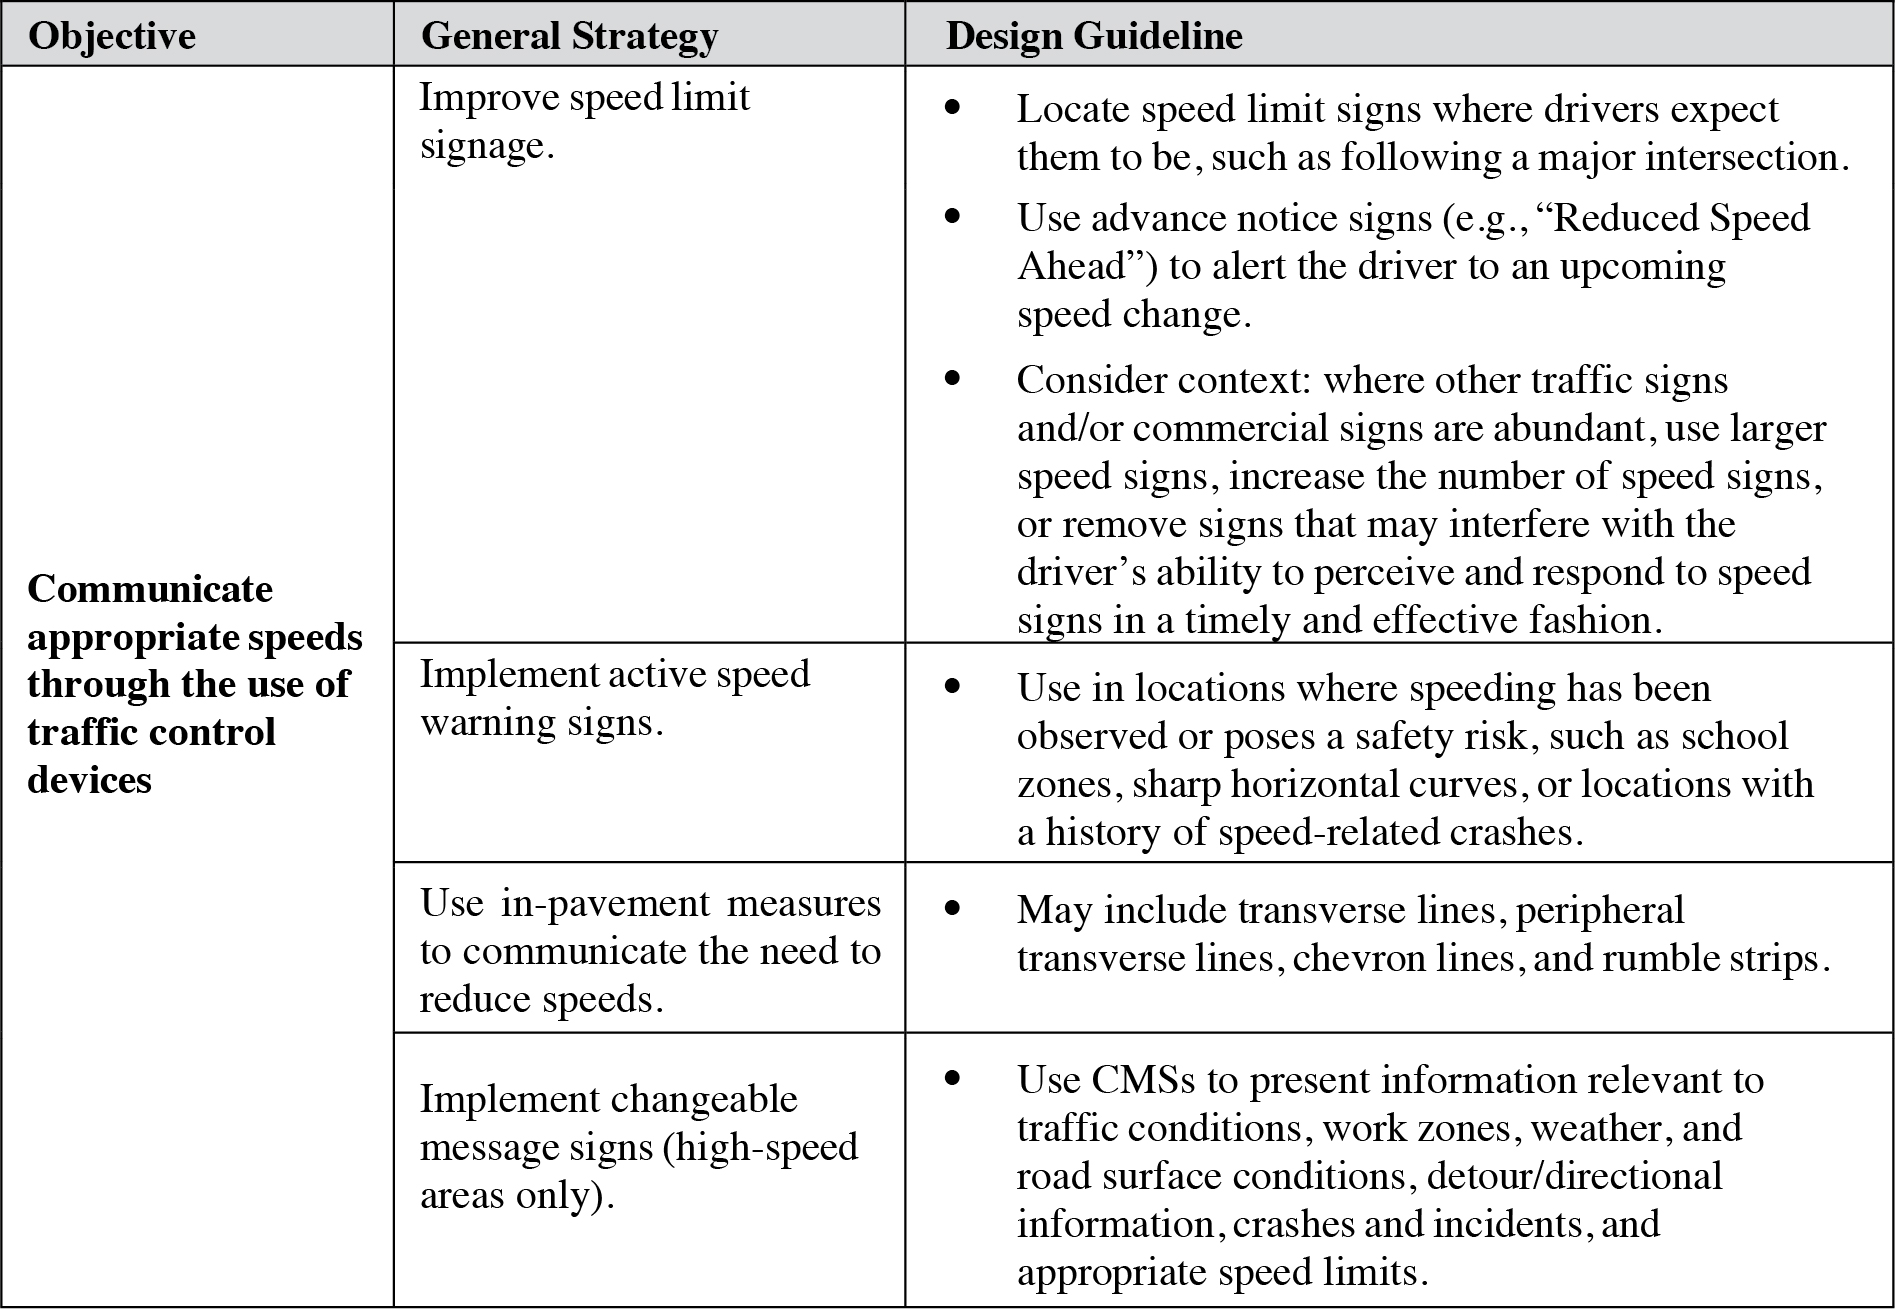
As discussed in Neuman et al. (1), information about speed limits—in the form of signs or markers—should be clearly communicated to drivers at appropriate locations on the roadway. The posted speed limit provides drivers with not just a legal limit, but also the maximum speed that highway engineers and road designers consider to be safe and appropriate. The placement and visibility of speed signs are key to properly communicating speed limits.
Improving speed limit signage is especially important in areas where signs are frequently obscured by other signage, vegetation, or adverse weather conditions. Also, having a high percentage of older drivers on a particular section of the roadway is often a good reason to address signage location and visibility. Providing conspicuous and redundant information about unexpected, posted speed changes, such as those greater than 10 mi/h, can also increase driver awareness of a speed change. This information can be provided by using “Speed Reduction Ahead” signs in advance of the change, placing signs on both sides of the roadway, and using signs with salient features (e.g., fluorescent flags) (1). Additional supplementary signs spaced every 60 s of travel (or more frequently in urban areas with increased access to the road) can also promote driver awareness of the speed limit.
Active speed warning signs improve driversʼ awareness of both their current speed and the posted speed limit in order to deter speeding behaviors. In Bloch (2), a before–after evaluation was conducted to assess the benefits of using a speed warning sign. The study found that mean speed was reduced at the sign location, but that intermittent enforcement was required to significantly reduce speeds downstream from the sign. The sign was effective in reducing excessive speeds (i.e., speeds 10 mi/h above the posted speed). However, a study by Harms and Brookhuis (3) showed that adding motion signals by means of flashing amber lights or a wave to draw attention to a speed limit change diminished driversʼ detection of the changed speed limit, suggesting that using flashers and waves to attract attention to electronic signs in fact decreases driversʼ ability to process the information contained in the signs.
In-pavement measures and other perceptual measures can be used to encourage drivers to adhere to speed limits (1). Pavement markings—such as transverse lines, peripheral transverse lines, and chevron lines—create the illusion that the driver is driving faster than his/her actual speed and can be used as a means to decrease excessive speeds by reducing the driverʼs comfort level at higher speeds (1). These approaches can be used along any roadway segment where speed may be a problem, as well as locations where speed reductions are necessary, such as intersection approaches, work zones, toll plazas, and ramps. Rumble strips (e.g., continuous shoulder rumble strips, centerline rumble strips, or transverse rumble strips) may also be used to reduce vehicle speeds or to prevent crashes where speed is a causal factor (1). In this role, rumble strips are used as a traffic calming device in, for example, high pedestrian areas such as parks, schools, hospitals, and residential areas. Rumble strips are also discussed in “Rumble Strips” on page 17-6.
CMSs can also be used to display information on appropriate speeds relative to current conditions. See Chapter 22 for more details on when and how to use CMSs.
Design Considerations
This guideline, and its companion guidelines (“Speeding Countermeasures: Setting Appropriate Speed Limits” on page 14-12 and “Speeding Countermeasures: Using Roadway Design and Traffic Control Elements to Address Speeding Problems,” on page 14-16), only include those countermeasures provided by Milliken et al. (4) that are directed at roadway design. Neuman et al. (1) should be consulted for a more detailed discussion of these countermeasures, as well as countermeasures intended (1) to heighten driver awareness of speeding-related safety issues and (2) to improve the efficiency and effectiveness of speed enforcement efforts.
Cross References
Speeding Countermeasures: Setting Appropriate Speed Limits
Key References
1. Neuman, T. R., Slack, K. L., Hardy, K. K., Bond, V. L., Potts, I., and Lerner, N. (2009). NCHRP Report 500: Guidance for Implementation of the AASHTO Strategic Highway Safety Plan, Volume 23: A Guide for Reducing Speeding-Related Crashes. Transportation Research Board of the National Academies, Washington, DC.
2. Bloch, S. A. (1998). A comparative study of the speed reduction effects of photo-radar and speed display boards. Transportation Research Record: Journal of the Transportation Research Board,1640, 27–36.
3. Harms, I., and Brookhuis, K. (2017). Traffic management: Assessing various countermeasures to improve detection failure of changes in speed limit signals. Applied Ergonomics, 61, 44–52.
4. Milliken, J. G., Council, F. M., Gainer, T. W., Garber, N. J., Gebbie, K. M., Hall, J. W., Lave, C. A., Mason, J. M., Jr., Mosteller, F., Nichols, S. D., Oster, C. V., Retting, R. A., Sheridan, T. B., Taylor, W. C., Tsebelis, G., Viano, D. C., and Weaver, R. P. (1998). Special Report 254: Managing Speed: Review of Current Practice for Setting and Enforcing Speed Limits. TRB, National Research Council, Washington, DC.
SPEEDING COUNTERMEASURES: USING ROADWAY DESIGN AND TRAFFIC CONTROL ELEMENTS TO ADDRESS SPEEDING PROBLEMS
Introduction
This guideline provides best practices for selecting and using geometric design features and traffic signals to support safe speed decisions by drivers. Much of the information in this guideline, as well as its companion guidelines (Speeding Countermeasures: Setting Appropriate Speed Limits on page 14-12 and Speeding Countermeasures: Communicating Appropriate Speed Limits on page 14-14), is adapted from Neuman et al. (1). As part of NCHRP Report 500: Guidance for Implementation of the AASHTO Strategic Highway Safety Plan, the study by Neuman et al. (1) was developed to address two key problems involved in excessive or inappropriate speeds: (1) driver behavior (i.e., deliberately driving at an inappropriate or unsafe speed) and (2) driver response to the roadway environment (i.e., inadvertently driving at an inappropriate or unsafe speed, failure to change speed in a proper or timely manner, or failure to perceive the speed environment). Both these problems result in an increased risk of a crash or conflict.

Discussion
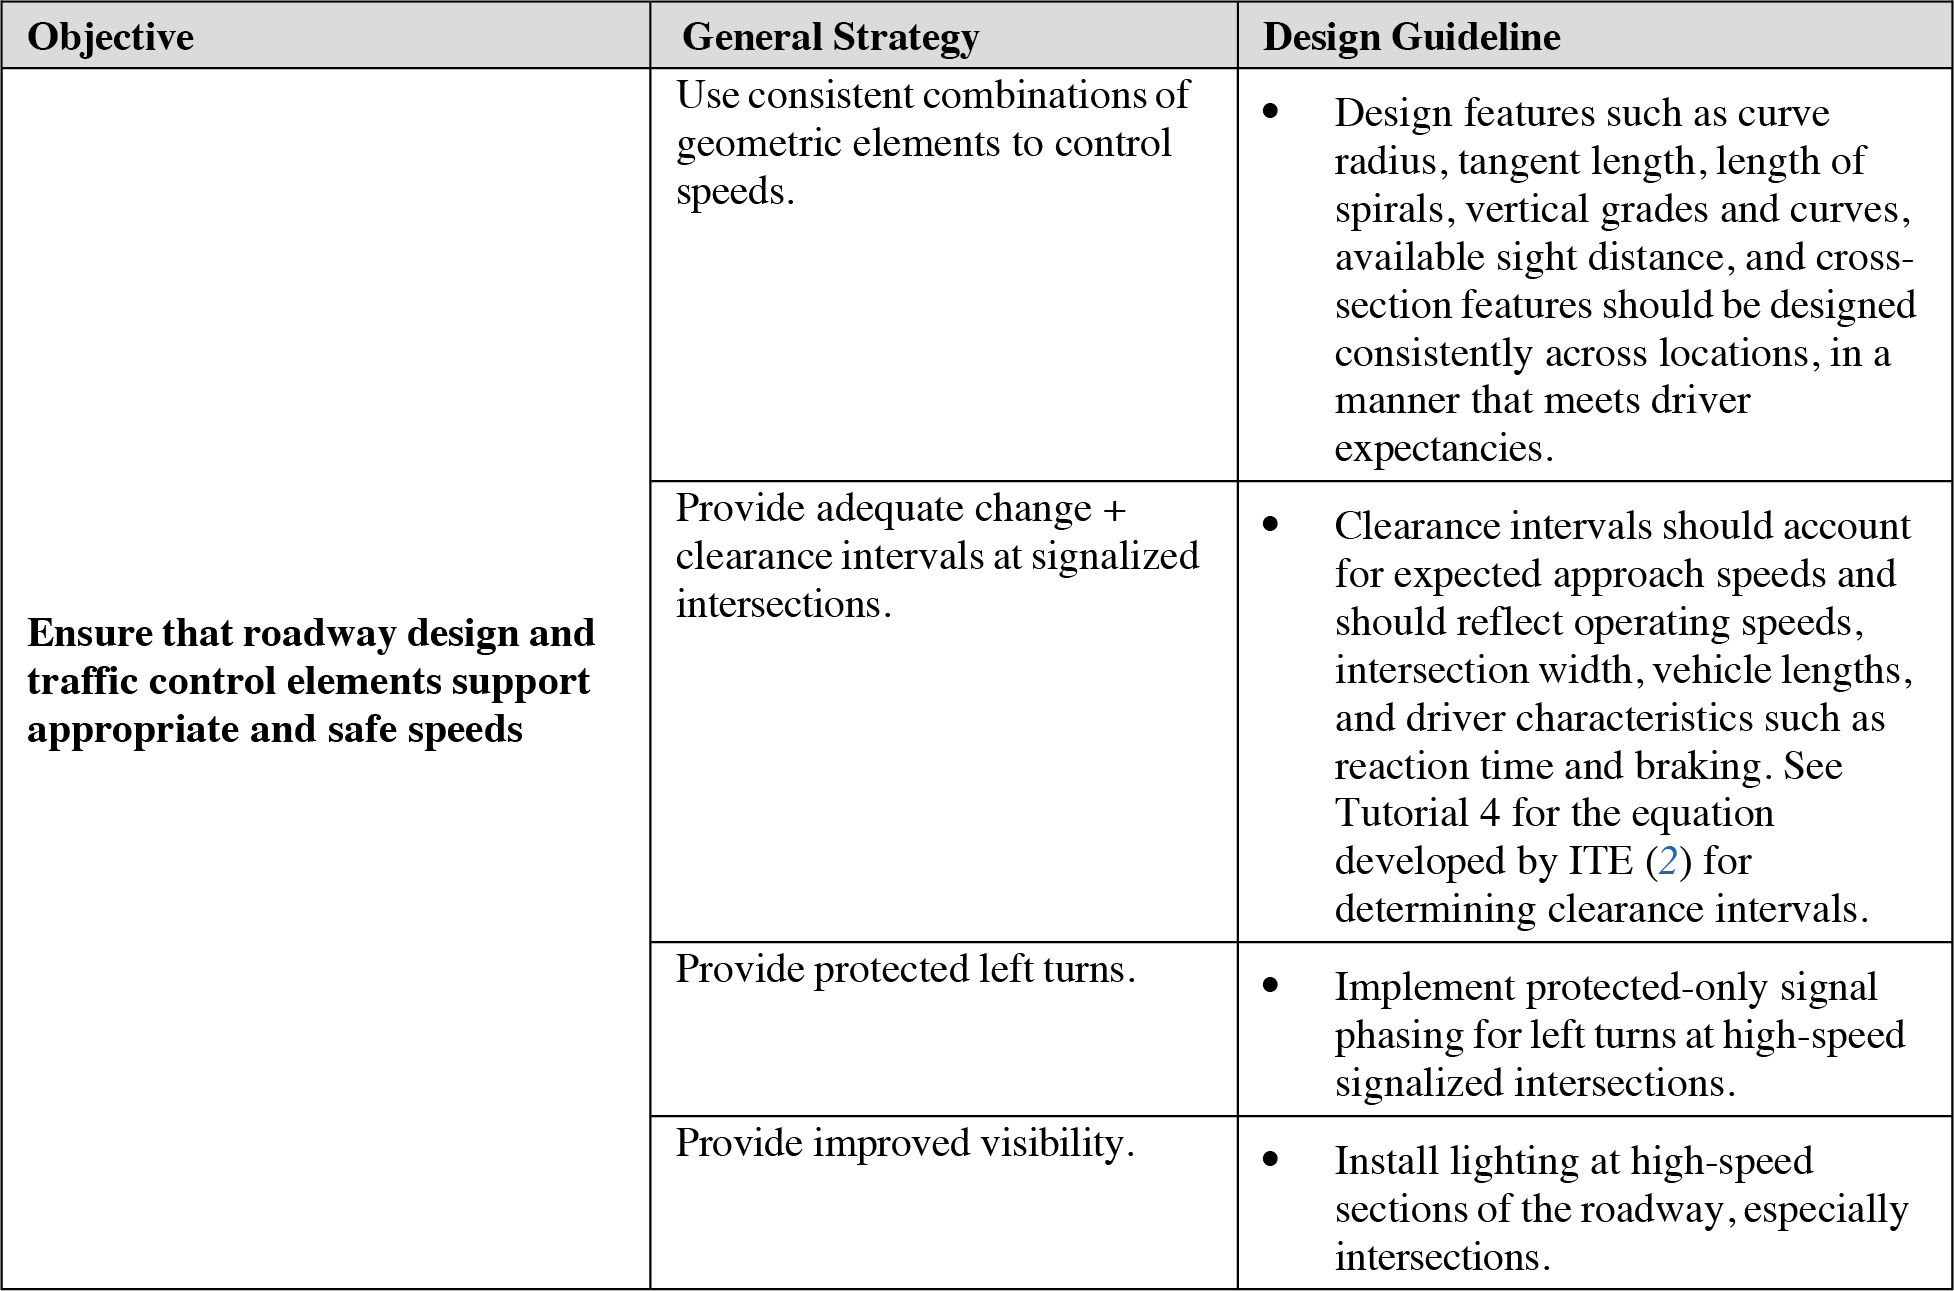
As discussed in Neuman et al. (1), while drivers ultimately select their own speeds, they receive, process, and use a number of cues from the immediate driving environment when doing so. Key elements of the driving environment that can effectively communicate safe speeds are roadway design and the use and operation of traffic control devices.
Design consistency is a key principle in roadway design. Using consistent combinations of geometric elements leads to roadway elements that meet driver expectancies and can result in consistent speeds and fewer unexpected speed changes. For example, large differences and sudden changes in horizontal alignment, available sight distance, curve radii, etc., should be avoided, as these can increase driver workload, misperceptions, errors, and—ultimately—the likelihood of crashes.
Clearance intervals provide safe transitions in right-of-way assignment between crossing or conflicting flows of traffic. One way to accomplish safe transitions is an all-red interval, which should be designed to account for expected approach speeds to reduce the likelihood of collisions resulting from red light running. Clearance intervals that are too short can result in drivers not being able to stop in time for the red light; drivers can also stop too quickly, increasing the risk of rear-end collisions from following vehicles. Clearance intervals that are too long can lead to driver impatience or red light running, especially in drivers familiar with the intersection. Whether the concern is red light running or increased risk of collisions, both outcomes are exacerbated by speeding.
On high-speed roadways, especially in high traffic volume situations, there may be inadequate gaps for left-turning vehicles. Protected-only left-turn signals have a phase designated specifically for left-turning vehicles. Other factors that may warrant the use of protected-only left-turn phases include delay, visibility, distance of the intersection, and safety at the intersection (e.g., crash history) (1). The benefits of protected-only left turns include increasing left-turn capacity and reducing intersection delays for vehicles turning left (3). The use of protected left-turn phases also improves safety by removing conflicts during a left-turn movement. This improved safety can be especially important on roadways where high operating speeds may play a role in the difficulty a driver has with identifying and selecting a safe gap (1). However, the use of protected-only left-turn signals will usually increase the cycle length, which also increases delay. For additional discussion and guidance on the type of left-turn phase to use in a given situation, see Pline (4).
On high-speed roads, drivers have less time to detect visual information because vehicles are traveling faster. This problem is compounded at night when the visual contrast of some roadway elements is reduced, and drivers require more time to detect visual information (drivers at higher speeds will also travel farther during this elongated detection period and consequently have less time to react to hazards). While increasing lighting on its own will not prevent speeding, it will make potential hazards or other important information easier for drivers to see, particularly during nighttime and adverse weather conditions.
Design Considerations
This guideline, and its companion guidelines (“Speeding Countermeasures: Setting Appropriate Speed Limits” on page 14-12 and “Speeding Countermeasures: Communicating Appropriate Speed Limits” on page 14-14), only include those countermeasures provided by the ITE (2) that are directed at roadway design. Neuman et al. (1) should be consulted for a more detailed discussion of these countermeasures, as well as countermeasures intended (1) to heighten driver awareness of speeding-related safety issues and (2) to improve the efficiency and effectiveness of speed enforcement efforts.
Cross References
Speeding Countermeasures: Setting Appropriate Speed Limits
Speeding Countermeasures: Communicating Appropriate Speed Limits
Design Consistency in Rural Driving
Key References
1. Neuman, T. R., Slack, K. L., Hardy, K. K., Bond, V. L., Potts, I., and Lerner, N. (2009). NCHRP Report 500: Guidance for Implementation of the AASHTO Strategic Highway Safety Plan, Volume 23: A Guide for Reducing Speeding-Related Crashes. Transportation Research Board of the National Academies, Washington, DC.
2. ITE. (1994). Determining Vehicle Signal Change and Clearance Intervals. Washington, DC.
3. Brehmer, C. L., Kacir, K. C., Noyce, D. A., and Manser, M. P. (2003). NCHRP Report 493: Evaluation of Traffic Signal Displays for Protected/Permissive Left-Turn Control. Transportation Research Board of the National Academies, Washington, DC.
4. Pline, J. L. (1996). NCHRP Synthesis of Highway Practice 225: Left-Turn Treatments at Intersections. TRB, National Research Council, Washington, DC.
This page intentionally left blank.


