Human Factors Guidelines for Road Systems: Third Edition (2025)
Chapter: 4 Integrating Road User, Highway Design, and Traffic Engineering Needs

CHAPTER 4
Integrating Road User, Highway Design, and Traffic Engineering Needs
Introduction
The purpose of this chapter is to help highway designers and traffic engineers function as virtual road users. Not all road user situations are the same; some are more demanding than others. The different situations make the work of highway designers and traffic engineers more challenging, intricate, and demanding. They consider the human factors characteristics of the user in conjunction with four major components:
- The geometric design elements.
- Roadway and vehicle operations.
- The type of highway.
- The roadway environment.
At any given location, the roadway user only has a finite amount of time to make decisions. Users, even with total visual attention, may not have sufficient time, under demanding real-time conditions, to extract as much information as desired.
Sometimes road users must make choices about what information is processed. The scope of this chapter is to illustrate the breadth of the human factor considerations as magnified by the four major components and how highway designers and traffic engineers can integrate them all in safety-oriented solutions given the constraints of the road user. This chapter also shows, through examples, how on-road problems can be reviewed and improved by using the recommendations in Parts III–VII.
Iterative Review Steps to Achieve Good Human Factor Applications
Process
Whether driving, walking, running, or bicycle riding, road users continuously scan the downstream environment that they are entering (Robinson, Erickson, Thurston, and Clark, 1972).
Figure 4-1 represents the scanning behavior of road users, showing a vehicle proceeding from left to right. At location or time I, the user observes the road environment and corresponding traffic conditions. He or she identifies the MMI at that point in time and space and assesses what guidance and control is needed (Tignor, 2006). The user implements that control and continues with it until scanning location or time I + 1 when an information refresher is determined necessary. Any number of conditions could initiate the need for an information refresher. The following are typical examples that could induce a need for new information at I + 1:
- The cross section may have an increase or decrease in the number of lanes.
- Downstream traffic may be slowing or stopping in the lane the user is traveling.
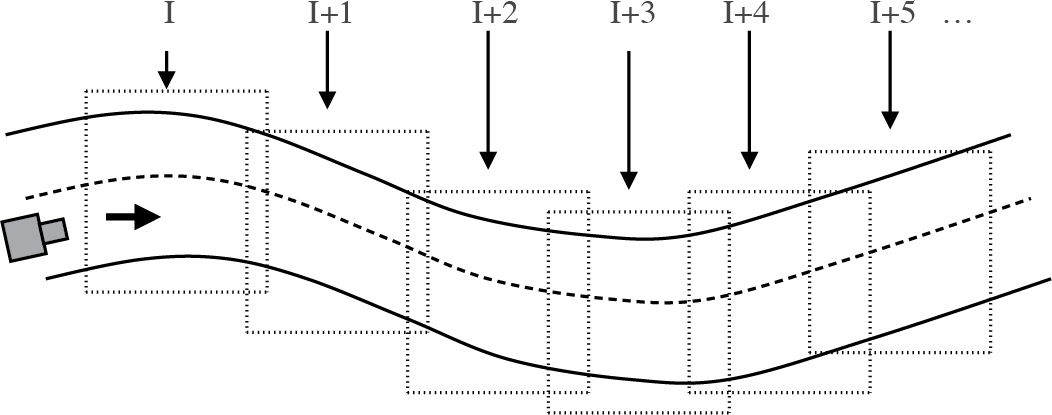
I = User scanning steps (vary in size)
Long Description.
Arrows point from I, I plus 1, I plus 2, I plus 3, I plus 4, and I plus 5 to different points on the road. I is user scanning steps (vary in size).
- A pedestrian may be walking along the shoulder and, without looking, turn in front of the approaching road user.
- Traffic may be entering the road from a side street or business establishment.
- A road user is approaching a traffic sign with letters that are too small to read.
- A traffic signal is changing from green to amber.
- The road appears to be curving sharply to the right while the lane width is decreasing.
Each of these examples would necessitate that the road user reassess his or her information and control at I and determine if control modification is required. The challenge for virtual users (i.e., highway designers and traffic engineers) is to determine what kind of infrastructure modification is required, if any, from locations I, I + 1, . . . I + n.
The scanning step sizes may vary and are influenced by the road user, type of operation, highway character, and environment. Some of these variables are listed in Table 4-1.
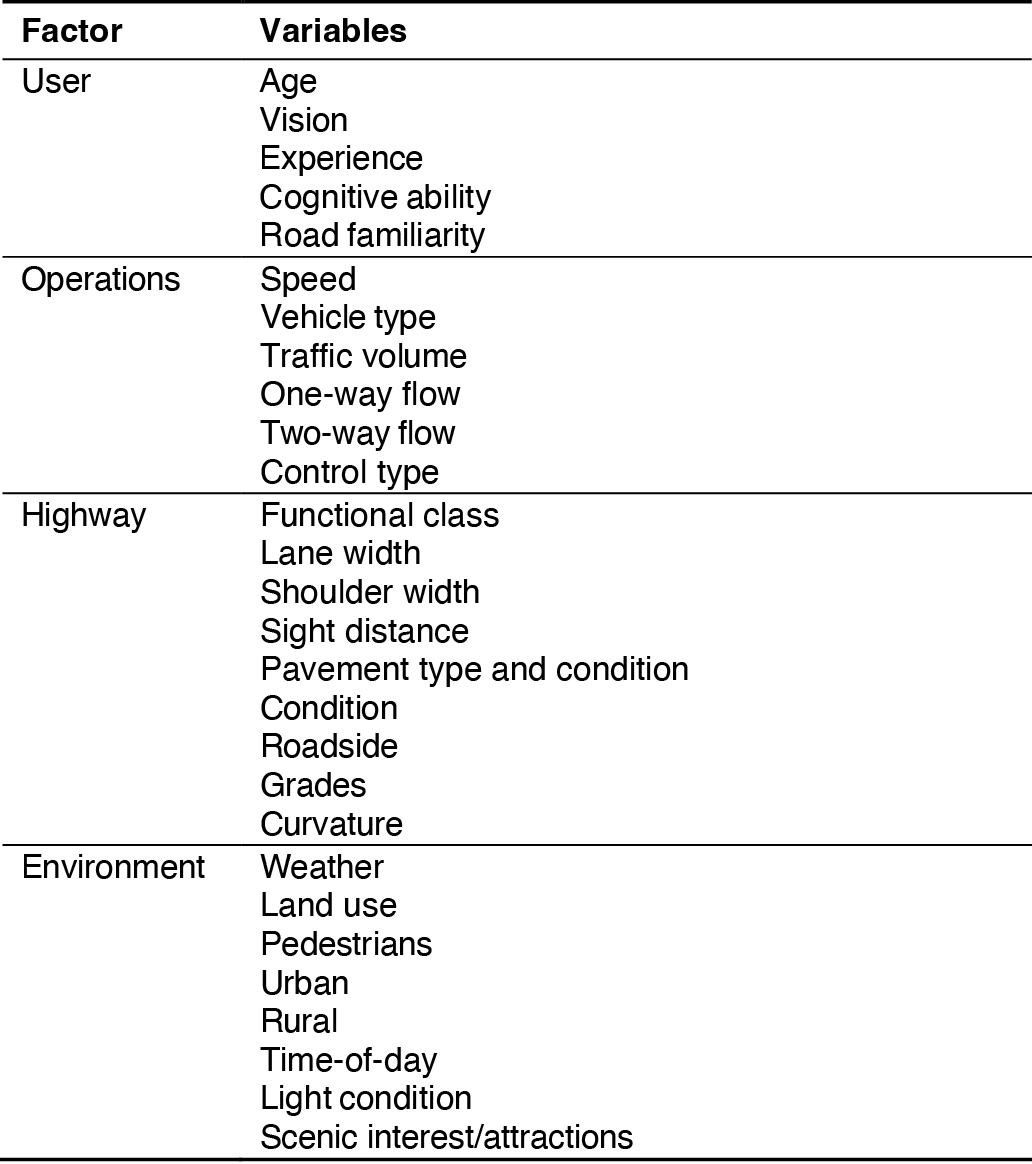
Long Description.
Column 1: Factors. Column 2: Variables. Row 1, Column 1: User. Column 2: Age, Vision, Experience, Cognitive ability, Road familiarity. Row 2, Column 1: Operations. Column 2: Speed, Vehicle type, Traffic volume, One-way flow, Two-way flow, Control type. Row 3, Column 1: Highway. Column 2: Functional class, Lane width, Shoulder width, Sight distance, Pavement type and condition, Condition, Roadside, Grades, Curvature. Row 4, Column 1: Environment. Column 2: Weather, Land use, Pedestrians, Urban, Rural, Time-of-day, Light condition, Scenic interest/attractions.
All road users are continuously sampling the road environment for information. The sampling rate can be represented as follows:

Through road scanning, the user is updating his or her information database for making decisions. This process can be expressed as follows:

Long Description.
Information open parenthesis t close parenthesis equals Information open parenthesis t minus 1 close parenthesis plus changes during delta t
Where:
t = time
Δt = sampling interval
The real challenge, then, is to identify the changes that have occurred during the sampling interval (Δt). Changes include those elements detected by the road user within the visual scans or I steps. They may be previously seen items or new items that have not been seen previously. The importance of the items may be elevated or reduced depending on their relationship to the userʼs need at the time (t). They may have a direct impact on the userʼs task of maintaining control of the vehicle or they may only serve as information useful for defining the approaching highway, operating, and environmental conditions.
Size of Iterative Steps
The highway designer and the traffic engineer examine the road environment in incremental steps similar to those steps described in the previous section to ensure the road user will not be overloaded with temporal tasks and decisions. In short, good human factor principles can be integrated into the design of the road system.
The sizes of the iterative steps are not going to be the same for all road environments. They will vary depending on the road user, the type of highway, the operations, and the environment. The iterative steps, however, overlap from one section to the next to ensure continuity of the travel path and that no potentially meaningful information for road users will be overlooked. The highway designers and traffic engineers can jointly examine the road environment—i.e., lane alignment (roadway and intersections), signing (advisory, regulatory and guidance), and operations (normal and work zones)—relative to the likelihood users will be able to perform the required tasks safely and efficiently within the time and space available. Table 4-2 is a breakdown of some of the different steps taken by road users and their respective time restraints.
Identification of Potentially Conflicting or Missing Information
Identification of potentially conflicting, confusing, or missing information is probably one of the most important tasks of designers and traffic engineers. As virtual road users, designers and traffic engineers can examine the roadway environment for information conflicts that may mislead or confuse road users. They anticipate what information the road user requires and where it is needed so appropriate design elements or traffic control can be integrated into the design and operational plans. Missing information is not helpful to the road user. In short, designers and traffic engineers can also seek road environments that are self-explaining, quickly understood, and easy for users to act upon (Theeuwes and Godthelp, 1992).
The example and analysis detailed in the next section illustrates problems that can be created by not properly relating the roadway geometrics to the traffic control. Together, designers and traffic engineers need to identify these problems when serving as virtual road users.
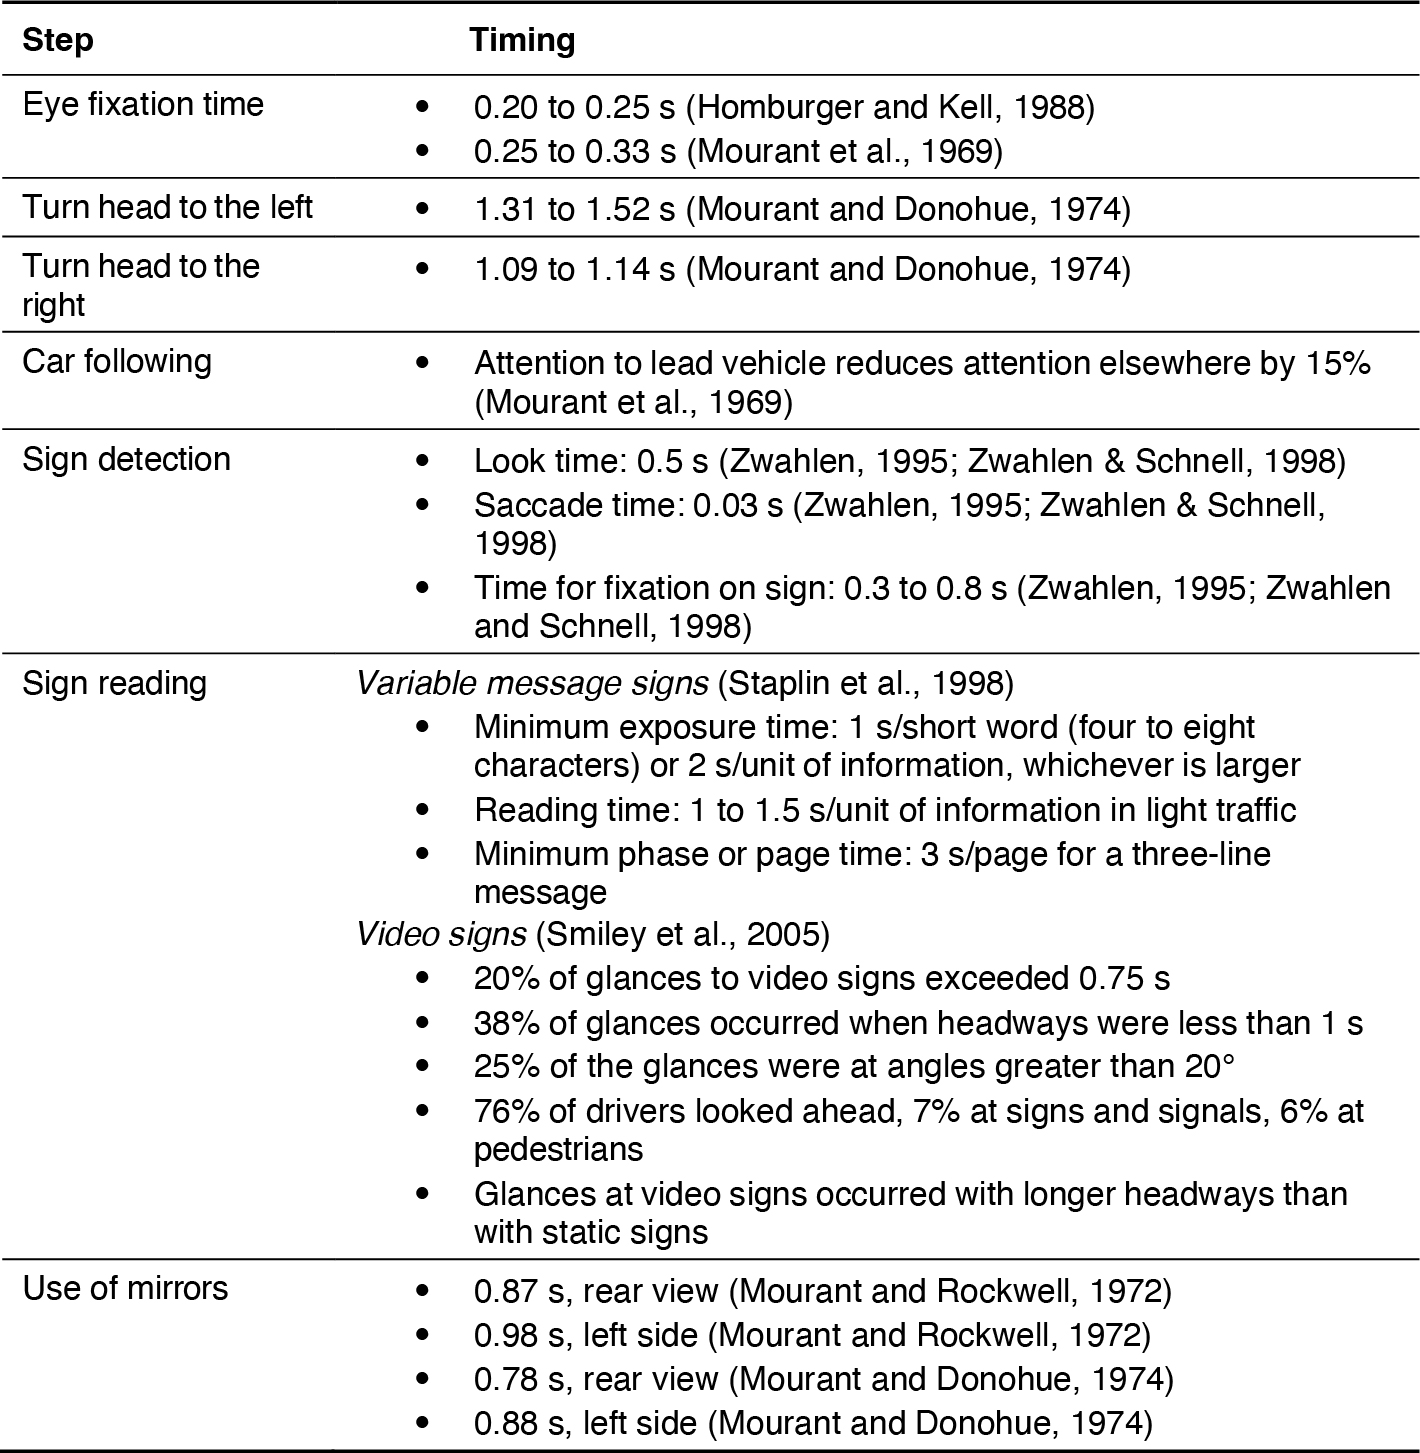
Long Description.
Column 1 heading is Step. Column 2 heading is Timing.. Row 1, Column 1: Eye fixation time. Column 2: 0.20 to 0.25 s (Homburger and Kell, 1988). 0.25 to 0.33 s (Mourant et al., 1969). Row 2, column 1: Turn head to the left. Column 2: 1.31 to 1.52 s (Mourant and Donohue, 1974). Row 3, column 1: Turn head to the right. Column 2: 1.09 to 1.14 s (Mourant and Donohue, 1974). Row 4, column 1: Car following. Column 2: Attention to lead vehicle reduces attention elsewhere by 15% (Mourant et al., 1969). Row 5, column 1: Sign detection. Column 2: Look time: 0.5 s (Zwahlen, 1995; Zwahlen & Schnell, 1998). Saccade time: 0.03 s (Zwahlen, 1995; Zwahlen & Schnell, 1998). Time for fixation on sign: 0.3 to 0.8 s (Zwahlen, 1995; Zwahlen and Schnell, 1998). Row 6, column 1: Sign reading. Column 2: First heading in column 2: Variable message signs (Staplin et al., 1998),. Minimum exposure time: 1 s/short word (four to eight characters) or 2 s/unit of information, whichever is larger. Reading time: 1 to 1.5 s/unit of information in light traffic. Minimum phase or page time: 3 s/page for a three-line message. Second heading in column 2: Video signs (Smiley et al., 2005). 20% of glances to video signs exceeded 0.75 s. 38% of glances occurred when headways were less than 1 s. 25% of the glances were at angles greater than 20°. 76% of drivers looked ahead, 7% at signs and signals, 6% at pedestrians. Glances at video signs occurred with longer headways than with static signs. Row 7, column 1: Use of mirrors Column 2: 0.87 s, rear view (Mourant and Rockwell, 1972). 0.98 s, left side (Mourant and Rockwell, 1972). 0.78 s, rear view (Mourant and Donohue, 1974). 0.88 s, left side (Mourant and Donohue, 1974).
Use of Parts III, IV, V, VI, and VII for Aiding Design
Parts III through VII of this document are where general principles, resources, and guidance statements are found. Before using the HFG for developing a solution to a problem, the HFG user can first study and understand the issues involved. For example, the illustrative example in the following section involves both geometric design and signing issues. The approaching road users see a fork in the road and seven sets of signs communicating information to drivers. Part III, Chapter 6: “Curves,” and Part V, Chapter 21: “Signing,” are the sections of the HFG that can be used for developing the solution to this problem.
Detailed Description of Illustrative Example
A two-lane arterial roadway (US 293) crosses over a parkway (Route 6) that prohibits trucks. The arterial approaches the parkway from a tangent, but it then crosses over the parkway by curving sharply to the left. The connection to the parkway is a ramp that appears as a continuation of the arterial tangent. Because trucks are prevented from using the parkway, a sign directs them to an alternative roadway to reach the portion of Route 6 with unrestricted access. See Figure 4-2 and note that time-of-day and lighting could influence the comments that follow.
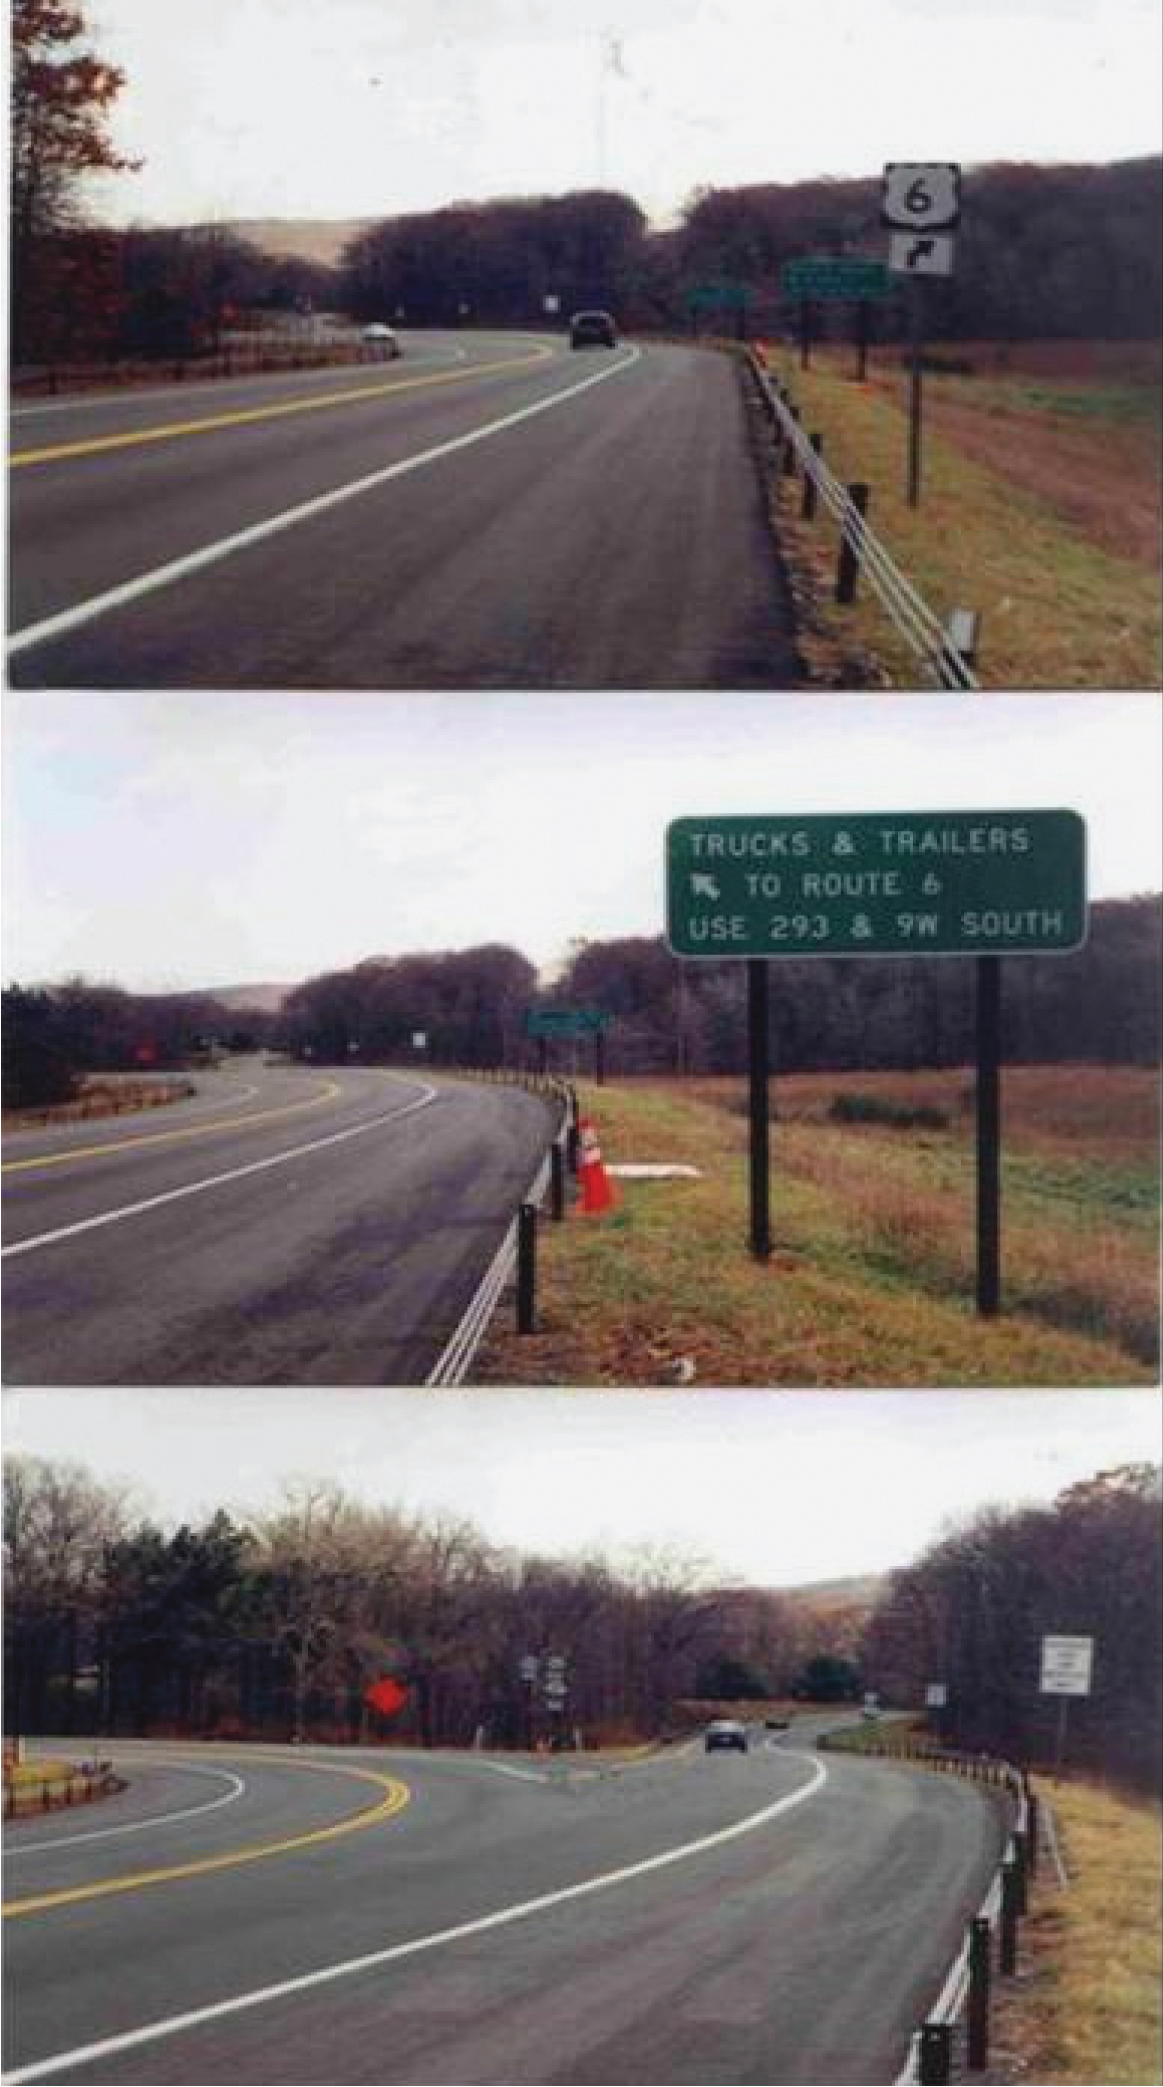
Long Description.
The first photo shows the road turning toward the left. A sign on the side reads 6 and shows a rightward arrow. The second photo of the road shows a large signboard with a leftward arrow. The third photo shows an intersection on the road. One road branches to the left from the two-lane arterial roadway.
Various human factors issues are found at this location:
- The alignment of the arterial and parkway ramp is not self-explaining. The first route marker shows Route 6 going to the right. The first word sign, at a glance, suggests Route 6 is going to the left. The first line on the first word sign indicates the sign is for trucks and trailers, but that is not immediately clear to unfamiliar, approaching drivers. Car drivers also visually key on the sign. Confusion is created as to which road is Route 6, Route 293, and Route 9W.
- Because the signs are spaced too close together and the road makes an abrupt turn to the left, approaching drivers have insufficient time to scan the environment and make decisions on
- navigation, guidance, and control. The word signs have too many lines of information for users to read and interpret.
- The heights of the letters on the signs are too small.
- The message as to where trucks are permitted is not sufficiently clear.
- As seen by the skid marks near the gore in Figure 4-2 (bottom photograph), road users have difficulty in deciding whether to follow the road to the left or continue straight onto the ramp to the parkway.
- Access to intersecting routes or ramps should not appear to be a continuation of the approaching, main road.
In this example, the HFG can be used together to develop a joint candidate design and control solution having a high level of road user acceptance, understanding, and safety. Candidate solutions should be in compliance with AASHTO design and MUTCD control standards (AASHTO, 2018a; FHWA, 2023b).


