Human Factors Guidelines for Road Systems: Third Edition (2025)
Chapter: 24 Pedestrians

CHAPTER 24
Pedestrians
Task Analysis of Pedestrian Crossing in a Multiple-Threat Scenario
Countermeasures to Reduce Pedestrian Exposure to Vehicles at Crossings
Speed-Calming Countermeasures at Crosswalks
Increasing Pedestrian Visibility and Conspicuity at Crosswalks
Selecting Beacons to Increase Pedestrian Conspicuity at Crosswalks
Influence of the Built Environment on Pedestrian Crossing Safety
Design Challenges for Older Pedestrians
Pedestrian Rail Crossing Safety
Key References for Pedestrian Crossing Safety Countermeasures
TASK ANALYSIS OF PEDESTRIAN CROSSING IN A MULTIPLE-THREAT SCENARIO
Introduction
This guideline highlights a situation for increased pedestrian crash potential at crosswalks: the multiple-threat scenario, in which a pedestrian crossing in front of a stopped vehicle can be struck by a second vehicle traveling in the adjacent lane. This task analysis of a pedestrian crossing on a four-lane divided highway with a pedestrian island shows the interactions that can take place between pedestrians and drivers and the actions that each could take to avoid vehicle/pedestrian conflicts. In the following task analysis table, the behavior of pedestrians and drivers is idealized and presented in a somewhat abstracted manner that does not necessarily express the typical behaviors of pedestrians or drivers or regulatory obligations or requirements in specific jurisdictions.

TASK ANALYSIS OF PEDESTRIAN CROSSING IN A MULTIPLE-THREAT SCENARIO
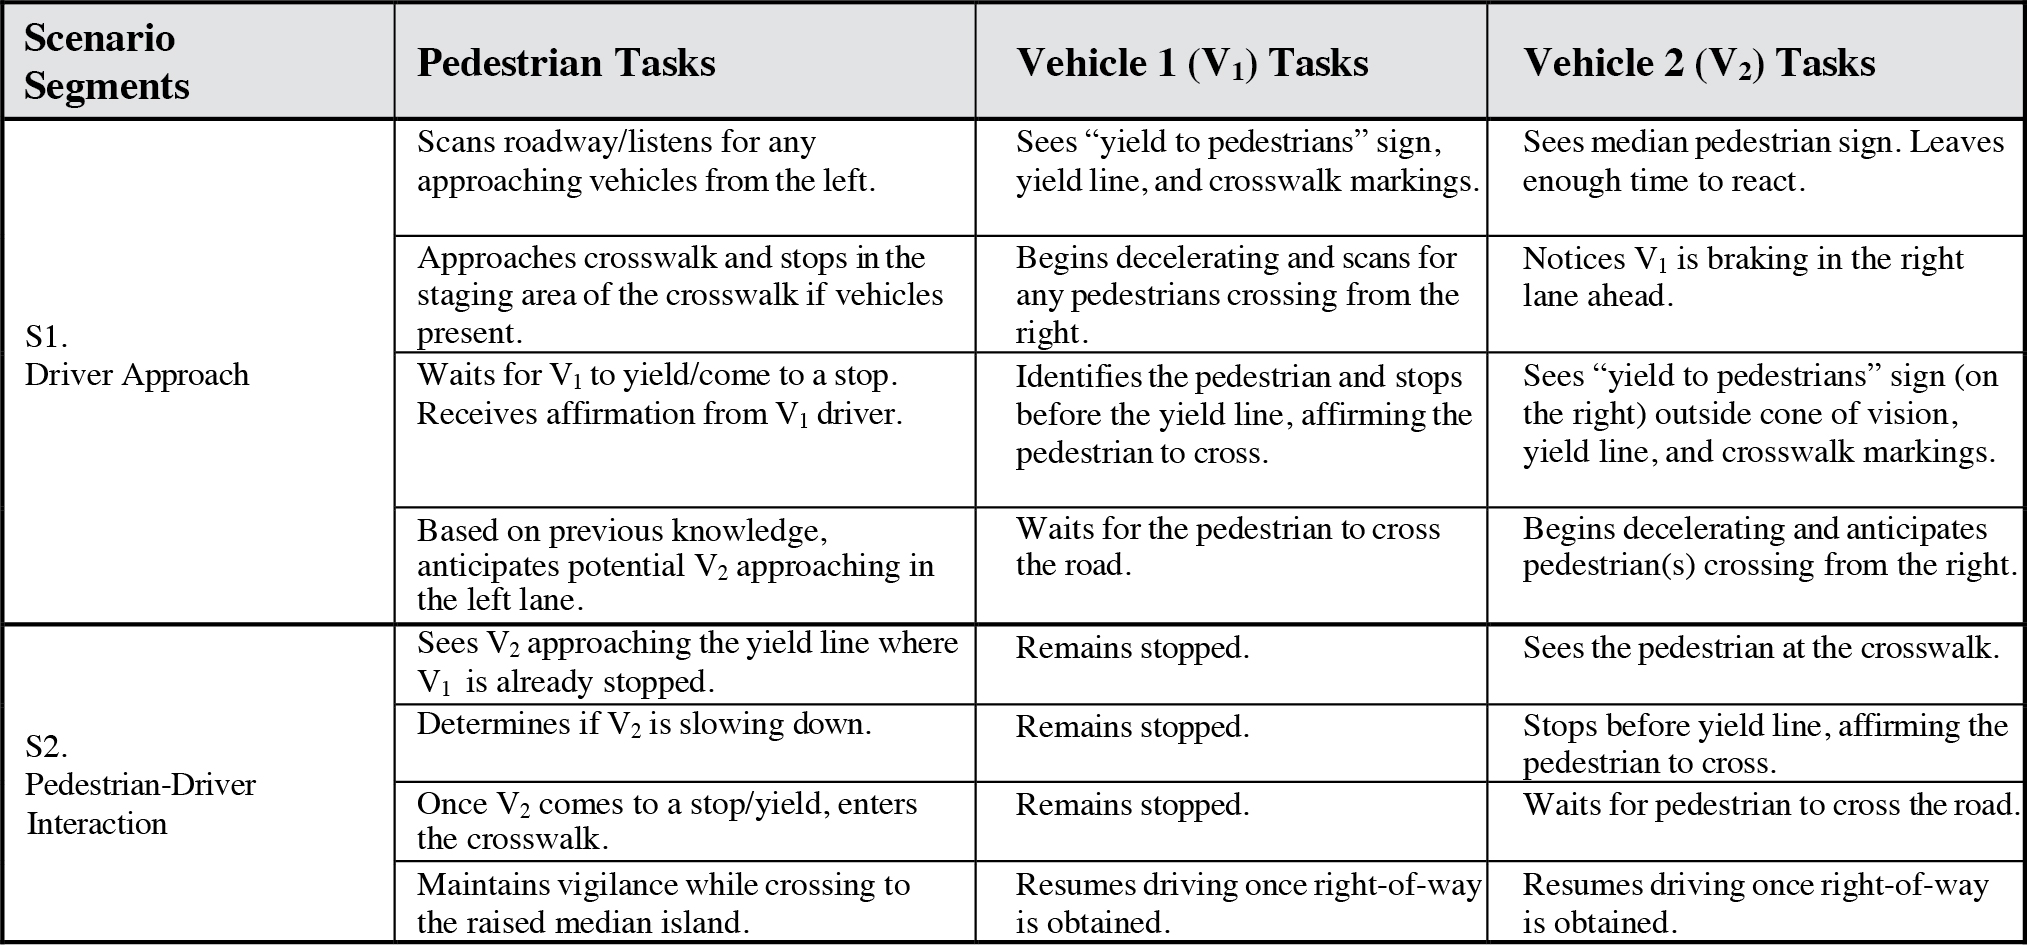
Long Description.
The Table has 3 column headings: Column 1: Pedestrian Tasks. Column 2: Vehicle 1 (V1) Tasks. Column 3: Vehicle 2 (V2) Tasks. Rows 1 to 4 are grouped in a section labeled Scenario Segment S1: Driver Approach. Row 1, Column 1: Scans roadway/listens for any approaching vehicles from the left. Column 2: Sees “yield to pedestrians” sign, yield line, and crosswalk markings. Column 3: Sees median pedestrian sign. Leaves enough time to react. Row 2, Column 1: Approaches crosswalk and stops in the staging area of the crosswalk if vehicles present. Column 2: Begins decelerating and scans for any pedestrians crossing from the right. Column 3: Notices V1 is braking in the right lane ahead. Row 3, Column 1: Waits for V1 to yield/come to a stop. Receives affirmation from V1 driver. Column 2: Identifies the pedestrian and stops before the yield line, affirming the pedestrian to cross. Column 3: Sees “yield to pedestrians” sign (on the right) outside cone of vision, yield line, and crosswalk markings. Row 4, Column 1: Based on previous knowledge, anticipates potential V2 approaching in the left lane. Column 2: Waits for the pedestrian to cross the road. Column 3: Begins decelerating and anticipates pedestrian(s) crossing from the right. Rows 5 to 8 are grouped in a section labeled Scenario Segment S2: Pedestrian-Driver Interaction. Row 5, Column 1: Sees V2 approaching the yield line where V1 is already stopped. Column 2: Remains stopped. Column 3: Sees the pedestrian at the crosswalk. Row 6, Column 1: Determines if V2 is slowing down. Column 2: Remains stopped. Column 3: Stops before yield line, affirming the pedestrian to cross. Row 7, Column 1: Once V2 comes to a stop/yield, enters the crosswalk. Column 2: Remains stopped. Column 3: Waits for pedestrian to cross the road. Row 8, Column 1: Maintains vigilance while crossing to the raised median island. Column 2: Resumes driving once right-of-way is obtained. Column 3: Resumes driving once right-of-way is obtained.
The figure shows the multiple-threat scenario with countermeasures to mitigate pedestrian–vehicle conflicts. In the Approach Segment (S1), the pedestrian and driver of V2 cannot see one another because sight lines are obscured by V1, which is stopping in the right lane. In the Pedestrian-Driver Interaction segment (S2), V1 has stopped at the yield line, and the proximity of the two vehicles relative to the pedestrian provides a clear sight triangle between V2 and the pedestrian. The placement of the advance yield line ensures the pedestrian is within the sight triangle. Without the advance yield line, the sight triangle would not include the pedestrian, increasing pedestrian crash potential if V2 does not yield.
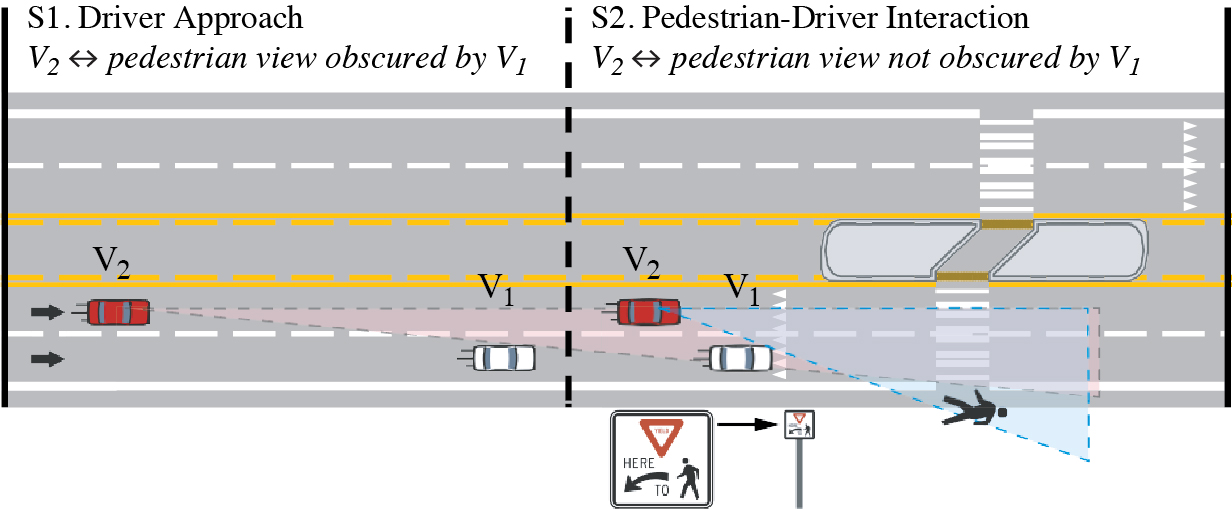
Long Description.
The first half of the illustration is S1, the driver approach. It shows that the V2 pedestrian view is obscured by V1. V2 is in the left lane and V1 is in the right lane. The sight triangle for V2 is shown. The second half of the illustration is S2, the pedestrian-driver interaction. It shows that V2 pedestrian view is not obscured by V1. V2 is in the left lane just behind V1 in the right lane. A sign beside the road shows a yield symbol, a pedestrian symbol, and the words “here to” next to a curved arrow. A pedestrian is shown approaching a crosswalk. The sight triangle for V2 reaches the pedestrian.
Discussion
The pedestrian crossing task analysis is derived from several reports on pedestrian and driver actions at crosswalks and in multiple-threat situations. These actions are important to understand in relation to one another since both the driver and pedestrian make decisions based on the actions and status of the other (1). Because of this, the multiple-threat pedestrian crossing scenario is split into two segments: Driver Approach and Pedestrian-Driver Interaction.
Referring to the figure on the previous page, in the Driver Approach segment, the drivers approach the yield markings ahead of the crosswalk. Both drivers and the pedestrian must individually recognize the potential multiple-threat situation. For pedestrians, they must notice that V1 in the right lane could be blocking their view of a potentially unyielding V2 in the far lane. For drivers, they must recognize the crosswalk, yield markings, and/or pedestrian crossing signs ahead (2). The driver of V2 must also see that V1 in the right lane ahead is not only braking or stopped but could also be obscuring a pedestrian positioned in the right lane, waiting to cross or already crossing in front of V1. As V2 nears the yield markings, the driver and pedestrian are able to see each other, initiating the Pedestrian-Driver Interaction segment.
In the Pedestrian-Driver Interaction segment, the pedestrian and drivers try to understand what the other will do based on different factors. For pedestrians, they will try to get a better view of the obscured lane and/or listen for an approaching vehicle. Before crossing, they must make sure that drivers have sufficient time to notice them and begin slowing down (3). Upon receiving acknowledgement from drivers and judging that the gap is sufficient, pedestrians may enter the crosswalk. For drivers, they must slow down enough to prepare for a situation where a pedestrian might step out from in front of the vehicle in the right lane ahead. As V2 gets closer to the crosswalk, it becomes easier for the driver to see past the obscuring vehicle (V1) and identify whether or not there is a pedestrian trying to cross. In the multiple-threat scenario, the V2 driver would assume that V1, stopped on the right, is stopped because he or she is yielding to a pedestrian.
Design Considerations
Decisions made by the pedestrian and drivers for this task analysis only show an example of a best-case scenario. Some cases/countermeasures for non-ideal situations are as follows:
- The driver of V1 sees the pedestrian but chooses a response reflecting a lack of concern and maintains the same speed, in effect signaling to the pedestrian that they do not intend to yield. At the same time, a pedestrian is aggressive or inattentive and begins to cross without regard to the driverʼs behavior. Eventually, the driver must brake to avoid a crash, but because the response is delayed, more aggressive braking is required (1).
- The driver of V1 becomes aware of the pedestrian late but does not have enough time to stop (2). The scenario described in the task analysis is designed with advance yield markings, a countermeasure used to improve driver behavior and limit situations where drivers donʼt have enough time to stop (4).
- As described in the task analysis, a pedestrian is crossing from the right, as seen from the driverʼs perspective. There is evidence for a difference in driver behavior between a multiple-threat with the obstructing V1 being in the left lane as opposed to the right. A study conducted in 2014 found statistical significance in more glances to the left in the presence of advance yield markings (5).
- Crossings with no raised median island or advance yield/stop line and sign often fail to create adequate awareness of the crossing for drivers and even for pedestrians. Without the raised median island, the pedestrian must judge acceptable gaps in traffic from both directions and is unprotected mid-crossing. Without the yield line, drivers have limited time to see and react to emerging pedestrians, relying only on crosswalk markings and/or curb ramps as visual cues. A pedestrian sign could be added to the roadside or the median to increase driver understanding.
The task analysis is tailored for a specific setting: a four-lane road with a midblock crosswalk accompanied by yield lines, a pedestrian-crossing sign, and a raised median island. Only one-half of the road was analyzed because the raised median island allows the pedestrian to cross in two separate operations.
Cross References
Countermeasures to Reduce Pedestrian Exposure to Vehicles at Crossings
Increasing Pedestrian Visibility and Conspicuity at Crosswalks
Selecting Beacons to Increase Pedestrian Conspicuity at Crosswalks
Key References
1. Bella, F., and Silvestri, M. (2015). Effects of safety measures on driverʼs speed behavior at pedestrian crossings. Accident Analysis & Prevention, 83, pp. 111–124.
2. Fisher, D., and Garay-Vega, L. (2012). Advance yield markings and driversʼ performance in response to multiple-threat scenarios at mid-block crosswalks. Accident Analysis & Prevention, 44(1), pp. 35–41.
3. Levi, S., De Leonardis, D. M., Antin, J., and Angel, L. (2013). Identifying countermeasure strategies to increase safety of older pedestrians (Report No. DOT HS 811 798). Washington, DC: NHTSA.
4. Hochmuth, J., and Houten, R. V. (2018). Influence of advanced placement of the in-street sign gateway on distance of yielding from the crosswalk. Transportation Research Record: Journal of the Transportation Research Board, 2672, 13–20.
5. Gómez, R. A., Samuel, S., Romoser, M. R. E., Knodler, M. A., Collura, J., and Fisher, D. L. (2014). Mitigation of pedestrian–vehicle conflicts at stop-controlled t-intersections. Transportation Research Record: Journal of the Transportation Research Board, 2464, 20–28.
COUNTERMEASURES TO REDUCE PEDESTRIAN EXPOSURE TO VEHICLES AT CROSSINGS
Introduction
Countermeasures to reduce pedestrian exposure to vehicles at crossings refers to road treatments for consideration that provide some level of physical protection from surrounding traffic and/or reduce the time required to cross the street. Grade-separated pedestrian crossings offer additional protection by removing pedestrians from vehicular traffic altogether in locations where pedestrian crossing would be too challenging without them. This guideline summarizes the conditions of use and the effects that can be expected when using these countermeasures.
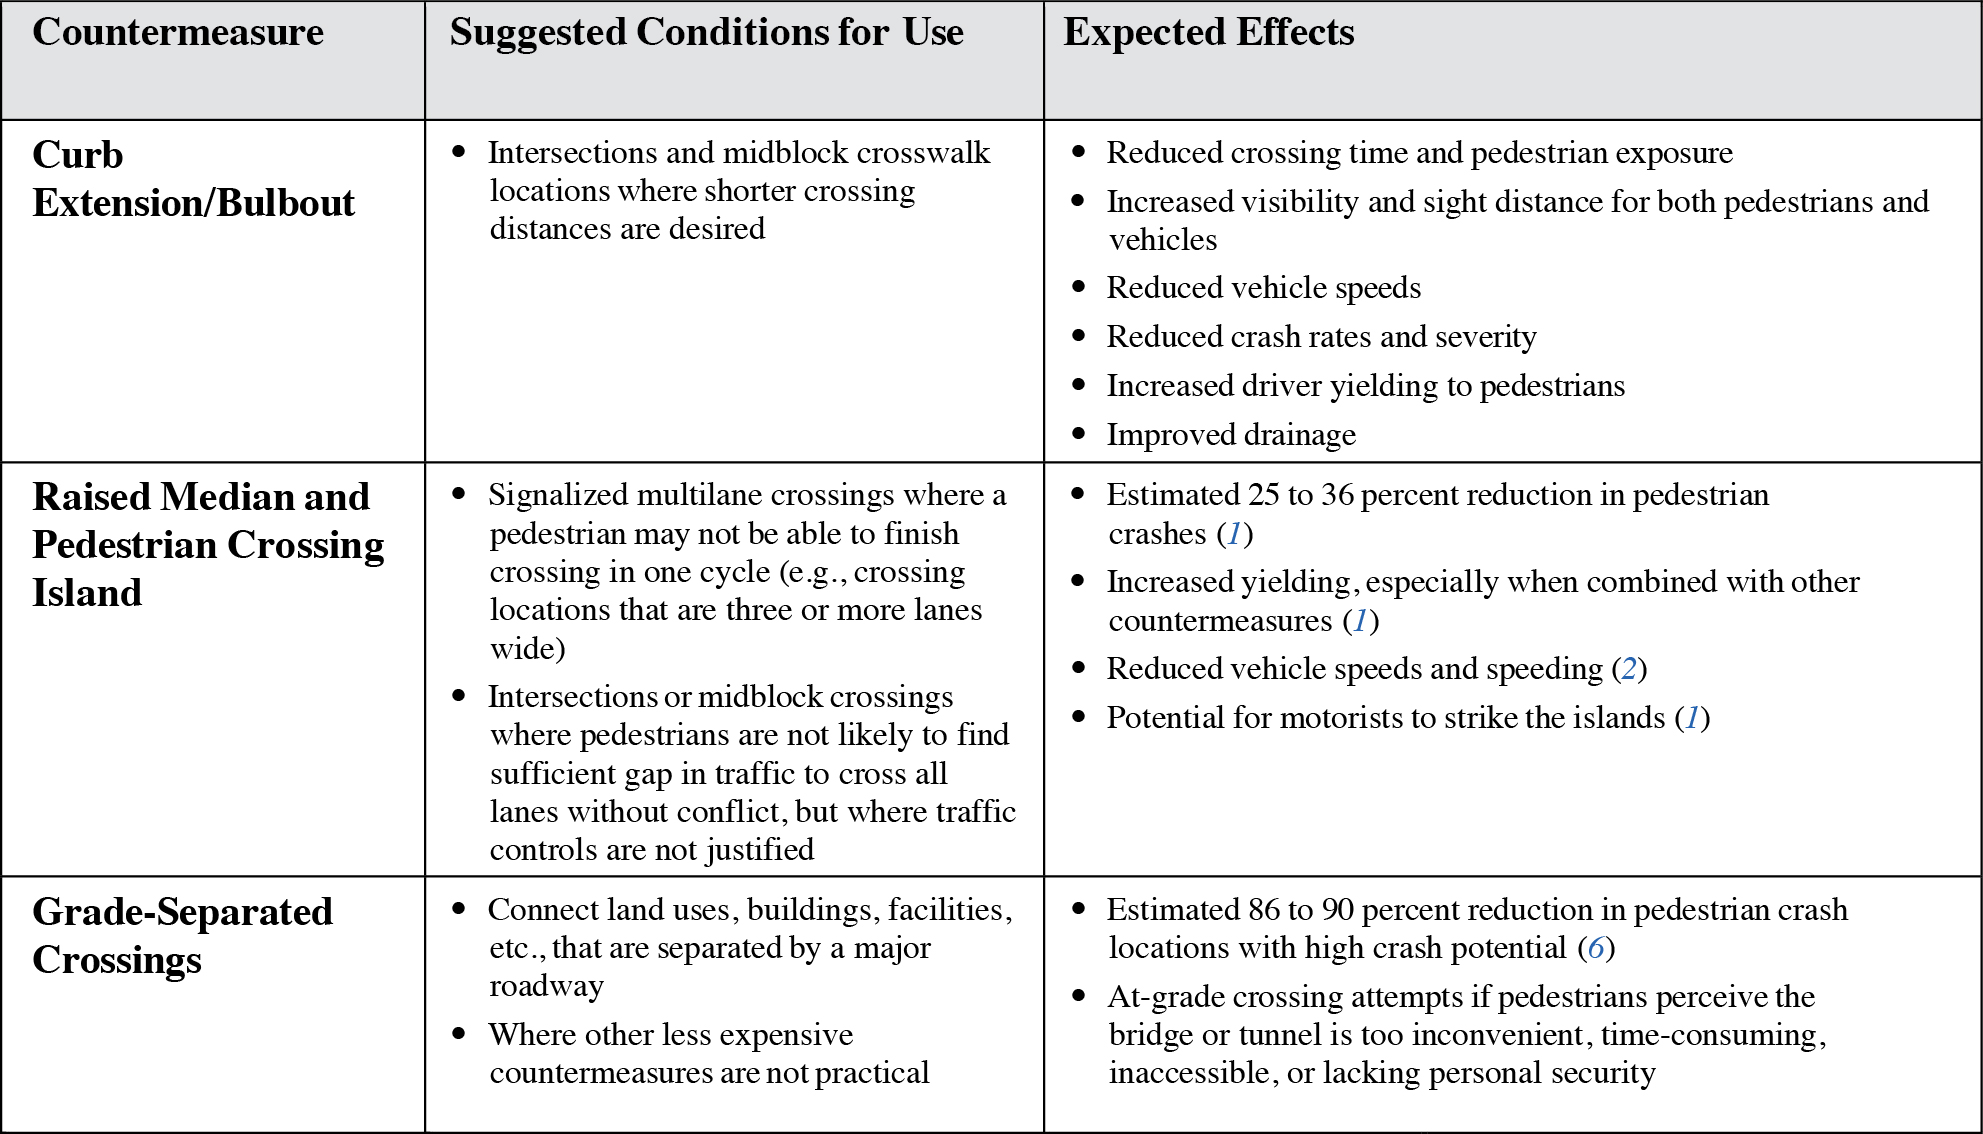

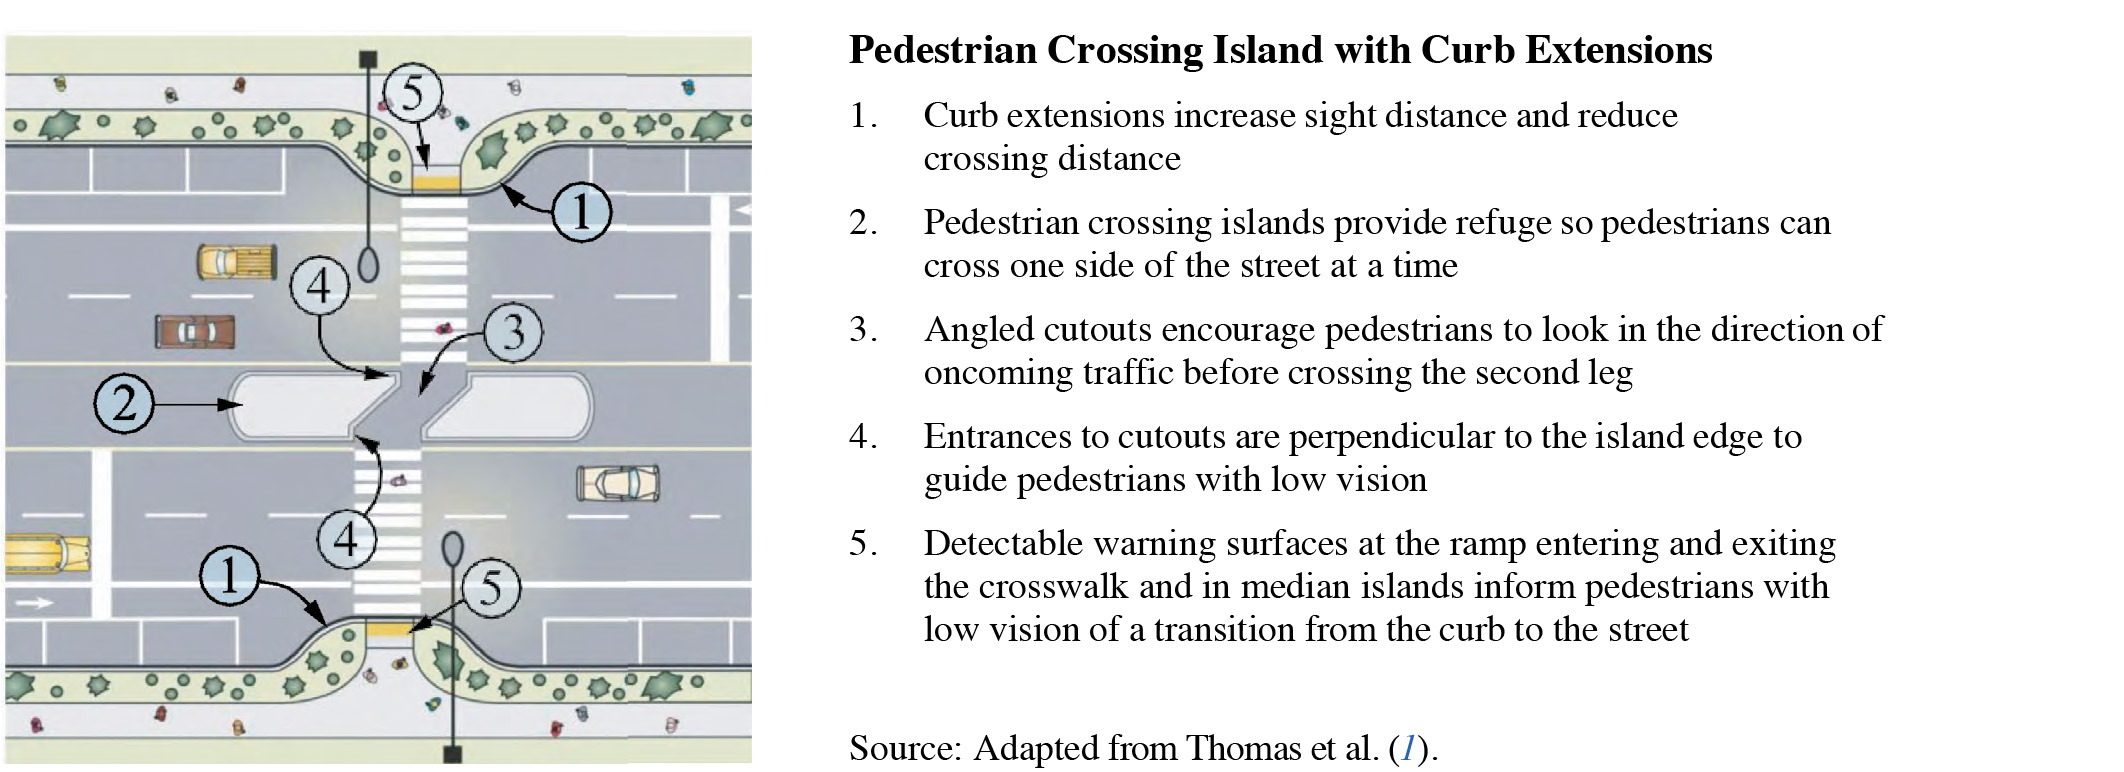
Long Description.
The extensions, crossing islands, angled cutouts, and warning surfaces are numbered 1 through 5 on the illustration.
Discussion
Curb extensions. Curb extensions narrow the road by extending the sidewalk or curb line into the street or parking lane, thus reducing pedestrian crossing time and exposure (1). In addition, this treatment can increase sight distance between pedestrians and vehicles by raising pedestrians above grade level and by preventing motorists from parking too close to the intersection. Further, they can reduce the effective turning radius, which can slow turning traffic. One simulator study found that driversʼ yielding behavior increased due to increased pedestrian visibility at the curb extension (3). Similarly, a literature review cited studies that found that curb extensions increased yielding and speed reductions (2). Curb extensions can be used where there is on-street parking and on streets that are not too narrow (1, 4, 5). Curb extensions should generally be one to two feet narrower than the parking lane (4). Curb extensions should not interfere with bicycle lanes (1), and landscaping or road furniture should not interfere with sight distance or impede visibility by other road users (5).
Raised medians and pedestrian median islands. Sometimes referred to as pedestrian refuge islands, safety islands, crossing islands, or center islands, these treatments provide pedestrians with a protective environment in the middle of an intersection or midblock crosswalk, reducing pedestrian exposure to traffic and allowing them to focus on crossing one direction of travel at a time. Pedestrian crash reductions of 25 to 36 percent have been estimated using raised medians and pedestrian median islands at various locations and configurations (1). Pedestrian median islands are recommended at crossing locations that are three or more lanes wide (4). It is recommended that the island be at least 6 feet wide to accommodate the length of a bicycle, or a parent pushing a stroller, and the cut-through or ramp width be equal to the crosswalk width. Crosswalk islands that cut through the median are preferred to raised median crosswalks, unless the median is wider than 17 feet; in that case, raised medians are preferred (4). Crossing a street in two signal cycles should be discouraged if at an intersection or a midblock, and the crosswalks line up. Crossing in two cycles works best with offset or staggered crosswalks and relatively wide medians (e.g., >20 feet) to accommodate waiting pedestrians.
Grade-separated crossings. These treatments, which include overpasses, overcrossings, or bridges, and underpasses, undercrossings, or tunnels, completely separate pedestrians from vehicular traffic and can be effective when used where grade-level crossings are dangerous and other countermeasures are inappropriate. Crash modification factors of between 0.1 and 0.14 (86 to 90 percent pedestrian crash reduction) have been estimated for these treatments (6). Pedestrians may still elect to cross the street at grade rather than use the bridge/tunnel if access is perceived to be too inconvenient, time-consuming, inaccessible, or is “not perceived to be safer . . . than crossing at street level” (1). In particular, access can be a challenge for pedestrians with disabilities unless the bridge or tunnel is designed to accommodate them. Lighting, signing, fencing, and other countermeasures have been used to discourage at-grade crossings at these locations (1).
Design Considerations
Although raised medians and pedestrian median islands provide some level of protection for pedestrians, yielding rates have been mixed at locations with pedestrian median islands and marked crosswalks (1). Additional countermeasures may be needed to encourage motorists to yield to pedestrians, especially on roads with high speed, high traffic volumes, many lanes, and/or wide widths. Recommendations for additional treatments include pedestrian hybrid beacons (PHB) with a red (stop) indication, advance yield/stop lines with advance “yield/stop here for pedestrian” signs, and signs with flashing beacons, such as rectangular rapid flashing beacons (RRFBs) (1). When placing pedestrian median islands within a two-way left turn lane (TWLTL), designers should consider driveway locations and turnings to reduce the potential for left-turning vehicles entering the roadway to strike the island. A recent FHWA study (6) provides a number of recently studied countermeasures to help increase pedestrian safety.
Cross References
Methods to Increase Driver Yielding at Uncontrolled Crosswalks
Key References
1. Thomas, L., Thirsk, N. J., and Zegeer, C. V. (2016). NCHRP Synthesis 498: Application of Pedestrian Crossing Treatments for Streets and Highways. Transportation Research Board of the National Academies, Washington, DC.
2. Mead, J., Zegeer, C., and Bushell, M. (2013). Evaluation of Pedestrian-Related Roadway Measures: A Summary of Available Research. Chapel Hill, NC: Pedestrian and Bicycle Information Center.
3. Bella, F., and Silvestri, M. (2015). Effects of safety measures on driverʼs speed behavior at pedestrian crossings. Accident Analysis & Prevention, 83, 111–124.
4. National Association of City Transportation Officials. (2013). Urban Street Design Guide. New York, NY: NACTO.
5. Zegeer et al. (2004). NCHRP Report 500: Guidance for Implementation of the AASHTO Strategic Highway Safety Plan, Volume 10: A Guide for Reducing Collisions Involving Pedestrians. Transportation Research Board of the National Academies, Washington, DC.
6. FHWA. (2018). Toolbox of pedestrian countermeasures and their potential effectiveness. Washington, DC: FHWA.
SPEED-CALMING COUNTERMEASURES AT CROSSWALKS
Introduction
Speed-calming countermeasures at crosswalks refer to countermeasures for consideration that encourage drivers to slow their speeds in areas with crosswalks. Excessive vehicle speed makes it more difficult for drivers to perceive, react, and stop for pedestrians. A driverʼs useful field of vision decreases as travel speed increases, making it more difficult to detect and react to pedestrians in peripheral vision at higher speeds (1, 2). In addition, braking distance increases with speed, requiring more time to stop the vehicle. The combination of less/later pedestrian detection and longer braking times means more crashes with increased severity at higher speeds (1). This guideline provides information about common countermeasures for reducing speeds when approaching crosswalks.


The following table from National Association of City Transportation Officials (2) illustrates how pedestrian crash and fatality potential increase substantially with speed. Speed-calming measures can reduce crash potential by encouraging vehicle speeds that are consistent with the intended design.
EFFECTS OF SPEED ON STOPPING DISTANCE, CRASH POTENTIAL, AND FATALITY POTENTIAL

* Stopping distance includes perception, reaction, and braking times.
Source: National Association of City Transportation Officials (2).
Long Description.
The table has four column headings. Column 1: Speed in miles per hour. Column 2: Stopping Distance in feet. Note that stopping distance includes perception, reaction, and braking times. Column 3: Crash Potential in percent. Column 4: Fatality Potential in percent. The data for each row are as follows: Row 1: 10 to 15; 25; 5; 2. Row 2: 20 to 25; 40; 15; 5. Row 3: 30 to 35; 75; 55; 45. Row 4: 40+; 118; 90; 85.
Discussion
Raised Crosswalk/Speed Table/Raised Intersection. These treatments elevate the crosswalk to the level of the sidewalk and are used to reduce vehicle speeds as they approach the crosswalks (4). Furthermore, they increase visibility of pedestrians and increase driver yielding (1). Typically, these treatments are used at midblock locations and intersections on low-speed local streets, collector roads, and specialty use locations, such as airport drop-off/pick-up zones, and access points to parks, waterfronts, campuses, and shopping centers (1, 4).
Reduce Corner Radius/Crossing Distance. The corner radius at intersections can affect vehicle turning speed. Slower speeds are required to maneuver a turn with a smaller radius. Where possible, a curb radius of 5 to 10 ft. is recommended for urban streets (4). An effective turning radius (i.e., path of a turning vehicle) of 15 to 20 ft. is recommended on urban streets with high pedestrian traffic, and an effective curb radius of 25 to 30 feet may be needed for arterials with buses and trucks (4). One source, however, recommends using stop bar setbacks and parking restrictions rather than large curb radii to facilitate large vehicle turns (2). Zegeer (1) recommends that corner radii should rarely exceed 15 feet. Although a small curb radius can reduce traffic speed, drivers might drive over the curb if the radius is too small in areas with high traffic volume. In addition to speed calming, a smaller curb radius reduces pedestrian crash potential by expanding the pedestrian area in the corner and providing improved pedestrian ramp alignment, shorter pedestrian crossing distances, and better sight distance for both motorists and pedestrians (5).
Road Diet. A road diet entails redesigning a roadway to reduce the number of vehicle lanes in a street. Road diets often allow improved bicycle and pedestrian facilities, such as pedestrian buffer zones, curb extensions for crosswalks, and pedestrian median islands. Road diets have been demonstrated to reduce 85th percentile and average speed by 3 to 7 mi/h, with greater speed reductions occurring in high-traffic areas (6). Furthermore, road diets have been shown to reduce speed variability (6), increase speed limit compliance, and eliminate the multiple-threat scenario at crosswalks (7). Crash modification factors for road diets have been estimated at 0.81 for urban areas and 0.53 in rural areas (8).
Area-Wide Traffic Calming. Area-wide traffic calming uses a comprehensive approach to reducing traffic speed, density, or both using a variety of countermeasures (4). Overall, reduction of area speeds encourages lower speeds at intersection approaches and at midblock crosswalks, encourages more walking, and is associated with less pedestrian injury (7). Area-wide traffic calming measures designed to reduce speeds in urban areas include raised medians, narrow driveways, pinch points, chicanes, lane shifts, lane narrowing, speed humps, 2-way streets, traffic circles, signal timing, traffic diverters, and on-street parking (1, 4). When designing speed limits for urban streets, NACTO recommends using target speed rather than operating speed and applying measures to reduce vehicle operating speeds (2).
Design Considerations
When designing curb radius for speed calming, the effective curb radius must be large enough to accommodate emergency vehicles (1). Speed tables and speed humps can be constructed with gaps wide enough for emergency vehiclesʼ wheels to pass through (4); however, on streets with bicycle lanes, such ‘wheel gaps’ could result in motorists swerving into the bicycle lane to avoid the gap (5). It is recommended that the hump go through the bicycle lane, and only leave a gap at the curb for drainage.
Cross References
Countermeasures to Reduce Pedestrian Exposure to Vehicles at Crossings
Speed Perception, Speed Choice, and Speed Control, Chapter 14
Key References
1. Zegeer, C. (2010, August 17). Treatments at unsignalized pedestrian crossings. [Webinar]. In PBIC Designing for Pedestrians Safety Webinar Series: Pedestrian and Bicycle Information Center.
2. National Association of City Transportation Officials. (2013). Urban Street Design Guide. New York, NY: NACTO.
3. AASHTO. (2004). Guide for the Planning, Design, and Operation of Pedestrian Facilities. Washington, DC: AASHTO.
4. Thomas, L., Thirsk, N. J., and Zegeer, C. V. (2016). NCHRP Synthesis 498: Application of Pedestrian Crossing Treatments for Streets and Highways. Transportation Research Board of the National Academies, Washington, DC.
5. Zegeer, C. V., Stutts, J., Huang, H., Cynecki, M. J., Van Houten, R., Alberson, B., Pfefer, R., Neuman, T. R., Slack, K. L., and Hardy, K. K. (2004). NCHRP Report 500: Guidance for Implementation of the AASHTO Strategic Highway Safety Plan, Volume 10: A Guide for Reducing Collisions Involving Pedestrians. Transportation Research Board of the National Academies, Washington, DC.
6. Knapp, K., Chandler, B., Atkinson, J., Welch, T., Rigdon, H., Retting, R., Meekins, S., Widstrand, E., and Porter, R. J. (2014). Road Diet Informational Guide. (FHWA-SA-14-028). Washington, DC: FHWA.
7. Mead, J., Zegeer, C., and Bushell, M. (2013). Evaluation of Pedestrian-Related Roadway Measures: A Summary of Available Research. Chapel Hill, NC: Pedestrian and Bicycle Information Center.
8. FHWA. (2018). Toolbox of Pedestrian Countermeasures and Their Potential Effectiveness. Washington, DC: FHWA.
INCREASING PEDESTRIAN VISIBILITY AND CONSPICUITY AT CROSSWALKS
Introduction
Increasing pedestrian visibility and conspicuity at crosswalks refers to countermeasures that increase driver awareness of the crosswalk, draw attention to pedestrians, and make pedestrians easier to detect. Other countermeasures that also increase pedestrian visibility and conspicuity by raising them above road grade level and/or improving sight lines are curb extensions and raised medians. These countermeasures are discussed in “Countermeasures to Reduce Pedestrian Exposure to Vehicles at Crossings” on page 24-4. Lighting countermeasures for increasing pedestrian visibility are found in “Characteristics of Lighting that Enhance Pedestrian Visibility,” on page 20-10.

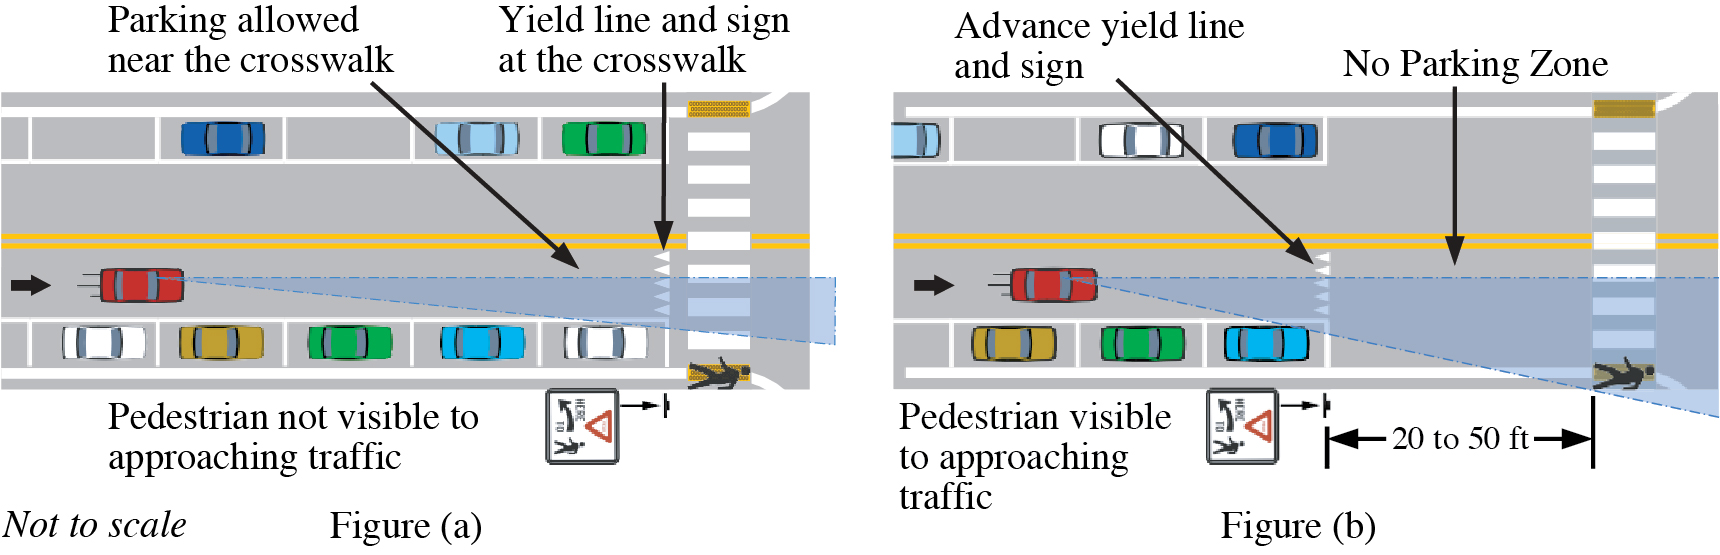
In Figure (a) below, the pedestrian is not visible to the driver of the approaching vehicle because the leading parked vehicle is blocking the line of sight to the pedestrian. In Figure (b), parking has been set back from the crosswalk, which widens the sight triangle for increased visibility to the pedestrian. Also, the advance yield line in Figure (b) provides additional time and stopping distance for the driver to perceive and react to the pedestrian by requiring earlier yielding.
Long Description.
The two illustrations, labeled figure a and figure b, show a sign next to the road with a yield symbol, a pedestrian symbol, and the words “here to” next to a curved arrow. Figure a shows an illustration of a road where parking is allowed near the crosswalk. The yield line and sign are at the crosswalk. A sight triangle extending from the vehicle shows that a pedestrian at the crosswalk is not visible to the approaching traffic. Figure b shows an illustration of a road that has a no parking zone 20 to 50 feet from the crosswalk. The road has an advance yield line and sign. A sight triangle extending from the vehicle shows that a pedestrian at the crosswalk is visible to the approaching traffic.
Discussion
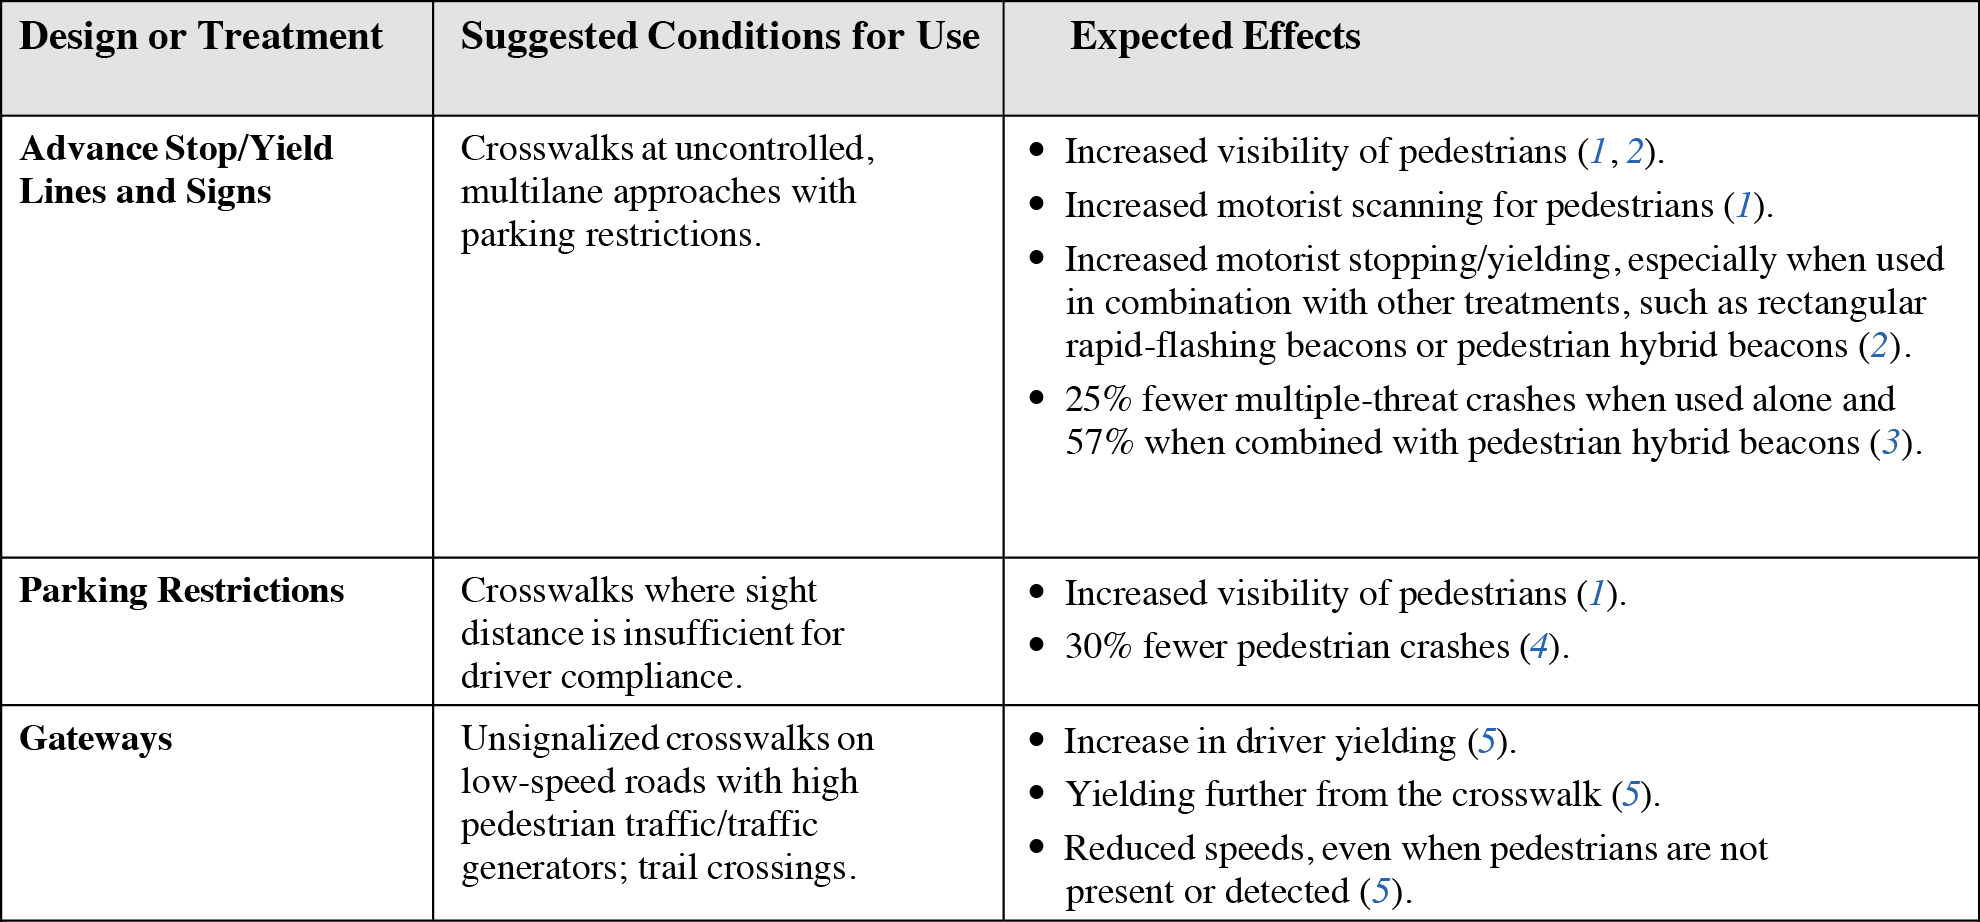
Advance stop/yield lines and signs. Advance stop and yield lines increase the distance ahead of a crosswalk at which drivers are required to stop or yield to allow pedestrians to cross. Requiring vehicles to stop or yield further from the crosswalk increases the stopping sight distance to the pedestrian, which can reduce crash potential in multi-threat situations, where visibility of the pedestrian is occluded by a vehicle in the adjacent lane (e.g., see 1, 2, 6). “Yield Here to Pedestrians” signs combined with advance yield lines have been demonstrated to improve motorist yielding distance, increase pedestrian crosswalk use, and reduce conflicts (7, 8). For uncontrolled multilane approach crosswalks, advance stop/yield lines may be set back from the crosswalk 20 to 50 feet to ensure that a clear sight triangle exists between drivers and pedestrians (6). Also, parking may be prohibited between the stop/yield line and the crosswalk to prevent parked vehicles from obscuring visibility (6, 9). In a field study of advance yield lines, adding one empty parking space between an occluding vehicle parked at the yield line and the crosswalk increased yielding from 8 percent to 27 percent (1). For uncontrolled multilane approach crosswalks, the MUTCD requires that R1-5 series signs (“Stop Here for Pedestrians” or “Yield Here to Pedestrians”) be used in conjunction with stop and yield lines, respectively (6).
Parking Restrictions. Parking restrictions that prohibit vehicles from parking near the intersection can reduce pedestrian crashes by increasing sight distance. The further from the crosswalk that parking is prohibited, the wider the sight triangle becomes, allowing both driver and pedestrian to see each other and react sooner. The minimum recommended setback is 20 feet when speeds are 25 mi/h or less, and 30 feet for speeds between 26 and 35 mi/h. Blackburn, Zegeer, and Brookshire (10) recommend considering using parking restrictions on both crosswalk approaches at all established pedestrian crossings to ensure adequate sight distance for both pedestrians and motorists. Curb extensions can enhance the effect of parking restrictions by offering a larger area for pedestrians to congregate and be seen by drivers.
Gateways. A gateway configuration consists of R1-6 street signs (6) installed in the street on the centerline or pedestrian median island, edges, and lane markers at an intersection or midblock crosswalk. These signs are highly conspicuous because they are placed near driversʼ central vision, regardless of which lane motorists are traveling in. Consequently, the signs increase driver awareness of the crosswalk and remind drivers to watch for and yield to pedestrians. In one study, driver yielding increased from 15 percent before installation of the gateways to 70 percent after treatment, and the effects were consistent long term (5).
Design Considerations
Although improvements in driver yielding rates and distances can be achieved using advance stop/yield lines and “Stop Here for Pedestrians” or “Yield Here to Pedestrians” signs, the effectiveness of these countermeasures may be enhanced by combining them with additional countermeasures. For example, one study (8) found that median refuge islands, refuge islands with Danish offsets (a type of crosswalk design that incorporates an S-shaped median that orients the pedestrianʼs line of sight toward oncoming traffic), high-visibility crosswalk markings, and advance yield lines increased driver yielding and pedestrian use of the crosswalk, and additional crash reduction benefits were found when countermeasures were combined.
Cross References
Determining Stopping Sight Distance
Methods to Increase Driver Yielding at Uncontrolled Crosswalks
Task Analysis of Pedestrian Crossing in a Multiple-Threat Scenario
Key References
1. Samuel, S., Romoser, M. R. E., Gerardino, L. R., Hamid, M., Gómez, R. A., Knodler, M. A., . . . Fisher, D. L. (2013). Effect of advance yield markings and symbolic signs on vehicle–pedestrian conflicts: Field evaluation. Transportation Research Record: Journal of the Transportation Research Board, 2393, 139–146. Retrieved from http://dx.doi.org/10.3141/2393-16.
2. Thomas, L., Thirsk, N. J., and Zegeer, C. V. (2016). NCHRP Synthesis 498: Application of Pedestrian Crossing Treatments for Streets and Highways. Transportation Research Board of the National Academies, Washington, DC.
3. Zegeer, C., Srinivasan, R., Lan, B., Carter, D., Smith, S., Sundstrom, C., Thirsk, N. J. Lyon, C., Persaud, B., Zegeer, J., Ferguson, E., and Van Houten, R. (2017). NCHRP Research Report 841: Development of Crash Modification Factors for Uncontrolled Pedestrian Crossing Treatments. Transportation Research Board, Washington, DC.
4. FHWA. (2018). Toolbox of Pedestrian Countermeasures and Their Potential Effectiveness. Washington, DC: FHWA.
5. Van Houten, R., Hochmuth, J., Western Michigan University, and Michigan Department of Transportation. (2016). Comparison of Alternative Pedestrian Crossing Treatments: Follow-Up Report.
6. FHWA. (2023). Manual on Uniform Traffic Control Devices for Streets and Highways (11th ed.). Washington, DC.
7. Huybers, S., Van Houten, R., and Malenfant, J. E. L. (2004). Reducing conflicts between motor vehicles and pedestrians: the separate and combined effects of pavement markings and a sign prompt. Journal of Applied Behavior Analysis, 37(4), 445–456. Retrieved from https://trid.trb.org/view/750238
8. Nambisan, S. S., Vasudevan, V., Dangeti, M., and Virupaksha, V. (2008). Advanced Yield Markings and Pedestrian Safety: Analyses of Use with Danish Offsets and Median Refuge Islands. In Transportation Research Board 87th Annual Conference Proceedings. Washington, DC: Transportation Research Board. Retrieved from https://trid.trb.org/view/848875.
9. National Association of City Transportation Officials. (2013). Urban Street Design Guide. New York, NY: NACTO.
10. Blackburn, L., Zegeer, C., and Brookshire, K. (2018). Guide for Improving Pedestrian Safety at Uncontrolled Crossing Locations. Washington, DC: FHWA.
SELECTING BEACONS TO INCREASE PEDESTRIAN CONSPICUITY AT CROSSWALKS
Introduction
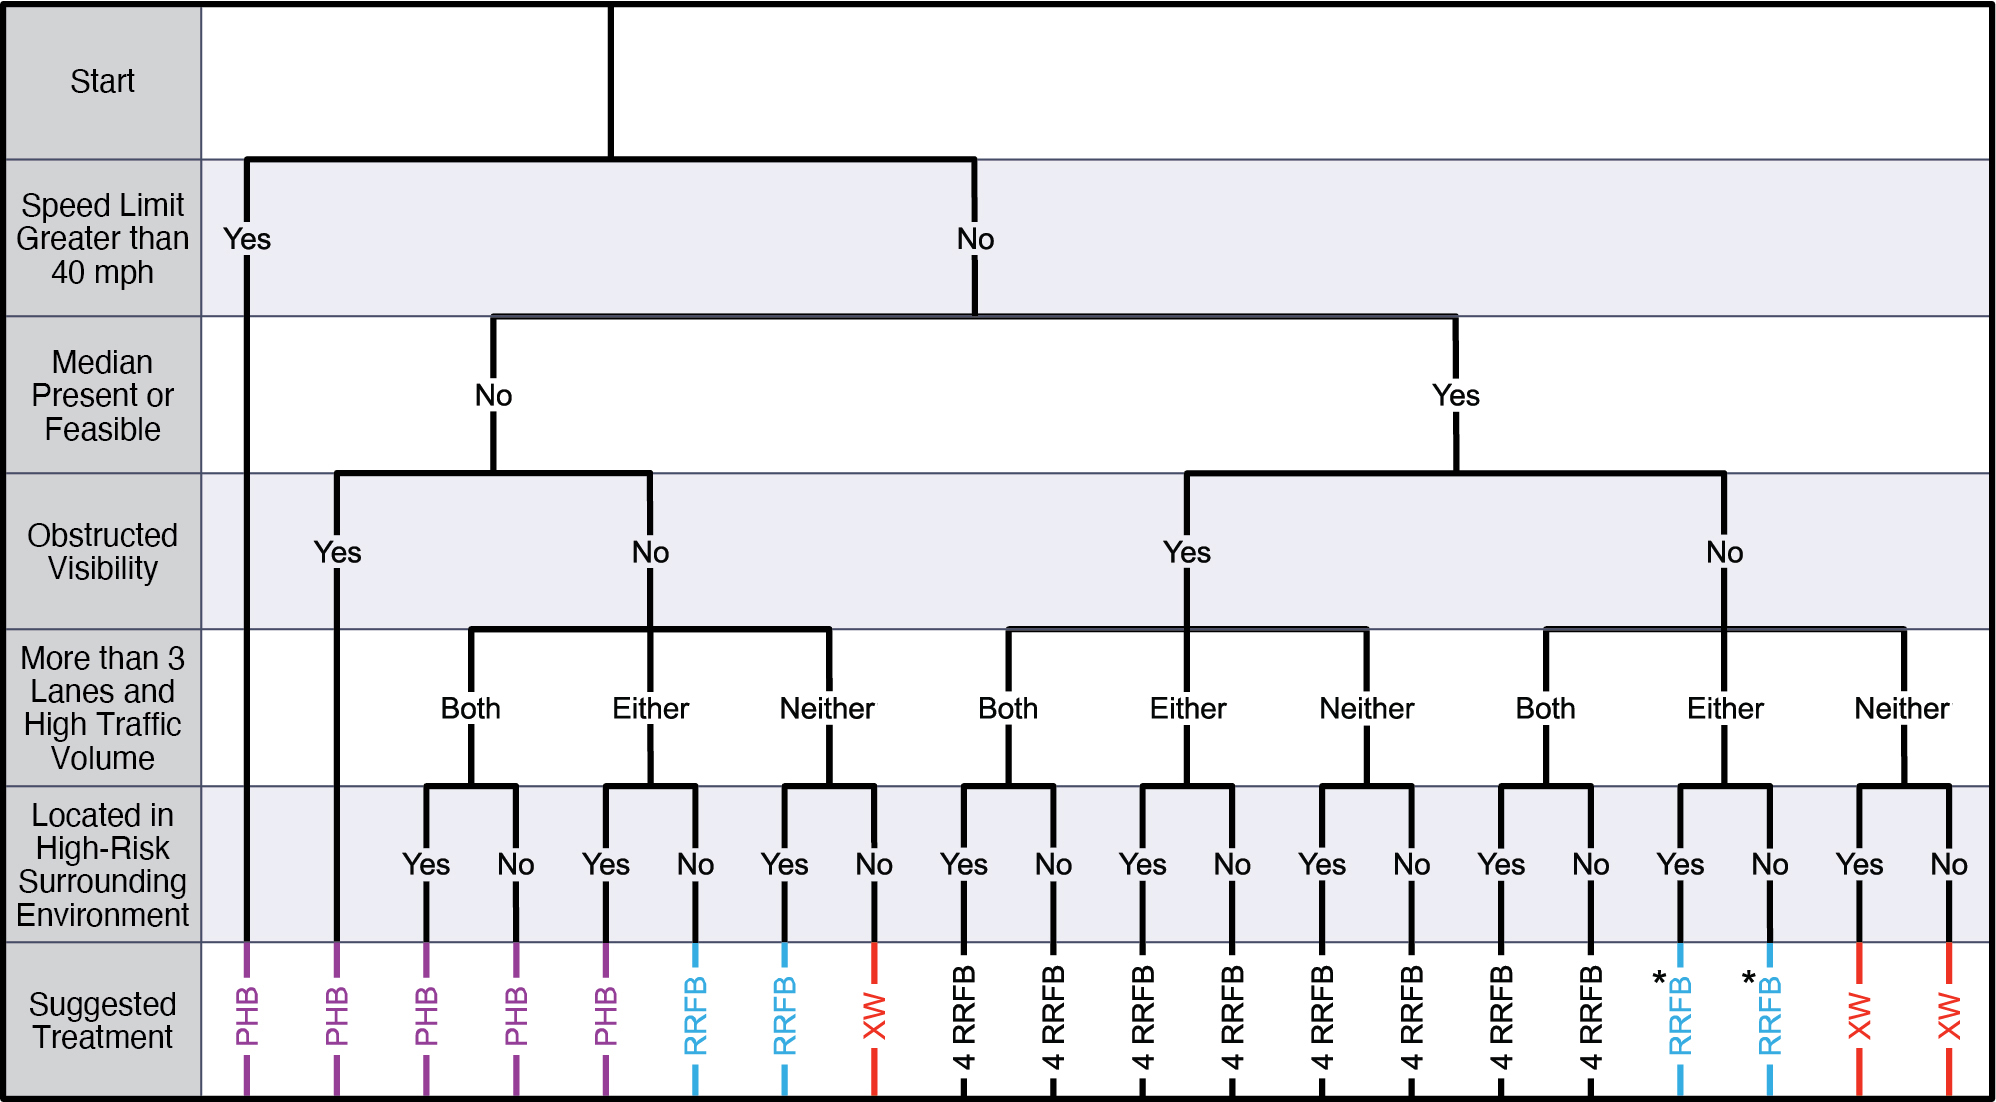
Selecting beacons to increase pedestrian conspicuity at crosswalks refers to a heuristic for determining whether to use a pedestrian hybrid beacon (PHB) or a rectangular rapid-flashing beacon (RRFB) at an uncontrolled, marked crosswalk. These pedestrian-activated treatments are used to alert drivers to the presence of pedestrians in the crosswalk. As such, PHBs could be considered for every road with a speed limit greater than 40 mi/h. It may be unclear to most safety professionals which treatment offers the best solution in terms of the cost-benefits for a particular location. This guideline provides information for assisting in the choice between using PHBs or RRFBs at locations where engineering studies, traffic warrants, and engineering judgment do not support the installation of full signalization.


Discussion
PHBs and RRFBs have been shown to reduce pedestrian crash potential at crosswalks by alerting drivers to the presence of pedestrians in crosswalks. These treatments are inactive (dark) until activated by the pedestrian via pushbutton or by automated pedestrian-detection technology (passive activation). The MUTCD provides warrants and requirements for the use of PHBs, but RRFBs are not yet formally codified in the MUTCD because they are a newer device. At this time, the FHWA has granted interim approval to implement RRFBs in crosswalk designs because they have been shown to be highly effective at improving driver yielding to pedestrians at crosswalks (3).
Whether to install PHBs or RRFBs at some locations may not be obvious because a variety of factors can influence the suitability of the lower-cost RRFBs for different situations (2). Among these factors are traffic volume, number of lanes, speed limit, presence of a median, presence of advance yield or stop signs, high visual clutter, schools, crossing distance, crossing approach, and one- or two-way direction of travel (2, 4).
PHBs are less expensive than traditional midblock signalization with green-yellow-red indication, but they provide similar information and requirements for drivers to stop during the walk interval (solid red). They also minimize delays to vehicular traffic by allowing drivers to continue during the pedestrian clearance interval (flashing red) if the pedestrian is no longer in the driverʼs lane (5). PHBs have been found to consistently produce high yielding rates of 90 percent or greater and fewer pedestrian conflicts (6). Expected crash reductions of 55 percent are associated with PHBs alone and 57 percent when implemented at a location with advance yield and stop markings and signs (7).
When used in appropriate locations, RRFBs have been shown to compare favorably with PHBs and exceed other types of beacons in terms of effectiveness. In one study (8), the installation of RRFBs increased yielding to 88%, and yielding distance also increased compared to yield signs alone. RRFBs were also significantly more effective than both overhead and sign-mounted circular beacons. In another study, average yielding compliance was also 88% (9). By comparison, standard overhead beacons resulted in 15% yielding, and no signal resulted in 10.9% yielding (9).
An evaluation of RRFBs conducted for the Oregon DOT recommends that “RRFBs be installed on medians when side-mounted devices are considered and at locations with posted speeds of 40 mi/h or less unless additional features such as striping, signing, and advance warning RRFBs are used” (2). In addition, they recommend using overhead PHBs in areas that require high compliance and where a side-mounted device is not possible.
Design Considerations
One concern regarding PHBs is that drivers might not fully understand the meaning of the flashing red signal. Surveys of drivers (2, 5) and empirical observations (10) at midblock crosswalks found that most drivers understood the dark and steady red indications, moderately understood the flashing and steady yellow indications, but poorly understood the flashing red indication. The MUTCD (1) provides specific guidance for the use of PHBs and RRFBs. FHWA (3) provides specific requirements and characteristics for implementing RRFBs. To prevent displays from being misunderstood by users, designers should act as “virtual users” before implementation.
Cross References
Countermeasures for Increasing Pedestrian Conspicuity at Crosswalks
Methods to Increase Driver Yielding at Uncontrolled Crosswalks
Methods to Increase Driver Compliance at Uncontrolled Crosswalks
Key References
1. FHWA. (2023). Manual on Uniform Traffic Control Devices for Streets and Highways (11th ed.). Washington, DC.
2. Hunter-Zaworski, K., and Mueller, J. (2012). Evaluation of Alternative Pedestrian Control Devices. Final Report.
3. FHWA. (2018). Interim Approval for the Optional Use of Pedestrian-Actuated Rectangular Rapid-Flashing Beacons at Uncontrolled Marked Crosswalks (IA-21).
4. Fitzpatrick, K., Brewer, M. A., Avelar, R., and Lindheimer, T. (2017). Will you stop for me? An exploration of characteristics associated with a driverʼs decision to stop for a pedestrian in a crosswalk with a rectangular rapid-flashing beacon. ITE Journal, 87(3), pp. 36–41.
5. Godavarthy, R. P., and Russell, E. R. (2016). Study of pedestrian hybrid beaconʼs effectiveness for motorists at midblock pedestrian crossings. Journal of Traffic and Transportation Engineering (English Edition), 3(6), pp. 531–539.
6. Thomas, L., Thirsk, N. J., and Zegeer, C. V. (2016). NCHRP Synthesis 498: Application of Pedestrian Crossing Treatments for Streets and Highways. Transportation Research Board of the National Academies, Washington, DC.
7. Zegeer, C., Srinivasan, R., Lan, B., Carter, D., Smith, S., Sundstrom, C., Thirsk, N. J. Lyon, C., Persaud, B., Zegeer, J., Ferguson, E., and Van Houten, R. (2017). NCHRP Research Report 841: Development of Crash Modification Factors for Uncontrolled Pedestrian Crossing Treatments. Transportation Research Board, Washington, DC.
8. Shurbutt, J., and Van Houten, R. (2010). Effects of Yellow Rectangular Rapid-Flashing Beacons on Yielding at Multilane Uncontrolled Crosswalks. (FHWA-HRT-10-043). McLean: VA: FHWA.
9. Van Houten, R., and Malenfant, L. (2008). An Analysis of Rectangular-shaped Rapid-Flashing LED Beacons to Increase Yielding to Pedestrians Using Crosswalks on Multilane Roadways in the City of St. Petersburg, FL.
10. Anderson, I. (2019). Assessment of the HAWK Crosswalk Traffic Signal. Montpelier: Vermont Agency of Transportation.
INFLUENCE OF THE BUILT ENVIRONMENT ON PEDESTRIAN CROSSING SAFETY
Introduction
Influence of the built environment on pedestrian crossing safety refers to factors within the built environment that contribute to the potential for a pedestrian–vehicle crash. This guideline highlights factors in the surrounding environment that have the largest influence on crash potential and provides countermeasures for consideration.

Discussion
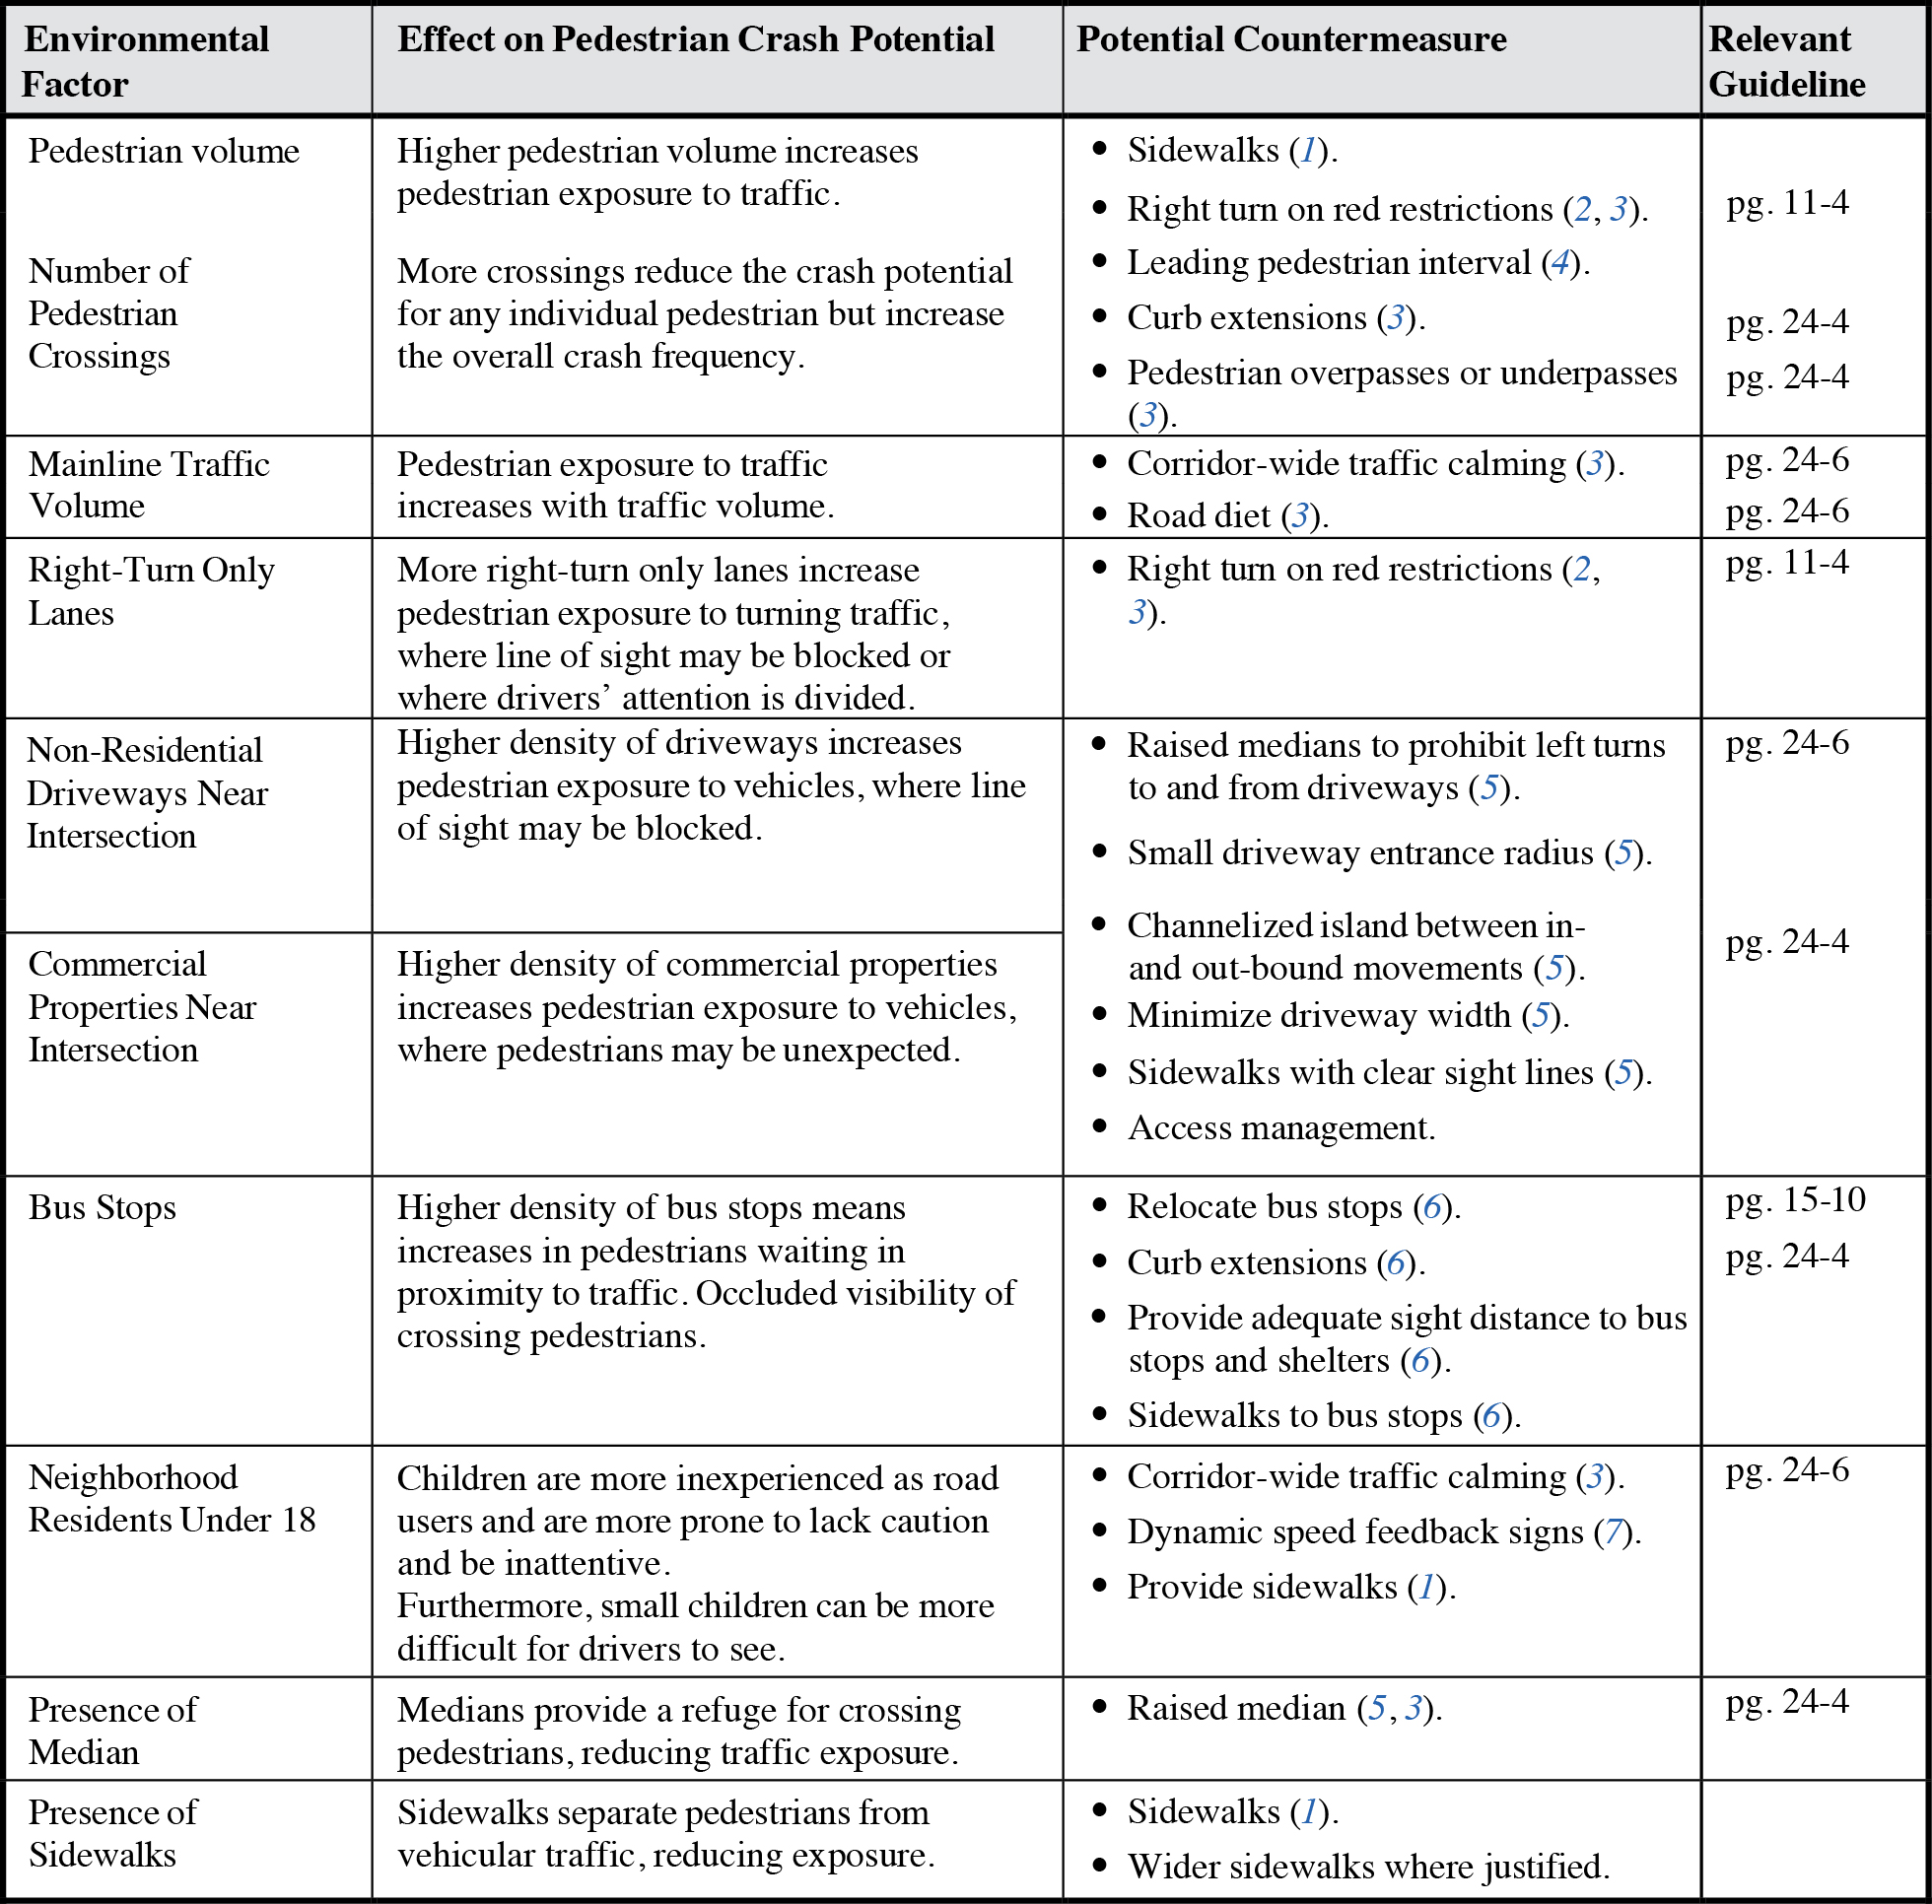
The density of pedestrians, vehicular traffic, or both in an area has been positively associated with pedestrian crashes (2, 4). One study found that the likelihood of any one pedestrian being involved in a crash decreased with increased pedestrian density, but the overall number of pedestrian crashes is likely to increase with increased pedestrian density (2).
An examination of pedestrian crash data in Seattle, WA, found that areas with a high density of intersections having four or more legs had more pedestrian crashes and greater crash potential (1). Pedestrian crashes at intersections have also been associated with the number of non-residential driveways near the intersections (2). Each driveway represents a potential point of exposure to pedestrian conflict, and driver attention may be concentrated on interactions with other vehicles rather than looking for pedestrians while entering or exiting the driveway. Raised medians that prevent left turns to and from driveways can reduce pedestrian exposure to conflict with these vehicles (5). The presence of right-turn lanes is associated with higher pedestrian crash frequencies, particularly when a pedestrian island is not present (2, 3). This could be because the additional lane requires longer pedestrian crossing distances and creates a more complex set of interactions between drivers and pedestrians.
The potential for crashes resulting in fatal injury is higher in urban areas with retail, food, entertainment, and accommodation services, where pedestrian activity is likely to be higher. Furthermore, these areas may be associated with behaviors that lead to elevated crash potential, such as driving or walking while intoxicated or speeding (8). Intersections near commercial properties have been associated with increased pedestrian crashes (2). A driverʼs attention may be centered on searching for stores or restaurants, maneuvering into parking spaces, or other driving tasks with elevated cognitive load, rather than on scanning for pedestrians. Also, pedestrians may be crossing outside of crosswalks or between cars to take the most direct route to their destinations (2).
Chen and Zhou (1) found that areas with a higher bus stop density were likely to have more pedestrian crashes than areas with fewer bus stops. Stopped buses may occlude the visibility of crossing pedestrians for other drivers. Furthermore, areas with transit service are likely to encourage more pedestrian use as they walk to and from the bus stop, increasing exposure to pedestrian crashes. An analysis of pedestrian crashes near bus stops found that pedestrians near the bus stop often crossed the street outside of the crosswalk or against the signal, sometimes to avoid missing the bus (9).
Pedestrian demographics also influence pedestrian crash frequencies at intersections, which are greater at intersections near neighborhoods with higher concentrations of children, who lack the experience and maturity to exercise caution when crossing (2). Treatments such as signs and radar-based dynamic speed feedback signs can increase driver awareness of pedestrians and reduce motor vehicle speeds with this population (3, 7). Areas with higher density of sidewalks have lower crash potential and fewer crashes (1). Sidewalks provide separation from vehicular traffic while facilitating pedestrian travel along the same routes as vehicles. Similarly, the presence of medians is associated with fewer pedestrian crashes (2). Medians, especially those with cutouts for pedestrian refuge, allow pedestrians to cross each direction of traffic separately, reducing the complexity of timing their crossing.
Design Considerations
Some of the recommended countermeasures, such as corridor-wide speed calming and road diets, are not individual countermeasures but holistic approaches to design and combinations of multiple countermeasures. Strategic combinations of countermeasures can be more effective than single countermeasures; the key is that the presented messages are clear for all users at all times, regardless of the intersection leg. Countermeasures focused on pedestrian safety may provide benefits to others; for example, improving sight lines to pedestrians could provide crash reduction for bicyclists.
Cross References
Countermeasures to Reduce Pedestrian Exposure to Vehicles at Crossings
Key References
1. Chen, P., and Zhou, J. (2016). Effects of the built environment on automobile-involved pedestrian crash frequency and risk. Journal of Transport & Health, 3(4), 448–456. Retrieved from https://trid.trb.org/view/1439954.
2. Schneider, R. J., Diogenes, M. C., Arnold, L. S., Attaset, V., Griswold, J., and Ragland, D. R. (2010). Association between roadway intersection characteristics and pedestrian crash risk in Alameda County, California. Transportation Research Record: Journal of the Transportation Research Board, 2198, 41–51.
3. Thomas, L., Thirsk, N. J., and Zegeer, C. V. (2016). NCHRP Synthesis 498: Application of Pedestrian Crossing Treatments for Streets and Highways. Transportation Research Board of the National Academies, Washington, DC.
4. Strauss, J., Miranda-Moreno, L. F., and Morency, P. (2014). Multimodal injury risk analysis of road users at signalized and non-signalized intersections. Accident Analysis & Prevention, 71, 201–209.
5. FHWA. (2010). Access Management in the Vicinity of Intersections. Washington, DC: FHWA.
5. Nabors, D., Schneider, R. J., Leven, D., Lieberman, K., and Mitchell, C. (2008). Pedestrian Safety Guide for Transit Agencies. Washington, DC: FHWA.
7. Hallmark, S. L., Hawkins, N., and Knickerbocker, S. (2015, September 15–18). Use of DSFS as a speed transition zone countermeasure in small, rural communities. Paper presented at the 18th International IEEE Conference on Intelligent Transportation Systems (ITSC).
8. Mansfield, T. J., Peck, D., Morgan, D., McCann, B., and Teicher, P. (2018). The effects of roadway and built environment characteristics on pedestrian fatality risk: A national assessment at the neighborhood scale. Accident Analysis & Prevention, 121, 166–176.
9. Pessaro, B., Catalá, M., Wang, Z., and Spicer, M. (2017). Impact of Transit Stop Location on Pedestrian Safety. Tampa, FL: University of South Florida.
DESIGN CHALLENGES FOR OLDER PEDESTRIANS
Introduction
Design challenges for older pedestrians refers to roadway designs that may accommodate pedestrians who have physiological and/or cognitive age-related impairments. These pedestrians face a diverse set of challenges, in terms of crash potential, that might not be addressed by standard design practices. Older pedestrians have a higher potential than most younger pedestrians of being involved in crashes and of suffering more severe injury during crashes because of fragile skeletal and tissue systems (1). This guideline contains special considerations for designing pedestrian crossings that help older pedestrians to cross the street in a timely manner. Note that the impairments discussed in this guideline can be caused by issues other than age and can affect younger pedestrians as well as older pedestrians.

The figures below compare a potential danger that older pedestrians face when crossing the road, as opposed to younger pedestrians who can cross within the crossing signal time.

Discussion
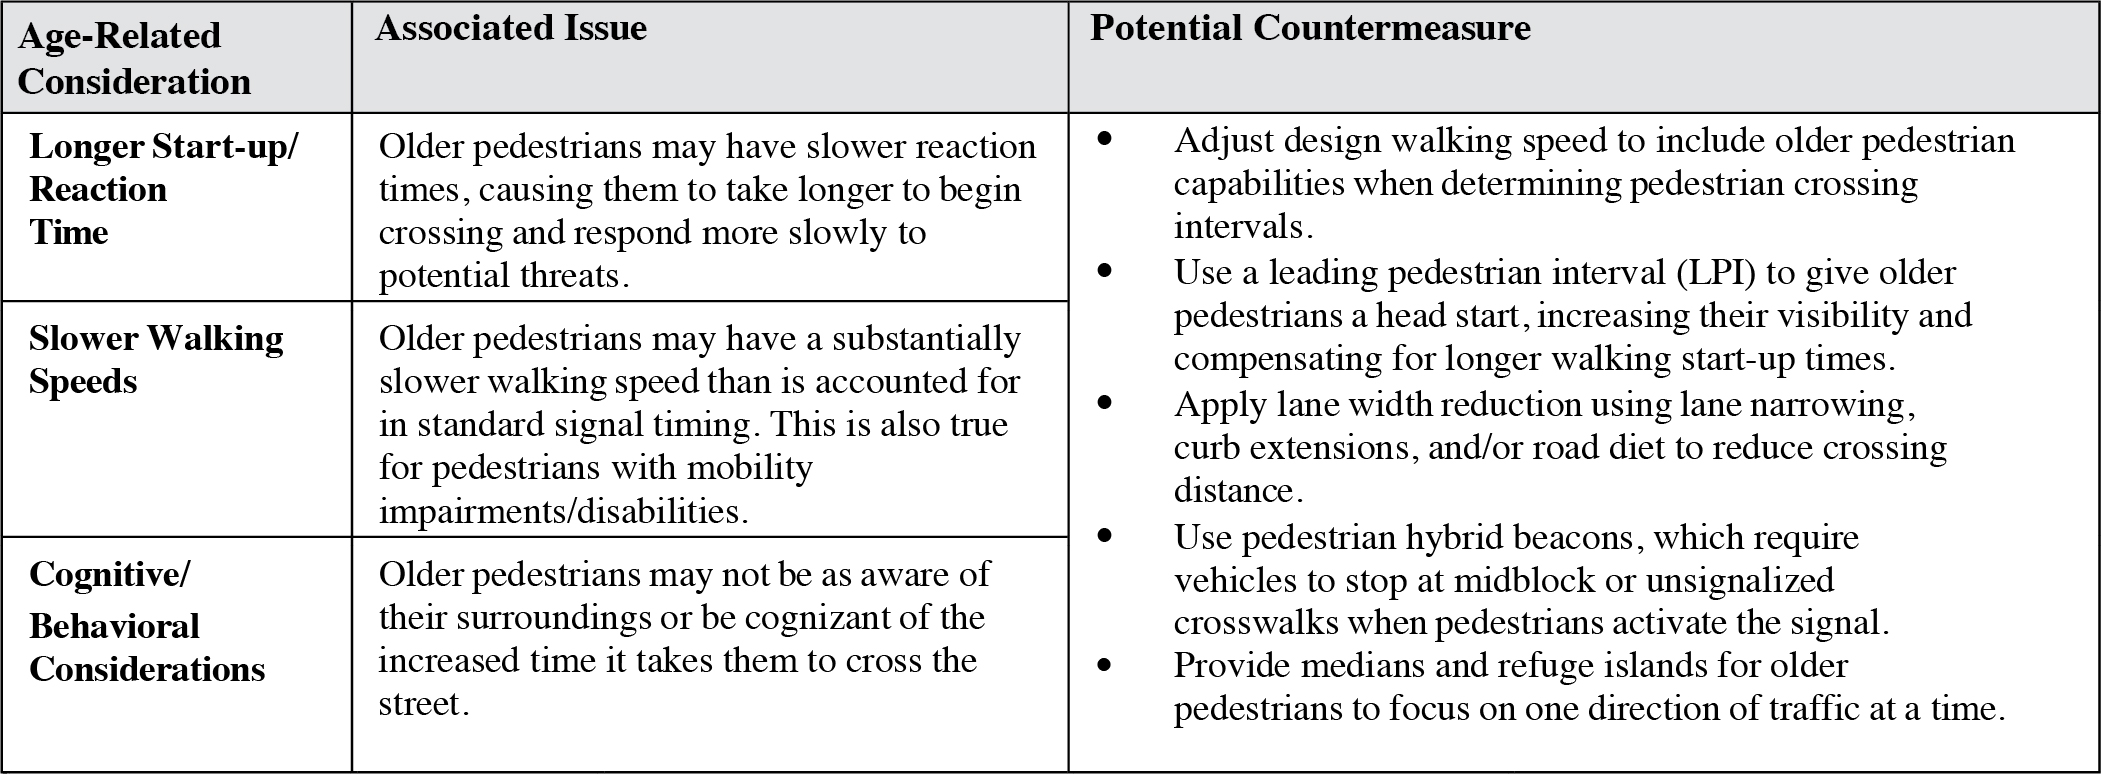
Longer Start-Up/Reaction Times and Slower Walking Speeds. Some pedestrians have physical and cognitive challenges that increase crash potential when compared to younger pedestrians because they not only have slower walking speeds, but they also take longer to begin crossing, particularly when slowed by the use of walkers and canes or by medical issues such as arthritis (1). Designers in the United States use 1.22 m/s (4.00 ft/s) as the standard for pedestrian crossing speed in their algorithms for crossing signal timing (2). Although this speed may accommodate younger pedestrians who have an average walking speed of 1.32 m/s (4.33 ft/s), the average walking speed for older pedestrians is 1.07 m/s (3.5 ft/s), well below the standard crossing speed used for signal timing (3). Average start-up times for pedestrians under 65 years old were 1.82 seconds compared with 2.39 seconds for pedestrians over 65 years old (2). Reducing crossing distances through lane width reduction can increase their safety by shortening travel lengths and times; adjusting pedestrian crossing signal times can provide more time for crossing (4). Another countermeasure is a leading pedestrian interval (LPI). LPIs give pedestrians a 3–7 second head start to better establish their presence in crosswalks before vehicles get priority to turn left (5). LPIs also increase visibility of crossing pedestrians, increase the likelihood of vehicles yielding to pedestrians, reduce conflicts between pedestrians and vehicles, and enhance safety for older pedestrians who are slower to start walking into the intersection (5). An LPI evaluation of 115 sites across three cities showed a 13% reduction in pedestrian crashes (6). Pedestrian hybrid beacons (PHB) may help pedestrians cross busy or high-speed roads at midblock crossings and uncontrolled intersections (5). Design of the pedestrian walking zones and clearance intervals might consider older pedestrian walking speeds and start-up/reaction times to provide sufficient time for older pedestrians to cross (5). PHBs implemented at locations with a median refuge can further accommodate older pedestrian needs by providing a two-stage crossing with individual PHBs at each stage (5).
Cognitive/Behavioral Considerations. A study simulating pedestrian road crossing found that a majority of older pedestrians judged their time to cross a single-lane road to be the same as young pedestrians, suggesting that most older pedestrians donʼt recognize the decline in their walking ability (7). Their crossing decisions were the same as those of younger subjects, giving them a relatively smaller margin of error in decision-making to cross with an increased likelihood that the crossing conditions will be less than ideal. Pedestrians, in general, are not sensitive or perceptive to changes in oncoming vehicle speeds. In addition to this, crash potential is elevated for older pedestrians because of their lack of recognition of their declining mobility (7). In another simulated road crossing, older pedestrians showed that when their attention was divided, they were more susceptible to making inappropriate decisions that could lead to crossings with greater crash potential (8). Reducing the complexity of crossing the road by installing pedestrian refuges allows for a crossing movement to occur in two stages, allowing older pedestrians to focus on and cross one direction of traffic at a time (4, 5).
Design Considerations
While it may be desirable to allow enough time for older pedestrians to easily finish a crossing, this must be balanced by maintaining appropriate signal timing for reasonable flow of traffic. At locations where longer signal timings are not feasible, it may be worthwhile to consider other countermeasure ideas that would not impact traffic, such as pedestrian over/underpasses (when justified) or pedestrian refuges. Longer crossing signal periods may lead to more frequent instances where pedestrians “race against” the signal or begin crossing during the “donʼt walk” phase (2).
Cross References
Countermeasures to Reduce Pedestrian Exposure to Vehicles at Crossings
Key References
1. Levi, S., De Leonardis, D. M., Antin, J., and Angel, L. (2013). Identifying Countermeasure Strategies to Increase Safety of Older Pedestrians (Report No. DOT HS 811 798). Washington, DC: National Highway Traffic Safety Administration.
2. Crabtree, M., Lodge, C., and Emmerson, P. (2015). A Review of Pedestrian Walking Speeds and Time Needed to Cross the Road (Report No. PPR700). Wokingham, Berkshire United Kingdom: Transportation Research Laboratory.
3. Naveteur, J., Delzenne, J., Sockeel, P., Watelain, E., and Dupuy, M. A. (2013). Crosswalk time estimation and time perception: An experimental study among older female pedestrians. Accident Analysis & Prevention, 60, 42–49.
4. Mantilla, J., and Burtt, D. (2016). Safer Road Design for Older Pedestrians. Victoria Walks, Melbourne. Version 1.1.
5. FHWA. (2017). Making Our Roads Safer One Countermeasure at a Time. 20 Proven Safety Countermeasures That Offer Significant and Measurable Impacts to Improving Safety. Washington, DC: FHWA.
6. Goughnour, E. D., Carter, C., Lyon, B., Persaud, B., Lan, P., Chun, I., Hamilton, I., and Signor, K. (2018). Safety Evaluation of Protected Left-Turn Phasing and Leading Pedestrian Intervals on Pedestrian Safety (Report No. FHWA-HRT-18-044). Washington, DC: FHWA.
7. Liu, Y. C., and Tung, Y. C. (2014). Risk analysis of pedestriansʼ road-crossing decisions: Effects of age, time gap, time of day, and vehicle speed. Safety Science, 63, 77–82.
8. Butler, A. A., Lord, S. R., and Fitzpatrick, R. C. (2016). Perceptions of speed and risk: Experimental studies of road crossing by older people. PLoS One, 11(4), e0152617.
PEDESTRIAN RAIL CROSSING SAFETY
Introduction
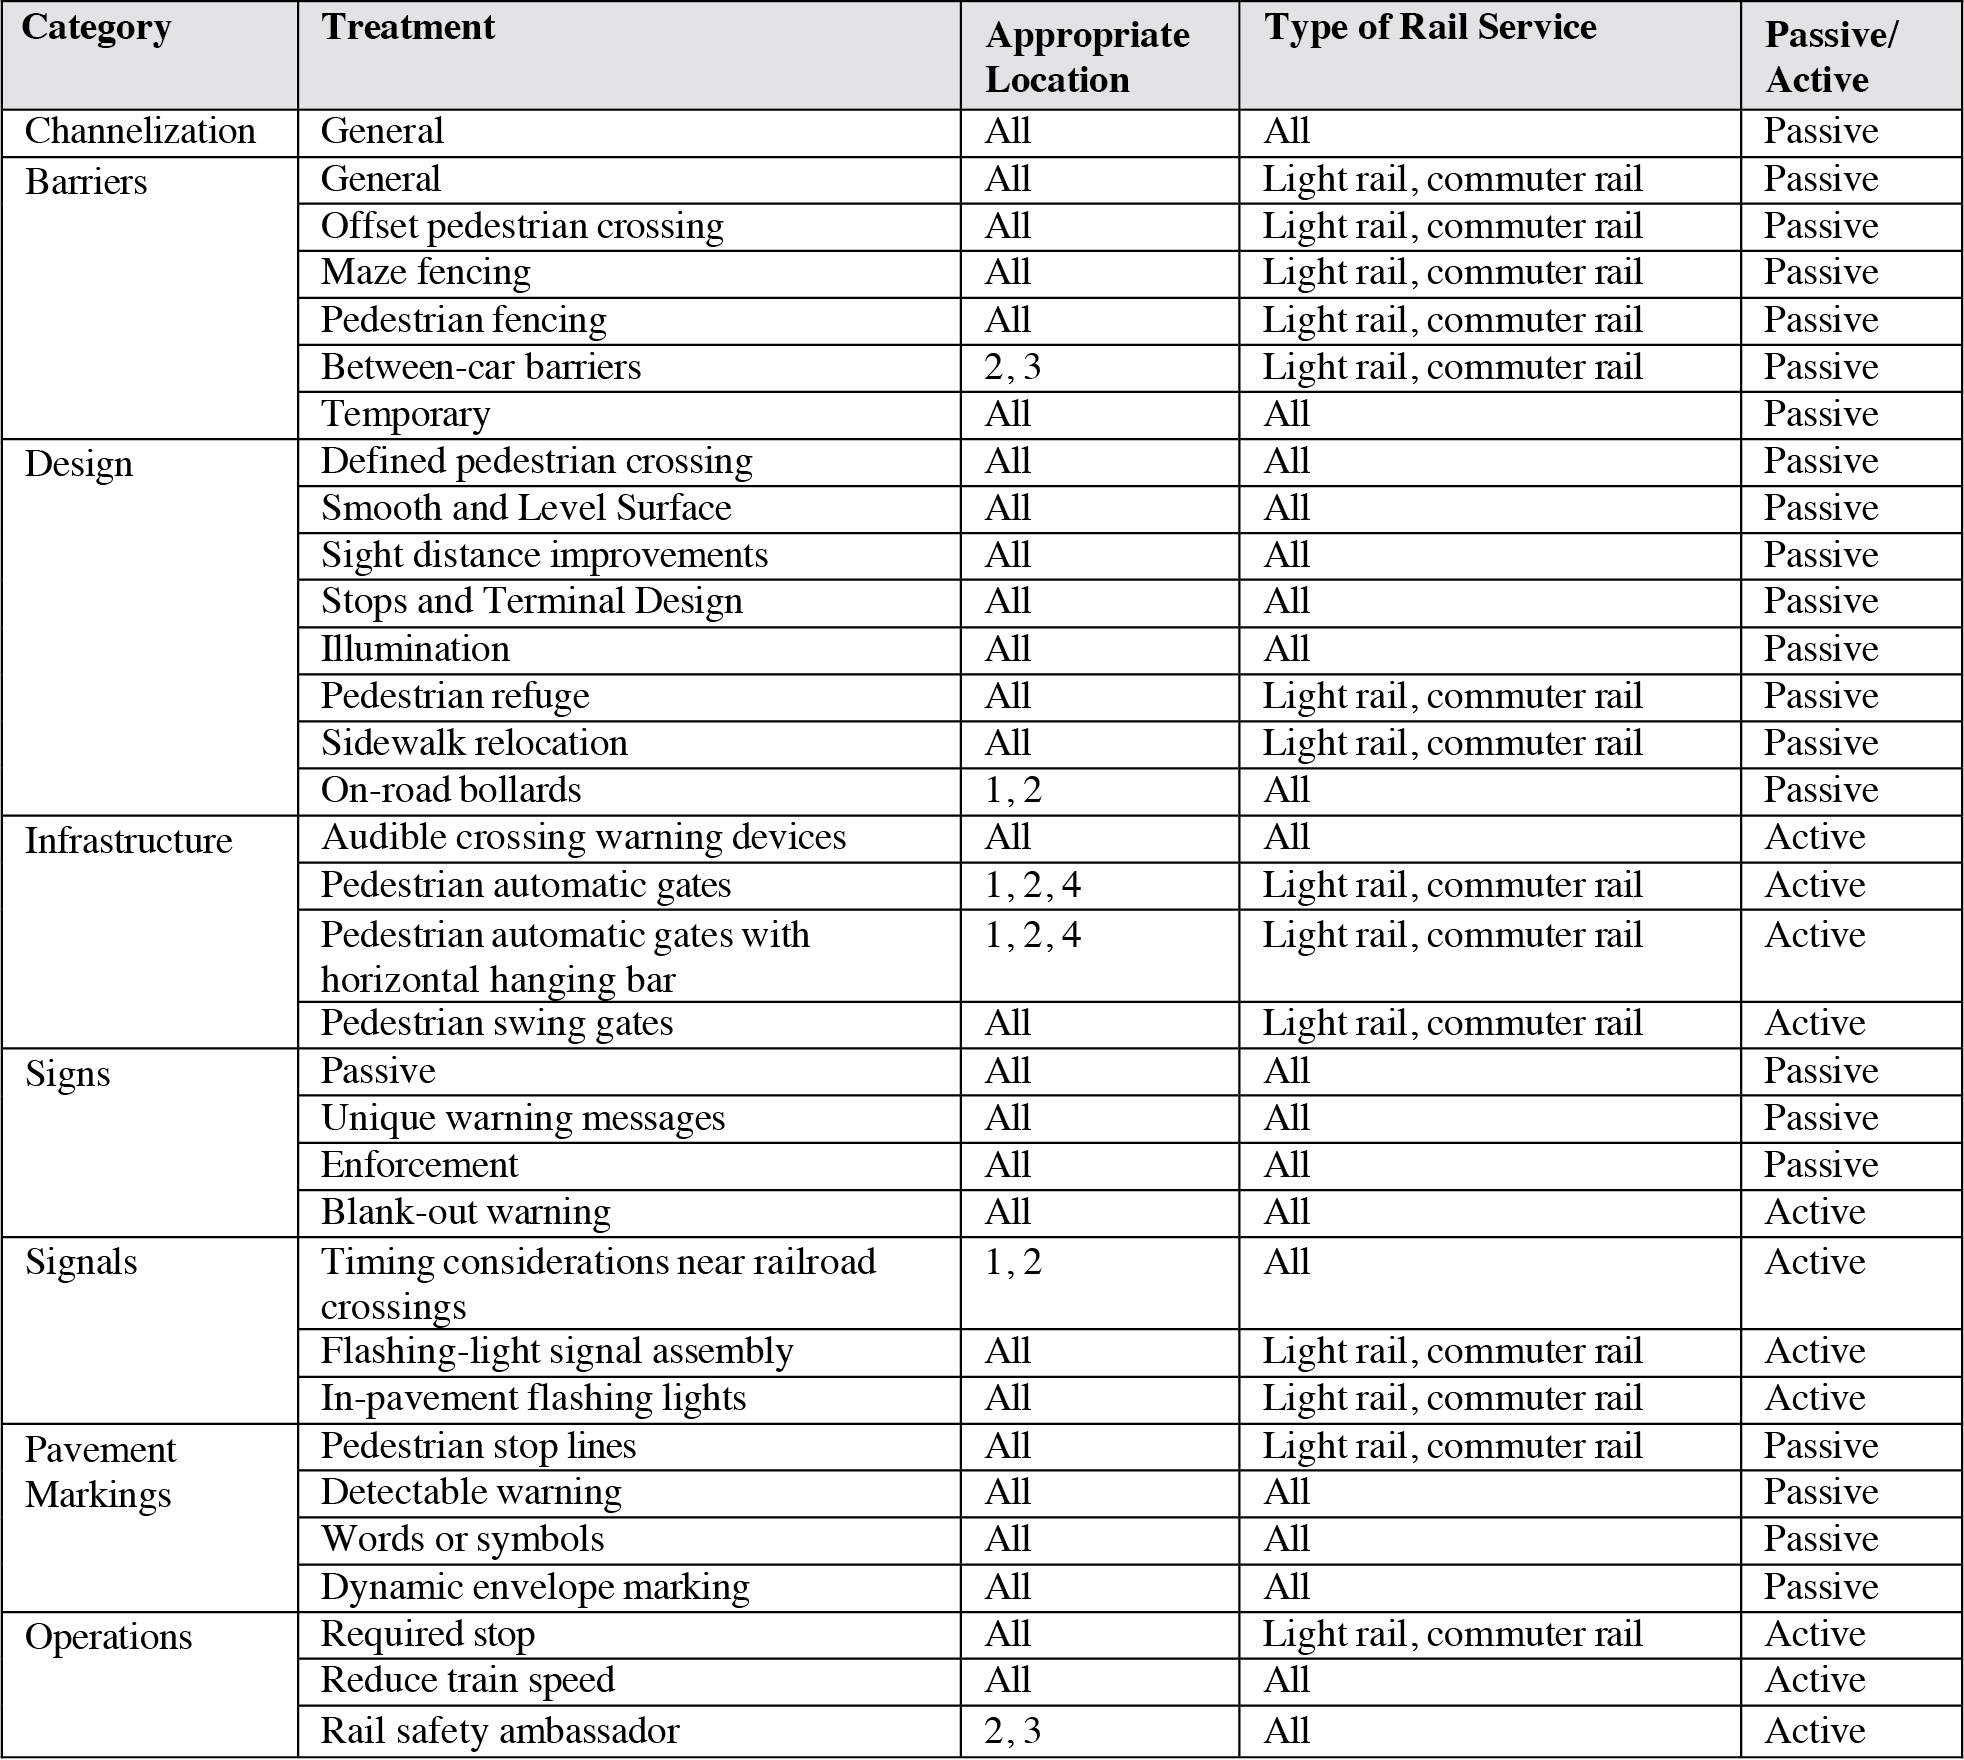
Though rare, pedestrian-rail crashes are generally caused by pedestrians ignoring warnings, possibly due to inattentiveness, lack of situational awareness, or direct disobedience to catch a train (1). The crash potential at any individual crossing depends on the ability of the crossing design to adequately provide warnings, force the pedestrian to look for trains, or prevent crossings entirely. There are a large number of potential countermeasures for many different crossing situations.


Source: Adapted from Fitzpatrick et al. (1).
Discussion
There are several ways to reduce crashes and increase pedestrian safety around rail crossings. Among the most common countermeasures are implementations of effective barriers and infrastructure.
Barriers. These devices are used to control or restrict the lateral movement of pedestrians, keeping them separate from passing trains at rail crossings. Fencing, in particular, has been shown to be an effective barrier tool as a safeguard between trains and pedestrians. One compilation (2) describes some safety devices being used across the United States for pedestrians at grade crossings. California, for example, uses several channelization strategies to improve pedestriansʼ observations of any approaching trains by creating Z-crossings and fencing around rail crossings. In a review of pedestrian crossing safety countermeasures used in practice (3), Z-crossings, oversized ballasts, bedstead barriers, and fencing were among the tools identified as key safety measures. Z-crossings are designed to channel pedestrians in a way that forces them to look down the tracks while approaching the crossing, and they have a low to moderate cost of installation. Oversized ballasts along ramps and rail corridors discourage pedestrians from taking shortcuts around approved pedestrian crossings and are a low-cost treatment. Bedstead barriers can be used in tight urban spaces to create a maze-like passageway that causes pedestrians to face the direction of approaching rail vehicles and has a low installation cost. Fencing is used to separate the railroad right-of-way from highways and pedestrian walkways, and has a low installation cost, but could have high maintenance costs in the long run.
Infrastructure. Similar to barriers, infrastructure countermeasures are used to block pedestrians from entering into the rail crossing when a train is approaching. However, while barriers control the lateral movement of pedestrians through channelization, infrastructure treatments restrict movement along the direct path of pedestrians using pedestrian swing gates, pedestrian automatic gates, and gate skirts. Swing gates have been shown to draw the attention of pedestrians toward the direction of approaching trains (2). These swing gates have led to reduced incidents of inattention by passengers waiting to board trains in rail station areas. Pedestrian automatic gates are found to be more effective when a secondary horizontal gate arm is installed, called a gate skirt, to further block pedestrians from crossing railroads when a train is approaching (4). After installation, pedestrian rail crossing violations, such as maneuvering underneath or around the gates, dropped from 80% to 45%. Audible crossing warning devices can be a helpful supplement to gate treatments when considering pedestrians with visual impairments and rail crossings where transit vehicles are quiet and ambient noise levels are high (1).
Design Considerations
When implementing any active countermeasure, the countermeasure should communicate with the train and other countermeasures properly so that activation occurs at the appropriate time and does not result in the ‘storage’, or unintentional entrapment of pedestrians or vehicles (5). Furthermore, some of the countermeasures mentioned here may be difficult for elderly pedestrians or pedestrians with disabilities to operate. Any installed countermeasures should be ADA compliant and thoroughly tested, with any necessary adjustments made. The primary cause of pedestrian-rail crashes is pedestrians ‘gate-dashing’ or trying to cross against countermeasures. While more countermeasures may prevent this, one solution is to remove the crossing entirely; over/underpasses can provide secure and convenient crossings. If convenient over/underpass designs are unavailable for the crossing site, crossings can be rerouted to a safer crossing at another location.
Cross References
Rail-Highway Grade Crossings, Chapter 19
Key References
1. Fitzpatrick, K., Warner, J., Brewer, M. A., Bentzen, B. L., Barlow, J. M., and Sperry, B. (2015). TCRP Report 175: Guidebook on Pedestrian Crossings of Public Transit Rail Services. Transportation Research Board of the National Academies, Washington, DC.
2. Federal Railroad Administration. (2008). A Compilation of Pedestrian Safety Devices in Use at Grade Crossings. Federal Railroad Administration, Office of Safety.
3. Thompson, A., and Kennedy, B. J. (2016). Engineering Design for Pedestrian Safety at Highway-Rail Grade Crossings (Report No. DOT/FRA/ORD-16/24). Washington, DC: Federal Railroad Administration.
4. Chase, S., Gabree, S. H., and DaSilva, M. (2013). Effect of Gate Skirts on Pedestrian Behavior at a Highway-Rail Grade Crossing (Report No. DOT/FRA/ORD-13/51). Washington, DC: Federal Railroad Administration.
5. Jeng, O. J. (2005). Human Factors Evaluation of Design Ideas for Prevention of Vehicle Entrapment on Railroad Tracks Due to Improper Left Turns. Newark, NJ: New Jersey Institute of Technology.
KEY REFERENCES FOR PEDESTRIAN CROSSING SAFETY COUNTERMEASURES
Introduction
There are numerous resources available to aid in the selection of potential countermeasures at pedestrian crossing locations that experience an unacceptable number of crashes. This guideline summarizes key resources available for finding information about countermeasures that improve pedestrian safety.

Discussion
The Toolbox of Pedestrian Countermeasures and Their Potential Effectiveness (1) provides estimates of expected crash reductions associated with the application of pedestrian crash countermeasures. The estimates are presented in the form of crash modification factors that, when multiplied by expected crashes without the countermeasure, yield the estimated number of crashes with the countermeasure.
NCHRP Synthesis 498 (2) highlights key resources and tools regarding pedestrian crossing improvements. Examples of emerging guidance and practices at the state and local level are also included.
The NACTO Urban Street Design Guide (3) gives insight into street configurations in different settings and how these varying designs are used by the nationʼs foremost engineers, planners, and designers in cities today. It provides a blueprint for both transforming existing corridors and creating new complete-street designs that integrate pedestrians, bicyclists, transit, and motor vehicle traffic in urban environments. However, designers should use caution because some treatments in the Urban Street Design Guide are not in compliance with requirements in the MUTCD.
The Manual on Uniform Traffic Control Devices (4) provides uniform standards for the design of all signs, signals, markings, and other devices that are used to regulate, warn, or guide traffic and that are placed on, over, or adjacent to streets, highways, pedestrian facilities, and bikeways. These features on the roadway have a significant impact on pedestrian safety when they are crossing roads.
The PEDSAFE Countermeasure Selection Tool (5) is a web-based tool that allows users to review possible countermeasures to use based on their information provided. The user enters the name of the location, the goal of the treatment, and a description of the site, and the selection tool returns a range of treatments that can be used.
The Crash Modification Factors Clearinghouse (6) website connects users with countermeasures related to their search terms. The countermeasures are organized into different categories, including pedestrians, bicyclists, shoulder treatments, and more. In the respective subcategories, specific countermeasures are listed, and their characteristics are shown, such as quality, crash type, area type, and more.
NCHRP Report 562 (7) recommends engineering treatments to increase pedestrian safety for crossing high-speed, high-volume roadways at unsignalized intersections.
The AASHTO Guide for the Planning, Design, and Operation of Pedestrian Facilities (8) focuses on identifying safety measures for interactions between pedestrians and traffic as well as appropriate methods for accommodating pedestrians in roadway and facility design.
NCHRP Report 500 (9) aims to reduce the number of crashes involving pedestrians through several strategies addressing different types of crashes.
Design Considerations
None.
Cross References
None.
Key References
1. FHWA. (2018). Toolbox of Pedestrian Countermeasures and Their Potential Effectiveness. Retrieved from https://safety.fhwa.dot.gov/ped_bike/tools_solve/fhwasa18041/fhwasa18041.pdf
2. Thomas, L., Thirsk, N. J., and Zegeer, C. V. (2016). NCHRP Synthesis 498: Application of Pedestrian Crossing Treatments for Streets and Highways. Transportation Research Board of the National Academies, Washington, DC.
3. National Association of City Transportation Officials. (2013). Urban Street Design Guide. New York, NY.
4. FHWA. (2023). Manual on Uniform Traffic Control Devices for Streets and Highways. (11th ed.) Washington, DC.
5. Zegeer, C. V., Nabors, D., and Lagerwey, P. (2013). PEDSAFE 2013. Pedestrian Safety Guide and Countermeasure Selection System. Retrieved from http:/www.pedbikesafe.org/pedsafe/
6. FHWA. (n.d.). Crash Modification Factors Clearinghouse. Retrieved from https://www.cmfclearinghouse.org.
7. Fitzpatrick, K., Turner, S. M., Brewer, M., Carlson, P. J., Ullman, B., Trout, N., Park, E. S., Whitacre, J., Lalani, N., and Lord, D. (2006). TCRP Report 112/NCHRP Report 562: Improving Pedestrian Safety at Unsignalized Crossings. Transportation Research Board of the National Academies, Washington, DC.
8. AASHTO. (2004). Guide for the Planning, Design, and Operation of Pedestrian Facilities. Washington, DC.
9. Zegeer, C. V., Stutts, J., Huang, H., Cynecki, M. J., Van Houten, R., Alberson, B., Pfefer, R., Neuman, T. R., Slack, K. L., and Hardy, K. K. (2004). NCHRP Report 500: Guidance for Implementation of the AASHTO Strategic Highway Safety Plan, Volume 10: A Guide for Reducing Collisions Involving Pedestrians. Transportation Research Board of the National Academies, Washington, DC.


