Human Factors Guidelines for Road Systems: Third Edition (2025)
Chapter: 2 How to Use This Document

CHAPTER 2
How to Use This Document
Organization of the HFG
This document is divided into seven parts.
Part I, “Introduction,” explains why human factors guidance is useful and provides an overview of how to use the document and take advantage of its features.
Part II, “Bringing Road User Capabilities into Highway Design and Traffic Engineering Practice,” discusses road users and how to take their needs into account. It includes two short chapters that describe the human factors approach to roadway design, present basic principles and methods, and provide key information about fundamental road user capabilities.
Parts III, IV, V, and VI present the actual guidance statements within this document, as follows: Part III, “Human Factors Guidance for Roadway Geometric Elements,” is organized around specific roadway location elements, such as curves, intersections, roundabouts, and interchanges. Part IV, “Special Design Considerations,” considers unique design issues related to roadway speed, design for rural and urban environments, design of work zones, rail-highway crossings, and lighting. Part V, “Human Factors Guidance for Traffic Engineering Elements,” addresses traffic engineering elements, such as fixed signage, changeable message signs, and markings. Part VI, “Human Factors Guidance for Vulnerable and Older Road Users,” addresses the particular needs of pedestrians, bicyclists, and older road users. The guidance among many of these chapters is interrelated, and the chapter sections link to one another.
Part VII, “Additional Information,” presents tutorials and provides other information that may be useful when using the HFG, such as References, an Index, and a Glossary.
In the PDF or online version of this document, blue-colored text will provide links to other pages or positions in the document.
The Two-Page Format
In the HFG, a two-page format is used to present the individual human factors guidelines provided in Chapters 5 through 26. Each two-page guideline includes the following elements:
- The left-hand page presents the title of the guideline, which indicates the main issue being addressed by the guideline; an introduction and overview of the guideline; the guideline itself; the rating associated with the guideline; and a graphic, table, or figure that augments the text information.
- The right-hand page provides a more detailed discussion of the supporting rationale for the guideline that a highway designer or traffic engineer may need to perform his or her day-to-day design tasks, as well as special design considerations, cross-references to related guidelines or chapters, and a list of the key references cited in the guideline.
A sample guideline, with key features highlighted, is shown in Figure 2-1; a detailed description of the presentation format of the guidelines follows.
The Left-Hand Page
The guideline title is indicated by centered, bold type at the top of the left-hand page.
Introduction
This subsection briefly defines the guideline and provides basic information about the roadway design parameters and the guideline. For example, this subsection might provide the unit of measurement (e.g., visual angle, meters, foot-lamberts) for the guideline or the equations for the derivation of certain parameters.
Design Guideline
This subsection presents a design guideline, either as a point value, a range, or an explicit recommendation. The guideline is always presented prominently and is enclosed in a blue box that is centered on the page. In some cases, the guideline is presented qualitatively in general terms (e.g., “If the operating speed of a roadway is substantially higher than the design speeds, increasing the sight distance to compensate for higher traveling speeds may be appropriate.”). However, in most cases, the design guideline is presented quantitatively (e.g., the table presented in “Determining
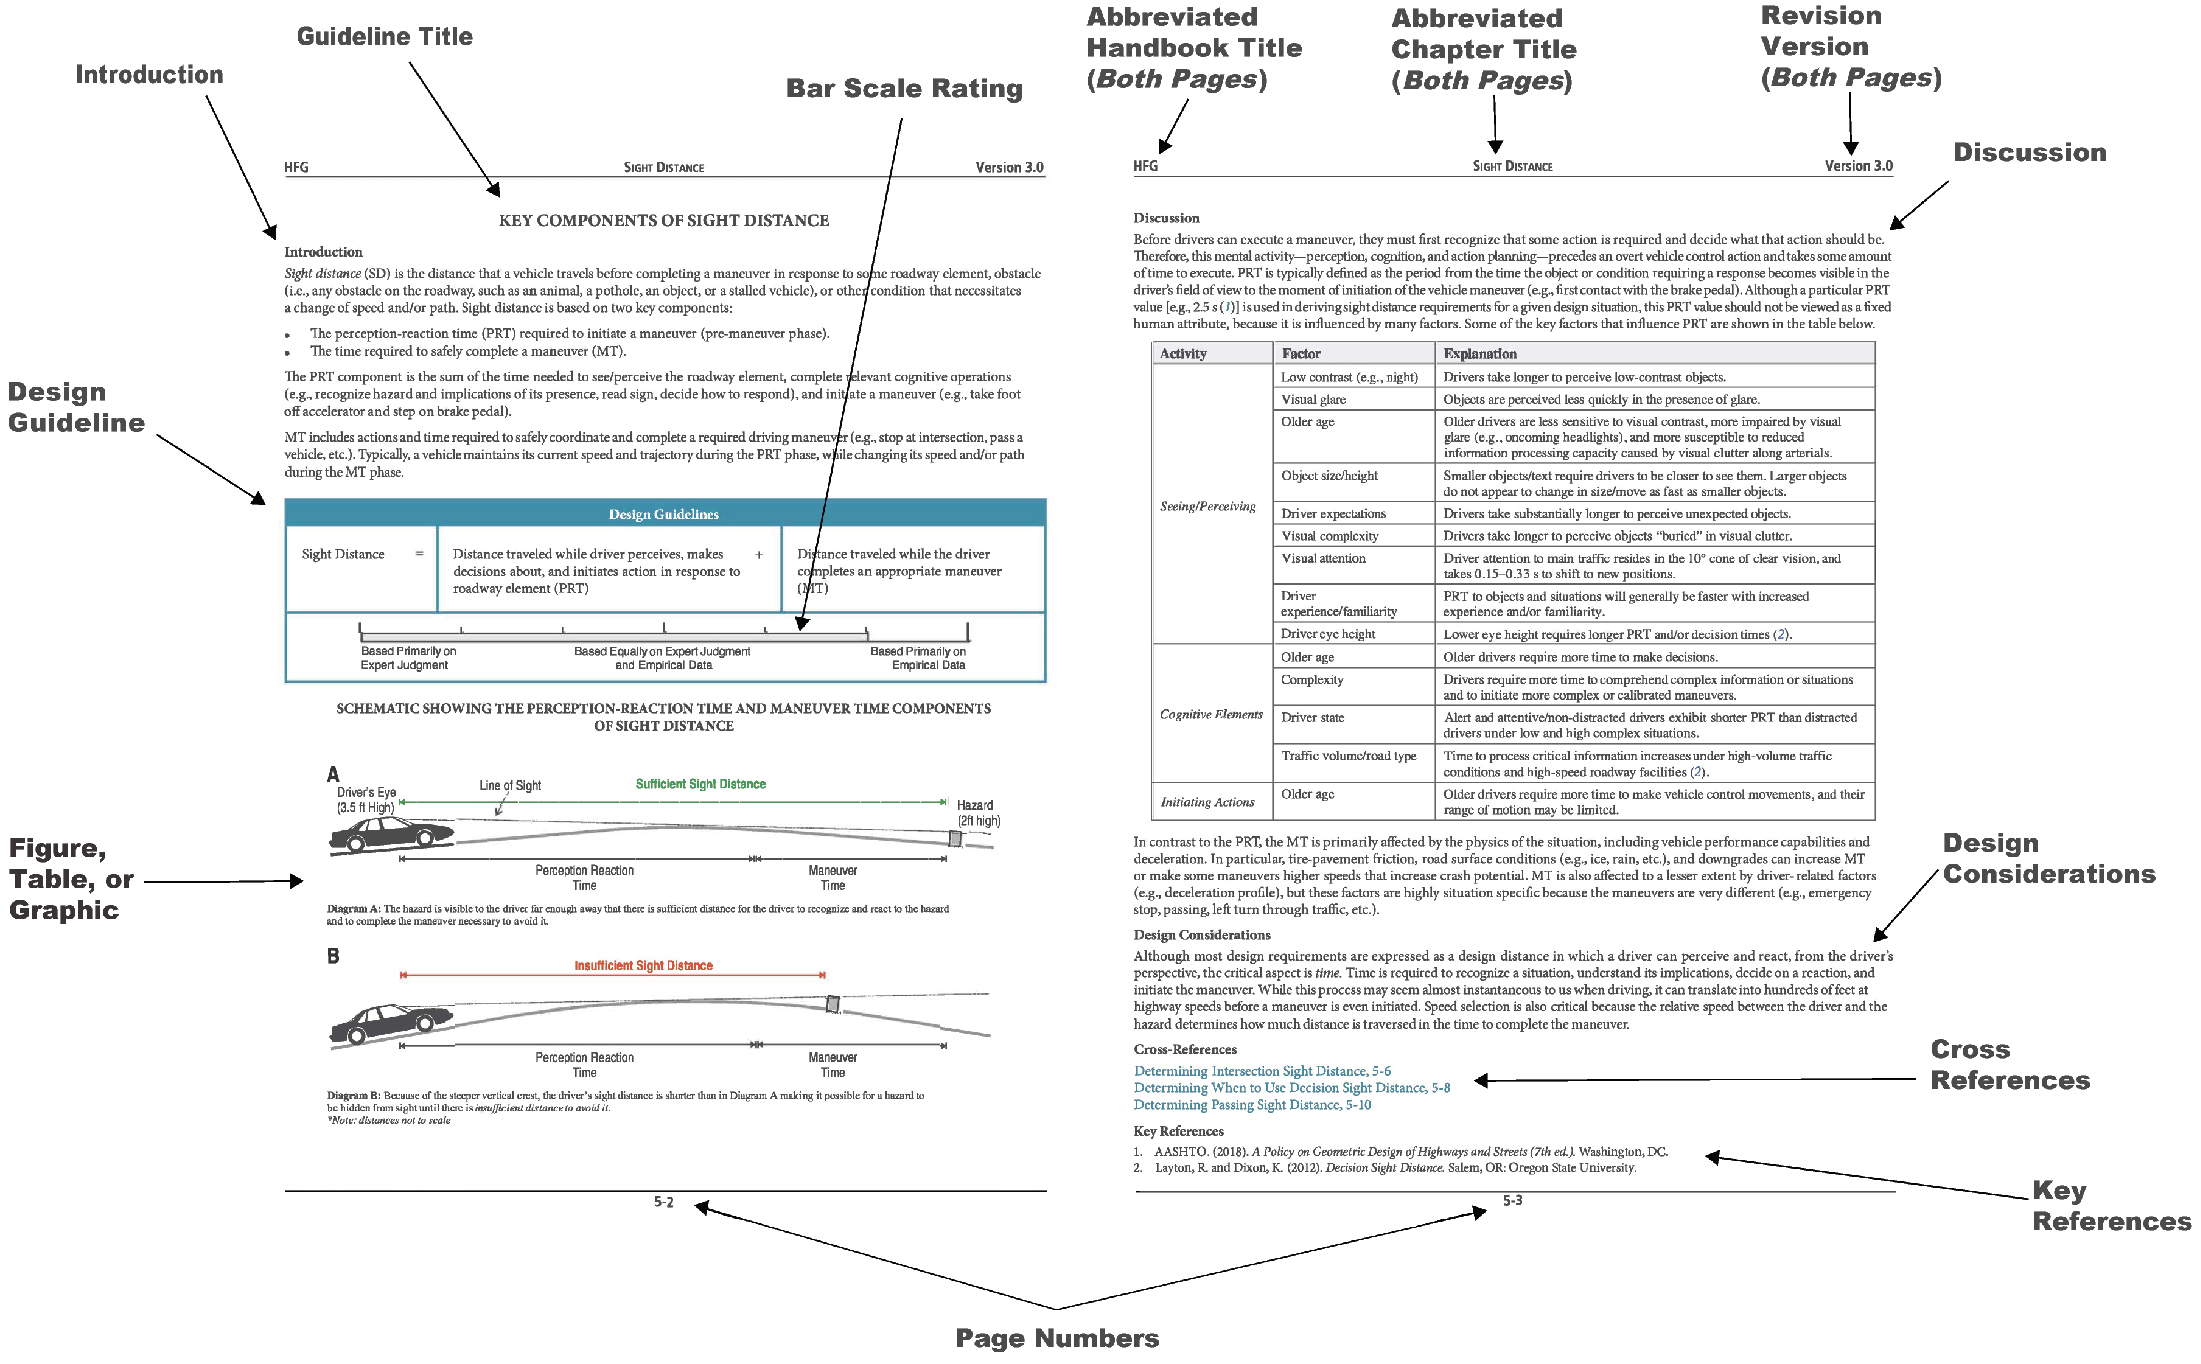
Long Description.
The left-hand page has a guideline title, introduction, design guideline, bar scale rating, figure table or graphic, and page number. The right-hand page has an abbreviated handbook title (both pages), abbreviated chapter title (both pages), revision version (both pages), discussion, design considerations, cross-references, references, and page number.
Passing Sight Distance” on page 5-10, which quantifies the passing sight distance for vehicles traveling at different speeds).
The Bar-Scale Rating System
Not all topics that are important to roadway design and traffic operations have been studied to the same extent or with the same research methodologies. For some design topics, enough empirical data exist to provide well-supported guidelines in the HFG, and the use of expert judgment is minimal. For others, empirical data have provided only the foundation for a decision about what the design guideline should be, but experience and judgment have been used to determine the final guideline. For yet other topics, little or no empirical data were available, and the guideline was based primarily on the expert judgment of the guideline developer.
To aid highway designers and traffic engineers in better understanding the underlying data and in making design trade-offs, individual guidelines have been rated according to the relative contributions that empirical data and expert judgment have each made to the guideline.
Specifically, each guideline has been rated along a continuum, with each guideline falling somewhere between “Based Primarily on Expert Judgment” and “Based Primarily on Empirical Data.” These terms are defined below.
Based Primarily on Expert Judgment. Little or no empirical data were used to develop this guideline. Expert judgment and design convention were used to develop this guideline.
Based Equally on Expert Judgment and Empirical Data. Equal amounts of expert judgment and experimental data were used to develop this guideline. There may have been a lack of consistency in the research findings, necessitating greater reliance on expert judgment. Or, research may have been lacking in this area, necessitating the interpretation of research results from related content domains for use in this context.
Based Primarily on Empirical Data. The guideline is based on high-quality and consistent data sources that apply directly to the guideline. Empirical data from highly relevant content domains (e.g., transportation human factors, driver performance data) were primarily used to develop this guideline. Little expert judgment was required to develop this guideline.
Figure, Table, or Graphic
This subsection provides a figure, table, or graphic to augment the guideline. This figure, table, or graphic provides “at a glance” information considered to be particularly important to the conceptualization and use of the guideline. It provides a visual representation of the guideline (or some aspect of the guideline) that may be difficult to grasp from the design guideline itself, which is quantitative and text-based. This figure, table, or graphic may take various forms, including a drawing that illustrates a generic application of a guideline or a particular design issue, a flowchart outlining measurement procedures for the guideline, a table summarizing the guideline, or schematic examples of specific design solutions.
The Right-Hand Page
Discussion
This subsection briefly summarizes the rationale behind the choice of the guideline. In particular, the discussion explains the logic, premises, assumptions, and train of thought associated with the development of the guideline. The focus is on a presentation of driver limitations and capabilities deemed relevant to the particular guideline topic. The discussion can take many
forms, including a brief review of applicable empirical studies, references to traditional design practice, or an analysis of relevant information. The discussion is presented primarily to help HFG users understand the guideline and to help them explain or justify the guideline to other members of their respective development teams. Also, because these human factors guidelines are expected to be revised as additional empirical data become available, this subsection will be useful to future developers of the guidelines. In particular, the discussion will enable future guideline developers to determine how new information on road usersʼ capabilities and limitations can (or should) be integrated into the existing guidelines.
For example, the design guideline “Determining Stopping Sight Distance” on page 5-4 has been developed through consideration of experimental data gathered under a range of visibility (good and poor) and vehicle traction (good and poor) conditions. Thus, this guideline is presented as being the sum of driver reaction time plus vehicle deceleration, under a range of visibility/traction conditions. If new driver performance analyses or data for these conditions are obtained (or if new assumptions are made), future design guideline developers will be able to evaluate the quality and applicability of this new information relative to the discussion in the current design guideline “Determining Stopping Sight Distance” and determine what (if any) changes should be made to the design guideline.
Design Considerations
This subsection presents special design considerations associated with a particular guideline. These special considerations may include design goals from the perspective of other disciplines (e.g., highway engineering, urban planning, physiology), interactions with other guidelines, special difficulties associated with the guidelineʼs conceptualization or measurement, or special performance implications associated with the guideline.
Cross-References
This subsection lists the titles and page numbers of other chapters or guidelines within the HFG that are relevant to or provide additional information helpful to understanding the current guideline.
In the PDF and online versions of the publication, the cross-references and their page numbers are in blue text and are linked to the other pages.
Key References
This subsection lists the references associated with the formulation of the guideline. The reference numbers correspond to the italicized numerals in the text where the references are cited. In the PDF and online versions of the publication, the in-text citation numerals are in blue and link to the references in the Key References section.
A complete list of references for the entire HFG is provided in Chapter 28 of this document.
Summary of HFG Topics
Part III Human Factors Guidance for Roadway Geometric Elements
Chapter 5: Sight Distance
- Key Components of Sight Distance, 5-2. The required sight distance is the sum of the distance traveled during perception-reaction time (PRT), which is the time it takes for the driver to notice a hazard or situation, decide on a response, and initiate it, plus the maneuver time
- (MT), during which the driver completes the response. This guideline reviews factors that affect PRT and MT.
- Determining Stopping Sight Distance, 5-4. Stopping sight distance (SSD) is the sum of the time required for a driver to notice a need to stop (such as an object in the road), to decide to stop, and to bring the vehicle to a stop. This guideline provides standard formulas for calculating SSD and discusses how human factors reduce typical performance below what is optimally possible.
- Determining Intersection Sight Distance, 5-6. This guideline explains how the sight distance required at an intersection depends on how the intersection is controlled (e.g., by signals or signs) and on the intended maneuver. It provides references to formulas in the AASHTO Green Book for selecting the proper sight distance.
- Determining When to Use Decision Sight Distance, 5-8. Decision sight distance represents a longer sight distance than is usually necessary. This guideline provides examples and formulas for complicated or non-standard highway situations in which drivers might require extra distance to make a decision.
- Determining Passing Sight Distance, 5-10. Passing sight distance is how far ahead a driver must be able to see to successfully complete a passing maneuver. This guideline provides the design values for passes made at different speeds from AASHTO (2018a) and summarizes the research behind them.
- Influence of Speed on Sight Distance, 5-12. The design of a road affects driversʼ speeds, which in turn affects the required sight distance. This guideline provides a quantitative discussion of how features such as lane width and pavement surface affect operating speed.
- Key References for Sight Distance Information, 5-14. Sight distance issues have been extensively covered in various standard references. This guideline points to chapters in seven publications where traffic engineers can find primary sources of sight distance information.
- Where to Find Sight Distance Information for Specific Roadway Features, 5-16. This guideline cites references for calculating the sight distance for eight specific non-intersection features.
- Where to Find Sight Distance Information for Intersections, 5-18. This guideline cites references for calculating the sight distance for nine types of intersections.
Chapter 6: Curves (Horizontal Alignment)
- Task Analysis of Curve Driving, 6-2. This guideline identifies the basic activities that drivers typically perform while navigating a single horizontal curve. It explains how design aspects such as consistency, curvature, and lane width affect the driverʼs workload and where and how curve driving tasks can be made easier to perform.
- The Influence of Perceptual Factors on Curve Driving, 6-4. Visual information around a horizontal curve can cause drivers to perceive the radius to be different from the actual radius. This guideline provides graphs of recommended combinations of horizontal curvature and vertical sag curvature and discusses the effects of vertical crests, cross slope, and other features.
- Countermeasures for Reducing Vehicle Speeds Entering Horizontal Curves, 6-6. This guideline identifies several countermeasures for reducing vehicle speeds when entering horizontal curves, with a focus on signing and pavement marking strategies.
- Countermeasures for Improving Steering and Vehicle Control Through Curves, 6-8. This guideline describes how to select curve geometries that help drivers maintain proper lane position, speed, and lateral control through curves. It includes quantitative guidance on curvature, spiral length, and reverse curves.
- Pavement Surface Countermeasures to Improve Curve Delineation, 6-10. This guideline describes how pavement markings can help driver performance in curves maneuvers. It includes guidance on edge and center lines, raised reflective pavement markers, and markers on signs.
- Warning Signs on Horizontal Curves, 6-12. The key to effective curve negotiation is to notify the driver of the upcoming curve so that the driver can change the speed or path of the vehicle. This guideline summarizes research results on sign placement, chevrons, flashers, and dynamic message signs.
Chapter 7: Grades (Vertical Alignment)
- Design Considerations for Turnouts on Grades, 7-2. Turnouts are widened, unobstructed shoulder areas that allow slow-moving vehicles to pull out of the through lane, providing passing opportunities for following vehicles. This guideline provides design guidance for the use of signs, sight distance, entry speed, and exits for turnouts on grades.
- Geometric and Signing Considerations to Support Effective Use of Truck Escape Ramps, 7-4. The AASHTO Green Book has comprehensive guidance for the design and location of emergency escape ramps. This guideline emphasizes key aspects from the AASHTO Green Book and adds additional guidance from other sources.
- Preview Sight Distance and Grade Perception at Vertical Curves, 7-6. Preview sight distance applies to horizontal curves near the top of crest vertical curves or at the bottom of sag vertical curves, where the horizontal curve is initially out of the driverʼs line of sight. This guideline explains the need for preview sight distance and provides guidance on how to calculate it.
Chapter 8: Tangent Sections and Roadside (Cross Section)
- Task Analysis of Lane Changes on Tangent Sections, 8-2. This guideline identifies and analyzes the perceptual, cognitive, and psychomotor tasks that occur before and during a lane change, estimating workload levels for various activities.
- Overview of Driver Alertness on Long Tangent Sections, 8-4. Fatigue is a combination of boredom, sleep disruption, and other factors that reduce vigilance. Although data are not definitive on the relationship between the length of a tangent and the fatigue-related crash risk, this guideline explains how to break the monotony, such as adding visual complexity, or provide countermeasures, such as shoulder rumble strips.
Chapter 9: Transition Zones Between Varying Road Designs
- Perceptual and Physical Elements to Support Rural-Urban Transitions, 9-2. This guideline deals with transitions between rural and more densely settled areas. In addition to traffic signs, it discusses measures such as geometric design changes, road surface treatments, and roadside features to slow vehicles as they enter a town along an otherwise rural highway.
Chapter 10: Non-Signalized Intersections
- Acceptable Gap Distance, 10-2. The acceptable gap is the minimum vehicle-to-vehicle time typically accepted by drivers turning from a minor road to a major road. This guideline gives values and rationales for the gaps required by different vehicles for left and right turns.
- Factors Affecting Acceptable Gap, 10-4. Driver age, wait time, direction of the turn, familiarity with the roadway, size of the oncoming vehicle, traffic volume, and headlight glare all affect acceptable gap size. This guideline discusses these factors and includes a task analysis of the steps involved in performing a turn across traffic onto a four-lane highway.
- Left-Turn Lanes at Non-Signalized Intersections, 10-6. This guideline explains how left-turn-lane length, storage length, and lane offset can affect crash risk. It provides principles for when to install a left-turn lane or increase overall turn-lane length or storage lengths to reduce rear-end crash risk. It also provides information about how positive lane offsets can improve sight distance to oncoming traffic.
- Sight Distance at Left-Skewed Intersections, 10-8. A driver at these intersections needs to look backward over their right shoulder and past parts of their own vehicle. This guideline presents the geometry and provides tables to calculate the available sight distance from the skew angle, setback distance, and properties of typical vehicles.
- Sight Distance at Right-Skewed Intersections, 10-10. The vision of a driver at these intersections is limited by their ability to turn their eyes and neck to look backward over their left shoulder. This guideline presents the geometry and provides tables to calculate the available sight distance from the skew angle and setback distance, with special considerations for the restricted movement of older drivers.
Chapter 11: Signalized Intersections
- Engineering Countermeasures to Reduce Red Light Running, 11-2. This guideline lists countermeasures related to traffic characteristics, signal operations, and motorist information that have been shown to reduce red light running.
- Restricting Right Turns on Red to Address Pedestrian Safety, 11-4. This guideline describes when right turn on red movements need to be restricted to protect pedestrians. It summarizes research on signage and geometry treatments that increase safety.
- Heuristics for Selecting the Yellow Timing Interval, 11-6. This guideline contains formulas for calculating the duration of the yellow interval and the red clearance time. It also discusses the decisions and actions of drivers faced with the “dilemma zone.”
- Countermeasures for Improving Accessibility for Visually Impaired Pedestrians at Signalized Intersections, 11-8. Accessible pedestrian signals and curb treatments improve the ability of vision-impaired pedestrians to cross at signalized intersections. This guideline provides guidance on the location and design of curb ramps, signal timing, and push buttons.
- Countermeasures to Reduce Left-Turn Crashes During Permissive Phases, 11-10. This guideline describes two key countermeasures to reduce left-turn crashes during permissive phases: (1) a flashing yellow arrow to improve driver understanding of the permissive indication and (2) an offset left-turn lane to improve sight distance for left-turning drivers.
Chapter 12: Roundabouts
- Reducing Vehicle Speeds Approaching Roundabouts, 12-2. Reducing vehicle speeds approaching roundabouts provides more time for drivers to react to the presence of pedestrians and bicyclists crossing at or traveling through the roundabout and may reduce the incidence of run-off-road crashes. This guideline provides countermeasures for reducing vehicle speeds at roundabouts.
- Increasing Driver Yielding Rates for Pedestrians at Roundabouts, 12-4. Because of competing tasks, attentional demands, and limited sight distance, drivers are not always aware of crossing pedestrians when the vehicle is entering or exiting the roundabout. This guideline describes countermeasures that can increase driver yielding rates for pedestrians at roundabouts.
- Countermeasures for Improving Accessibility for Visually Impaired Pedestrians at Roundabouts, 12-6. This guideline identifies countermeasures for improving accessibility for visually impaired pedestrians at roundabouts. It describes the implementation of auditory cues and tactile features that support traversing crosswalks at roundabouts without visual information.
- Accommodations for Bicyclists at Roundabouts, 12-8. Vehicle-bicycle collisions generally involve a vehicle entering or exiting a roundabout where cyclists are circulating. Reducing speeds and improving bicyclist conspicuity can reduce these crashes. This guideline describes strategies for implementing bicycle lanes and lane markings to increase visibility and conspicuity of bicyclists in roundabouts.
- Guide Signing at Roundabouts, 12-10. Advance-destination guide signs assist drivers in determining, prior to entering the roundabout, which lane to travel in and where to exit the roundabout, allowing them to focus more attention on the driving task and less attention on wayfinding. This guideline describes designing for guide signs that effectively presents this information to drivers.
- Roundabout Lighting, 12-12. Lighting is used both to enhance the visibility of a roundabout from a distance and to improve the perception of the layout and visibility of other users for the driver during hours of low light and darkness. This guideline describes when, where, and how to effectively implement lighting strategies into roundabout designs.
Chapter 13: Interchanges
- Task Analysis of Driver Merging Behavior at Freeway Entrance Ramps, 13-2. This guideline lists the steps followed by a driver while merging to a freeway and discusses the challenges of each step. Differences between light and heavy traffic and between older and younger drivers are noted.
- Reducing Wrong-Way Entries onto Freeway Exit Ramps, 13-4. This guideline covers treatments to reduce the frequency of drivers entering freeways by using the exit ramps. It can be used to identify appropriate countermeasures for visibility, signing, and road geometry.
- Driver Expectations at Freeway Lane Drops and Lane Reductions, 13-6. Lane drops may violate driver expectations and cause confusion when the driver expects the lane to continue. This guideline describes visual, geometric, and signing principles to prepare drivers for lane drops and reductions.
- Driver Information Needs at Complex Interchanges, 13-8. Complex interchanges should be designed to give drivers the information they need and expect. Use this guideline to identify specific features of geometric elements, signing, and sight distance that can be used to minimize violations of driver expectations.
- Arrow-per-Lane Sign Design to Support Driver Navigation, 13-10. Destination information and sign design must allow drivers to pair the destination with an arrow that points to a particular lane. This guideline helps designers avoid pitfalls associated with sign placement and how information is presented on a sign.
- Driver Behavioral Trends Based on Exit Ramp Geometry, 13-12. Well-designed exit ramps support the intended behaviors of an exiting driver. This guideline itemizes the steps a driver performs in a safe exit and discusses how drivers use the available taper and deceleration lane.
Part IV Special Design Considerations
Chapter 14: Speed Perception, Speed Choice, and Speed Control
- Behavioral Framework for Speeding, 14-2. This guideline provides an overview of the key factors relevant to speed selection. It includes a comprehensive list of the many situational, demographic, and environmental factors that can contribute to driversʼ decisions about speeding, and identifies the many studies that have aided our understanding of speeding.
- Speed Perception and Driving Speed, 14-4. While a direct measure of speed is available from the speedometer, drivers rely on a number of cues for their sense of speed. This guideline discusses how various cues can cause drivers to overestimate or underestimate their own or another vehicleʼs speed.
- Effects of Roadway Factors on Speed, 14-6. Geometric factors affect the free-flow speed. Use this guideline to learn which factors have proven effects on speed on rural highways and urban streets.
- Effects of Posted Speed Limits on Speed Decisions, 14-8. Advisory speeds have at best a modest effect on speed, particularly for drivers familiar with the road. This guideline discusses light-vehicle driver compliance with posted speed limits on non-limited access rural and urban highways.
- Speed Management, 14-10. This guideline provides an overview of the comprehensive strategy that addresses all factors that influence speeding behavior, including speed limits, roadway designs, traffic control, enforcement, and public awareness.
- Speeding Countermeasures: Setting Appropriate Speed Limits, 14-12. This guideline discusses how to set an appropriate speed limit accounting for the unique traffic, design, and environmental aspects of a roadway. It includes standard conditions, variable speed limits, and heavy truck traffic.
- Speeding Countermeasures: Communicating Appropriate Speed Limits, 14-14. This guideline discusses best practices for communicating posted speed limits to drivers and explains when to use approaches such as redundant signs, active speed warning, and in-pavement measures.
- Speeding Countermeasures: Using Roadway Design and Traffic Control Elements to Address Speeding Problems, 14-16. Geometric elements and traffic control devices both affect speed-related crashes. Like the others in this chapter, this guideline should be used in consultation with the original NCHRP reports for a full appreciation of the factors.
Chapter 15: Special Considerations for Urban Environments
- Methods to Increase Driver Yielding at Uncontrolled Crosswalks, 15-2. Uncontrolled crosswalks are those without regular signals to control traffic, though they might have a pedestrian-actuated half signal or HAWK (high-intensity activated crosswalk) signal. Use this guideline to learn how to improve sight lines and convey to drivers the need to look for pedestrians.
- Methods to Increase Compliance at Uncontrolled Crosswalks, 15-4. This guideline discusses several treatments available for uncontrolled crosswalks and provides statistics for driver and pedestrian compliance with each.
- Methods to Reduce Driver Speeds in School Zones, 15-6. Traffic control devices and pavement markings are used to encourage drivers to slow for school zones. This guideline summarizes research on a variety of methods for reducing speeds.
- Signage and Markings for High Occupancy Vehicle (HOV) Lanes, 15-8. Signage is necessary to inform drivers of lanes in congested areas that are reserved for HOVs. This guideline summarizes research on how to word and place signs and markings to maximize understanding by drivers and minimize crashes.
- Sight Distance Considerations for Urban Bus Stop Locations, 15-10. Bus stops can be located immediately before an intersection (near-side stop), after an intersection (far-side stop) or midblock. This guideline discusses relative advantages and disadvantages of each location with respect to sight distance and pedestrian traffic conflicts.
- General Design Considerations for Urban Bus Stops, 15-12. This guideline provides an overview of safety performance at bus stops and discusses some roadway treatments that can be used to increase safety at or near bus stops.
Chapter 16: Complete Streets
- Complete Streets Overview and Heuristics, 16-2. This guideline provides an overview of the Complete Streets concept and a description of key elements as these elements relate to human factors topics.
- Complete Streets and Similar Initiatives, 16-4. This guideline discusses the main themes of Complete Streets, the relationship between Complete Streets, Context Sensitive Solutions (CSS), and the Safe System Approach (SSA).
- A Framework for Selecting Complete Streets Implementations,16-6. This guideline provides a framework and process for implementing Complete Streets based on the FHWAʼs Safe System Design Hierarchy.
- A Framework for Complete Streets Evaluations, 16-8. This guideline provides a framework, metrics, and specific questions that can be used to assess Complete Streets implementations.
- Key References for Complete Streets Design Information, 16-10. This guideline provides a summary of key reference sources to help practitioners find Complete Streets guidance relevant to their project.
Chapter 17: Special Considerations for Rural Environments
- Passing Lanes, 17-2. A passing lane is a lane added in one or both directions of travel on a two-lane, two-way highway to improve passing opportunities. Recommended lengths and spacing of passing lanes are provided for various conditions, and signage is discussed.
- Countermeasures for Pavement/Shoulder Drop-Offs, 17-4. This guideline provides maximum vertical drop-off heights as a function of lane width. If vertical pavement edges are less than the recommended heights or if they are beveled as recommended, then drivers who inadvertently drift over the edge and on to the shoulder can more safely return to the roadway.
- Rumble Strips, 17-6. Shoulder rumble strips are a narrow line of indentations in the pavement immediately outside the traveled way, alerting drowsy drivers who drift out of their lane. This guideline lists levels of various sounds in a vehicle and recommends values for the shape and location of rumble strips.
- Design Consistency in Rural Driving, 17-8. Drivers generally make fewer errors when geometric features are predictable and consistent with their expectations. A list of design factors that should be considered during a design consistency review is presented.
Chapter 18: Construction and Work Zones
- Overview of Work Zone Crashes, 18-2. This guideline characterizes work zone crashes and provides a framework for work zone design. It specifies the need for additional driver guidance in work zones based on the number, type and severity of crashes occurring in work zones.
- Procedures to Ensure Proper Arrow Panel Visibility, 18-4. Arrow panels are used ahead of work zones to inform drivers of the need to move out of a closed lane. This guideline has values for the use, intensity, and position of flashing arrow panels.
- Changeable Message Signs, 18-6. This guideline has principles for keeping messages terse and legible so their information can be quickly processed by drivers.
- Sign Legibility, 18-8. A number of design characteristics of work zone signs contribute to driversʼ ability to perceive and understand a signʼs message. This guideline explains factors that determine signsʼ legibility including retroreflectivity (sheeting type), color, letter font, and location (roadside or overhead).
- Determining Work Zone Speed Limits, 18-10. Speed limits are reduced in work zones to maintain safe traffic flow. This guideline provides results from crash studies on what speed limit reductions are most desirable. It also discusses how lane width, speed displays, and the amount of reduction itself affect the mean and variance of actual traffic speed.
Chapter 19: Rail-Highway Grade Crossings
- Task Analysis of Rail-Highway Grade Crossings, 19-2. This guideline addresses the key factors found to affect driver decisions whether to obey control devices at grade crossings. Many of the factors are covered in more detail in the following guidelines.
- Driver Information Needs at Passive Rail-Highway Grade Crossings, 19-4. This guideline covers the information that drivers need at grade crossings not protected by gates or lights. It explains what is required beyond the traditional crossbuck.
- Timing of Active Traffic Control Devices at Rail-Highway Grade Crossings, 19-6. This guideline has quantitative recommendations on the time that should elapse between the initiation of the flashing light and the arrival of the train. It discusses driver expectations and behaviors observed at crossings for a range of delays.
- Four-Quadrant Gate Timing at Rail-Highway Grade Crossings, 19-8. This guideline discusses the time interval between the entrance gateʼs beginning to descend and the exit gateʼs beginning to descend. Use it to find formulas and standards to calculate the interval.
- Countermeasures to Reduce Gate-Rushing at Crossings with Two-Quadrant Gates, 19-10. This guideline discusses countermeasures against driving under or around gates at
- grade crossings. They include physical barriers (four-quadrant gates or centerline barriers prior to the gate), engineering changes to improve the credibility of warning devices, and wayside horns.
- Human Factors Considerations in Traffic Control Device Selection at Rail-Highway Grade Crossings, 19-12. This guideline discusses factors to consider when selecting a yield sign, stop sign, or active control at a grade crossing.
Chapter 20: Lighting
- Countermeasures for Mitigating Headlamp Glare, 20-2. Glare occurs when the intensity of a light source is greater than the adaptation level to the surrounding view. This guideline discusses approaches to reducing glare from other vehiclesʼ headlamps.
- Nighttime Driving, 20-4. Visibility at night in rural areas is limited by the lack of ambient light, the reach of headlamps, and the minimal contrast of persons and objects in the roadway. This guideline lists the respective benefits and suggested conditions for using seven treatments, ranging from continuous lighting to advance warning signs.
- Daytime Lighting Requirements for Tunnel Entrance Lighting, 20-6. Lighting at tunnel entrances requires special consideration because of the contrast between illumination inside the tunnel and the surroundings. This guideline provides recommendations for minimum lighting, the spacing and direction of lights within the tunnel, and treatments outside the entrance.
- Countermeasures for Improving Pedestrian Conspicuity at Crosswalks, 20-8. This guideline contains information on the effective use of flashing lights mounted to a crosswalk sign, the pole supporting the sign, or the pavement.
- Characteristics of Lighting that Enhance Pedestrian Visibility, 20-10. This guideline addresses the positioning and spectral content (i.e., kind of light) of luminaires to enhance the visibility of pedestrians. The discussion includes colors of clothing and function of the eye.
- Characteristics of Effective Lighting at Intersections, 20-12. This guideline provides principles for improving nighttime visibility of pedestrians, vehicles, roadway features, and obstacles at intersections. It recommends illuminance values and luminaire placement.
Part V Human Factors Guidance for Traffic Engineering Elements
Chapter 21: Signing
- General Principles for Sign Legends, 21-2. Sign legends (the text and symbols on a sign) must be short and simple to maximize driver comprehension. Use this guideline for information on the content of common signs and on the distance ahead of a decision point where a sign should be placed.
- Sign Design to Improve Legibility, 21-4. Signs must be designed so that the text is legible. This guideline summarizes research on characteristics including the color, size, and style of letters, with special considerations for older drivers and nighttime visibility.
- Conspicuity of Diamond Warning Signs under Nighttime Conditions, 21-6. A critical factor in the driverʼs ability to see, locate, and comprehend warning signs at night is to maximize sign conspicuity relative to surrounding background elements. This guideline provides desirable characteristics about the sign itself and its environment to improve its conspicuity.
- Driver Comprehension of Signs, 21-8. There are three stages of comprehension—legibility, recognition, and interpretation. This guideline explains when to use text, icons, and a combination of the two, and other ways to maximize comprehension.
- Complexity of Sign Information, 21-10. The complexity of sign information refers to the number of information units (words or numbers) in the message on a roadway sign. This guideline gives
- comprehension rates and reading times for messages of different complexity and explains when short (sometimes only one word) messages are important.
Chapter 22: Changeable Message Signs
- When to Use Changeable Message Signs, 22-2. Changeable message signs (CMSs) allow for the display of time-sensitive or temporary information that affects travel and, in many cases, requires drivers to take an action. This guideline provides general principles for when to use CMSs and how to maintain their credibility.
- Presentation to Maximize Visibility and Legibility, 22-4. This guideline discusses lighting and shape characteristics of CMSs to maximize their readability. It contains the results of research on the contrast ratio, luminance, character spacing, and dot matrix size, noting differences for older drivers and nighttime conditions.
- Determining Appropriate Message Length, 22-6. Messages must be short enough that drivers can comprehend them in the limited time they have while passing the sign. This guideline includes recommendations and quantitative research on the length, content, and arrangement of messages and placement of the changeable message sign.
- Composing a Message to Maximize Comprehension, 22-8. The way a message is worded and formatted can significantly affect the ability of a driver to comprehend it. Guidance on abbreviations, date format, and word choice is provided.
- Displaying Messages with Dynamic Characteristics, 22-10. This guideline has formulas for the timing of messages and the blank intervals between them. It also explains how some attempts to draw driversʼ attention can increase reading time.
- Changeable Message Signs for Speed Reduction, 22-12. CMSs can be used to alert drivers to the need to reduce their speed for temporary conditions such as work zones, adverse weather, incidents, or heavy congestion. This guideline provides principles on the wording and placement of CMSs to achieve speed reductions.
- Presentation of Bilingual Information, 22-14. Bilingual information may be required in areas with culturally diverse populations or heavy international tourism; however, bilingual signs must be used cautiously because they can increase the reading time of both monolingual and bilingual drivers. This guideline discusses ways to distinguish the two languages.
Chapter 23: Markings
- Visibility of Lane Markings, 23-2. Lane markings help drivers align their vehicle with the lane. This guideline discusses preview time and the use of peripheral vision, the required luminance of the markings, and the width of the stripe.
- Effectiveness of Symbolic Markings, 23-4. Horizontal signing is sign text painted on the roadway. This guideline explains how these markings can alert drivers to speed reductions for horizontal curves or to impending lane drops, and prevent wrong-way movements.
- Markings for Pedestrian and Bicyclist Safety, 23-6. These markings encourage safe practices of motor vehicles, pedestrians, and bicyclists. The guideline has a table for which roads are candidates for marked crosswalks, and it summarizes research on markings for shared bicycle lanes.
- Post-Mounted Delineators, 23-8. Post-mounted delineators are a series of retroreflective marking devices above the pavement surface to indicate alignment. They are useful when the alignment might be confusing or unexpected. This guideline provides recommendations for delineator use, including spacing.
- Markings for Roundabouts, 23-10. This guideline covers pavement markings at the entrances and exits of roundabouts. Refer to it for suggestions on lighting, pavement marking, spacing, stopping sight distances, and accommodations for bicyclists and pedestrians.
Part VI Human Factors Guidance for Vulnerable and Older Road Users
Chapter 24: Pedestrians
- Task Analysis of Pedestrian Crossing in a Multiple-Threat Scenario, 24-2. In the multiple-threat scenario, a pedestrian crossing in front of a stopped vehicle is at risk of being struck by a second vehicle traveling in the adjacent lane. This guideline shows the interactions that can take place between pedestrians and drivers and countermeasures for reducing conflicts in this scenario.
- Countermeasures to Reduce Pedestrian Exposure to Vehicles at Crossings, 24-4. This guideline addresses road treatments that provide some level of physical protection from surrounding traffic and/or reduce the time required to cross the street. It summarizes the conditions of use and the effects that can be expected when using these countermeasures.
- Speed-Calming Countermeasures at Crosswalks, 24-6. Excessive vehicle speed puts pedestrians at risk because it is harder for drivers to perceive, react, and stop for pedestrians. This guideline provides information about common countermeasures for reducing vehicle speeds when approaching crosswalks.
- Increasing Pedestrian Visibility and Conspicuity at Crosswalks, 24-8. This guideline provides countermeasures that increase driver awareness of the crosswalk, draw attention to pedestrians, and make pedestrians easier to detect. It emphasizes countermeasures that improve lines of sight between vehicles and pedestrians and focuses driversʼ attention on the crosswalk.
- Selecting Beacons to Increase Pedestrian Conspicuity at Crosswalks, 24-10. Pedestrian Hybrid Beacons (PHB) or Rectangular Rapid Flashing Beacons (RRFB) are effective countermeasures for alerting drivers to the presence of pedestrians in the crosswalk. This guideline provides a heuristic for selecting between PHBs or RRFBs at an uncontrolled, marked midblock crosswalk.
- Influence of the Built Environment on Pedestrian Crossing Safety, 24-12. Characteristics of the built environment contribute to the likelihood of a pedestrian-vehicle collision. This guideline highlights factors in the surrounding environment that have the largest influence on safety and provides recommended countermeasures.
- Design Challenges for Older Pedestrians, 24-14. This guideline contains special considerations for designing pedestrian crossings that help older pedestrians with physiological and/or cognitive, age-related impairments to cross the street in a timely manner. These pedestrians face a diverse set of challenges, in terms of roadway safety, that may not be fully addressed by standard design practices.
- Pedestrian Rail Crossing Safety, 24-16. Though rare, pedestrian-rail crashes are generally caused by pedestrians ignoring warnings, possibly due to inattentiveness, lack of situational awareness, or direct disobedience in order to catch a train. This guideline provides potential countermeasures to address many different crossing situations.
- Key References for Pedestrian Crossing Safety Countermeasures, 24-18. There are numerous resources available to aid in the selection of countermeasures at pedestrian crossing locations that experience an unacceptable number of crashes. This guideline summarizes key resources available for finding information about countermeasures that improve pedestrian safety.
Chapter 25: Bicyclists
- Signals and Signal Timing for Bicycles at Intersections, 25-2. Design for traffic signals at intersections are generally determined by motor vehicle use, which creates problems for bicyclists because they have different operating characteristics and needs. This guideline discusses signal timing and design countermeasures that can minimize conflicts with motor vehicles.
- Markings for Bicycles at Intersections, 25-4. This guideline discusses intersection lane marking countermeasures that can minimize conflicts with motor vehicles. Bicyclists are particularly vulnerable at intersections because they are less visible due to their size, and
- crashes can be severe because of lack of protective structures and low mass relative to motor vehicles.
- Bicycle Lanes, 25-6. Designated bicycle lanes can encourage safety by separating motor vehicles from bicycles and increase motor vehicle driversʼ awareness by indicating where they can expect bicyclists to be traveling. This guideline discusses methods for maximizing safety and reducing potential traffic impacts when designing bicycle lanes.
- Separated Bicycle Lanes, 25-8. Separated bicycle lanes are one or two-way exclusive bikeways parallel to the roadway yet physically separated from moving traffic. They can provide increased safety and comfort for bicyclists in areas with higher traffic volumes and speeds. This guideline discusses strategies for implementing separated bike lanes.
- Contraflow Bicycle Lanes, 25-10. Contraflow bicycle lanes are installed on the left side of a one-way street in situations where travel in a with-flow bike lane would result in substantial out-of-direction travel or reduced access. This guideline discusses methods for maximizing bicyclist safety and reducing potential traffic conflicts when designing contraflow bicycle lanes.
- Shared Use Lanes, 25-12. This guideline discusses methods for maximizing safety and reducing potential traffic impacts when designing shared use bicycle lanes. When shared use lanes are supplemented with shared lane markings, bicycle traffic on the street is legitimized and motor vehicle drivers are alerted to the potential presence of bicyclists.
- Shared Bus-Bicycle Lanes, 25-14. Increasingly, cities across the U.S. are implementing shared bus-bicycle lanes to improve multimodal mobility. This guideline provides recommendations for designing bus-bicycle shared lanes that can help mitigate safety challenges associated with differences and interactions between buses and bicycles, particularly at and around bus stops.
- Mitigating Heavy-Vehicle Conflicts with Bicycles, 25-16. Heavy vehicle blind zones and reliance on mirrors for visibility make it difficult for heavy vehicle drivers to see bicyclists, while bicyclists are often unaware of these visibility challenges and engage in unsafe maneuvers. This guideline provides recommendations for road designs that help to mitigate heavy vehicle conflicts with bicycles.
Chapter 26: Older Road Users
- Older Driver Crash Risk, Crash Causation Factors, and Fitness to Drive, 26-2. This guideline provides an overview of older driver crash statistics, configurations and characteristics, and describes how changes in driversʼ functional capabilities as they age contribute to reduced capacity to meet the demands of the driving task.
- Older Driver Considerations for Markings, Signs, and Lighting, 26-4. This guideline discusses road-based countermeasures with respect to markings, signs, and lighting to help support older drivers and the unique challenges they may face when navigating their environment.
- Older Driver Considerations for Curves and Merging Behavior, 26-6. Curves and requirements to merge into a traffic stream present some of the most challenging environments to navigate for older drivers. This guideline provides recommendations for implementing countermeasures specific to curves and merging into traffic to help older drivers more safely navigate changing lanes and fast-moving roads such as interchanges.
- Older Driver Considerations for Work Zones – Signs, 26-8. Construction and work zones are important to consider with respect to aging driver needs because of their potential to violate driver expectancy. This guideline discusses the challenges older drivers face when navigating construction/work zones, as well as countermeasures specific to signing and advance warning and portable CMSs.
- Older Driver Considerations for Work Zones – Markings and Channelization, 26-10. This guideline provides recommendations with respect to temporary pavement markings, delineation of crossovers/alternate travel paths, and channelization/path guidance and ways that they can benefit visibility and driver performance for older drivers.
- Older Driver Considerations for Intersections – Left Turns, 26-12. Intersections, and particularly left turns, pose a safety problem for older drivers because of the need for rapid decision making, quick reactions, and accurate judgments of speed-distance relationships, all of which are generally more difficult as people age. This guideline discusses the challenges of navigating intersections and left turns along with road-based mitigation strategies specific to dedicated left-turn lanes and channelization, protected left-turn signal phasing, and intersection angle.
- Older Driver Considerations for Intersections – Roundabouts, 26-14. Roundabouts can help reduce the frequency and severity of crashes at intersections and can meet an extensive range of traffic conditions because they are adaptable in size, shape, and design. This guideline provides recommendations regarding the number of lanes, pedestrian crossings, splitter and central islands, and signs to support older drivers and pedestrians navigating through roundabouts.
- Older Driver Considerations for Intersections – Signs, 26-16. Revisions to traffic engineering elements can be made to assist older individuals in navigating intersections more comfortably. This guideline discusses road-based mitigation strategies specific to signs – such as size, placement, brightness, and redundancy – at intersections.
- Older Driver Considerations for Intersections – Pavement Markings and Signals, 26-18. This guideline provides recommendations specific to pavement markings and signals at intersections and ways they can be used to improve the visibility and conspicuity of various roadway elements for older drivers.
Tutorials
Tutorials are provided in Chapter 27 of the HFG and address important topics, special issues, and detailed procedures that cannot be provided within the two-page constraints of individual guidelines.
Other Features
Chapter 28 provides a list of references used in the HFG. A Glossary is provided in Chapter 29. Technical words and phrases are defined in the Glossary and listed in the Index (Chapter 30). Abbreviations are provided in Chapter 31. Also, equations are listed sequentially in Chapter 32.
Additional Ways to Use the HFG
The HFG can also serve as means to enhance the diagnostic assessment and countermeasure selection processes as described in the Highway Safety Manual (AASHTO, 2010) as well as The Primer on the Joint Use of the Highway Safety Manual (HSM) and the Human Factors Guidelines (HFG) for Road Systems (Campbell et al., 2018). The Primer in particular presents extensive tutorials on ways to incorporate information in the HFG into the safety analysis process. The Primer provides several examples of how to conduct diagnostic assessment and to select countermeasures using both the HSM and the HFG together.
All of these tools can be used to implement Safe System principles. The SSA does not accept that death and serious injury are natural consequences of using a road system, which informs its approach to creating a road environment that maximizes safety performance (see also Finkel et al., 2020; Signor et al., 2018; Welle et al., 2018). But rather than relying primarily on improving human behavior, this approach seeks to plan, design, and operate a road system that recognizes humans make mistakes, have limited physiological abilities to safely negotiate complex situations, and have a limited tolerance of kinetic energy forces.
William Haddon developed the Haddon Matrix (see Haddon, 1972, 1980) to improve emergency responses for people injured in crashes and provides a technique and tool for looking at factors related to personal attributes, vehicle attributes, and environmental attributes before, during, and after an injury or death. The goal of applying this type of tool is to help the practitioner think about and list the individual road user, vehicle, and environment factors (and any possible interactions) that could contribute to driver confusion, misperceptions, high workload, distraction, or other problems and errors. Research studies and governmental investigations have applied the Haddon Matrix to roadway crash causation to generate ideas on crash prevention and countermeasure implementation.
Haddonʼs epidemiological view of injury (for a summary, see also National Committee for Injury Prevention and Control, 1989; and Haddon, 1972) outlines three phases:
- A pre-crash phase with those factors that influence whether a crash will occur and result in injuries,
- A crash event phase with those factors that influence injury severity during the crash event, and
- A post-crash phase with those factors that influence the survivability of the crash after the event.
Haddonʼs original matrix included examining contributory factors to these phases according to human, vehicle, environmental, and socioeconomic factors. To augment this approach, Milton and van Schalkwyk (personal communication, January 17, 2022) have developed a framework that considers all road users (e.g., the volume of biking and walking) and the supporting social safety environment. Consistent with the SSA, it includes user mix considerations and interactions between these factors (see also the human factors interaction matrix in Campbell et al., 2018). Table 2-1 shows a modified Haddon Matrix applied to crashes in the Safe System. The HFG can be used to provide knowledge and context for the traffic safety professional to use the modified Haddon Matrix, especially the “Human” column.
This modification of the original Haddon and Human Factor Interaction Matrices (from Campbell et al., 2018) aims to present a framework that more directly considers all road users and the supporting social safety environment. In doing so, these characteristics are highlighted to provide safety professionals an expanded view of the issues related to human factors within the SSA.
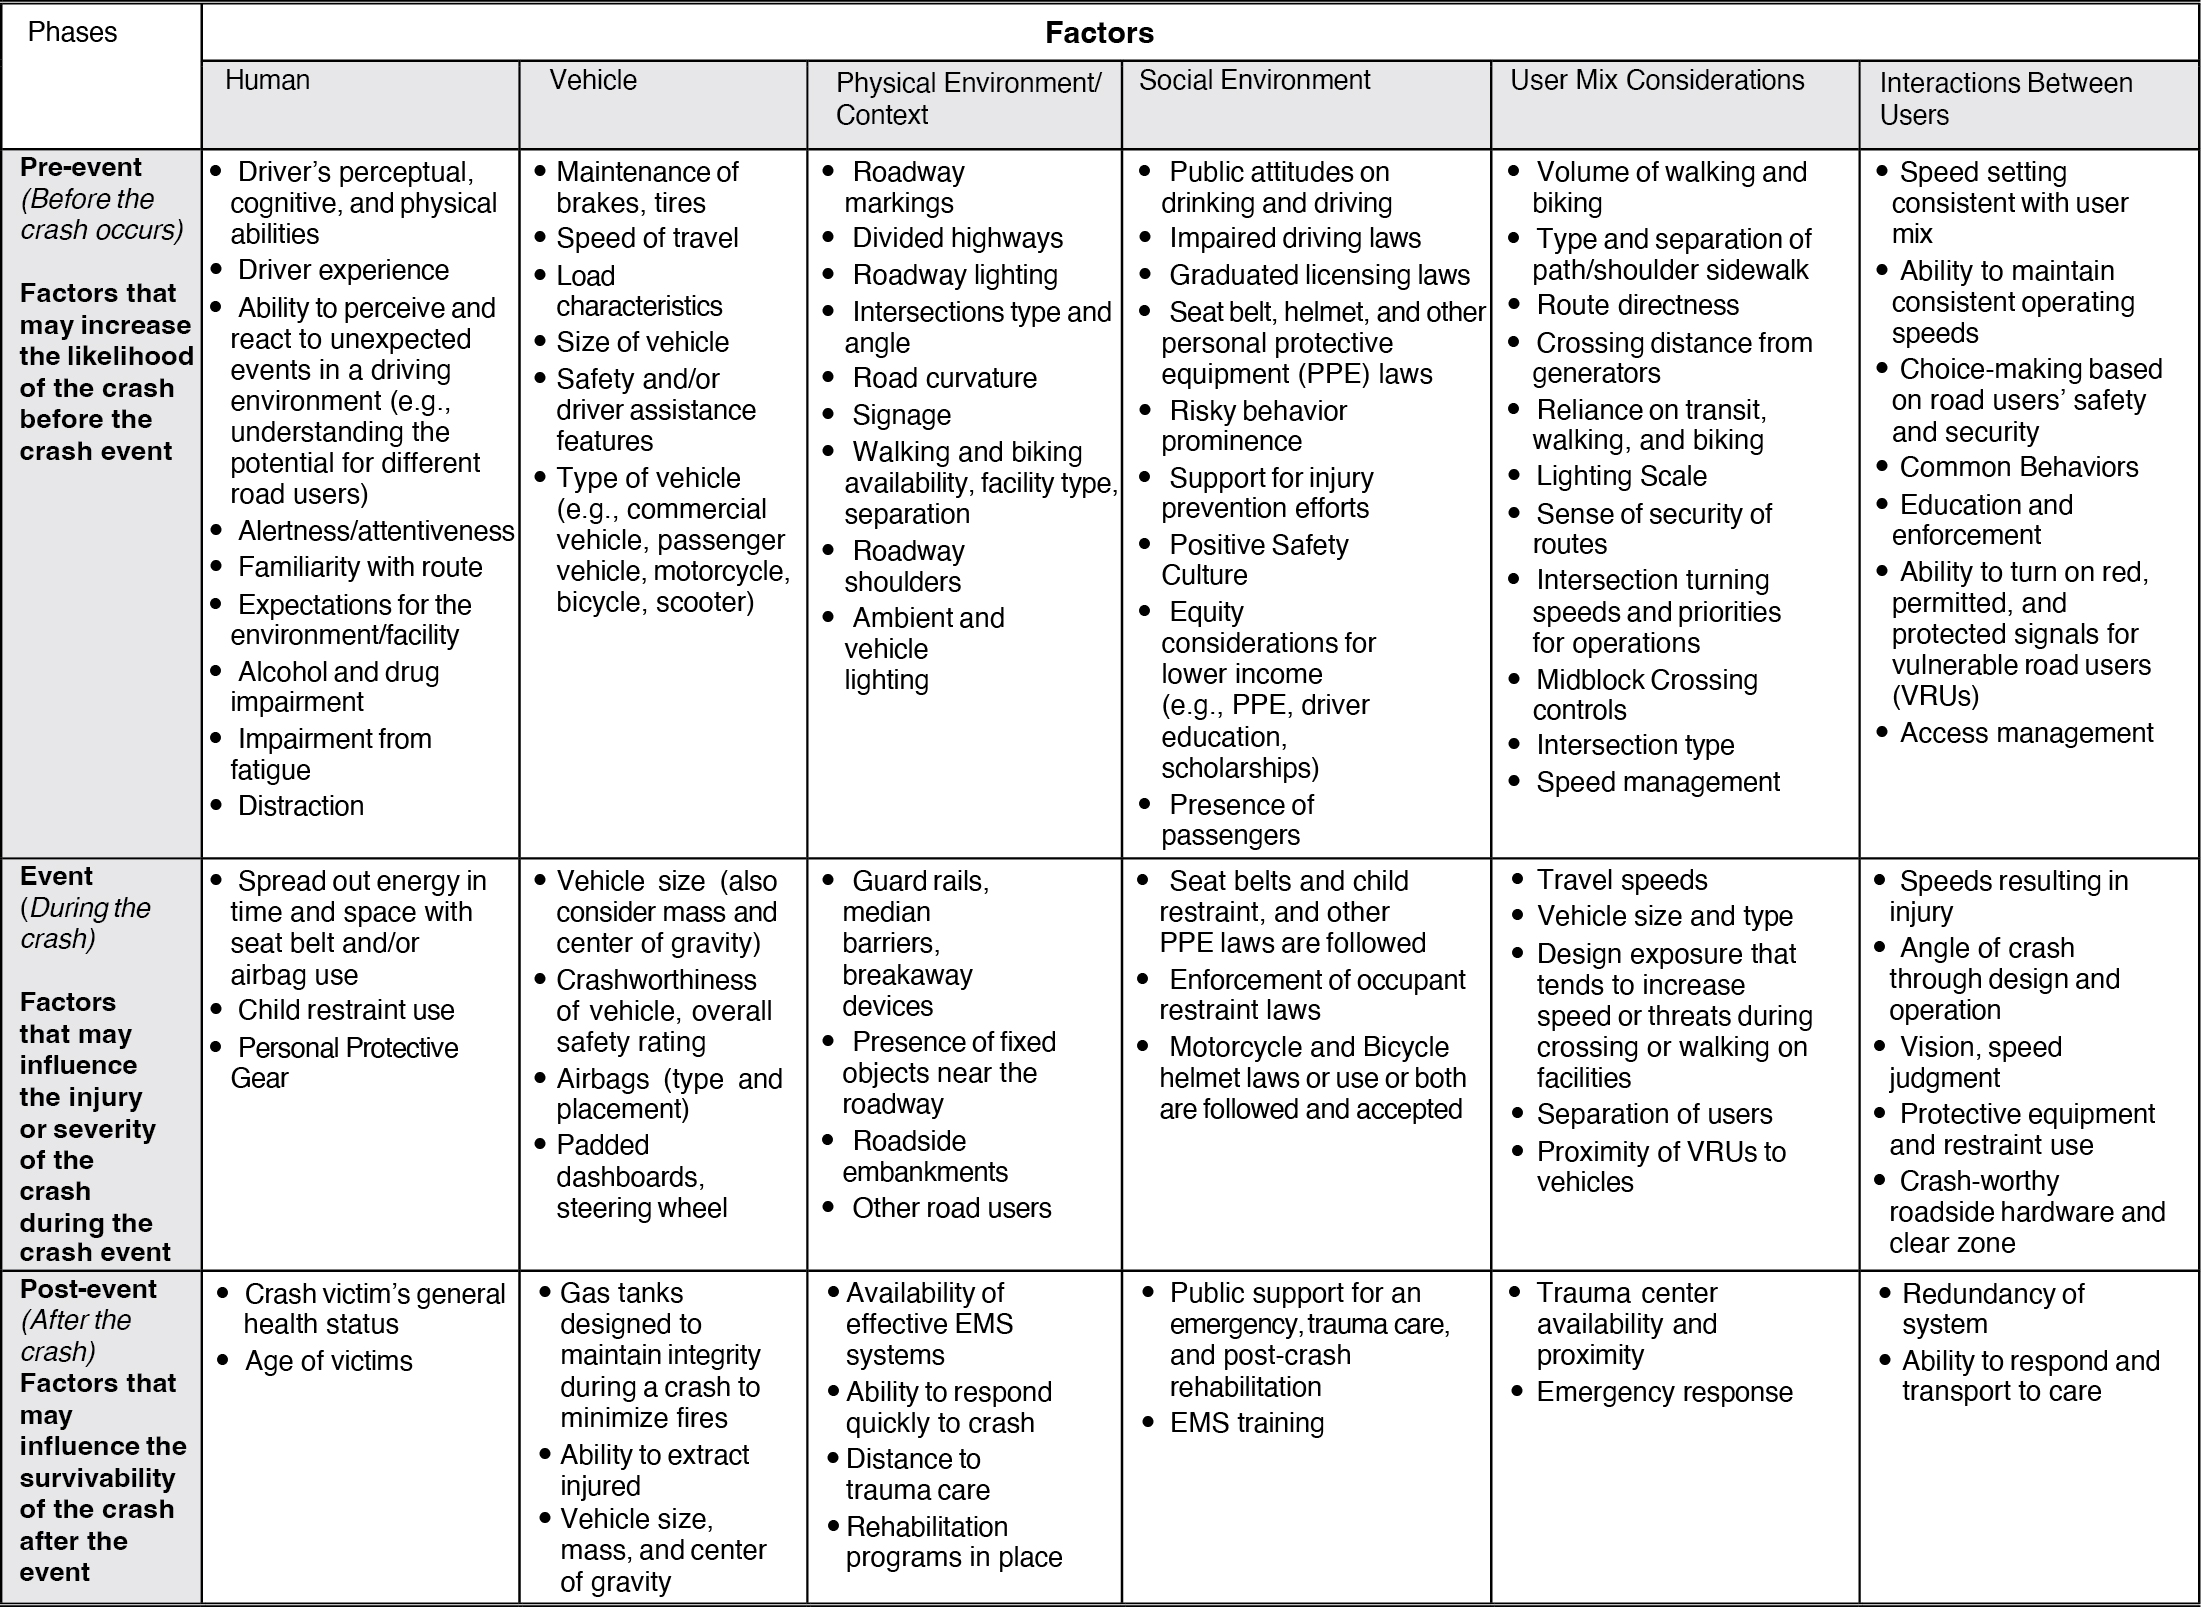
Long Description.
Column 1 lists Phases and columns 2 to 7 list Factors, the column headings for which are as follows: Column 2: Human. Column 3: Vehicle. Column 4: Physical Environment / Context. Column 5: Social Environment. Column 6: User Mix Considerations. Column 7: Interactions Between Users. The data for each row are as follows: Row 1, column 1: Pre-event (before the crash occurs) Factors that may increase the likelihood of the crash before the event. Column 2: Driver’s perceptual, cognitive, and physical abilities.. Driver experience. Ability to perceive and react to unexpected events in a driving environment (e.g., understanding the potential for different road users). Alertness/attentiveness. Familiarity with route. Expectations for the environment/facility. Alcohol and drug impairment. Impairment from fatigue. Distraction. Column 3: Maintenance of brakes, tires. Speed of travel. Load characteristics. Size of vehicle. Safety and/or driver assistance features. Type of vehicle (e.g., commercial vehicle, passenger vehicle, motorcycle, bicycle, scooter). Column 4: Roadway markings. Divided highways. Roadway lighting. Intersections type and angle. Road curvature. Signage. Walking and biking availability, facility type, separation. Roadway shoulders. Ambient and vehicle lighting. Column 5: Public attitudes on drinking and driving. Impaired driving laws. Graduated licensing laws. Seat belt, helmet, and other personal protective equipment (PPE) laws. Risky behavior prominence. Support for injury prevention efforts. Positive Safety Culture. Equity considerations for lower income (e.g., PPE, driver education., scholarships). Presence of passengers. Column 6: Volume of walking and biking. Type and separation of path/shoulder sidewalk. Route directness. Crossing distance from generators. Reliance on transit, walking, and biking. Lighting Scale. Sense of security of routes. Intersection turning speeds and priorities for operations. Midblock Crossing controls. Intersection type. Speed management. Column 7: Speed setting consistent with user mix. Ability to maintain consistent operating speeds. Choice-making based on road users’ safety and security. Common Behaviors. Education and enforcement. Ability to turn on red, permitted, and protected signals for vulnerable road users (VRUs). Access management. Row 2, Column 1: Event (During the crash) Factors that may influence the injury or severity of the crash during the crash event.. Column 2: Spread out energy in time and space with seat belt and/or airbag use. Child restraint use. Personal Protective Gear. Column 3: Vehicle size (also consider mass and center of gravity). Crashworthiness of vehicle, overall safety rating. Airbags (type and placement). Padded dashboards, steering wheel. Column 4: Guard rails, median barriers, breakaway devices. Presence of fixed objects near the roadway. Roadside embankments. Other road users. Column 5: Seat belts and child restraint, and other PPE laws are followed. Enforcement of occupant restraint laws. Motorcycle and Bicycle helmet laws or use or both are followed and accepted. Column 6: Travel speeds. Vehicle size and type. Design exposure that tends to increase speed or threats during crossing or walking on facilities. Separation of users. Proximity of VRUs to vehicles. Column 7: Speeds resulting in injury. Angle of crash through design and operation. Vision, speed judgment. Protective equipment and restraint use. Crash-worthy roadside hardware and clear zone. Row 3, Column 1: Post-event (After the crash) Factors that may influence the survivability of the crash after the event.. Column 2: Crash victim’s general health status. Age of victims. Column 3: Gas tanks designed to maintain integrity during a crash to minimize fires. Ability to extract injured. Vehicle size, mass, and center of gravity. Column 4: Availability of effective EMS systems. Ability to respond quickly to crash. Distance to trauma care. Rehabilitation programs in place. Column 5: Public support for an emergency, trauma care, and post-crash rehabilitation. EMS training. Column 6: Trauma center availability and proximity. Emergency response. Column 7: Redundancy of system. Ability to respond and transport to care.


