Human Factors Guidelines for Road Systems: Third Edition (2025)
Chapter: 16 Complete Streets

COMPLETE STREETS OVERVIEW AND HEURISTICS
Introduction
The core human factors concept of Complete Streets is to provide individuals with the ability to use both/either driving and non-driving modes to travel easily, efficiently, and safely. Complete Streets has several definitions (1), but key themes are shared across Complete Streets resources. The goal of Complete Streets is to develop an unbroken surface transportation network for multimodal connectivity (2) and consistently design and construct the right-of-way to accommodate all anticipated users (3). Not all modes need to be accommodated on all roads (1), but specific roads can be designated to emphasize different modes based on road type and community context (3) to achieve an unbroken network (1). The Complete Streets approach requires bicyclist and pedestrian accommodation within the network (2). Other modes may also be accommodated, including public transportation users, motorists, freight vehicles, emergency response vehicles, and equestrians (2, 3). Complete Streets policies and projects aim to provide safe use of roadway facilities for all users of the network, regardless of modality, age, and ability (1, 2, 3, 4). In 2018, this framework was updated to provide for a greater emphasis on equity and providing service in underinvested communities (e.g., improving access for individuals with disabilities) (5).
Complete Streets objectives apply not only to planning new projects but also to new and retrofit projects at the planning, design, maintenance (including resurfacing, repaving, restriping, and rehabilitation), and operation stages (3, 6, 7, 8). Complete Streets include the continuation of multimodal support during construction, repair work, special events, and inclement weather, for example, maintaining snow storage space that does not obstruct any one mode of transportation (1).
In contrast to traditional infrastructure planning and design practices, Complete Streets aims to balance how transportation needs of motorized and non-motorized users are weighted by lowering the priority of automobile-focused metrics, e.g., improving the level of service or reducing average daily traffic (ADT) (4, 8) and introducing and prioritizing metrics that reflect the safety, access, and mobility of multiple modes (1, 4).

Discussion
Benefits. Complete Streets projects are associated with increased property values and job growth (9) along the project corridors. Complete Streets projects can also increase bicycle and foot traffic, improve corridor safety, and improve bus travel times (see 10). In addition, multimodal connectivity provides individuals who are unable to drive with more transportation options and drivers with the option to use other modes of transportation (7).
Recommended approaches. Agency policies, procedures, and design guidelines should be written or adapted to serve all modes (8). Coalition building of government stakeholders and advocacy groups is a key step to policy implementation. Without regional and local buy-in, Complete Streets policy adoption may not translate into implemented projects (11). Running pilot programs may foster buy-in (11), and base data should be collected on all users and modes for meaningful before-and-after performance measures (8). Formalized policy adoption is useful as a tool to continue momentum, reinforce incremental change, and solidify progress (11). Policy adoption may also help facilitate training initiatives (12). Training or hiring staff skilled in multimodal accommodation is also recommended to improve the effectiveness of a Complete Streets initiative (8).
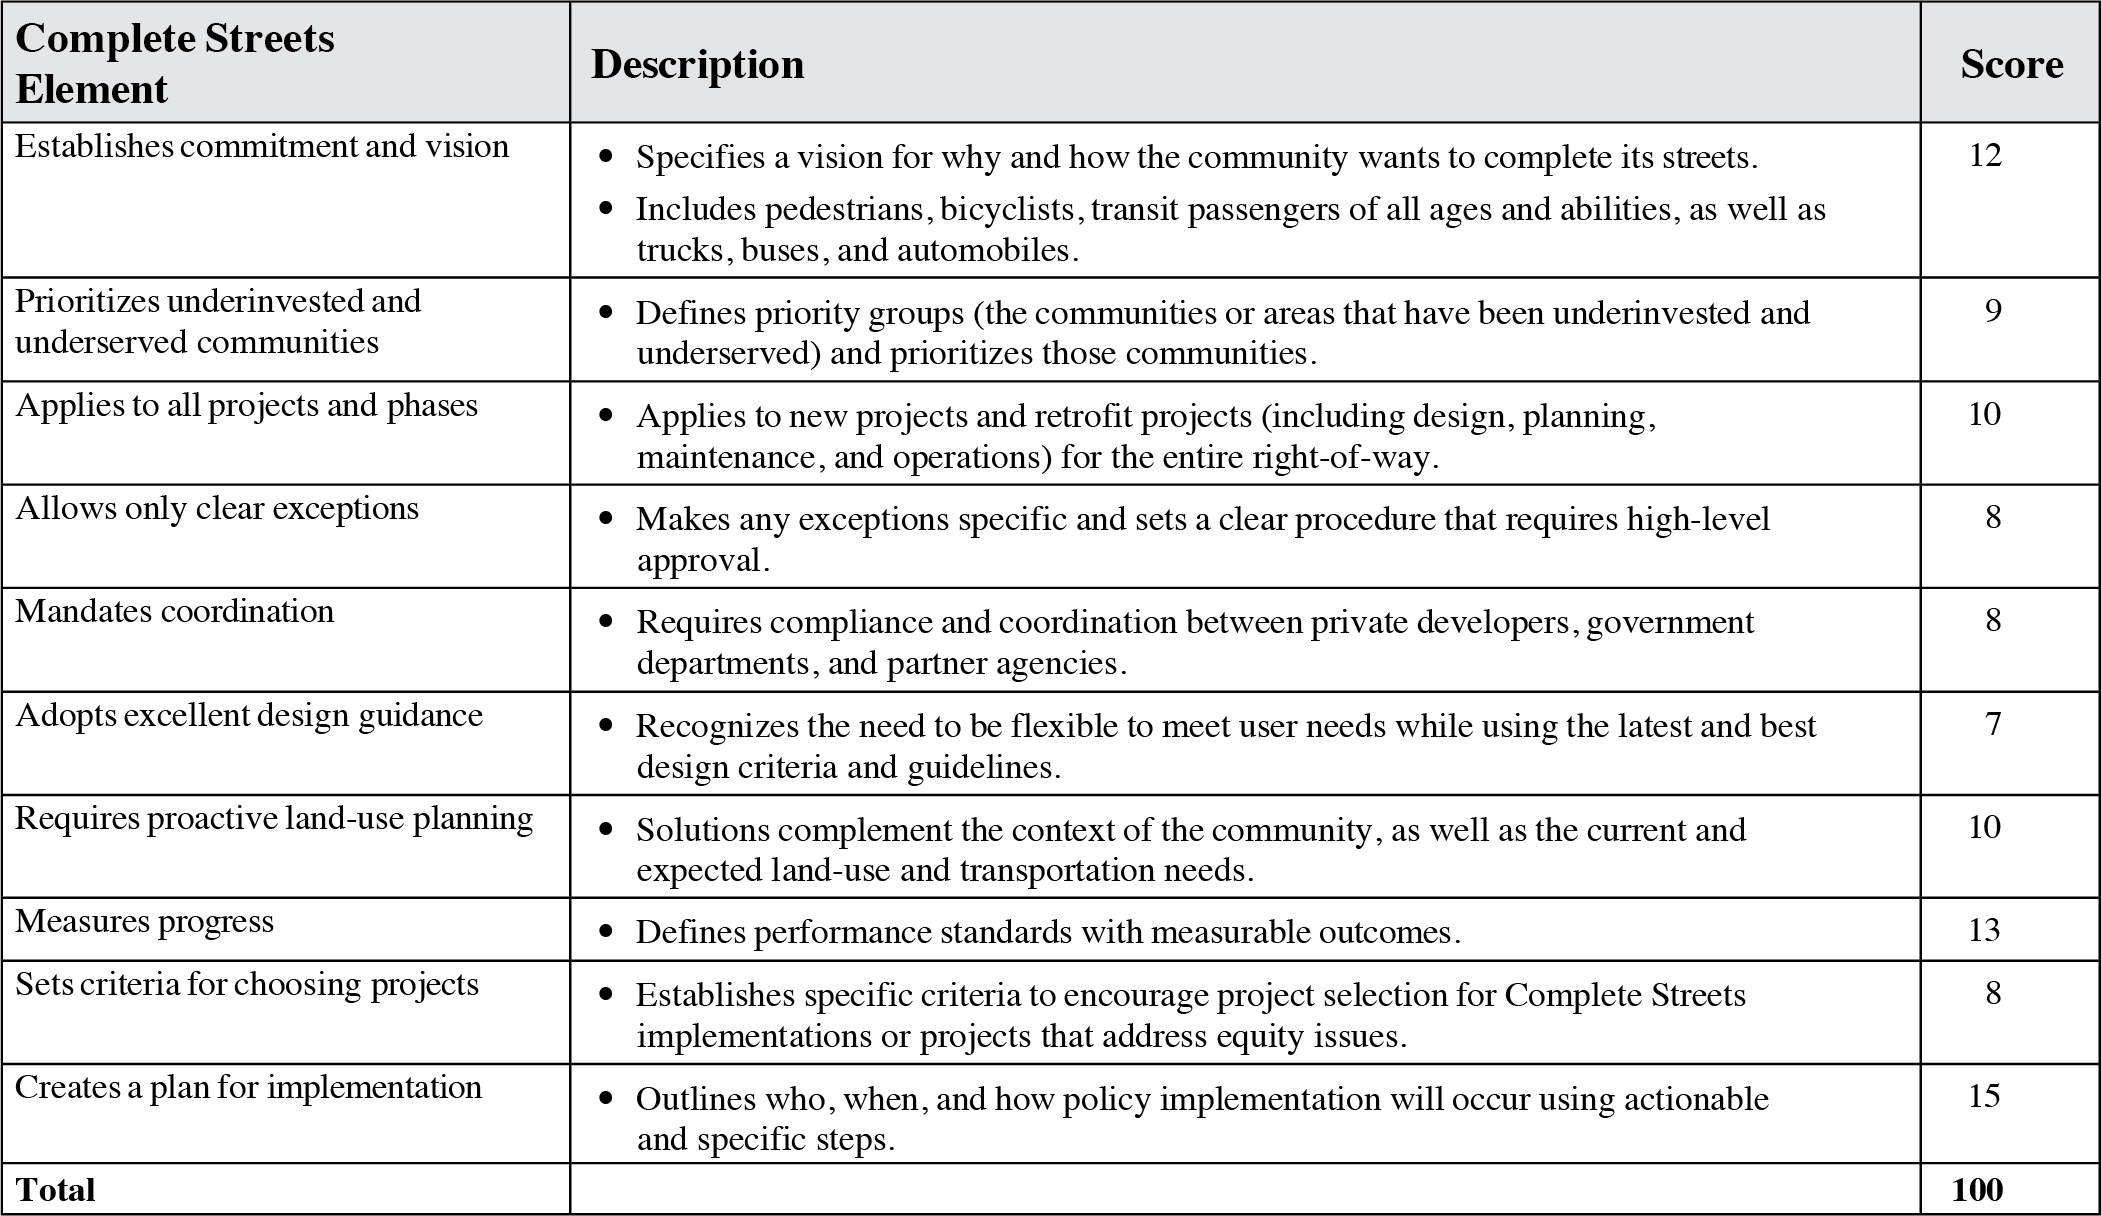
Performance metrics. Within the Complete Streets framework, the “Measures Progress” section of a Complete Streets policy outlines the metrics or types of metrics that practitioners will use to assess the implementation of a given project (5). The Complete Streets approach is not prescriptive about the exact metrics used and allows communities to define and use their own evaluation metrics (3, 8). These metrics are generally concerned with multiple transportation modes (e.g., walking, biking, driving) and are often supported by metadata to track certain types of performance. For tracking performance related to Complete Streetsʼ equity criteria, measurable definitions of priority groups may be needed, along with measurable definitions of the geographical area belonging to each facility or road segment of interest. Thus, recommended policies from guidance documents include plans for data collection workup, timelines for recurring performance metrics collection and publishing data and analyses, and assigning staff to manage data collection, storage, cleaning, analyses, and reporting (2, 5, 6).
Design Considerations
Safety assessment of proposed designs. When using HSM (Highway Safety Manual) predictive models to assess the safety of Complete Streets designs, most of the existing models for urban roadways focus on arterial roads rather than local and collector roads [e.g., the model described in Barua et al. (13)]. Groups can develop their own models for different roadway types, but this process requires substantial effort (see 14 for a process example). Designers may use crash modification factors (CMFs) to help account for the differences between proposed designs and the HSM base models, but it may still be difficult to find appropriate CMFs (e.g., for different types of on-street parking locations) or to prioritize which CMFs to include (the HSM recommends including a maximum of three CMFs; 13).
Data collection and data storage challenges. Collecting before-and-after metrics (8) can be difficult, especially those that can indicate injuries and fatalities related to pedestrian and bicyclist exposure (15). Implementing the digital infrastructure to store and access data may also require substantial effort. California Department of Transportation (Caltrans; 16) set an objective to implement a comprehensive Pedestrian Safety Data Plan in 2009, which included gathering pedestrian exposure data. Developing a statewide active transportation count database continues to be an ongoing effort more than 10 years later (17).
Cross References
None.
Key References
1. Marti, M., Kuehl, R., and Giese, J. (2013). Complete Streets Implementation Resource Guide for Minnesota Local Agencies. (MN/RC–2013RIC02). Minnesota Department of Transportation.
2. Seskin, S., and McCann, B. (2012). Complete Streets Policy Analysis 2011. Smart Growth America and National Complete Streets Coalition.
3. Seskin, S., and McCann, B. (2011). Complete Streets Policy Analysis 2010: A Story of Growing Strength. Smart Growth and National Complete Streets Coalition.
4. Young, E., and Hermanson, V. (2013). Livability literature review: Synthesis of current practice. Transportation Research Board 92nd Annual Meeting (13-2940).
5. Hanzlik, M., and Davis., S. (2023). Complete Streets Policy Framework. Smart Growth America and National Complete Streets Coalition.
6. Seskin, S., and McCann, B. (2012). Complete Streets Local Policy Workbook. Smart Growth America and National Complete Streets Coalition.
7. Burden, D., and Litman, T. (2011). America needs Complete Streets. ITE Journal, 81(4), 36–43.
8. LaPlante, J. N., and McCann, B. (2011). Complete Streets in the United States. 90th Annual Meeting of the Transportation Research Board.
9. Perk, V., Catalá, M., Mantius, M., and Corcoran, K. (2015). Capturing the Benefits of Complete Streets (No. BDV26-977-04). Tallahassee: Florida Department of Transportation.
10. Schlossberg, M., Rowell, J., Amos, D., and Sanford, K. (2013). Rethinking Streets: An Evidence-Based Guide to 25 Complete Street Transformations. University of Oregonʼs Sustainable Cities Initiative and the National Institute for Transportation and Communities.
11. Tolford, T. M., Fields, B., and Longoria, T. (2015). Evaluation of Complete Streets Policy Implementation by Metropolitan Planning Organizations (No. SWUTC/15/600451-00119-1). College Station: Texas A&M Transportation Institute.
12. Panero, M., and Botha, J. (2011). The Nature of Context-Sensitive Solutions, Stakeholder Involvement and Critical Issues in the Urban Context. San Jose, CA: Mineta Transportation Institute.
13. Barua, S., El-Basyouny, K., Islam, M. T., and Gargoum, S. (2014). Lessons learned from adopting the Highway Safety Manual to assess the safety performance of alternative urban Complete Streets designs. Conference of the Transportation Association of Canada.
14. Biancardo, S. A., Russo, F., Zhang, W., and Veropalumbo, R. (2019). Design criteria for improving safety performance of rural intersections. Journal of Advanced Transportation, 2019, 1–11.
15. Macdonald, E., Sanders, R., and Anderson, A. (2010). Performance Measures for Complete, Green Streets: A Proposal for Urban Arterials in California. (UCTC-FR-2010-12). Berkeley: University of California Transportation Center.
16. California Department of Transportation. (2010). Complete Streets Implementation Action Plan. Sacramento.
17. California Department of Transportation. (2022). Complete Streets Action Plan 2022–2023. Sacramento.
COMPLETE STREETS AND SIMILAR INITIATIVES
Introduction
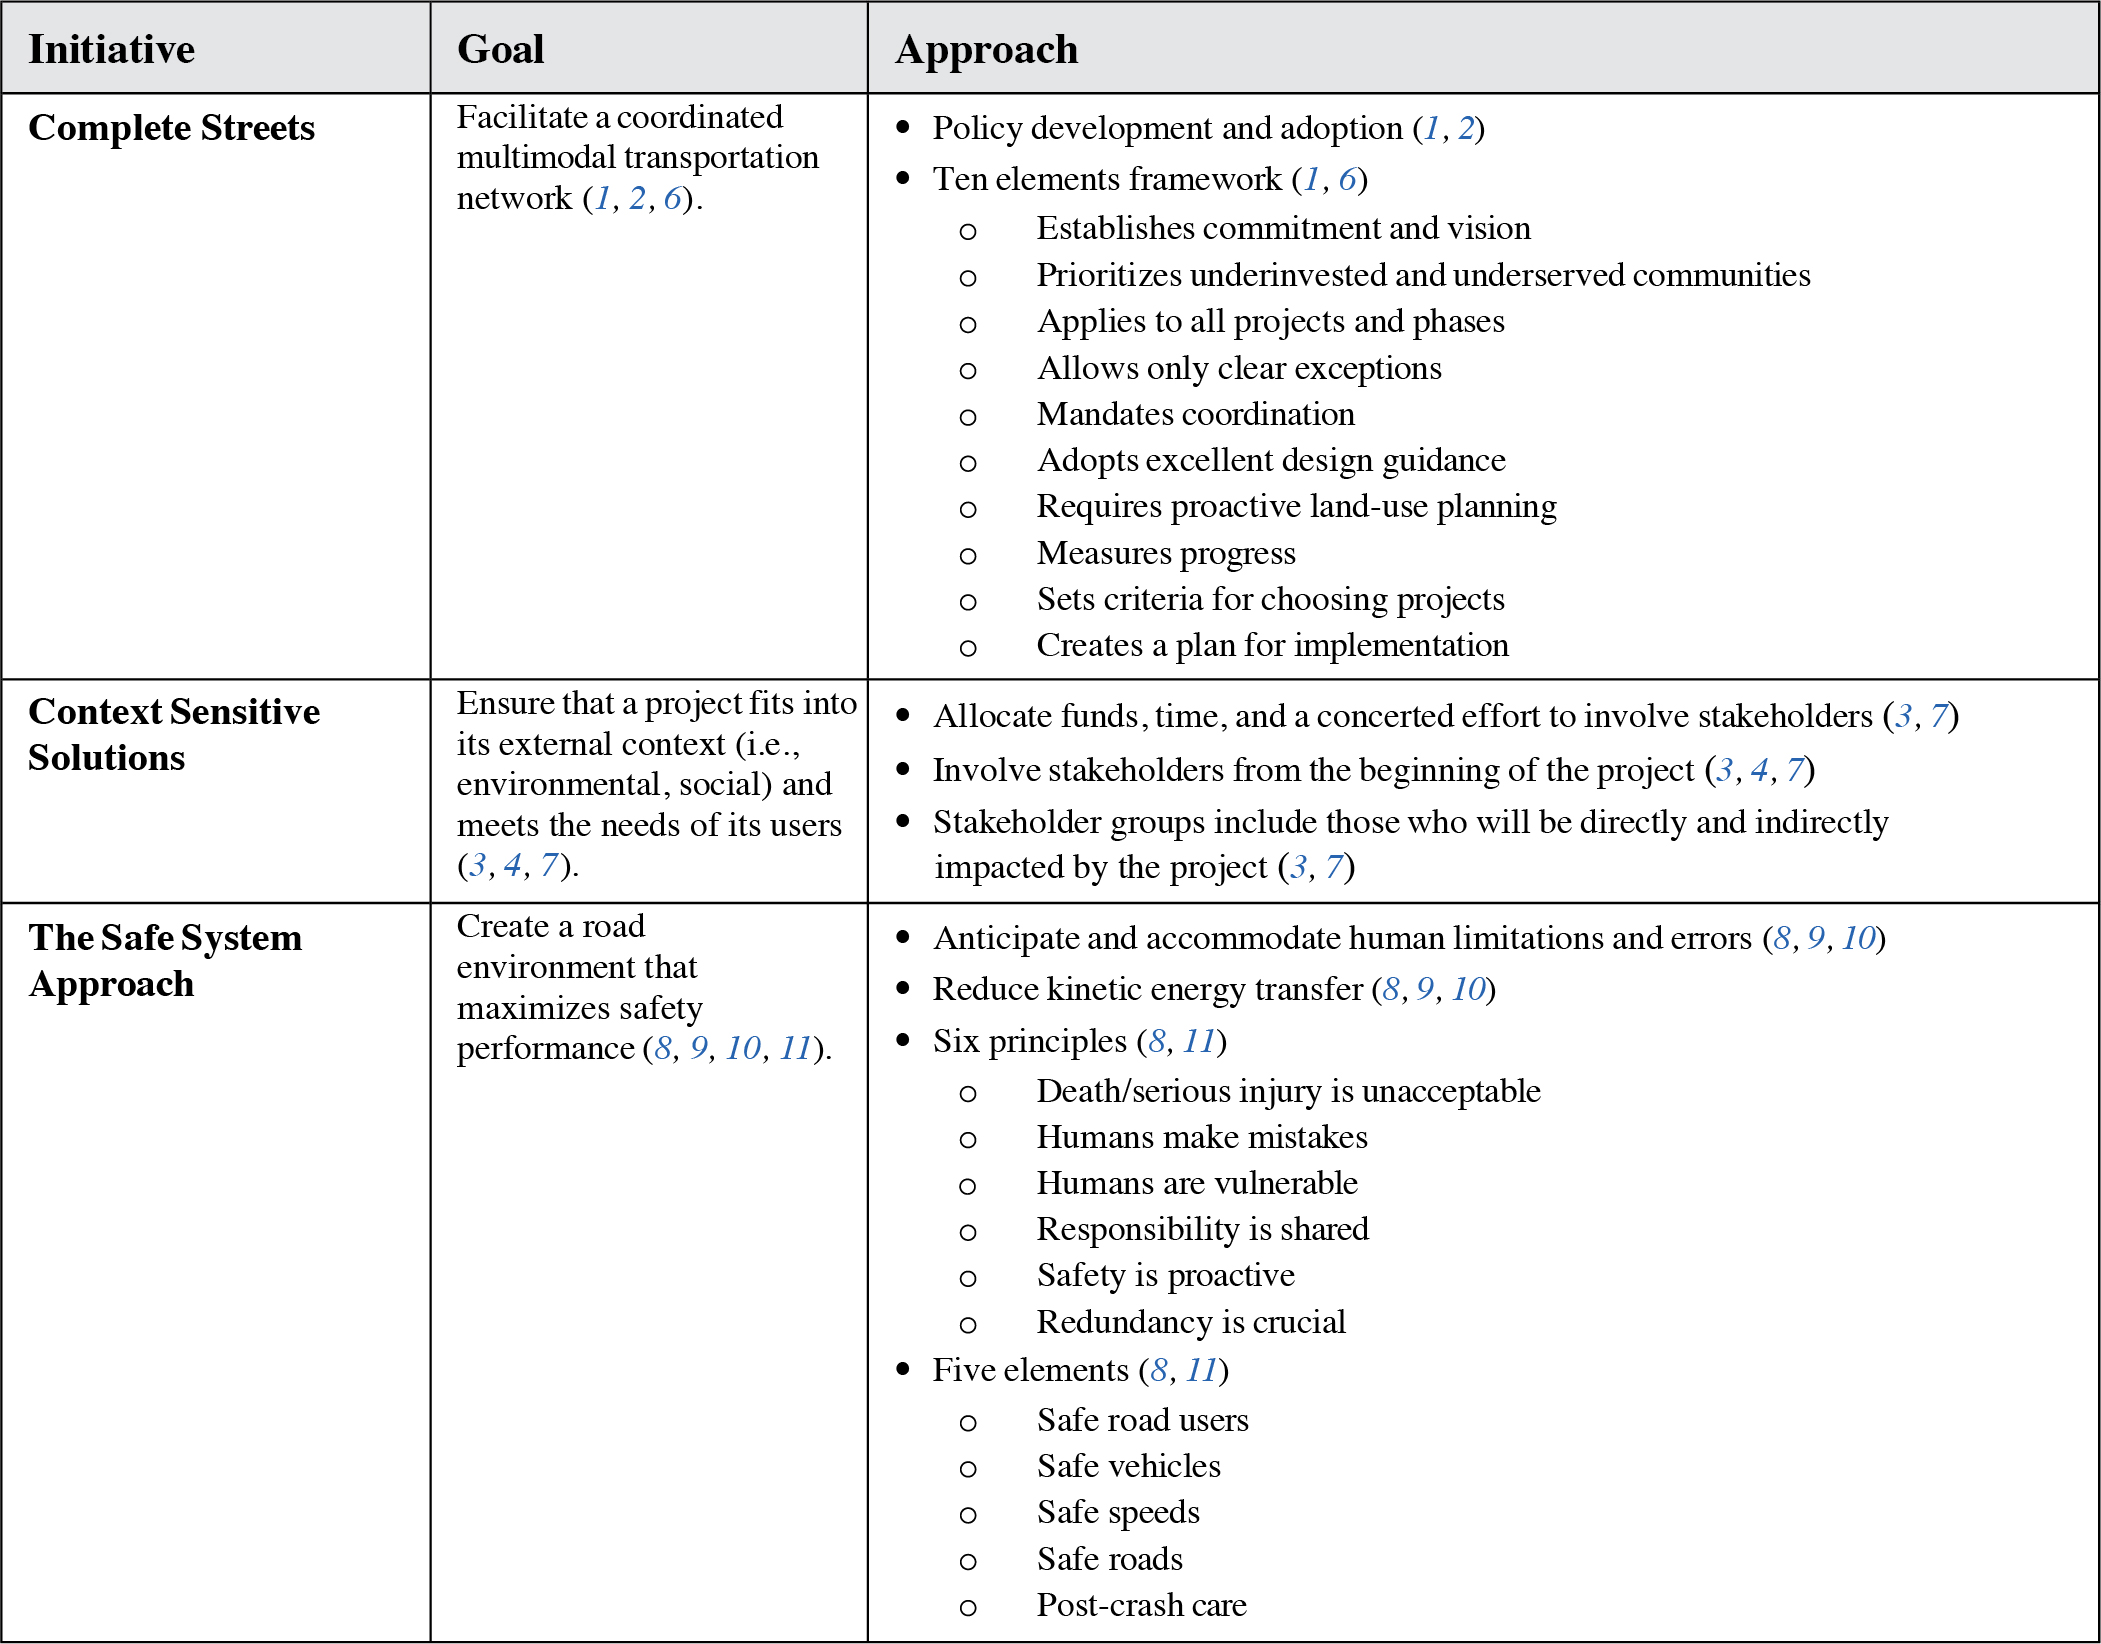
This guideline discusses the main themes of Complete Streets, the relationship between Complete Streets, Context Sensitive Solutions (CSS), and the Safe System Approach. It also reviews Complete Streets evaluation metrics related to human safety and performance and provides some real-world case studies of Complete Streets evaluations. In general, Complete Streets emphasizes network design and provides a framework for policy development and adoption to facilitate a coordinated network design effort rather than a fragmented project-by-project approach (1, 2). On the other hand, CSS aims to allocate funds, time, and a concerted effort to involve stakeholder groups from the beginning of the project, including those who do not live in the project area but would be impacted by it (3).
Differences between CSS and Complete Streets. CSS focuses on ensuring that a project fits into its external context (e.g., environmental, social) (3, 4). In contrast, Complete Streets focuses on the roadwayʼs internal context (e.g., the road users) and making multimodal accommodation routine (4). In CSS, practitioners work to understand who the core users of a project (including community and business groups) are and what their needs are (5), whereas the Complete Streets approach focuses on formally designating intended road users even if they are not currently served in an area (e.g., bicyclists and pedestrians). CSS does not mandate data collection and evaluation based on predetermined performance measures.

Discussion
Leveraging a CSS approach within Complete Streets. Integrating stakeholders early in any project facilitates a feeling of project ownership, which can help prevent community members from contesting a design in ways that could result in the delay or cancellation of a project (3, 4, 7). Local contexts and different settings (i.e., urban, suburban, and rural) are highly relevant to Complete Streets since they change the needs of road users and affect whether it makes sense for a road to accommodate a specific mode or when exceptions may be warranted [e.g., for severe topological constraints (12)].
The Safe System Approach (which includes the Vision Zero, Toward Zero Deaths, Road to Zero Coalition programs) seeks to create a road environment that maximizes safety performance for all road users by not accepting that death and serious injury are a natural consequence of using a road system (8, 9, 10, 11). Rather than relying primarily on improving human behavior, the Safe System Approach aims to anticipate and accommodate human limitations and errors. Safe System Approaches plan, design, and operate a road system that recognizes humans make mistakes, have limited physiological abilities to safely negotiate complex situations, and have a limited tolerance of kinetic energy forces. Therefore, a goal of this approach is to create a system that reduces the risk of kinetic energy transfer occurring in the first place and reduces the amount of energy transfer in the event of a crash to an amount that can be tolerated by humans (8, 9, 10, 11).
Differences between Safe System and Complete Streets. Safe System includes six core principles and five elements (8, 11). These principles and elements go beyond Complete Streetsʼ focus on road users, roadway facilities, and network design to include vehicle design and post-crash care. These additional considerations entail stakeholder involvement from the larger transportation ecosystem (e.g., OEMs, emergency first responders, law enforcement) to implement in-vehicle safety systems [e.g., seat belt interlocks, alcohol interlocks, intelligent speed limiters; (9)] and improve data collection from crash sites (8).
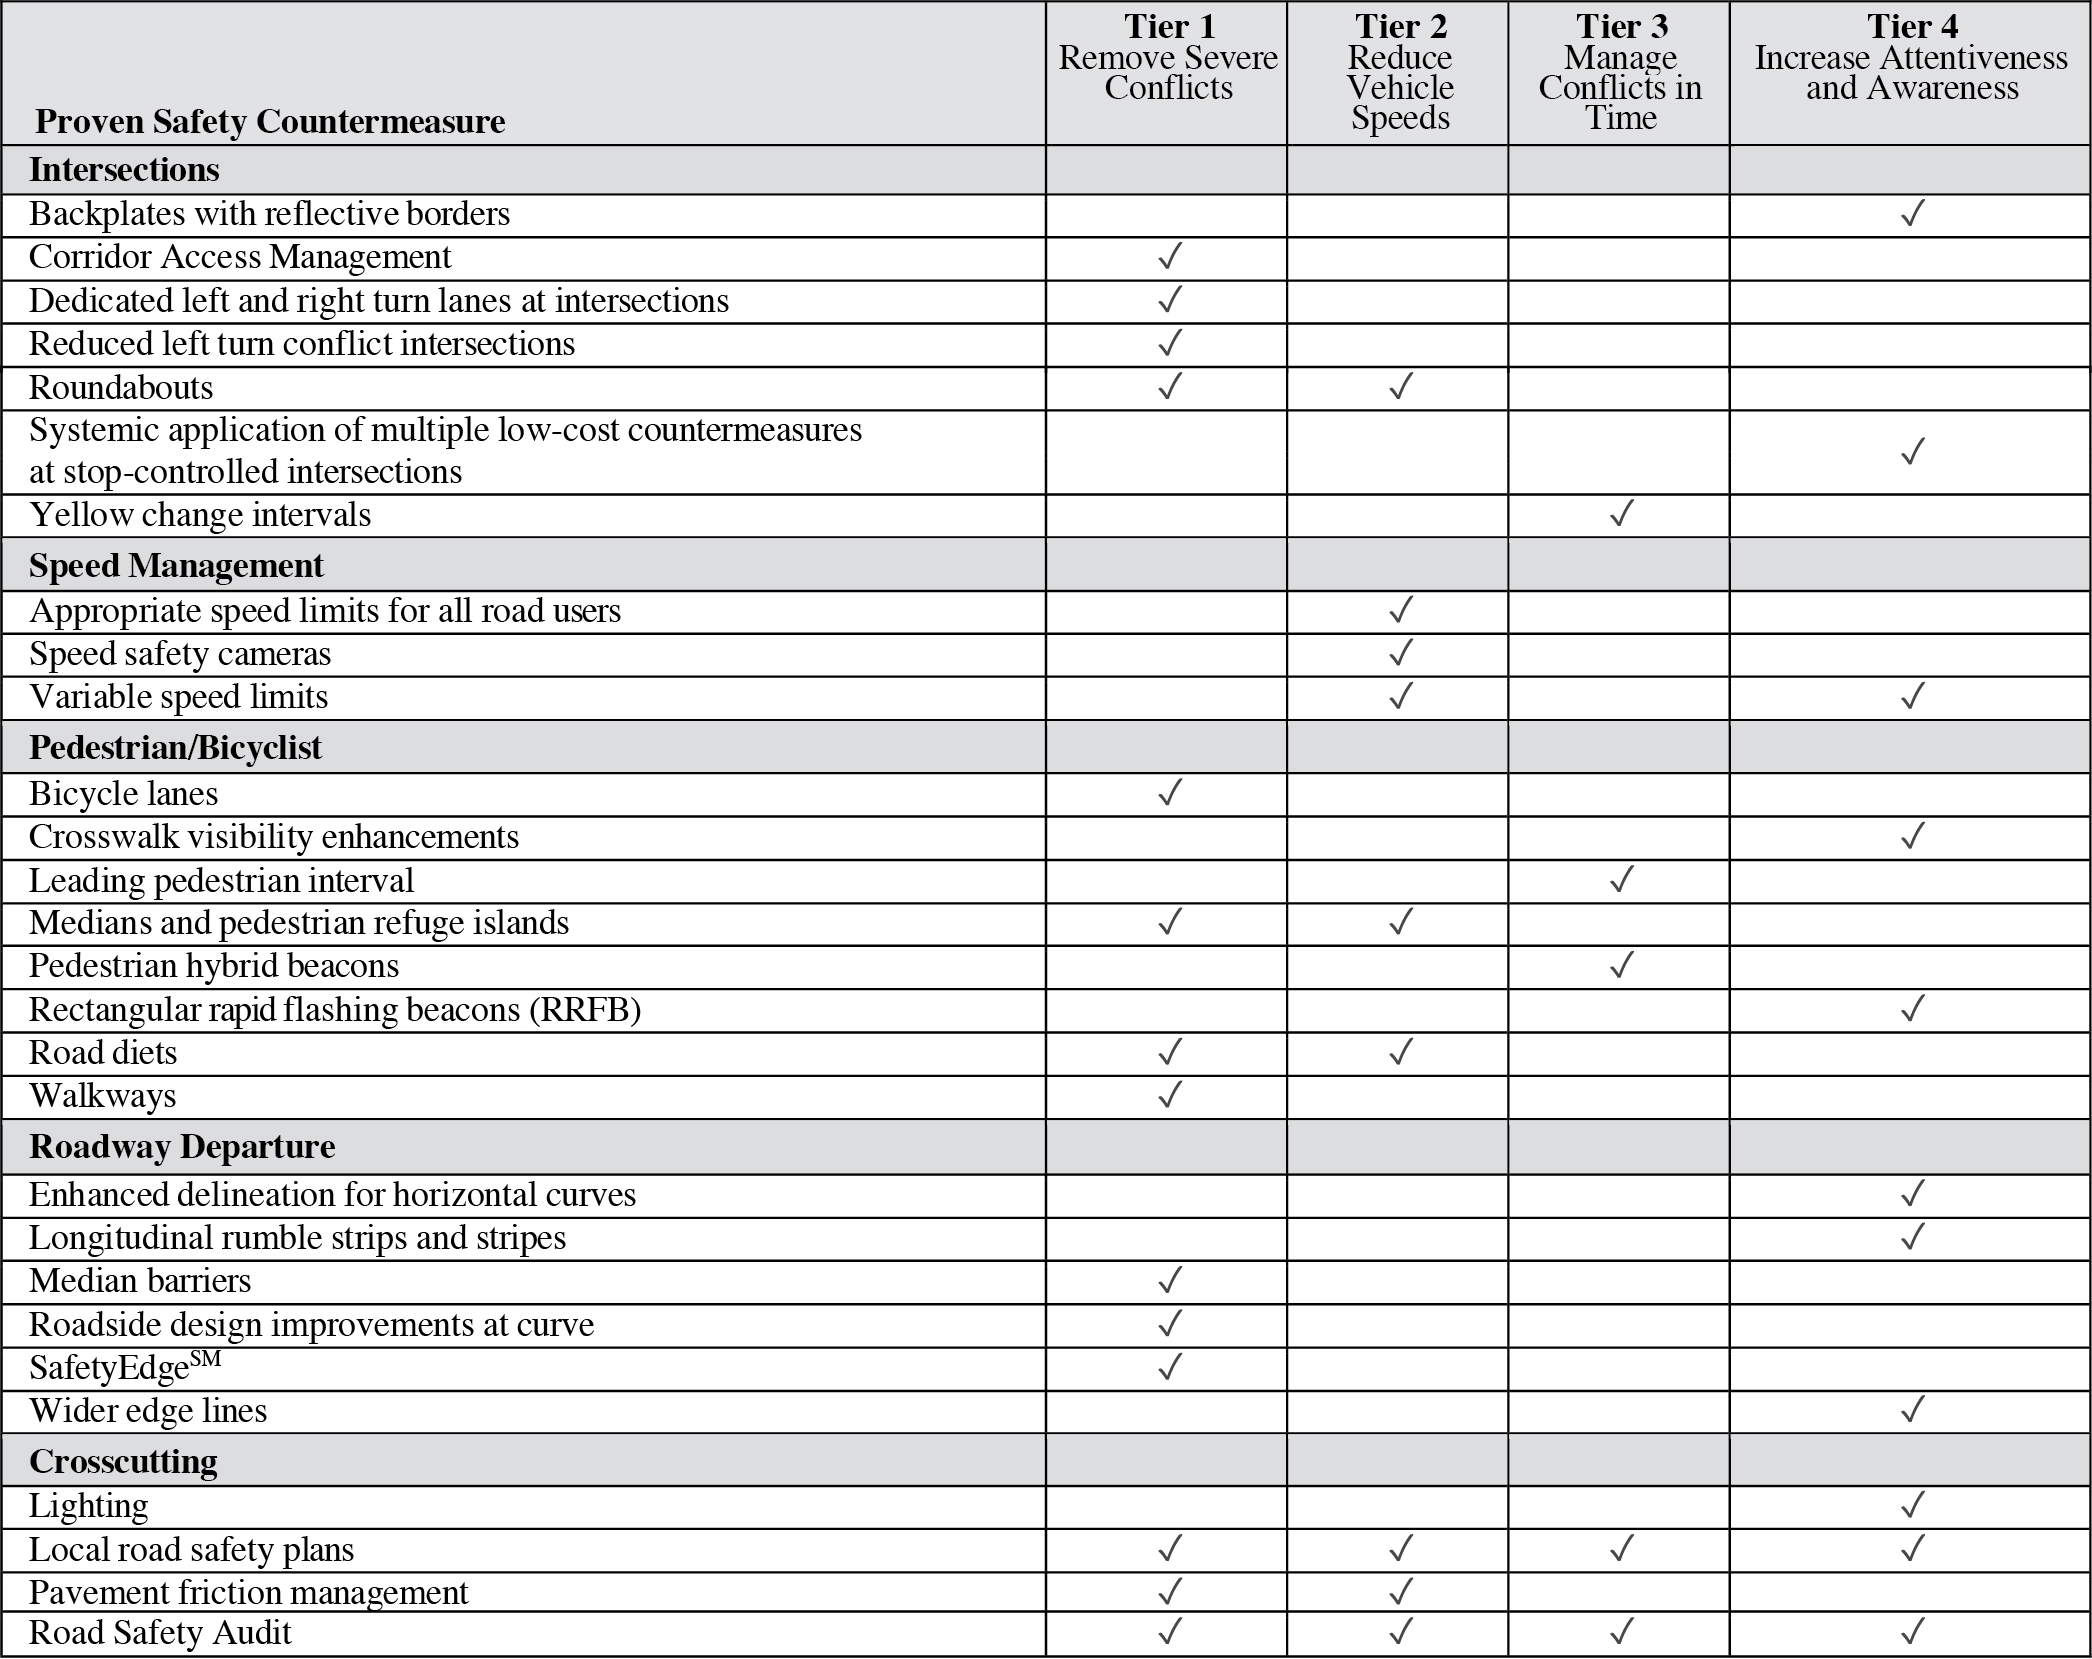
While Complete Streets designs often include facilities that, to facilitate multimodal use and safety, also work as traffic speed control measures (4), the Safe System Approach focuses on examining speed proactively to reduce the occurrence of lethal energy transfer, and may use travel speeds and typical road user mass to determine when and how road users will be separated in time (e.g., using traffic signals) or in physical space (e.g., using grade separation or physical barriers, or intersection designs that reduce conflict points) (8, 9, 10). For example, this could generally mean separating high-speed roads from mixed land use spaces (10). Scurry and Hopwood proposed a four-tier Safe System Hierarchy to prioritize countermeasure selection: remove severe conflicts, reduce vehicle speeds, manage conflicts in time, and increase attentiveness and awareness (13) based on the Hierarchy of Controls for Traffic Safety framework (8).
Leveraging Safe System within a Complete Streets approach. Leveraging Safe System can help improve safety in multimodal corridors, especially where space constraints and speed differentials between modes may result in poor crash outcomes (8).
Design Considerations
Similar to Complete Streets, Safe System roadway functional class and modal priorities can help support safe roads by identifying safety countermeasures that are most effective for a given type of facility (8). For example, it is not recommended to formally designate and promote a bike route along arterial road classes that, as assessed, cannot accommodate an appropriate facility type (14).
Key References
1. Seskin, S., and McCann, B. (2011). Complete Streets Policy Analysis 2010: A Story of Growing Strength. Washington, DC: Smart Growth America and National Complete Streets Coalition.
2. Tolford, T. M., Fields, B., and Longoria, T. (2015). Evaluation of Complete Streets Policy Implementation by Metropolitan Planning Organizations. (No. SWUTC/15/600451-00119-1). College Station: Texas A&M Transportation Institute.
3. Panero, M., and Botha, J. (2011). The Nature of Context-Sensitive Solutions, Stakeholder Involvement and Critical Issues in the Urban Context. San Jose, CA: Mineta Transportation Institute.
4. LaPlante, J. N., and McCann, B. (2011). Complete Streets in the United States. 90th Annual Meeting of the Transportation Research Board.
5. Ray, B. L. (2016). Evolutions in the geometric design of highways and streets: Integrating performance-based analysis. TR News, 301, January–February, 27–31.
6. Hanzlik, M., and Davis, S. (2023). Complete Streets Policy Framework. Washington, DC: Smart Growth America and National Complete Streets Coalition.
7. Texas Transportation Institute. (2011). Designing context-sensitive solutions for urban thoroughfares. Texas Transportation Researcher, 47(1), 13.
8. Finkel, E., McCormick, C., Mitman, M., Abel, S., and Clark, J. (2020). Integrating the Safe System Approach with the Highway Safety Improvement Program: An Informational Report (FHWA-SA-20-018). Washington, DC: FHWA, Office of Safety.
9. Signor, K., Kumfer, W., LaJeunesse, S., and Carter, D. (2018). Safe Systems Synthesis: An International Scan for Domestic Application. Final Report. Chapel Hill, NC: UNC Highway Safety Research Center.
10. Welle, B., Sharpin, A. B., Adriazola-Steil, C., Alveano, S., Obelheiro, M., Imamoglu, C. T., and Bose, D. (2018). Sustainable and Safe: A Vision and Guidance for Zero Road Deaths. World Resources Institute.
11. FHWA. (2020). The Safe System Approach. (FHWA-SA-20-015). Washington, DC.
12. Marti, M., Kuehl, R., and Giese, J. (2013). Complete Streets Implementation Resource Guide for Minnesota Local Agencies. (MN/RC–2013RIC02). Minnesota Department of Transportation.
13. Scurry, K., and Hopwood, C. (2023). Implementing the Safe Systems Approach. (Slides). Washington Transportation Professionals Forum and Peer Exchange.
14. Sears, B. (2014). Incorporating Complete Streets into transportation master plans. ITE Journal, 84(4), 32–36.
A FRAMEWORK FOR SELECTING COMPLETE STREETS IMPLEMENTATIONS
Introduction
The Safe System Design Hierarchy from FHWA (1) characterizes how well engineering and infrastructure-based countermeasures align with different methods for achieving zero traffic deaths and severe injuries through reducing the risk of kinetic energy transfer. This tool is based on the hierarchy of controls for workplace safety and previous work by Austroads (1). Complete Streets can use many different roadway implementations to achieve the goal of an unbroken multimodal network. By applying the Safe System Design Hierarchy to Complete Streets initiatives, designers can identify and prioritize network implementations that are associated with desired safety outcomes (1).

Discussion
Safe Systems Design Hierarchy. This four-tier framework helps practitioners arrange safety countermeasures and strategies from most to least aligned with the Safe System principles, where physical changes to the system are considered more effective than relying solely on road users to make safe decisions (1).
Tier 1: Remove severe conflicts. Removing high-risk conditions reduces severe conflicts. Complete Streets often minimize conflicts by separating travel modes and directions of travel in space based on differences in weight, speed, and expected traffic volumes (3, 4) or selecting designs with fewer conflict points. A road diet converts an undivided four-lane roadway into a three-lane divided roadway consisting of two through lanes and a center two-way left-turn lane. This allows for the reallocation of space for other modes or functions (e.g., bike lanes, pedestrian refuge islands, transit uses, parking). Road diets improve safety by reducing the number of vehicle-vehicle and vehicle-other road user conflict points and reducing speed differentials: through-lane lead vehicles limit speed differentials, and through-lane vehicles are separated from left-turning vehicles (5).
Tier 2: Reduce vehicle speeds. In the event of a crash, reducing vehicle speeds reduces the kinetic energy transfer. Complete Streets designs often include speed management (3, 4). For example, self-enforcing roadways (see 6) use a target design speed to select a roadwayʼs vertical and horizontal alignment and other geometric properties and then support road usersʼ selection of this speed with traffic signs, pavement markings, and other roadside elements (6). Protected intersections may use corner safety islands with a small turn radius, which necessitate slower motorist turning speeds. Reducing the turning radii not only manages vehicle speed but also orients the vehicle in a way that improves the visibility of pedestrians and bicyclists to drivers (7).
Tier 3: Manage conflicts in time. When road users need to occupy the same physical space, conflicts may be managed by separating road users in time using traffic control devices. A leading pedestrian signal allows pedestrians to cross lanes of travel prior to vehicle movement and can increase a turning driverʼs awareness of crossing pedestrians (8).
Tier 4: Increase attentiveness and awareness. Alerting road users to potential hazards or conflicts supports appropriate reactions. For example, curb extensions, which extend the sidewalk or curb line into the parking lane, can reduce the crossing distance of pedestrians (reducing exposure) while improving the sight distance and sight lines of both pedestrians and motorists (8).
Design Considerations
Multimodal considerations. Safety countermeasures and strategies have implications for how different modes interact in space. Designs may benefit multiple modes (e.g., loading zones can benefit ride shares as well as freight). There are also common “foibles” of multimodal interactions, but these may be circumvented through geometric design. For example, bicyclists performing passing maneuvers may interfere with buses at bus stops (9). Drivers are more likely to focus their attention on hazards in the forward view and may have difficulty perceiving bicyclists approaching from behind (4), both while driving and stationary (e.g., while opening their door) (9). Rumble strips can interfere with bicycles, but some designs are bicycle-tolerable (10). In a Complete Street, driver expectations and culture may also need to shift from arriving at their destination in the most expedient manner to prioritizing courteous driving, planning for adequate travel time, and resisting pressure from other traffic to speed (11).
Cross References
A Framework for Complete Streets Evaluations
Key References
1. Hopwood, C., Little, K., and Gaines, D. (2024). Safe System Roadway Design Hierarchy: Engineering and Infrastructure-Related Countermeasures to Effectively Reduce Roadway Fatalities and Serious Injuries. (FHWA-SA-22-069). Washington, DC: FHWA.
2. Campbell, J. L., Torbic, D. J., Hoekstra-Atwood, L., Monk, C., Potts, I. B., and Fraser, A. K. (2024). NCHRP Research Report 1111/BTSCRP Research Report 12: Diagnostic Assessment and Countermeasure Selection: A Toolbox for Traffic Safety Practitioners. Transportation Research Board, Washington, DC.
3. Signor, K., Kumfer, W., LaJeunesse, S., and Carter, D. (2018). Safe Systems Synthesis: An International Scan for Domestic Application. Final Report. Chapel Hill, NC: UNC Highway Safety Research Center.
4. Schultheiss, B., Goodman, D., Blackburn, L., Wood, A., Reed, D., and Elbech, M. (2019). Bikeway Selection Guide. (FHWA-SA-18-077). Washington, DC: FHWA.
5. Knapp, K., Chandler, B., Atkinson, J., Welch, T., Rigdon, H., Retting, R., Meekins, S., Widstrand, E., and Porter, R. J. (2014). Road Diet Informational Guide. (FHWA-SA-14-028). Washington, DC: FHWA.
6. Donnell, E. T., Kersavage, K., and Tierney, L. F. (2018). Self-Enforcing Roadways: A Guidance Report. (FHWA-HRT-17-098). Washington, DC: FHWA.
7. Gilpin, J. (2016). Building better communities through complete streets—The protected intersection. ITE Journal, 86(3), 40–43.
8. AASHTO. (2021). Guide for the Planning, Design, and Operation of Pedestrian Facilities (2nd ed.). Washington, DC.
9. Schlossberg, M., Rowell, J., Amos, D., and Sanford, K. (2013). Rethinking Streets: An Evidence-Based Guide to 25 Complete Street Transformations. University of Oregonʼs Sustainable Cities Initiative and the National Institute for Transportation and Communities.
10. Porter, C., Danila, M., Fink, C., Toole, J., Mongelli, E., and Schultheiss, B. (2016). Achieving Multimodal Networks: Applying Design Flexibility and Reducing Conflicts. (FHWA-HEP-16-055). Washington, DC: FHWA.
11. Slotterback, C. S., and Zerger, C. (2013). Complete Streets from Policy to Project: The Planning and Implementation of Complete Streets at Multiple Scales (No. MN/RC 2013-30). Minneapolis: University of Minnesota, Humphrey School of Public Affairs.
A FRAMEWORK FOR COMPLETE STREETS EVALUATIONS
Introduction
While Complete Streets evaluations are defined at the policy creation stage, implementation assessment metrics, although encouraged, are not prescriptive. Within the Safe Systems Approach framework, however, there has been more development of specific guidance for selecting and assessing implementation strategies. The Safe System Assessment Framework by Austroads aims to help road agencies methodically consider Safe System objectives in road infrastructure projects (1). It uses the five elements of the Safe System Approach to assess how well a given project aligns with key principles (1).

Discussion
The Complete Streets approach can use many different roadway implementations to achieve the goal of an unbroken multimodal network. Applying these assessment frameworks within a Complete Streets project can help designers identify or prioritize network implementations that are associated with desired safety outcomes and select appropriate metrics for ultimately assessing safety outcomes (4). In addition, evaluating road systems from a human factors perspective by considering the interactions between the roadway and road user that contribute to crashes serves to meet the holistic roadway design intentions of Complete Streets and Safe System Approaches, including the mitigation of crash potential on roadway systems and provision of redundancy so that multiple parts of the roadway mitigate crash potential (2, 5).
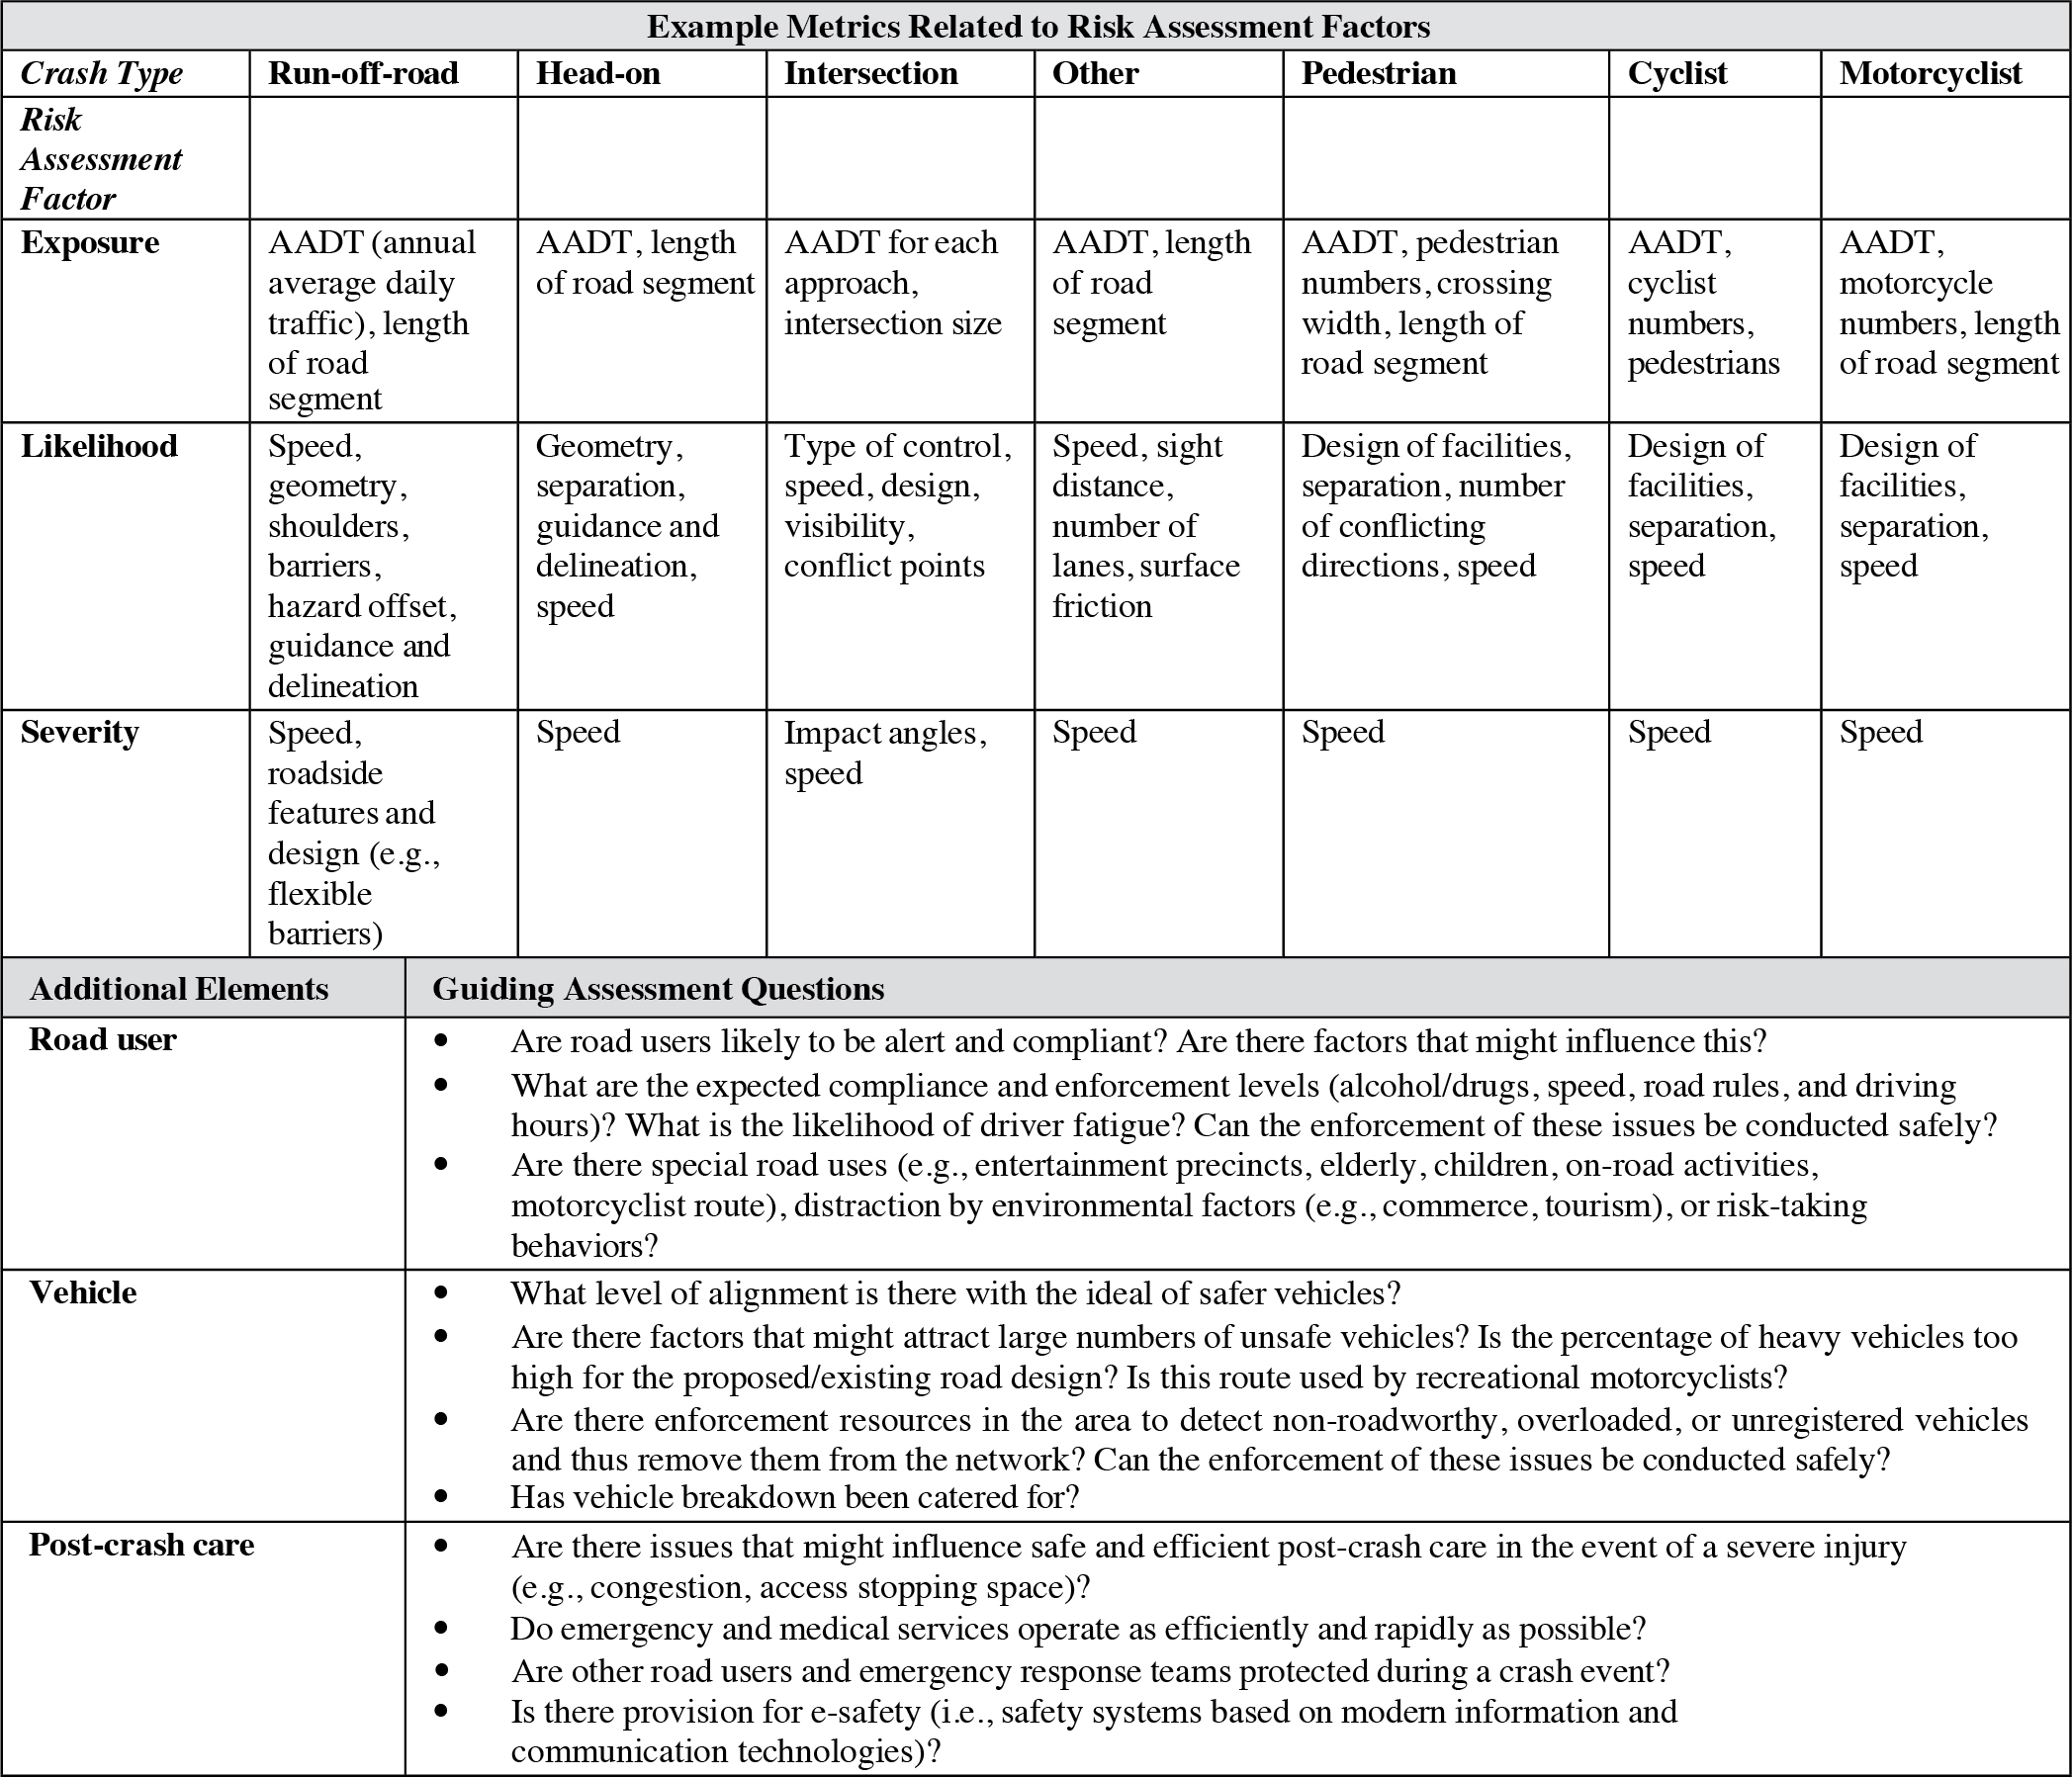
Safe System Assessment Framework. This framework has four steps: (1) Assess Objectives, (2) Project Context, (3) Safe System Matrix, and (4) Treatment Hierarchy, which are described in detail along with key questions to guide the practitioner in Austroadʼs Safe System Assessment Framework report (1). A key part of the framework is to conduct a risk assessment of common crash types at the project site based on exposure, likelihood, and severity. Reducing any one of the risk factors translates directly into the elimination of fatal and serious consequences related to the examined crash types (1). The factor definitions are as follows:
Road user exposure. The existing or intended road user modes, characteristics, numbers, and the amount of time when they can be exposed to a potential crash (e.g., time traversing along or lingering within the project site) (1).
Crash likelihood. Factors that affect whether a crash occurs. These include design elements that influence conflict opportunity in space (e.g., number of conflict points, separation between modes or opposing traffic) or time (e.g., priority/signals/movement ban), interact with driver human factors (e.g., speed, sight distance, geometric alignment, signs and guidance), or vehicle factors (e.g., road maintenance) (1, 5).
Crash severity. Pre-, during-, and post-crash factors that affect post-crash survivability (5) and injury severity. These relate to the values of the impact speeds, forces, and angles between road users and the presence of roadside hazards (1).
These factors are evaluated within a Safe System Matrix for major crash types against the exposure to that crash risk, the likelihood of it occurring, and the severity of the crash should it occur, using metrics such as the ones suggested in the Design Guidelines table. The levels of these metrics are then translated into a categorical score (out of 4). The exposure, likelihood, and severity scores are then multiplied for each crash type (i.e., by column). The resulting products are then summed across the columns. The closer the total is to zero, the more the overall project aligns with Safe System principles (1). The Safe System Matrix also includes guiding questions for qualitatively evaluating the project against road user, vehicle, and post-crash care Safe System elements (1).
Design Considerations
Interactions between exposure and likelihood. The increased presence of bicyclists and pedestrians also has positive safety implications. The likelihood of bicyclist injury and fatalities decreases as the number of bicyclists increases (6). In an analysis performed by the City of Copenhagen in their 2002–2012 Cycle Policy report, they found that a 40 percent increase in bicycle-kilometers traveled corresponded to a 50 percent decrease in seriously injured bicyclists (6). Likewise, the likelihood of pedestrian injury and fatality falls as more pedestrians are present due to raised driver expectations for encountering vulnerable road users (6).
Cross References
A Framework for Selecting Complete Streets Implementations
Key References
1. Turner, B., Jurewicz, C., Pratt, K., Corben, B., and Woolley, J. (2016). Safe System Assessment Framework. (AP-R509-16). Sydney, Australia: Austroads.
2. Finkel, E., McCormick, C., Mitman, M., Abel, S., and Clark, J. (2020). Integrating the Safe System Approach with the Highway Safety Improvement Program: An Informational Report. (FHWA-SA-20-018). Washington, DC: FHWA, Office of Safety.
3. FHWA. (2020). The Safe System Approach. (FHWA-SA-20-015). Washington, DC.
4. Hopwood, C., Little, K., and Gaines, D. (2024). Safe System Roadway Design Hierarchy: Engineering and Infrastructure-Related Countermeasures to Effectively Reduce Roadway Fatalities and Serious Injuries. (FHWA-SA-22-069). Washington, DC: FHWA.
5. Campbell, J., Torbic, D., Hoekstra-Atwood, L., Monk, C., Potts, I., and Fraser, A. (2024). NCHRP Research Report 1111/BTSCRP Research Report 12: Diagnostic Assessment and Countermeasure Selection: A Toolbox for Traffic Safety Practitioners. Transportation Research Board, Washington, DC.
6. Dai, B., and Dadashova, B. (2021). Review of contextual elements affecting bicyclist safety. Journal of Transport and Health, 20, 101013.
KEY REFERENCES FOR COMPLETE STREETS DESIGN INFORMATION
Introduction
The MUTCD and AASHTO Green Book allow for or encourage flexibility that practitioners can leverage to support broader Complete Streets objectives. Strict adherence to standards can help practitioners minimize liability concerns and skip design exception processes; however, this approach often results in designs that prioritize vehicle mobility over vulnerable road user safety and access and/or misfit a communityʼs context (1). These recommended resources listed in the design guidelines are intended to help practitioners find Complete Streets guidance relevant to their project (complete reference information for these resources can be found in Chapter 28: References).

Discussion
In contrast to conventional road design approaches, these guidelines advocate for a shift in the methods and priorities used to determine the following design controls:
Design speed. A concern with using observed driver behavior (e.g., the 85th percentile method) to set speed limits is that this practice leads to speed limit creep (2). Designing facilities for a target speed can encourage operating speeds that reflect safety goals (1, 3, 4, 5).
Design vehicle. Rather than designing a multimodal facility for the largest vehicle expected to use the facility, these guidelines tend to promote using dimensions that represent vehicles expected to use the facility most frequently (i.e., the design vehicle). This approach allows practitioners to select narrower lane widths and smaller curb radii to facilitate reduced speeds and pedestrian crossing distances (1, 3, 4, 5) but also necessitates the allocation of other streets within the network for larger design vehicles such as transit and freight (4).
Functional classification. Increased granularity in functional classification categories can reflect land-use context beyond traditional rural, urban, and suburban classifications (3, 4, 5).
Adjacent facilities to the right-of-way. Multiple uses of shoulder space can encourage on-street parking and accommodate bicyclists or disabled vehicles (e.g., 1, 4).
A practitioner may use these recommended materials to supplement proven crash prediction and reduction tools and resources [e.g., FHWAʼs Interactive Highway Safety Design Model (IHSDM), CMF Clearinghouse, and AASHTOʼs HSM].
Design Considerations
Practitioners should keep in mind that although the FHWA recognizes external guidelines, including many of the resources listed here, as useful references for informing multimodal transportation solutions (see 6, 7), these resources do not necessarily comply with federal laws and regulations (7).
Each resource in the Design Guidelines table includes a 1-star, 2-star, or 3-star rating of rigor based on the documentʼs use of citations and original research and a note on whether it discusses or leverages AASHTO guidelines and the MUTCD. Almost all these documents cite AASHTO guidelines and/or the MUTCD, but only a subset discuss AASHTO guidelines and/or MUTCD compliance. In addition, all of the recommended resources were published prior to the release of the 2023 MUTCD, so a documentʼs stated compliance may not reflect its current compliance. In any US-based project, the jurisdiction implementing a Complete Street is responsible for ensuring compliance with laws, regulations, and standards such as the MUTCD, the ADA, and the completion of appropriate design exception processes (7).
Cross References
Speed Perception, Speed Choice, and Speed Control, Chapter 14
Key References
1. Kueper, D. (2010). A context sensitive state design manual. ITE Journal, 80(11), 30–35.
2. National Association of City Transportation Officials. (2020). City limits: Setting safe speed limits on urban streets.
3. Porter, C., Danila, M., Fink, C., Toole, J., Mongelli, E., and Schultheiss, B. (2016). Achieving Multimodal Networks: Applying Design Flexibility and Reducing Conflicts. (FHWA-HEP-16-055). Washington, DC: FHWA.
4. Elizer, M., Bockisch, J., Sewell, M., Potts, I., Torbic, D., and Gilpin, J. (2018). NCHRP Research Report 880: Design Guide for Low-Speed Multimodal Roadways. Transportation Research Board, Washington, DC.
5. Institute of Transportation Engineers. (2010). Designing Walkable Urban Thoroughfares: A Context Sensitive Approach. (No. RP-036a). Washington, DC.
6. FHWA. (2022). Moving to a Complete Streets Design Model: A Report to Congress on Opportunities and Challenges. Washington, DC.
7. FHWA. (2023). Alternate Roadway Design Publications Recognized by FHWA Under BIL and FAST Act. Washington, DC.


