Human Factors Guidelines for Road Systems: Third Edition (2025)
Chapter: 23 Markings

VISIBILITY OF LANE MARKINGS
Introduction
Visibility of lane markings refers to the ease with which drivers can see and follow longitudinal lane markings. Lane markings are designed for a certain preview time, the amount of time that drivers look ahead on the roadway. This preview time is affected by the distance at which drivers can see markings, which is a function of retroreflectivity and marking width. Different lane marking patterns and colors can have different meanings and regulate different driver actions, such as exiting, lane changing, passing, and maintaining roadway position. For this and other reasons, it is important that drivers are able to see and understand lane markings from an appropriate distance.

MATHEMATICAL ESTIMATION OF NIGHTTIME VISIBILITY DISTANCE BASED UPON MARKING RETROREFLECTIVITY AND WIDTH (1) (MODELS ARE FOR YOUNG DRIVERS AND DO NOT CONSIDER GLARE)
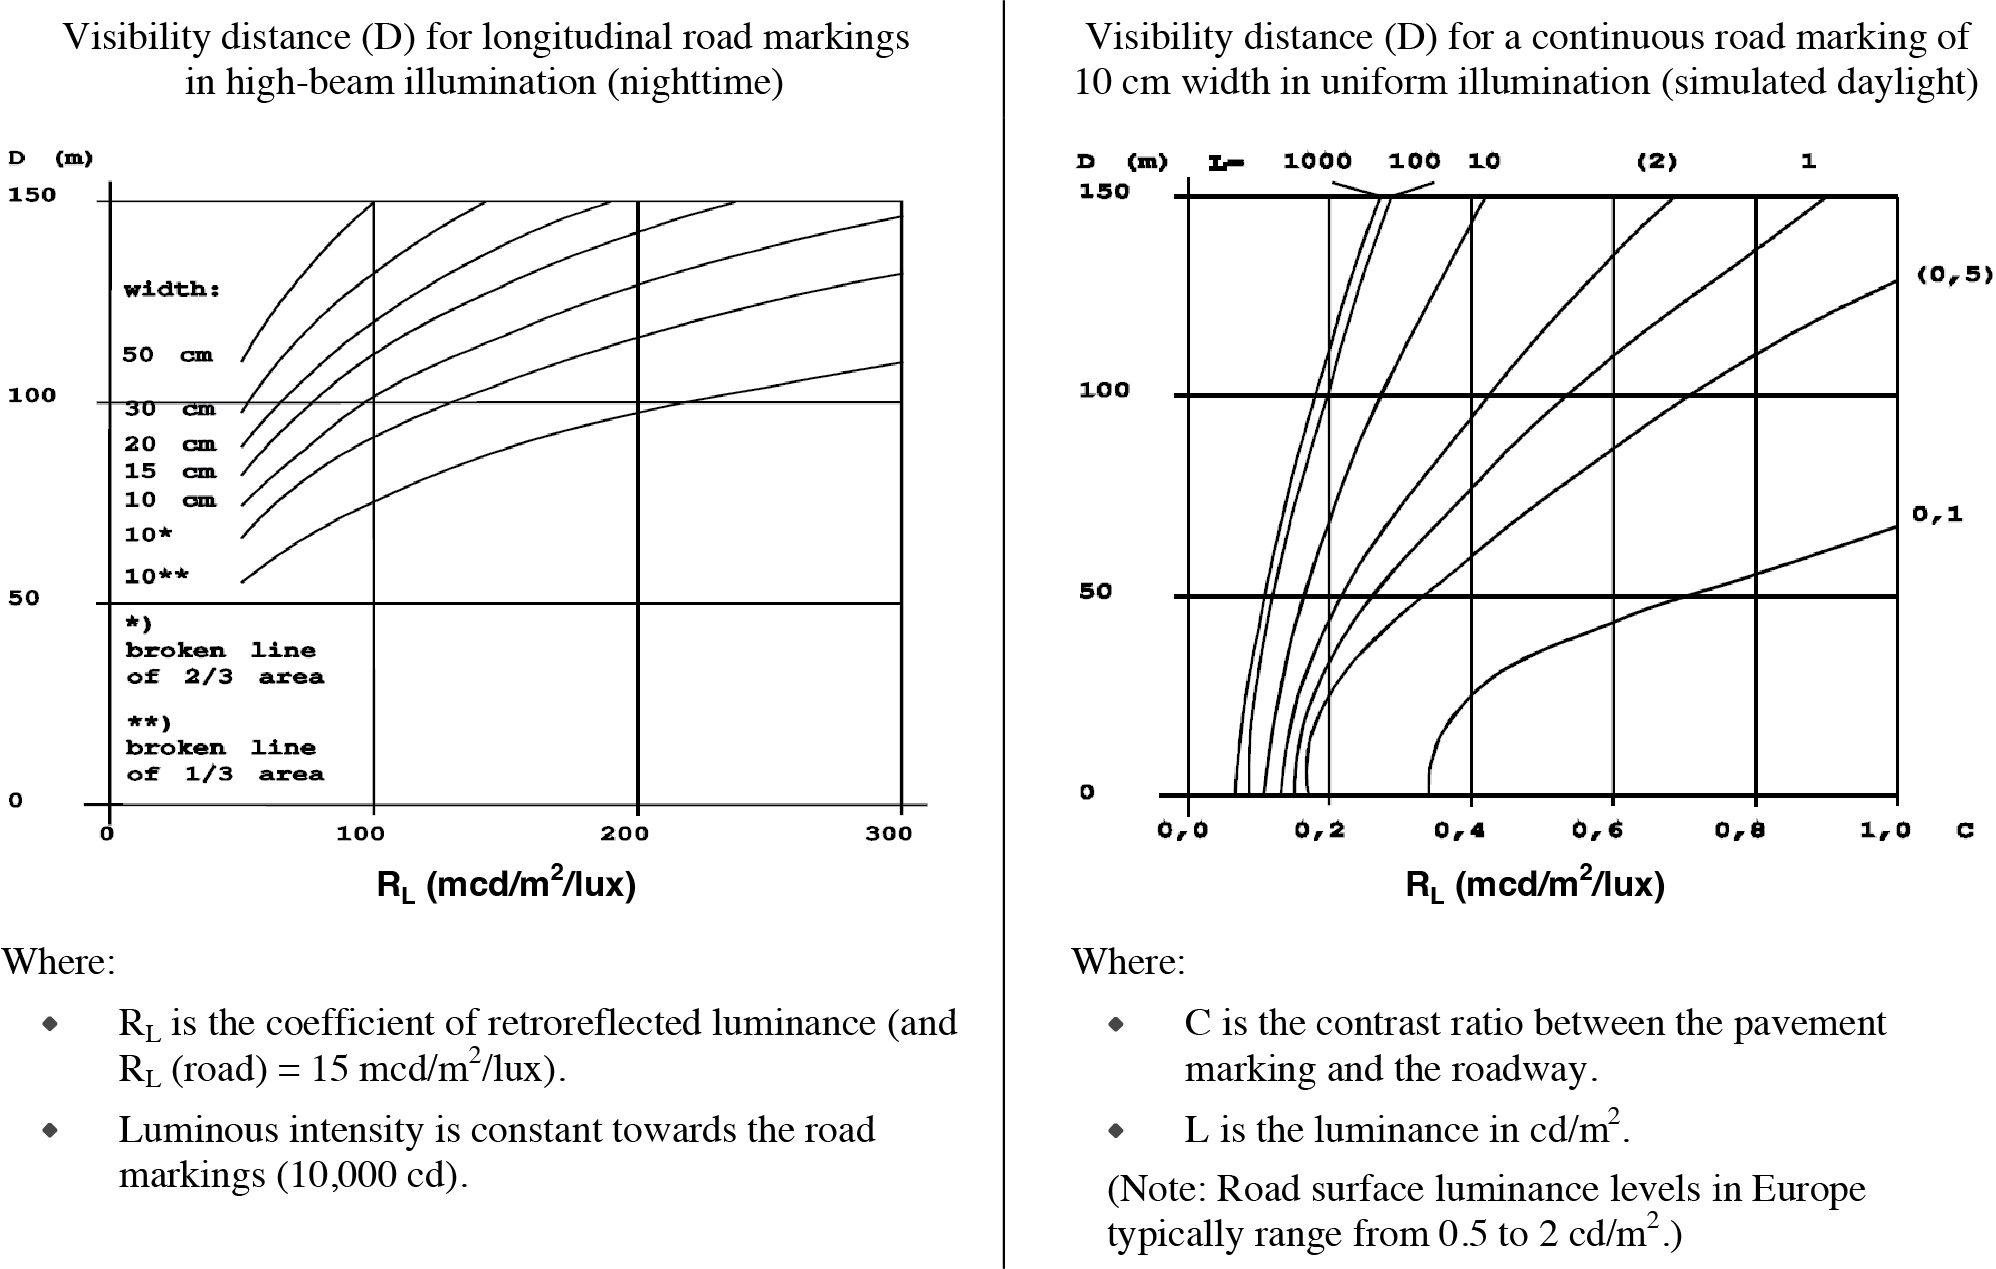
Long Description.
The vertical axis ranges from 0 to 150 in increments of 50 and the horizontal axis ranges from 0 to 300 in increments of 100. The graph shows seven curves with widths of 50 centimeters, 30 centimeters, 20 centimeters, 15 centimeters, 10 asterisks, and 10 double asterisks. All the curves show an increasing trend. Asterisk indicates a broken line of a two-thirds area and a double asterisk indicates a broken line of one-third area.
Long Description.
The graph plots C from 0.0 to 1.0 in increments of 0.2 on the bottom horizontal axis. The vertical axis plots D in meters from 0 to 150 in increments of 50 meters. The graph has seven curves that show an increasing trend.
Discussion
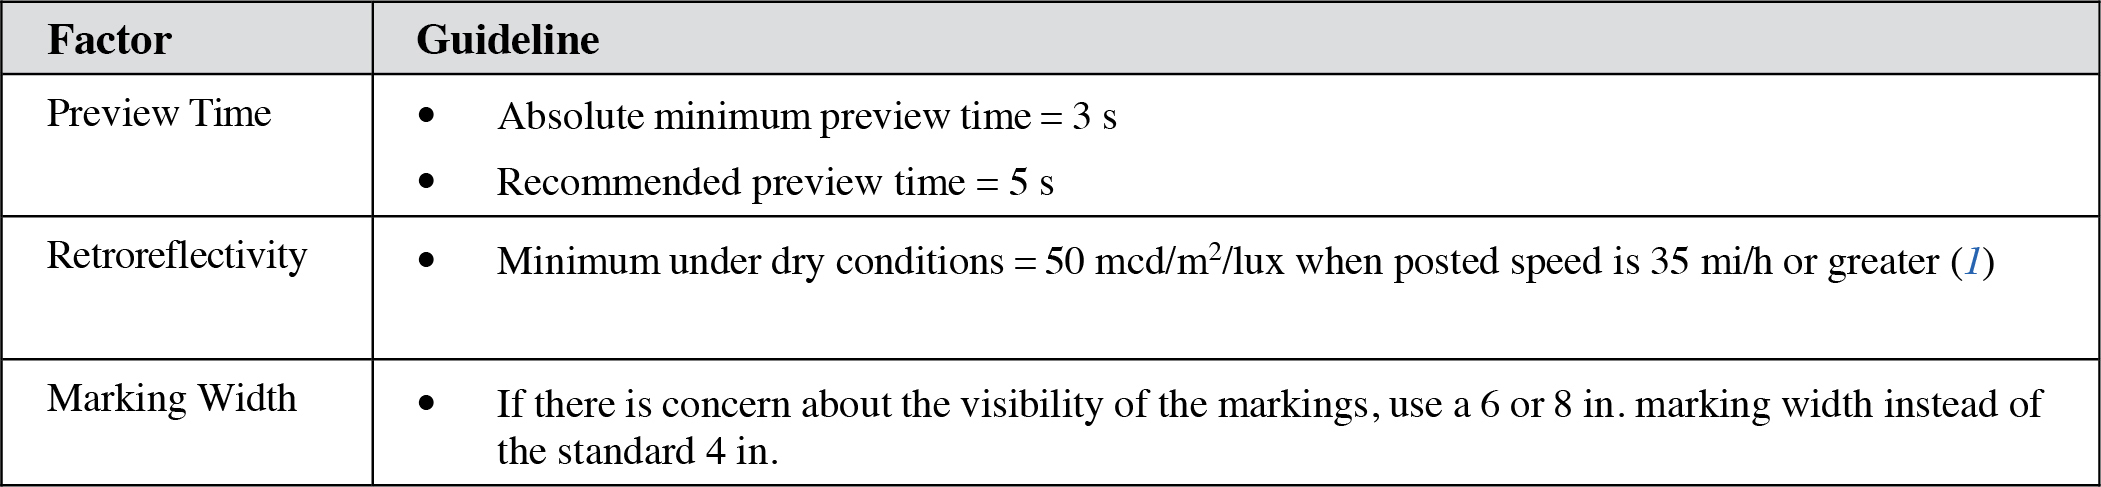
Preview time. Preview time is the amount of time that drivers look ahead on the roadway and thus reflects both distance and speed. There is some disagreement regarding the minimum amount of preview time that should be provided for drivers. Rumar and Marsh (2) determined through a literature review that a 5-s preview time accommodates proper anticipatory steering behavior, safe steering on roads that are not straight, and the minimum long-range preview time. However, the same review revealed that the Commission Internationale de lʼEclairage (CIE) recommended a lower bound of 3 s for preview time. Schnell and Zwahlen (3) suggest adding an 85th percentile eye-fixation duration of 0.65 s to the 3-s minimum chosen by the CIE to account for the time required for the driver to see and process the marking information. This value is also supported by a European study, which found that drivers initially had a 2.18-s average preview time, but when the visibility of road markings in the on-road study was increased, the preview times increased to 3.15 s on average (1). Additionally, drivers increased their speed very little to compensate for the increased marking visibility (equivalent to approximately 0.1 s of the time increase) and thus preserved the remainder of the preview time. Therefore, this recommendation is to provide a 5-s preview time when possible, but a 3-s preview time as an absolute minimum.
Retroreflectivity. Pavement line retroreflectivity affects the distance from which drivers can view a pavement marking. In a study using subjective observer ratings, Graham, Harrold, and King (4) found that 85% of participants 60 years of age and older rated markings with retroreflectance values of 100 mcd/m2/lux or greater as being adequate or more than adequate when viewed under nighttime conditions. They also calculated a 21% increase in this value (to 121 mcd/m2/lux) to account for occluded light due to dirty windshields and headlights for vehicles that are reasonably maintained. Additionally, more than 90% of the young subjects rated a marking retroreflectance of 93 mcd/m2/lux as adequate or more than adequate for night conditions. In another study utilizing subjective ratings, Ethen and Woltman (5) also found 100 mcd/m2/lux to be the minimum for dark conditions. Note that the luminances that were rated as acceptable were much higher (300 to 400 mcd/m2/lux) in comparison to the minimum values (5). The guideline for retroreflectivity reflects the 2023 MUTCD, which recommends a minimum of 50 mcd/m2/lux.
Marking width. The standard width for most longitudinal pavement markings is 4 in. In a survey of state highway agencies, 58% have used markings that are wider than the standard 4-in. marking for centerline, edge line, or lane line applications (6). The data are limited regarding the effectiveness of these markings. However, when surveyed, drivers placed high priority on the quality of pavement markings (6). A variety of studies have shown that when wider than standard pavement markings were used, mean lateral placement was more centered, fewer lane departures on curves were observed, and lane keeping in low-contrast situations improved (6). Gates and Hawkins (6) concluded that these wider markings show benefits for locations where a higher degree of lane or roadway definition is needed, such as in horizontal curves, roadways with narrow or no shoulders, and construction work zones. Although many of these findings result from a test of one width (either 6 or 8 in.), Gibbons, McElheny, and Edwards (7) found that visibility distance increased for a 6-in. width, but not correspondingly for the 8-in. width. This finding suggests that there may be a threshold where performance does not significantly increase with an increase in line width beyond 6 inches.
The 2023 MUTCD notes that “Increasing edge line width from 4 inches to 6 inches has been shown to be a beneficial countermeasure to enhance safety at locations with a history of run-off-the-road crashes (see Section 3B.09). Wider normal lines with a 6-inch width instead of the minimum 4-inch width can be beneficial to both human drivers and driving automation systems (see Section 5B.02)” (9).
Design Considerations
Problems with glare are more pronounced with the elderly because optical deficiencies of the eye increase with age (see also Chapter 26: Older Road Users). In addition to the temporal visual impairments, glare can cause discomfort and fatigue. In a simulator study with a 4-in. edge line and opposing headlamp glare conditions, subjects aged 65 to 80 required an increase in contrast of 20% to 30% over a younger sample to correctly discern downstream curve direction. To accommodate less capable drivers, the study suggests an increase in stripe brightness of 300% (8).
Cross References
None.
Key References
1. Commission Internationale de Lʼeclairage. (1999). COST 331: Requirements for Horizontal Road Marking. Luxembourg: Office for Official Publications of the European Communities. Retrieved from https://op.europa.eu/en/publication-detail/-/publication/b15e2366-e919-4aaa-b58c-0c31c8e75bc5
2. Rumar, K., and Marsh, D. K., II. (1998). Lane Markings in Night Driving: A Review of Past Research and of Present Situation (UMTRI-98-50). Ann Arbor: University of Michigan Transportation Research Institute.
3. Schnell, T., and Zwahlen, H. T. (1999). Driver preview distances at night based on driver eye scanning recordings as a function of pavement marking retroreflectivities. Transportation Research Record, 1692, 129–141.
4. Graham, J. R., Harrold, J. K., and King, L. E. (1996). Pavement marking retroreflectivity requirements for older drivers. Transportation Research Record, 1529, 65–70.
5. Ethen, J. L., and Woltman, H. L. (1986). Minimum retroreflectance for nighttime visibility of pavement markings. Transportation Research Record, 1093, 43–47.
6. Gates, T., and Hawkins, H. G. (2002). The Use of Wider Longitudinal Pavement Markings (0024-1). College Station: Texas Transportation Institute.
7. Gibbons, R. B., McElheny, M. J., and Edwards, C. J. (2006). Impact of pavement marking width on visibility distance (06-1859.pdf). Proceedings of the Transportation Research Board 85th Annual Meeting [CD-ROM].
8. FHWA. (1997). Synthesis of Human Factors Research on Older Drivers and Highway Safety Volume 2 (FHWA-RD-97-095).
9. FHWA. (2023). Manual on Uniform Traffic Control Devices for Streets and Highways. (11th ed.). Washington, DC.
EFFECTIVENESS OF SYMBOLIC MARKINGS
Introduction
Effectiveness of symbolic markings refers to the degree to which drivers follow and understand text or symbols on the roadway. A major component of pavement markings is horizontal signing, which is composed of sign text that is painted on the roadway. Horizontal signing is effective because drivers spend most of their time scanning the roadway in front of their vehicle near the horizon (1). Because drivers are already looking at the pavement, they are likely to see information there more quickly, preventing the need for an eye movement away from the road. Additionally, the pavement can be a good location to provide lane-specific information.

Discussion
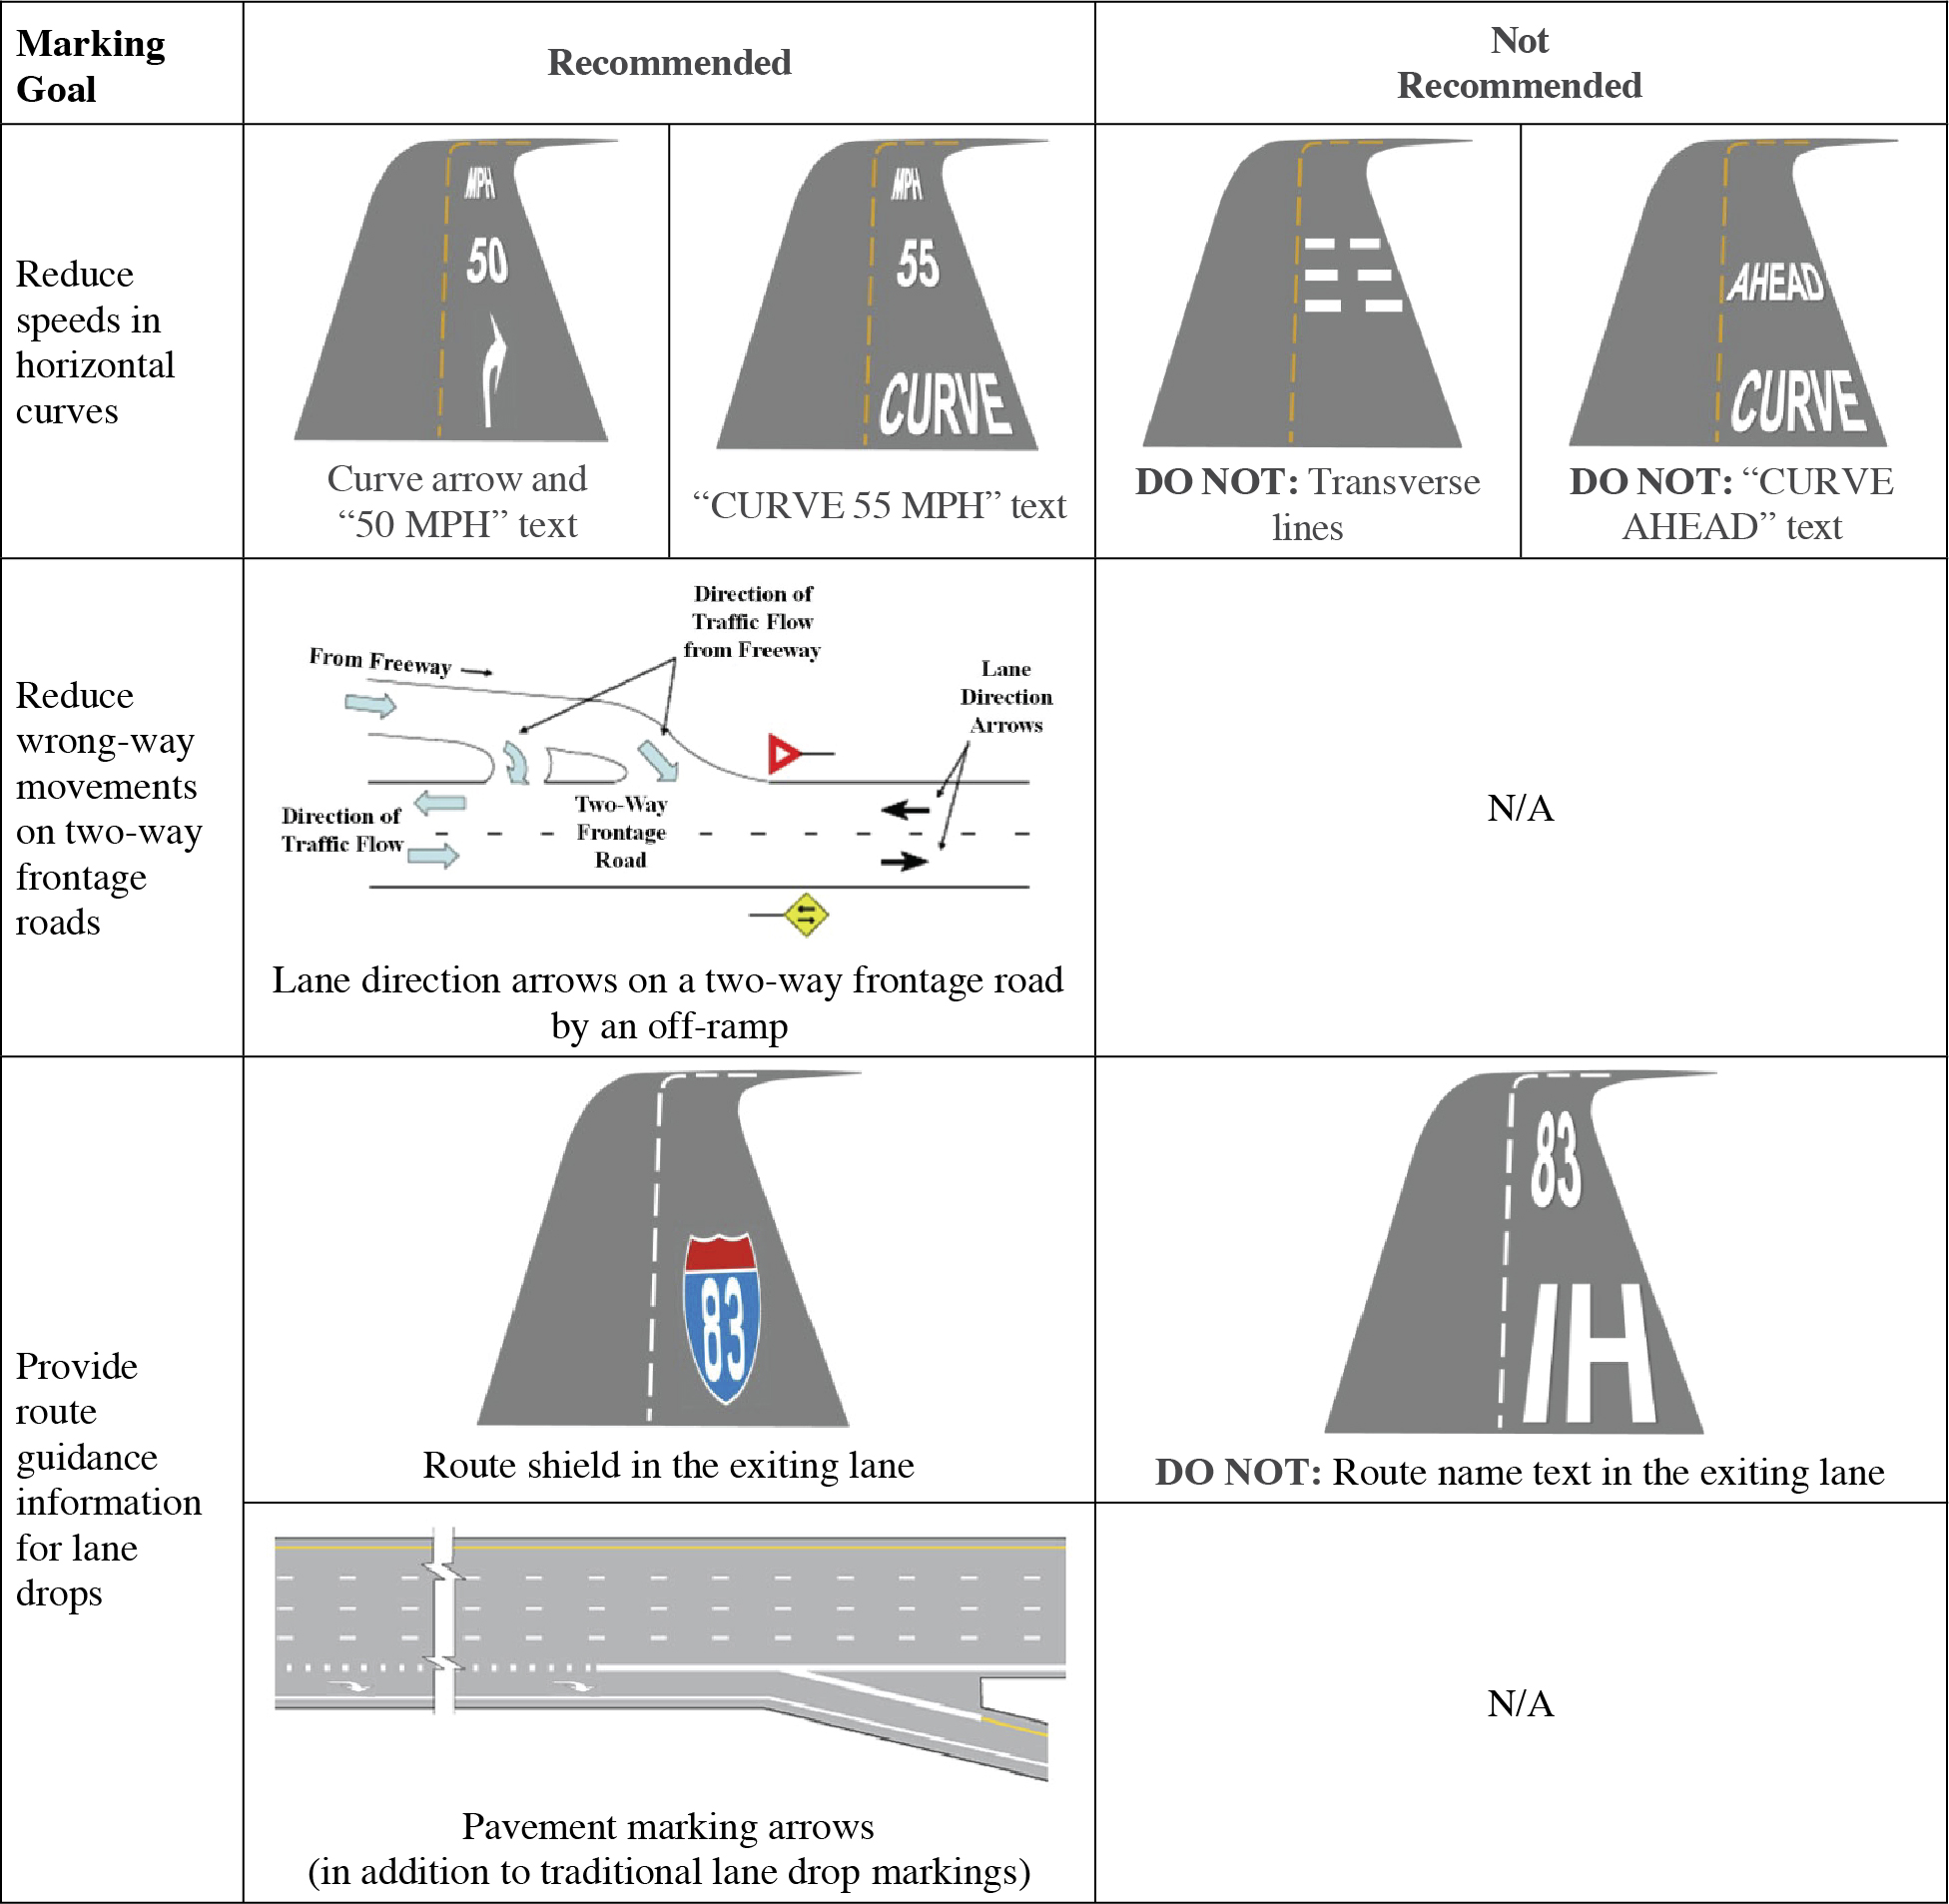
Speed reduction in horizontal curves. In an on-road study of horizontal signing to reduce speeds before horizontal curves, Chrysler and Schrock (1) found that the text “CURVE 55 MPH” reduced speeds on a rural road by approximately 4 mi/h more than the control treatment. Although this finding was not statistically significant, the benefit from this marking was greater than for the “Curve Ahead” text (which did not cause a significant reduction). When the curve arrow and “50 MPH” text were tested on an urban roadway, vehicles significantly reduced their speeds by 10% at the entrance to the curve. There was also an 11% to 20% reduction in vehicles exceeding the speed limit. Note that the curve arrow and “50 MPH” text were tested in a section of the road following a vertical crest, so the arrow provided additional information about the direction of the curve after drivers came over the crest. Another option, if advisory speeds cannot be displayed, is the text “SLOW” with a curve arrow. Retting and Farmer (2) tested this marking on a suburban road and found that it significantly reduced the percentage of drivers exceeding the speed limit by more than 5 mi/h during the daytime and late nighttime frames, but not during the evening. Overall, the markings that provided advisory speeds or an action performed most effectively.
The results of transverse line treatments have been mixed. Chrysler and Schrock (1) found that a series of three pairs of transverse lines near the middle of the lane did not cause a significant speed reduction. However, Katz (3) found that transverse lines at the lane edges resulted in speed reductions, which were significant on interstate and arterial roadways, but not rural roadways. Note that the treatments differed in multiple ways. Chrysler and Schrock (1) attempted to create a “visual rumble strip,” which would appear in the driverʼs foveal vision, on a rural road. Katz (3) used markings at the lane edges, which would appear in the driverʼs peripheral field of view and create the illusion of higher than actual speed.
Wrong-way movements on two-way frontage roads. Chrysler and Schrock (1) tested the implementation of lane direction arrows on a frontage road in Texas. The use of one-way and two-way frontage roads is widespread in Texas, potentially increasing the probability of wrong-way movements. Lane direction arrows were placed on the frontage road, 120 ft from the gore area of the exit onto the road. With the arrows installed, the rates of wrong-way driving maneuvers and conflicts were significantly reduced by 90% and almost 100%, respectively. This overwhelming reduction in wrong-way driving indicates that the treatment can have a beneficial safety influence on traffic at locations where drivers may be confused about appropriate lane selection.
Lane drops. In a study of route guidance information regarding lane drops, Chrysler and Schrock (1) surveyed drivers about route markers. The majority (94%) of respondents preferred the route shield over the route name text. However, 29% to 48% of drivers thought that the marking indicated the route they were currently on rather than the upcoming exit. Therefore, route shields may be effective when used with other lane drop signs/markings. Fitzpatrick, Lance, and Lienau (4) tested another lane drop indicator: pavement marking arrows. With the addition of pavement marking arrows, erratic maneuvers such as lane changes through the gore and attempted lane changes decreased. Drivers continuing on the main route moved out of the exit lane earlier. Although these results were only significant for two out of the three sites tested, the other site had a lane drop only 1.6 km (1 mi) long, and vehicles may have shifted through the exit lane upstream of the study segment.
Design Considerations
Horizontal signing has two issues that can be broadly applied: visibility of the markings and durability of the materials on the travel lane. Horizontal markings viewed during daytime must contrast with the road surface. White markings may not provide an adequate contrast for symbol recognition or word legibility when viewed against a concrete or worn asphalt surface.
Conversely, nighttime visibility is affected by the durability of the optical elements presented in the marking material, typically glass beads. Other visibility limitations can be found in shortened headways due to traffic congestion that may not be large enough for full horizontal sign viewing. Horizontal signs should have large simple components and should be visually unique to the highest possible degree. Proper application using text or symbols should minimize the use of abbreviations, keeping the symbols simple and legible. By limiting the application to critical locations, drivers will be able to recognize these signs as an added warning or caution (5).
Chrysler and Schrock (1) determined that when drivers are undergoing stressful driving conditions or situations where too much information is presented at one time, they will practice “load shedding” by ignoring the least important information and focusing on the more important tasks. Drivers will tend to look at the road more and at side or overhead-mounted signing less when “load shedding” takes place. This behavior increases the importance of horizontal signing in the area where drivers look most.
Cross References
None.
Key References
1. Chrysler, S., and Schrock, S. (2005). Field Evaluations and Driver Comprehension Studies of Horizontal Signing (FHWA/TX-05/0-4471-2). College Station: Texas Transportation Institute.
2. Retting, R. A., and Farmer, C. M. (1998). Use of pavement markings to reduce excessive traffic speeds on hazardous curves. ITE Journal, 68(9), 30–34, 36. Retrieved from: http://www.ite.org/membersonly/itejournal/pdf/JIA98A30.pdf/.
3. Katz, B. J. (2004). Pavement Markings for Speed Reduction. McLean, VA: Turner-Fairbank Highway Research Center.
4. Fitzpatrick, K., Lance, M., and Lienau, T. (1995). Effects of pavement markings on driver behavior at freeway lane drop exits. Transportation Research Record, 1495, 17–27.
5. Chrysler, S., Schrock, S., and Williams, A. (2006). Research Recommendations for Pavement Marking Words and Symbols. College Station: Texas Transportation Institute.
MARKINGS FOR PEDESTRIAN AND BICYCLIST SAFETY
Introduction
Markings for pedestrian and bicyclist safety refers to pavement marking techniques to encourage safe practices for road sharing by vehicles, pedestrians, and bicycles. Pedestrian markings include crosswalks, which are defined as marked or unmarked extensions of sidewalks or shoulders across intersections (1). Crosswalks may also be located midblock, but only if marked.
Bicycles and vehicles may utilize shared lanes on either rural or non-rural roadways. The purpose of markings in shared lanes is to notify users that the lane is shared and clearly define the positioning of the traffic flows.

Discussion
Crosswalks. Zegeer et al. (1) provide guidelines for the locations where marked crosswalks should be installed based upon a study of pedestrian crashes at marked and unmarked crosswalks. The guidelines apply to uncontrolled locations, excluding school crossings. Crosswalks should not be installed in locations where additional pedestrian safety risks exist (e.g., poor sight distance, confusing designs) without other design features or traffic control devices (1). Crosswalks alone do not make crossings safer or guarantee that more vehicles will stop for pedestrians.
Chan et al. (3) found that vehicle-pedestrian crashes are a potential risk when vehicles are turning and pedestrians are crossing the lateral direction across the intended path of the vehicle. The Uniform Vehicle Code (4) specifies that parking should be prohibited within 20 ft of a crosswalk at an intersection (which could be increased to 30 to 50 ft in advance of a crosswalk on a high-speed road).
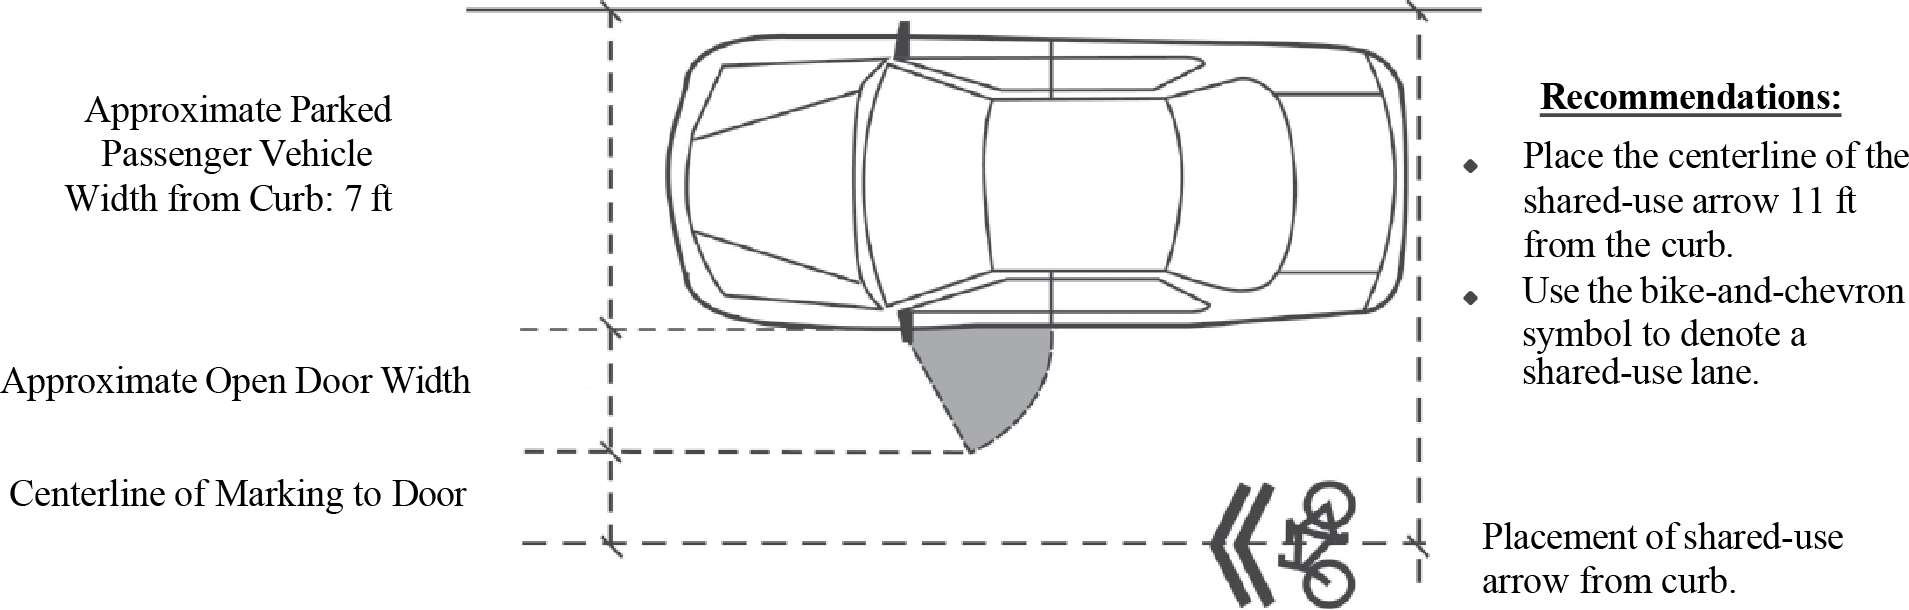
Design of the shared-use arrow. Shared-use arrows (also referred to as “sharrows”) on roadways attempt to reduce safety problems such as “dooring,” where bicyclists ride into parked vehicle doors when ajar; wrong-side riding; sidewalk riding; motorists squeezing out bicyclists; and other aggressive behaviors (2). Shared pavement markings can increase the percentage of bicyclists riding in the street, which can help reduce crashes with turning vehicles.
Two bicyclist surveys and an on-road study regarding a number of shared-lane markings were conducted in San Francisco (2, 5). The lane markings tested were bike-and-chevron (shown on the previous page), bike-in-arrow (bicyclist inside of an arrow outline), and a separated bike-and-arrow. During the on-road study, the bike-and-chevron marking significantly reduced sidewalk riding (by 35%) and wrong-way riding (by 80%). It also increased all distances between moving cars, cyclists, and parked cars. Overall, 60% of cyclists thought that the markings positively affected their sense of safety and preferred the bike-and-chevron marking by a 2:1 ratio. 30% of cyclists indicated that the markings tested meant that bikes have priority, rather than that the lane is shared.
The distance of the shared-use arrow from the curb is based on the parked vehicle width. Birk et al. (2) observed that the 85th percentile of car doors open 9 ft 6 in. from the curb, the average bicycle width is 2 ft, and 6 in. of “shy distance” is added between the open door and bicycle handlebars. In total, these distances indicate that the centerline of the pavement marking should be 11 ft from the curb.
Design Considerations
Crosswalk lighting. In-roadway crosswalk warning lights can provide pedestrians with safety benefits. With in-roadway warning lights: passing vehicle speeds decreased from 7% to 44% (6, 7), the percentage of drivers yielding to pedestrians increased during day and night by 26% to 162% (8), and the percentage of drivers who saw the crosswalk, saw a pedestrian, and accurately stated the presence of the pedestrian increased by 13%, 25%, and 38%, respectively (8).
Shared lanes. Shared-use lanes often exist where there is too little space available to create a dedicated bicycle lane. When space is available, a bicycle lane or a wide curb lane may be created; however, there is disagreement as to which is better. See Hunter et al. (9) for a discussion of each lane type.
Friction. Pavement markings can be designed, installed, and maintained to provide adequate friction for pedestrians and bicyclists.
Cross References
None.
Key References
1. Zegeer, C. V., Stewart, J. R., Huang, H. M., Lagerwey, P. A., Feaganes, J., and Campbell, B. J. (2005). Safety Effects of Marked Versus Unmarked Crosswalks at Uncontrolled Locations, Final Report and Recommended Guidelines (HRT-04-100). McLean, VA: FHWA. Retrieved from http://www.tfhrc.gov/safety/pubs/04100/04100.pdf
2. Birk, M., Khan, A., Moore, I., and Lerch, D. (2004). San Franciscoʼs shared lane pavement markings: improving bicycle safety. (Prepared for San Francisco Department of Parking and Traffic). Alta Planning + Design. Retrieved June 3, 2008 from http://www.sccrtc.org/bikes/SF-SharedLaneMarkingReport-Feb04-FINAL.pdf
3. Chan, C., et al. (2005). California Intersection Decision Support: A Systems Approach to Achieve Nationally Interoperable Solutions. (California PATH Research Report UCB-ITS-PRR-2005-11). Berkeley, CA: University of California, Berkeley.
4. National Committee on Uniform Traffic Laws and Ordinances. (1992). Uniform Vehicle Code: 2000. Evanston, IL.
5. Center for Education and Research in Safety. (2002). Report on human factors comparison on perceived meaning of three alternative shared use symbols (Submitted to The City of San Francisco). Retrieved from http://members.cox.net/ncutcdbtc/sls/cerssf02.pdf
6. Dougald, L. (2004). Development of Guidelines for Installation of Marked Crosswalks (VTRC 05-R18). Charlottesville: Virginia Transportation Research Council.
7. Whitlock and Weinberger Transportation. (1998). An Evaluation of a Crosswalk Warning System Utilizing In-Pavement Flashing Lights [Executive Summary]. Retrieved from http://www.spotdevices.com/docs/studies/EvaluationCrosswalkWarningSystemUtilizingInPavementLights.pdf
8. Katz, Okitsu and Associates. (2000). Illuminated crosswalks: An evaluation study and policy recommendations (Prepared for the City of Fountain Valley, California). Tustin, CA.
9. Hunter, W. W., Stewart, J. R., Stutts, J. C., Huany, H. H., and Pein, W. E. (1998). A Comparative Analysis of Bicycle Lanes versus Wide Curb Lanes: Final Report. (FHWA-RD-99-034). McLean, VA: FHWA.
POST-MOUNTED DELINEATORS
Introduction
Post-mounted delineators (PMDs) are a type of retroreflective marking device mounted above the roadway surface and along the side of the roadway in a series to indicate the alignment of the roadway. Delineators are particularly useful at locations where the alignment might be confusing or unexpected, such as at lane reduction transitions and/or curves (1). They are also useful at night and during adverse weather. Delineators may be used on long sections of highways or on short sections where there are changes in horizontal alignment. An important advantage of delineators is that they remain visible when the roadway is wet or snow-covered.


Discussion
Spacing. Charlton (3) found that driversʼ perceptions of speed and curvature appear to work at both a conscious (explicit) and unconscious (implicit) level. For this reason, curve warnings and delineation treatments that highlight the sharpness of the curve ahead or increase driversʼ momentary sense of their apparent speed appear to offer promise in encouraging drivers to enter curves at a lower speed. Delineation treatments may also assist drivers with selecting and maintaining an appropriate lane position while traveling throughout the curve.
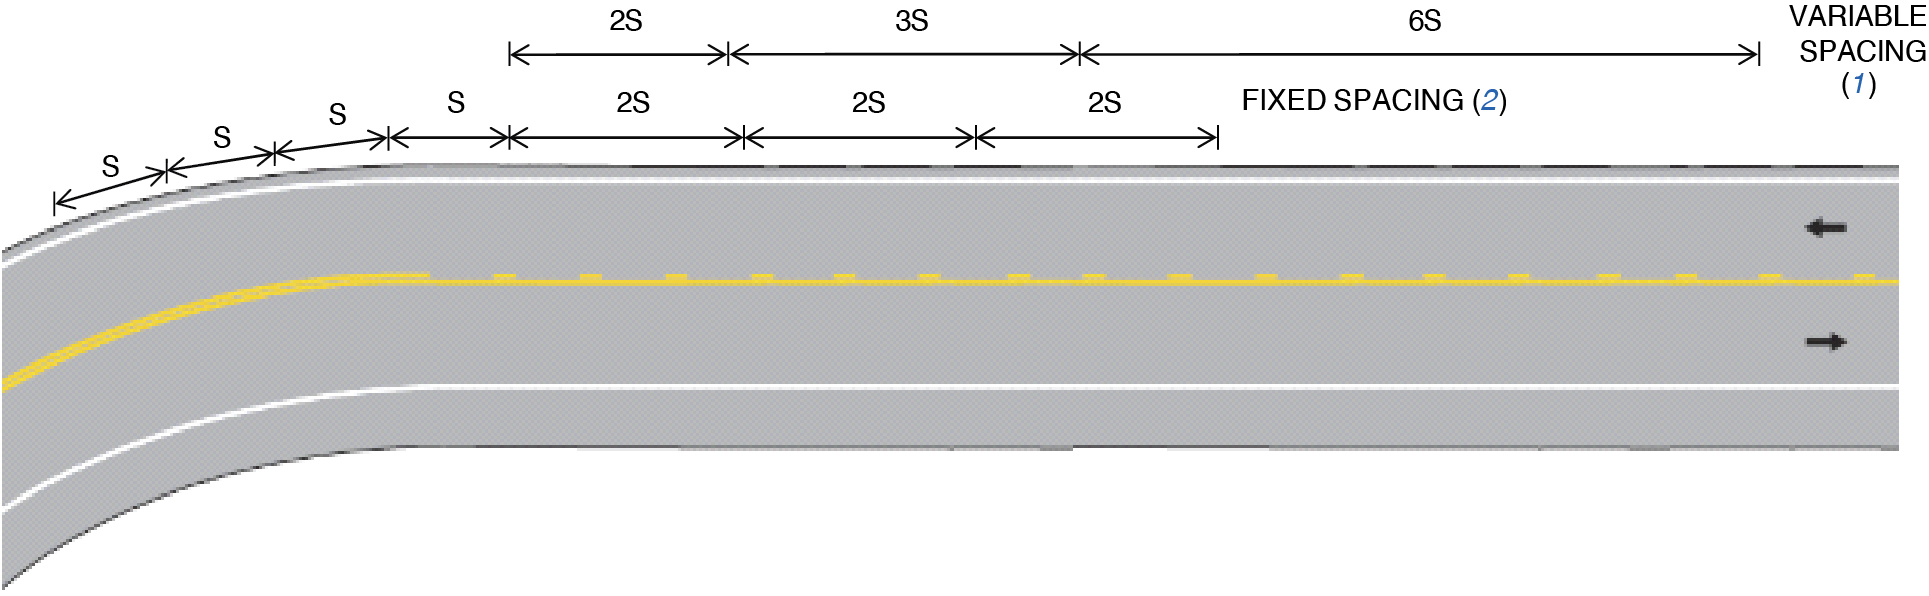
Chrysler et al. (2) found that drivers cannot distinguish between fixed and variable delineator spacing on the approaches to horizontal curves. The two types of spacing led to functionally equivalent curve perceptions. Thus, Chrysler et al. (2) recommend that the approach and departure delineator spacings be fixed at two times the appropriate curve spacing found in the MUTCD. This recommendation can save installation time without sacrificing safety. More specific information on spacing on horizontal curves can be found in the MUTCD.
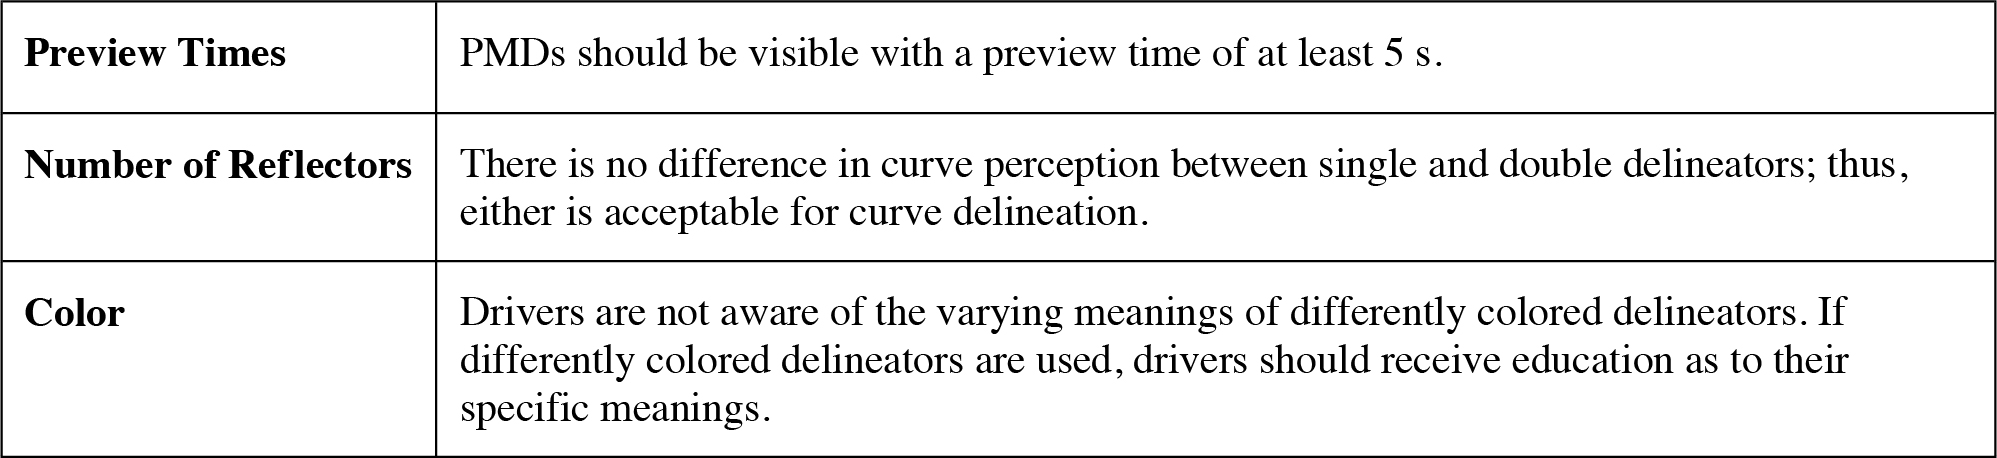
Preview time. Rumar and Marsh (4) explained two complementary road guidance functions: short-range and long-range guidance. Long-range guidance (over 5 s of preview time) allows the driver to consciously predict the path of the roadway far in advance, drive smoothly, and avoid time-pressure situations. Rumar and Marsh (4) found that preview times provided by lane markings alone are well under a safety criterion of 5 s and thus concluded that current lane markings are not optimal for safe night driving. Good and Baxter (5) found that the addition of PMDs tends to have a positive effect for long-range guidance but has no effect on short-range guidance. To be usable for long-range guidance, PMDs should be visible at a preview time of at least 5 s [about 440 ft at 60 mi/h (140 m at 100 km/h)] under low-beam illumination.
Number of reflectors. Chrysler et al. (2) found that the perception of curvature is not affected by the number of reflectors on the delineator. However, the combination of one reflector and variable spacing leading up to the curve caused the perception of less curvature. Overall, Chrysler et al. (2) recommend that the MUTCD eliminate the distinction between the two types of delineators and define a standard delineator. Larger delineators could still be used for emphasis where necessary.
Color. Chrysler et al. (2) found that drivers do not understand the difference in placement for yellow and white delineators. Although response accuracy was poor for curve delineator color, when given a forced-choice question regarding crossover delineation, most drivers could recognize the correct color. This finding led to the recommendation of putting more emphasis on delineator color in driver education courses rather than altering the MUTCD.
Design Considerations
Another use of delineators is to define the roadway leading up to a railroad grade crossing. At rural crossings without active warning devices, the lighting may be poor and drivers may be more reliant on auditory train signals to know if a train is approaching. However, these auditory signals may not be completely effective for drivers who are hearing impaired. Staplin et al. found that approximately 30% to 35% of people aged 65 to 75 have a hearing loss, increasing to 40% for persons over the age of 75 (6). The use of PMDs would help highlight to hearing-impaired drivers that a railroad crossing is imminent.
Cross References
None.
Key References
1. FHWA. (2023). Manual on Uniform Traffic Control Devices for Streets and Highways. (11th ed.). Washington, DC.
2. Chrysler, S. T., Carlson, P. J., and Williams, A. A. (2005). Simplifying delineator applications for horizontal curves. Transportation Research Record, 1918, 68–75.
3. Charlton, S. G. (2007). The role of attention in horizontal curves: a comparison of advance warning, delineator, and road marking treatments. Accident Analysis & Prevention, 39(5), 873–885.
4. Rumar, K., and Marsh, D. K., II. (1998). Lane Markings in Night Driving: A Review of Past Research and of the Present Situation. (UMTRI-98-50). Ann Arbor: University of Michigan Transportation Research Institute.
5. Good, M. C., and Baxter, G. L. (1985). Evaluation of Short-Range Roadway Delineation (Internal Report No. AIR 381-1). Melbourne: Australian Research Board.
6. Staplin, L., Lococo, K. H., Byington, S., and Harkey, D. (2001). Guidelines and Recommendations to Accommodate Older Drivers and Pedestrians (FHWA-RD-01-051). McLean, VA: FHWA.
MARKINGS FOR ROUNDABOUTS
Introduction
Markings for roundabouts are pavement markings on the entrances to and exits from roundabout intersections. Roundabout intersections are defined by the MUTCD (1) as “circular intersections with yield control at entry, which permits a vehicle on the circulatory roadway to proceed, and with deflection of the approaching vehicle counterclockwise around a central island.” Roundabout markings need to display clear information to incoming drivers to ensure the safe circulation of vehicles. Conflict points occur where one vehicle path crosses, merges, or diverges with or queues behind the path of another vehicle, pedestrian, or bicycle. Within roundabouts, fewer conflict points occur as compared to conventional intersections; hazardous conflicts such as right-angle and left-turn head-on crashes are eliminated. Single-lane approach roundabouts provide greater safety benefits than multilane approaches because there are fewer potential conflicts between road users, and pedestrian crossings are shorter. Robinson et al. (2) note that lower vehicle speeds when entering and in the roundabout provide drivers more time to deal with potential conflicts.

Discussion
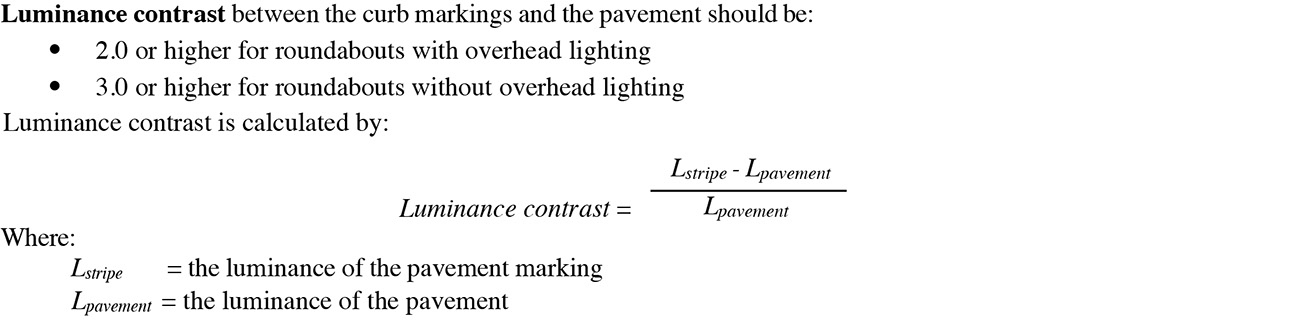
Luminance contrast. Brewer, Murillo, and Pate (3) recommended that retroreflective markings be applied to the sides and tops of the curbs on the splitter islands and the central island. The curb contrast levels refer to the contrast between these markings and the pavement. For roundabouts with overhead lighting, a contrast of 2.0 or higher was recommended. For roundabouts without overhead lighting, a contrast of 3.0 or higher was recommended. Staplin et al. (4) state that the luminance measurements should be taken at night, using low-beam headlamp illumination from a passenger vehicle, and at a 5-s preview distance upstream of the intersection.
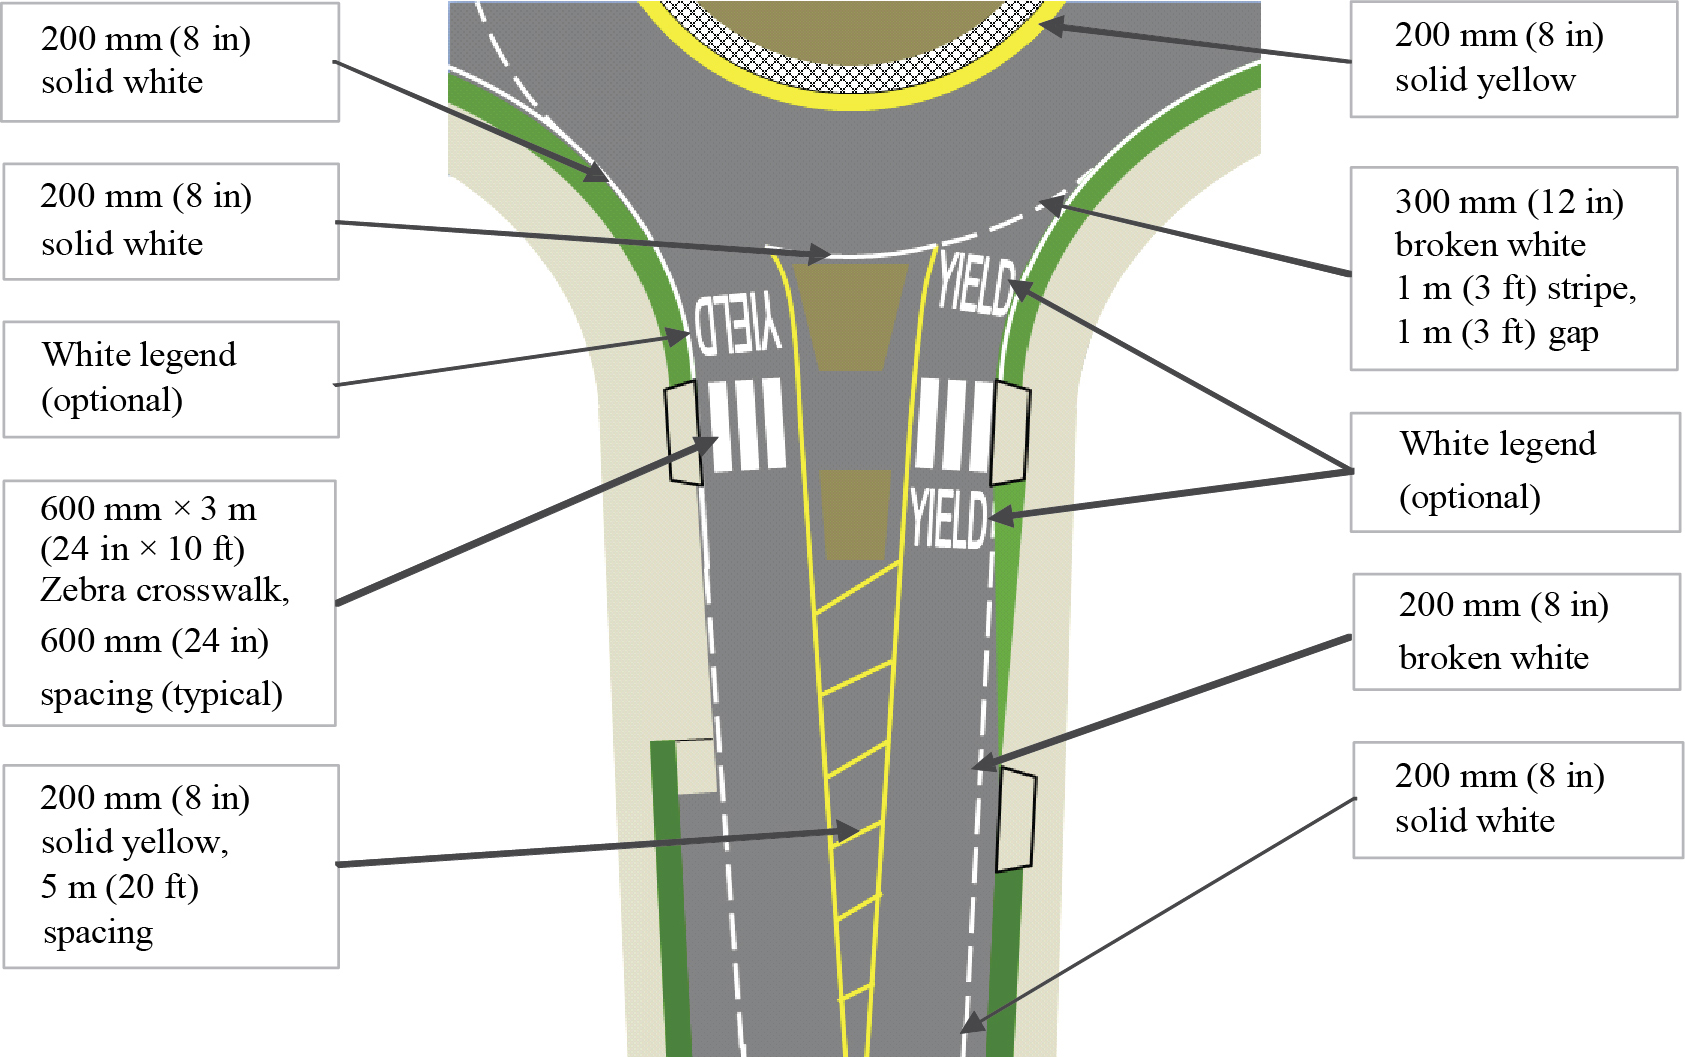
Recommended roundabout pavement markings. The pavement markings in the figure shown on the previous page are from Roundabouts: An Informational Guide (2) and differ slightly from those included in the MUTCD (1). Several markings are usually placed within roundabouts to help regulate the flow and speeds of oncoming vehicles. Such markings include broken white lines, solid white lines, solid yellow lines, crosswalk markings, and roadway marking text “Yield.” Roundabout lane markings follow the logic that yellow lines denote opposing traffic and white lines denote traffic moving in the same direction. A solid white line marks the right edge of the road.
A fundamental difference between roundabouts and traditional intersections is the continuous flow of traffic at roundabouts vs. the alternating of opposing traffic flows at traditional intersections (2). This difference creates different visual demands at roundabouts, where the driver is not given the right-of-way by traffic signals. Also, pedestrians are not given signaled time to cross roundabouts. The placement of crosswalks at roundabouts is further back in order to move pedestrians out of the continuous traffic flow. This placement also reduces the visual demands for drivers who otherwise would be required to look for approaching vehicles from the left and pedestrians from the right as they entered the roundabout. With the crosswalk further from the circular area, pedestrians cross in the driversʼ forward field of vision (2).
Crosswalks. Crosswalks preceding the roundabout have a high degree of visibility because they are set back from the yield line. Zebra crossings are recommended because they are highly visible, distinguish the intersection from signalized intersections, and are less likely to be confused with the yield line than transverse crosswalks (2).
Bicycle lanes. The MUTCD (1) states that bicycle lane markings shall not be included within the circulatory roadway of a roundabout that includes conflicts at entry or exit points. The MUTCD does not give a reason for this, but doing so would clearly complicate the roundabout, and perhaps create confusion or additional opportunities for vehicle/bicycle conflicts. The figure on the previous page shows how Robinson et al. (2) suggest that bicycle lanes should be included on an approach to a roundabout. This design provides a curb ramp where the bicycle lane ends to allow bicyclists to transition as a pedestrian to the sidewalk. Robinson et al. (2) state that, at roundabouts, bicyclists can circulate with other vehicles, travel as a pedestrian on the sidewalk, or use a separate shared-use facility for pedestrians and bicyclists where provided.
Design Considerations
Stopping sight distance. Stopping sight distance should be provided at every point within a roundabout and on each entrance and exit (2). On the approach, vehicles need to have a stopping sight distance to the crosswalk and the yield line. When circulating, vehicles need to be able to see that same distance around the circle. When exiting the roundabout, vehicles need a stopping sight distance to the crosswalk. The intersection sight distance is the distance that a driver without the right-of-way needs in order to see and react to conflicting vehicles before entering the roundabout (2). Because of the geometry of the roundabout, the intersection sight distance implies drivers must look over/through part of the central island. This requirement poses restrictions on the height and placement of objects and landscaping in that island; appropriate sight distance requires a clear central island. However, Robinson et al. (2) recommend that only the minimum intersection sight distance should be provided because excessive sight distance can lead to higher vehicle speeds, reducing safety for all users.
Cross References
None.
Key References
1. FHWA. (2023). Manual on Uniform Traffic Control Devices for Streets and Highways. (11th ed.) Washington, DC.
2. Robinson, B. W., Rodegerdts, L., Scaraborough, W., Kittelson, W., Troutbeck, R., Brilon, W., et al. (2000). Roundabouts: An Informational Guide (FHWA-RD-00-067). McLean, VA: FHWA.
3. Brewer, M., Murillo, D., and Pate, A. (June 2014). Handbook for Designing Roadways for the Aging Population (FHWA-SA-14-015). McLean, VA: FHWA.
4. Staplin, L., Lococo, K. H., Byington, S., and Harkey, D. (2001). Guidelines and Recommendations to Accommodate Older Drivers and Pedestrians (FHWA-RD-01-051). McLean, VA: FHWA.


