Human Factors Guidelines for Road Systems: Third Edition (2025)
Chapter: 3 Understanding the Road User's Information-Seeking Behavior

CHAPTER 3
Understanding the Road Userʼs Information-Seeking Behavior
Introduction
Some people have said the primary decision-maker in the highway transportation system is the road user. But this statement is just not true. It is not true because many primary decisions are made before the road user ever sees and uses the road. During design and/or reconstruction, primary decisions include the magnitude of the vertical and horizontal alignment, the type of traffic control, and the vehicles permitted on the facility, among others; these decisions are made by highway designers and traffic engineers.
The purpose of this chapter is to remind users of the HFG that road users must read and comprehend from the roadway what the traffic planner, highway designer, and traffic engineer intend for them to do. (Note that there are now many vehicles with “driver assist” features that change the ways road users understand roadways. Many of the statements in the HFG regarding “road users” are intended for human road users driving legacy vehicles.) The roadway system is essentially a communications system, and the job of the traffic safety practitioner is to make sure that the roadway is communicating the right things at the right times to all road users. Unfortunately, the road users are not highway designers or traffic engineers, and what they comprehend, while logical to them, may not be what the highway designers and traffic engineers intended. In short, this chapter illustrates that highway designers and traffic engineers must work together and serve as virtual road users if their goal is to maximize or improve highway safety. This chapter will show through examples why the highway designers and traffic engineers must jointly consider how their individual work may be interpreted by the road user and whether that interpretation promotes user safety.
The Road User as a Component of the Highway System
Highway systems have three major components: the road, traffic control, and users with or without a vehicle (Figure 3-1). For the highway system to operate efficiently and safely, each of these components must work together as a combined unit. This task is not easy, largely because of the wide range of roadway environments, vehicles, and users. Highway systems are composed of local roads, collectors, arterials, and freeways—each having specific design features suitable for their environment. Vehicles using the roads vary widely with respect to weight, size, and performance. Vehicles using the roads may be small, light-weight vehicles with limited power; moderate-size and -powered vehicles; or large, heavy trucks with the horsepower to operate at high speeds. Also, the population of road users includes car and truck operators, pedestrians, motorcycle operators, and bicycle riders. All of these users operate, sometimes, with some degree of physiological disability.
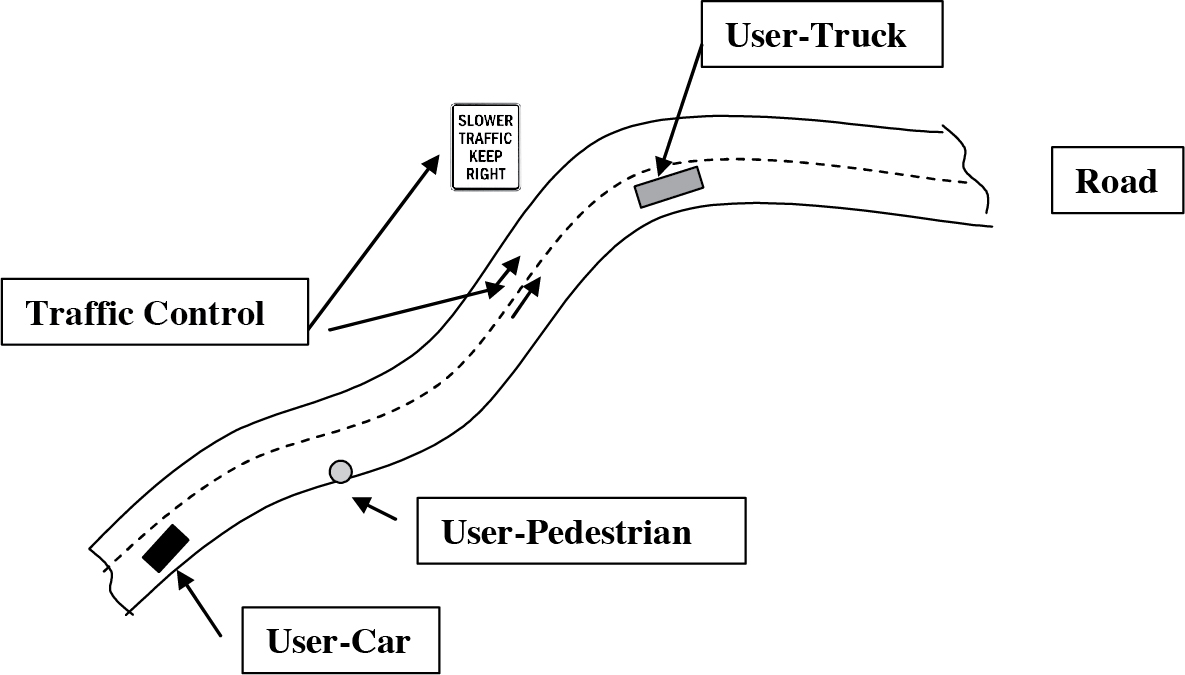
Long Description.
The major components of a highway system include road, user-truck, traffic control, user-pedestrian, and user-car.
If the goal is to provide highway travel for road users that is both safe and operationally efficient, the needs and constraints of highway design, traffic control, and users must be successfully integrated. Together, they must perform as one—not a group of three. Highway designers must know the impact of their design decisions and how they will affect the control needs of traffic engineers as well as the resulting impact they will have on users in performing efficiently and safely. When designs provide information that is confusing or create unintended outcomes, the traffic engineer may not be able to fully change road user decision making without significant redesign of the road. Safer roads are those that are self-explaining (or self-enforcing), where users know how to behave solely because of the design and control of the road (Theeuwes and Godthelp, 1992).
Failures in how users interact with the roadways in the United States can be measured by the more than 42,000 fatalities, 2.4 million injuries, more than 6 million police-reported crashes, and many more unreported crashes that occurred in 2021 (National Center for Statistics and Analysis, 2023c). System failures can be attributed to errors by drivers, design, traffic control, and combinations of these factors (Hauer, 1999).
Design and operation solutions must be jointly developed by highway designers and traffic engineers, with both totally aware and cognizant of the needs and limitations of all road users. In effect, they must incorporate into their joint solutions human factors principles that are in keeping with the needs of all users.
Example Problems of Highway Designers and Traffic Engineers
The following examples illustrate typical design and operational problems where consideration of good human factors principles is appropriate.
- An intersection with the crossing road at an acute angle (30°) has experienced an unusually high number of crashes (Figure 3-2). The county supervisors have asked the local highway agency for a review and recommendation on what should be done to correct the problem. After reviewing the site, the current and projected traffic flow, and the expected land development in the area, the agency recommended that the intersection be changed. Options considered included using stop control on each approach, signalization, and redesign. Neither all-way stop control nor signalization met the MUTCD warrants; therefore, they were discarded as options (FHWA, 2009). Research literature indicates that drivers have difficulty estimating gap size and
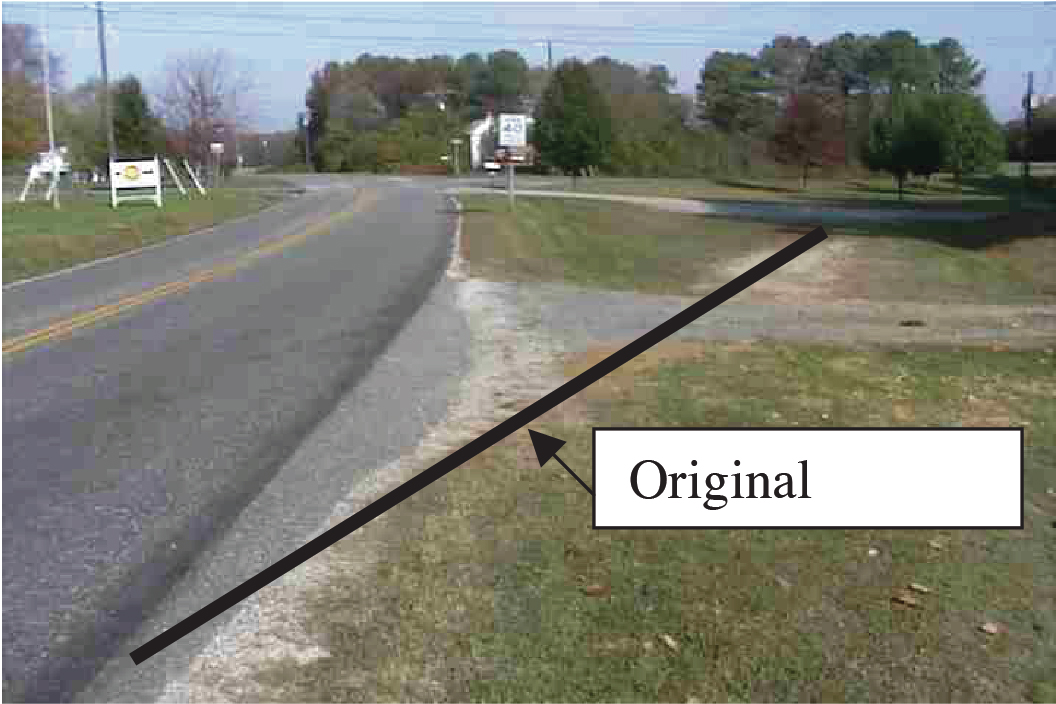
Long Description.
The original intersection and the recommended perpendicular approach are shown.
- speed of approaching vehicles at intersections where intersecting roads are not within about 25° of normal (Pline, 1992). The recommended solution after taking into account the human factors element was to redesign the crossing road approach to eliminate the acute angle so the approach would be nearly perpendicular to the major road. Figure 3-2 shows the redesigned intersection, along with a diagram illustrating the position of the acute-angle intersection.
- Each end of a 1-mi section of a two-lane road in a suburban area had been improved to a four-lane divided highway. The remaining two-lane road had very bad vertical curvature and a cross section with very narrow shoulders; thus, the two-lane road environment was very different from either the upstream or downstream road sections. The speed limit was 40 mph within the two-lane section and the newer four-lane sections. The two-lane section seemed to have a higher-than-normal number of crashes. The highway agency requested that the safety, design, and traffic engineers review the roadway and provide recommendations on what should be done. The crash occurrence during the day was not found to be unusually high. At night, however, the crash occurrence was unusually high. Drivers approaching the sharp, vertical crests were running off the road and hitting roadside objects. The engineers recommended that advance curve warning signs, vertical delineators, and roadway lighting be installed in the two-lane section to help prevent drivers approaching crests at night from being overcome by sudden glare produced by opposing vehicles previously hidden in the sags, as shown in Figure 3-3.
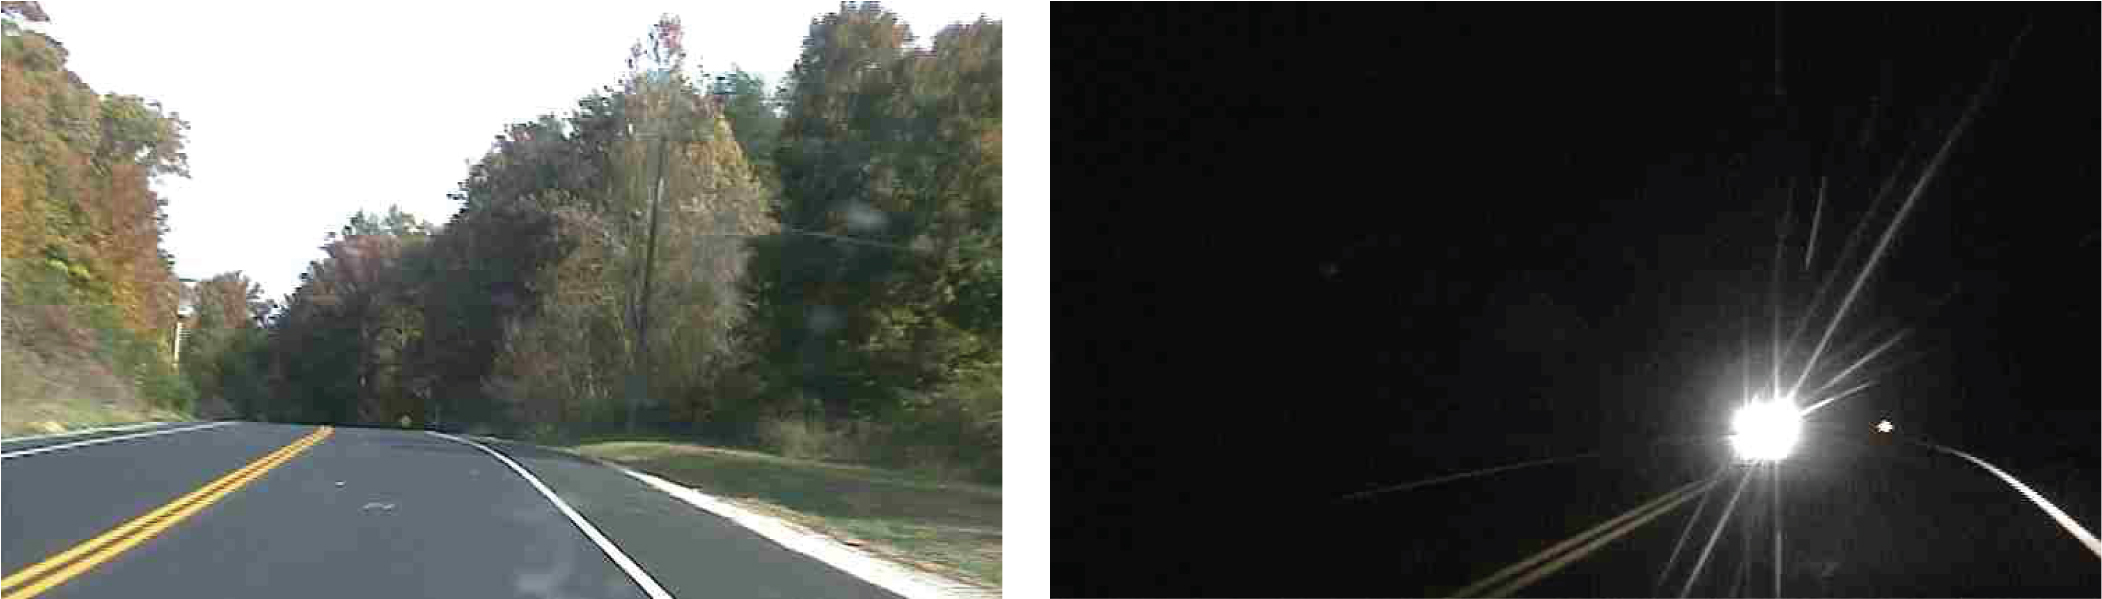
Long Description.
The sides of the road are clearly visible during the day. At night, only the headlight’s glare is visible in the same place.
Some human factors characteristics regarding roadway users are available to help implement preferred design and control solutions. The following are some of those found in the research literature:
- Drivers experience difficulty at intersections in estimating gap size and speed of approaching vehicles (Staplin, Lococo, and Byington, 1998).
- Drivers experience problems in detecting a sharper curve after negotiating several longer radius curves (Glennon, 1996).
- Additional distance and time are required to slow or stop under adverse weather conditions (Baerwald, 1965).
- Excessive messages on changeable message signs (CMSs) can inhibit correct decisions and traffic flow, and safety (Staplin et al., 1998).
- Bright light sources, whether from vehicles or roadside property, can cause glare, user-blinding, and possible loss of vehicle control (Ogden, 1996).
While the previous items and two examples are not an exhaustive list, they illustrate a few of the many user problems encountered. Highway designers and traffic engineers must be aware of such human factors characteristics and use them in a way that will improve or optimize the safety of the road system they are designing and controlling.
How Road Users Seek Information
Theeuwes and Godthelp (1992) have described self-explaining roads as road environments where users know how to behave based on the road design. Unfortunately, many roads today are not self-explaining. Self-explaining roads induce user behavior based on the design rather than “external agents” such as signs and traffic signals. When the road is not self-explaining, highway operations can be inefficient, delayed, and unsafe, and user speeds are more varied. Road users continuously seek information under many different conditions—from when the road environment has few vehicles or other users present to when many vehicles and other users are present; however, road usersʼ access to information may be more difficult under conditions such as darkness, inclement weather, and glare from sunlight. According to research findings, users categorize roads during their driving task and formulate their temporal reactions based on previously learned behavior (Theeuwes and Diks, 1995). Design standards by functional classification enhance user-learned behavior and their system expectations.
Road users seek information for navigation, guidance, and control (Alexander and Lunenfeld, 1990). Navigation information relates to getting from point A to B; guidance information relates to lane selection; and control relates to the selection of vehicle speed, level of braking, and steering. The information that road users seek varies according to the situation—sometimes complex and sometimes simple.
How road users seek information is fairly simple. They scan the road environment, seeking the most meaningful information (MMI) needed for that particular road location and point in time. How they scan the environment depends on the presence or absence of potentially hazardous situations (i.e., situations perceived to require action or change, not necessarily situations that will cause harm) as they perceive them. Road users are generally alert for both longitudinal and lateral obstacles (i.e., other vehicles, pedestrians, animals, or objects near their planned path); they develop an expectancy of the roadway based on what they previously experienced upstream. They seek the information they need by searching the road environment in front of, behind, and to the sides of the vehicle they are driving.
This searching and scanning process is continuous for the duration of the trip.
The scanning of the road environment is a time-based activity. The speed at which scanning is performed is not constant, but it is a function of the road environment (i.e., geometric design, vehicle speed, cross section elements, traffic volume, weather, vehicle mix, presence of pedestrians, driver experience, and traffic control). If the environment has no threatening activity perceived by the road user, the scanning rate may be slower, and he or she may have time for scenic pleasures. At other times, the visual scanning rate may be greater because of enhanced road environment activity. Early notable research on driving scanning was conducted by Mourant, Rockwell, and Rackoff (1969).
Road users can receive and process only a finite amount of information in a short time period, not an infinite set of information. To describe perception-reaction time (PRT), Johannson and Rumar (1971) use a scale ranging from 0 to 6 bits of unexpected and expected information that a road user can process per second. They found that the average driver processes about 1 and 1.5 bits of information per second for unexpected and expected situations, respectively. The more difficult or competing tasks a road user is confronted with, the longer he/she will take to select the response to initiate; also, not all road users perform the same (Johannson & Rumar, 1971). According to AASHTO, for unexpected situations some drivers take as long as 2.7 seconds (AASHTO, 2011a). Therefore, highway designers and traffic engineers must plan and develop the road environment temporally and in accordance with the scanning ability of the road users.
Highway designers and traffic engineers often use distance-speed criteria (i.e., stopping distance, passing distance, intersection sight distance) to specify road design elements and placement of traffic control devices, but distance criteria are always based on time and how road users use it.
Examples of User-Scanned Road Environments
The purpose of this section is to illustrate the features that road users would classify as the MMI for making their next driving decision using a photograph of an example location.
This kind of research is useful to highway designers and traffic engineers because it identifies what information road users are using and whether the individual bits of information are useful, competing, or potentially misleading for road usersʼ decision making and safety.
The following examples were prepared by showing subjects hard copies of the roadway scenes, some with approaching vehicles and some with no approaching vehicles (Tignor, 2006). The subjects were asked to identify the most important information they would consider should they confront that situation when driving. A color code was used to prioritize the information from most to least important (see the row of colored dots beneath the top photographs in Figures 3-4 and 3-5). The priority of the color code was from left to right, with bright green as the highest priority and magenta as the lowest priority. The road is in a suburban environment, and it has a speed limit of 35 mi/h.
Example 1, View 1
The first example illustrates what subjects identify as MMI when there is a lot of activity in the road environment. As shown in Figure 3-4, when no vehicles are moving toward the road users (middle photograph), many items are identified as possible sources of meaningful information even though the road environment has many parked vehicles, three intersections, and a distant curve.
The presence of approaching vehicles (bottom photograph) changes what road users consider as important information. Approaching vehicles clearly induce the road users to concentrate their attention on them as sources of MMI. The items having the highest frequency of visual sources of meaningful information are approaching vehicles, the nearest intersections, and a distant curve.
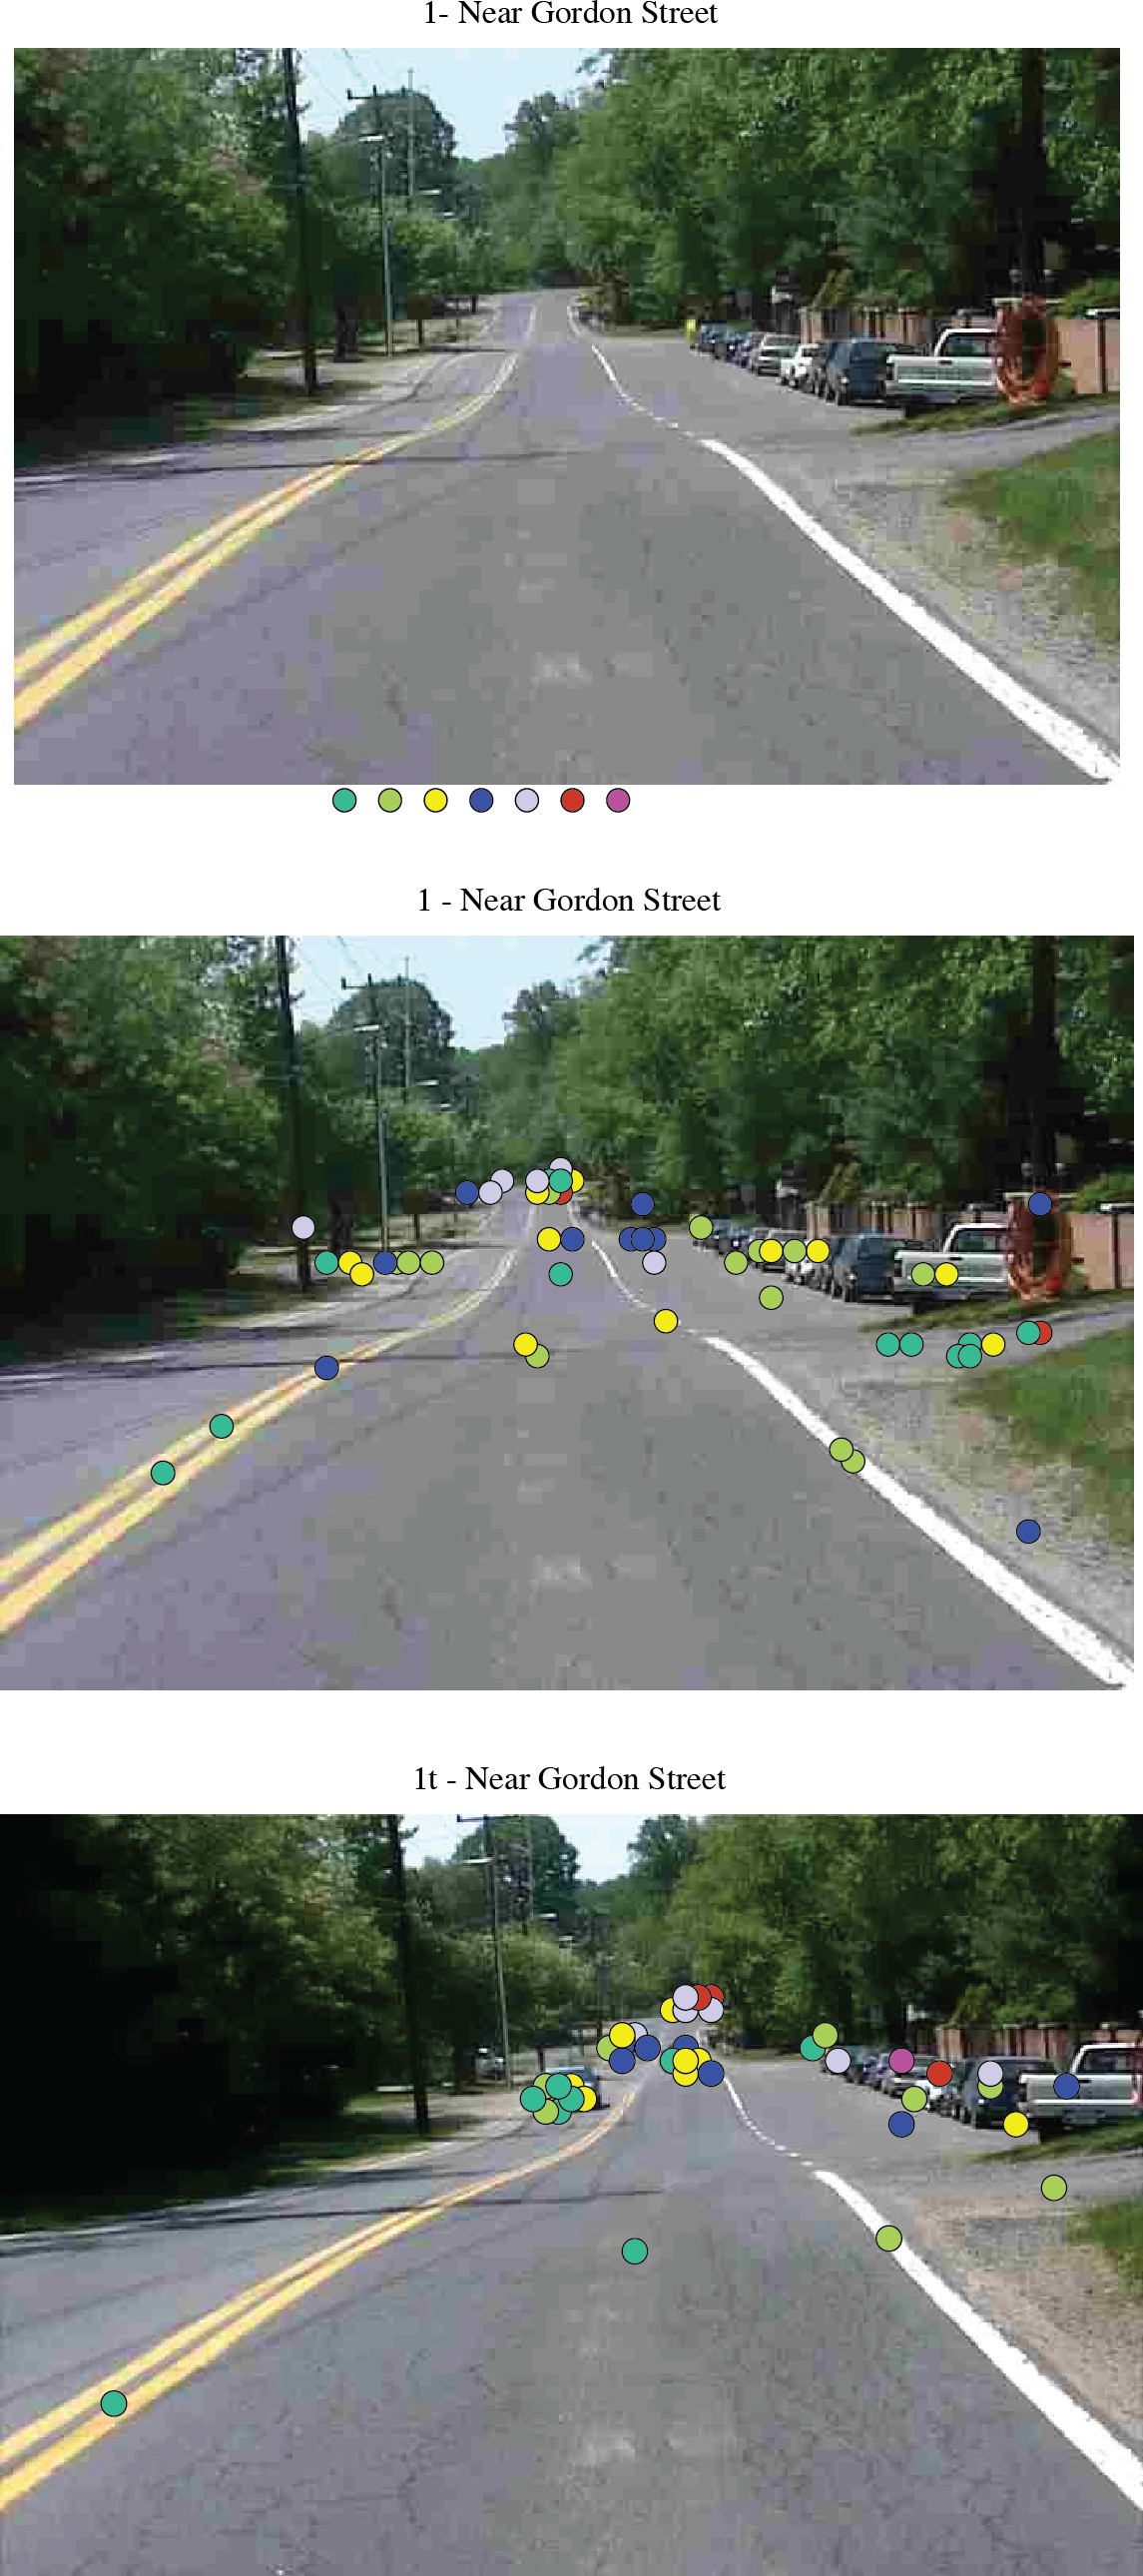
Source: Tignor (2006)
Long Description.
Colored dots are below the first photo that shows the empty road. In the second photo, the colored dots are scattered across the road and near the parked vehicles. In the third photo, the colored dots are clustered at the far end of the road around an approaching car, and a few dots are near the parked vehicles.
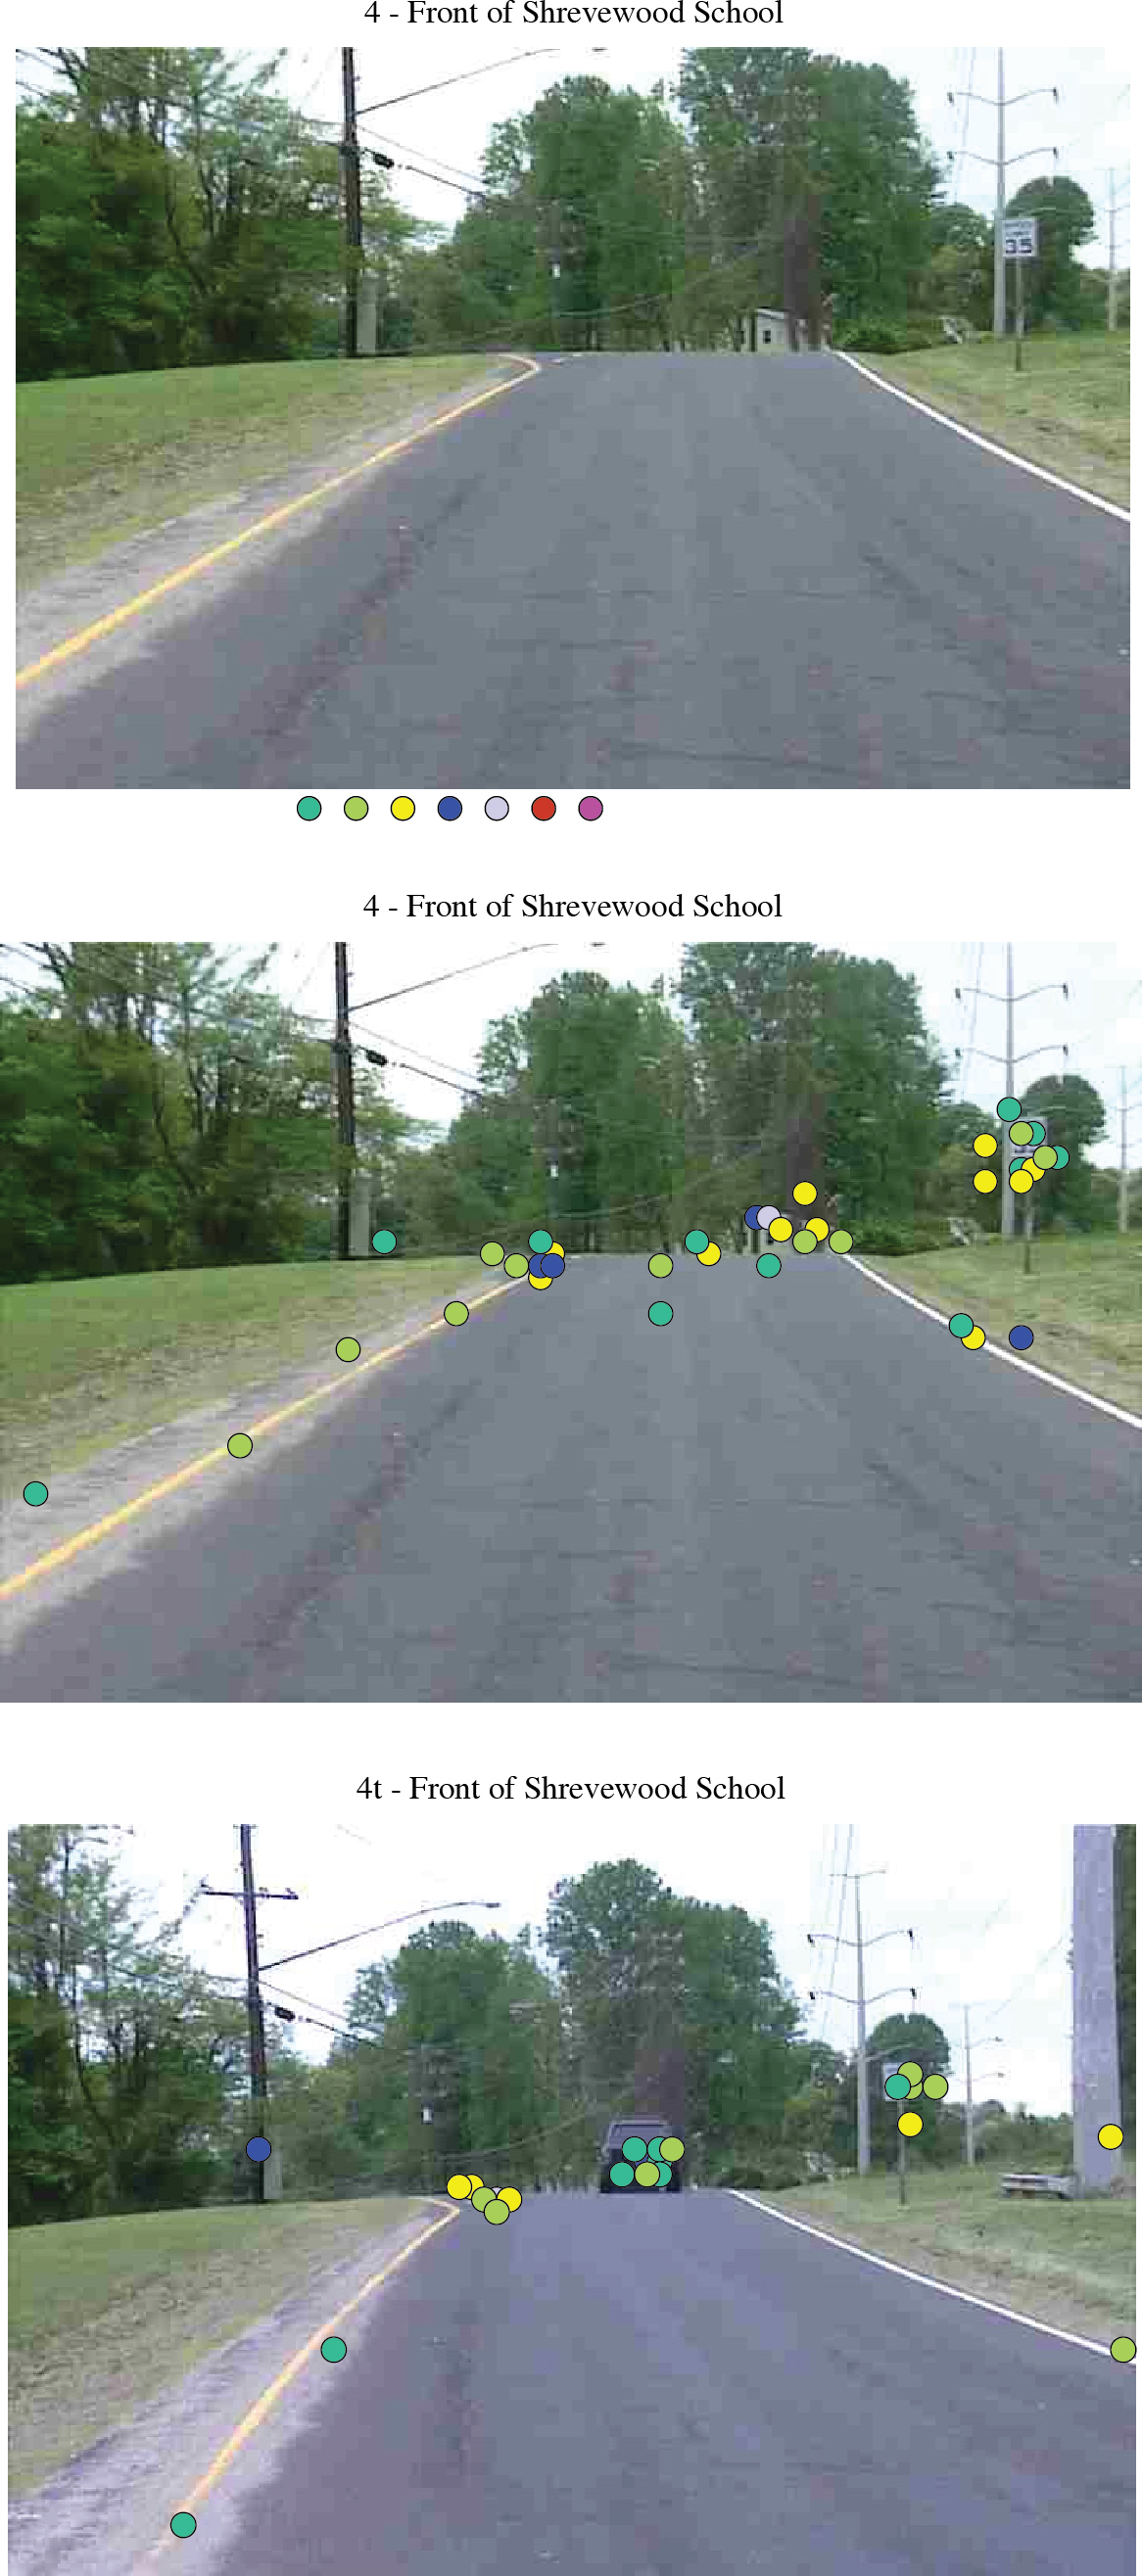
Source: Tignor (2006)
Long Description.
The road has a crest at the far end. Colored dots are at the bottom of the first photo. In the second photo, colored dots are along the sides of the road, at the far end, where the crest begins, and on a sign beside the road. In the third photo, dots are clustered near the intersection, on an approaching vehicle, and on a sign beside the road.
Example 2, View 4
The second example illustrates how road users are adversely affected when roadway design and traffic control features are not appropriately coordinated. Figure 3-5 shows drivers approaching a very short vertical curve (top photograph) that has the potential to hide downstream vehicles just beyond the crest of the curve. Just upstream of the crest is a speed limit sign.
The colored circles in the figure (middle and bottom photographs) show that many of the subjects look to the speed limit sign as the first or second most meaningful source of information as opposed to the crest beyond, which could hide a vehicle or other hazard in the roadway. They look at the speed limit sign and not whether a vehicle is or is not ahead of them. The short vertical curve is a roadway hazard, but the speed limit sign creates an additional hazard. If the road design and traffic engineering had been coordinated, more time would have been available for the road user to seek the MMI for assessing a potential conflict at the crest. From a safety perspective, the speed limit sign should be relocated.
Observations from the Examples
The previous two examples show some interesting results:
- The selection process is different depending upon the presence or absence of other vehicles. When the roadway has no other vehicles in the forward view, the subjectsʼ search is longitudinally and laterally broad and downstream from their current road location. They are primarily seeking information for guiding and controlling the vehicle.
- When other vehicles are within their forward view, whether approaching or traveling in the same direction, the subjectsʼ search is more selective. They tend to focus first on other vehicles in the road environment and second on information for guidance and control.
- The examples illustrate how important it is for the road design and traffic control components to be coordinated to prevent competition for road user attention, which compromises user safety.
How Highway Designers and Traffic Engineers Work Together for Road Users
Serve as Virtual Road Users
Highway designers and traffic engineers must serve as virtual road users. They must view the route in small, incremental steps as if they were road users traveling downstream and gathering information in small time and space increments; they must learn from road usersʼ experiences. Identifying what road users consider important is not easy.
Ninety percent of driversʼ tasks are obtaining visual information from the roadway to maneuver their vehicle safely (Hartman, 1970). This visual information should not be confusing, and it must be complete and accurate if safe decisions are to be made. Road safety audits and a procedure used by McGee called SLIDE (Simplified Location of Information Deficiencies) depend on professional staff to identify safety problems associated with on-road design and traffic control applications and omissions (Morgan, 1999; McGee, Hughes, & Hostetter, 1986). The MMI procedure obtains information directly from road users about what in the road environment they consider important to their driving decisions. User input is important because 27% of road crashes are attributed to a joint association of road user and roadway environmental problems (Schlegel, 1993).
Devices that measure eye fixation points and glance behaviors, in both real and simulated conditions, have also been used for obtaining information on what drivers view in the visual field. Although vast and time-consuming to decipher, eye movement data are interesting.
The literature reports on search patterns of novice and experienced drivers (Mourant & Rockwell, 1972), the degrees of longitudinal and lateral eye fixation zones (Shinar, McDowell, & Rockwell, 1977), design of controls on vehicle instrument panels (Dingus, Antin, Hulse, & Wierwille, 1989), and signing (Smiley et al., 2005). For example, Mourant and Rockwell (1972) estimated that 70% of driver eye pursuits were for lateral position. Shinar et al. (1977) found lateral eye movements increase during curve negotiation on two-lane roads and they begin 2 to 3 s before entering a curve. On right turns, drivers spend 55% of the time looking at the road and only 5% looking to the left. Similarly, on left turns, drivers spend 38% of the time looking at the road and 24% of the time looking to the right. Recarte and Nunes (2000) found mean horizontal visual fixation to be ± 0.5° from center with a ± 2° standard deviation and mean vertical visual fixation to be 1° below the horizon with a ± 1° standard deviation. Harbluk, Noy, and Eizenman (2002) reported that 80% of all driver fixations are within the central 15° of the visual field. Gordon (1966) reported that 98% of driver fixations fell on or near the road edge or centerline. He also reported drivers look about 6.5 ft from the right edge of the road when following a left curve and about 9 ft from the right edge of the road when turning right. While these findings are interesting, the research analysts must infer or guess what items are really important to road usersʼ driving decisions. Consequently, the results from eye movement research have not generally been incorporated into design standards and guidelines.
Yet, highway designers and traffic engineers must identify jointly the important design and traffic control elements that are critical to road user decision making. They must identify potentially conflicting and misleading information whether it be geometric, traffic control, or the combination of both. The roadway environment created must provide continuous, clear information that the road user can interpret quickly, accurately, and safely.
Incorporate Substantive Safety and Self-Explaining Designs
A substantively safe road system must be created (Hauer, 1999) and will be consistent with the roadways envisioned by the Safe System Approach (SSA). When such a road system is properly created, potential errors will be prevented by the elimination of the following:
- The unintended use of infrastructure
- Non-uniformity and inconsistency of design and traffic control applications
- Encounters with large differences in speed
- Uncertain driver behavior
Self-explaining designs create road categories that are recognizable by users and are appropriate for the following:
- Flow requirements (i.e., small to large volumes)
- Speed functions (i.e., slow to high speed)
- Access functions (i.e., local roads, collectors, arterials)
Lastly, self-explaining roads have the following characteristics:
- Road environments where road users know how to behave simply by the design
- Road types in keeping with road user expectations based on visual information obtained and object conspicuity
- A driving environment that is intuitive and transparent (Theeuwes and Godthelp, 1992)
A more recent version of Hauerʼs vision from 1999 is the Safe System Approach (SSA). As summarized in Chapter 2, SSA seeks to create a road environment that maximizes safety performance by not accepting that death and serious injury are a natural consequence of using a road system (see also Finkel et al., 2020; Signor et al., 2018; Welle et al., 2018). But rather than relying primarily on improving human behavior, this approach seeks to plan, design, and operate a
road system that recognizes humans make mistakes, have limited physiological abilities to safely negotiate complex situations, and have a limited tolerance of kinetic energy forces.
Jointly Develop Road Systems
To achieve an acceptable level of system safety, highway designers and traffic engineers need to serve as virtual road users. They must place themselves in the shoes of the road user and consider what the road user will identify as most important both during day and night conditions. To identify the MMI, the highway designer and traffic engineer will together need to apply principles similar to those found in road safety audits (Morgan, 1999):
- Highway designers and traffic engineers must jointly develop and agree on the goals for the road system that will meet the objectives of the road agency but have the safety of users in the forefront.
- Highway designers and traffic engineers must jointly develop, review, and approve the design and operational plans for each project. The designs will be self-explaining to the road users and provide substantive safety for them.
- Whether projects are new construction, upgrades, or maintenance, highway designers and traffic engineers must jointly oversee the field work and make inspections as virtual road users before the start of new operations. If misleading individual or combined design and control features are found, they should be eliminated before the road is opened to traffic.


